center for urban and regional affairs reporter · consumption at the fair, and demon-strates how...
TRANSCRIPT
In This Issue:� The Reversal of Production and Consumption at the Minnesota State Fair . . . . . .1� Spatial Data Mining: An Emerging Tool for Policy Makers . . . . . . . . . . .10� Project Awards . . . . . . . . . . . . . . . . . . . . . . . . . . . . . . . . . . . . . . . . . .15� Is the Twin Cities “Permanent Rural” Area Truly Permanent?:
A Case Study on the Rural-Urban Edge . . . . . . . . . . . . . . . . . . . . . . . . . . . . . 16� John Adams Appointed to Fesler-Lampert Chair in Urban and Regional Affairs . . . 26
One of the most importantchanges in Western societyduring the last millennium isthe shift from a culture
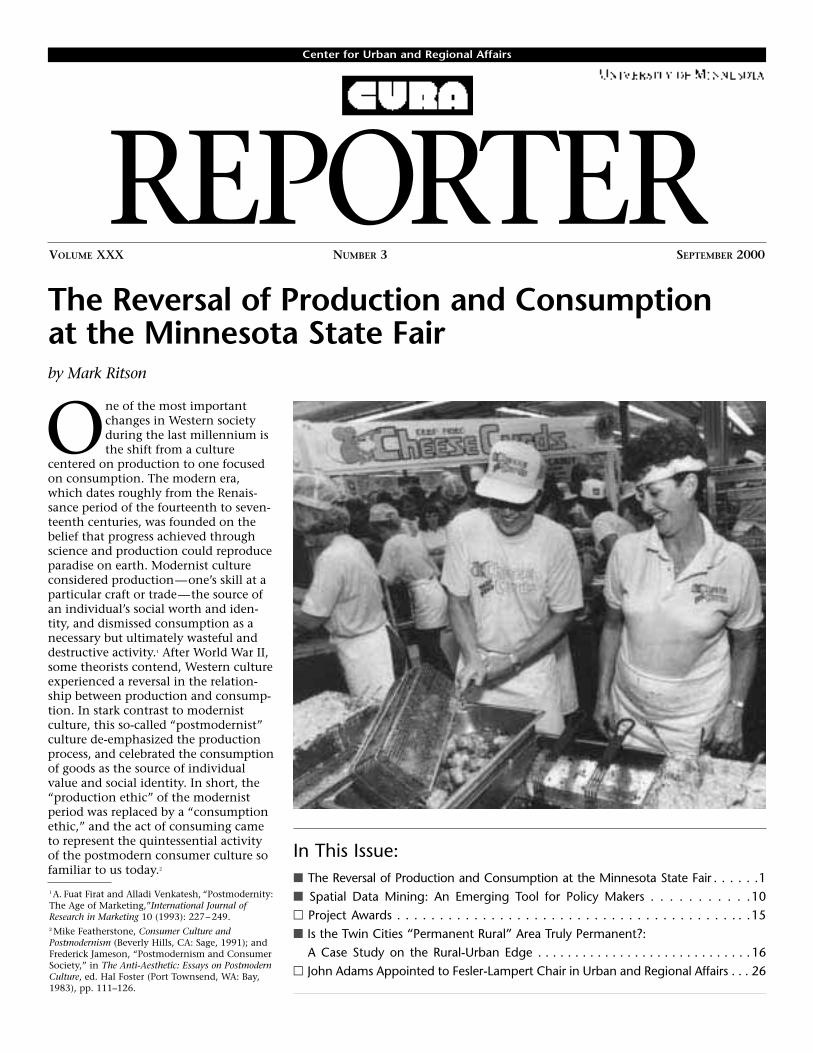
centered on production to one focusedon consumption. The modern era,which dates roughly from the Renais-sance period of the fourteenth to seven-teenth centuries, was founded on thebelief that progress achieved throughscience and production could reproduceparadise on earth. Modernist cultureconsidered production—one’s skill at aparticular craft or trade—the source ofan individual’s social worth and iden-tity, and dismissed consumption as anecessary but ultimately wasteful anddestructive activity.1 After World War II,some theorists contend, Western cultureexperienced a reversal in the relation-ship between production and consump-tion. In stark contrast to modernistculture, this so-called “postmodernist”culture de-emphasized the productionprocess, and celebrated the consumptionof goods as the source of individualvalue and social identity. In short, the“production ethic” of the modernistperiod was replaced by a “consumptionethic,” and the act of consuming cameto represent the quintessential activityof the postmodern consumer culture sofamiliar to us today.2
The Reversal of Production and Consumptionat the Minnesota State Fairby Mark Ritson
REPORTERCenter for Urban and Regional Affairs
VOLUME XXX NUMBER 3 SEPTEMBER 2000
1A. Fuat Firat and Alladi Venkatesh, “Postmodernity:The Age of Marketing,”International Journal ofResearch in Marketing 10 (1993): 227– 249.2 Mike Featherstone, Consumer Culture andPostmodernism (Beverly Hills, CA: Sage, 1991); andFrederick Jameson, “Postmodernism and ConsumerSociety,” in The Anti-Aesthetic: Essays on PostmodernCulture, ed. Hal Foster (Port Townsend, WA: Bay,1983), pp. 111–126.

2 CURA REPORTER
Despite the general acceptance thatsuch a cultural reversal has occurred, noempirical evidence has been found tosupport this theory, or to demonstratehow, when, and why the reversal tookplace. This article attempts to providesuch evidence. Using a grant fromCURA, and aided by the MinnesotaHistorical Society and the MinnesotaState Agricultural Society (MSAS), I usedthe Minnesota State Fair as a historicalcase study to investigate the relationshipbetween production and consumptionduring the modernist and postmodernistperiods. The results of my analysis arepresented here.
Methods of AnalysisFor this study, I collected and analyzedthree kinds of historical data about theMinnesota State Fair. First, I analyzedpremium list data for the period1883–1995 as a measure of long-termchanges in production. Premiums arethe cash purses that are awarded toexhibitors who present prize-winningdisplays of their production skills.Historically, these premiums were advertised in advance of the fair in order to attract farmers to the event andencourage them to exhibit their products.Once inflation is controlled for, the totaldollar amount of premiums offered eachyear provides a longitudinal index ofthe emphasis on production-relatedactivities at the fair.
In order to trace parallel changes inconsumption, I also analyzed concessiondata from the fair for the period1883–1995. Concession stands are the commercial stalls and food tentsallocated to local vendors for the sale of goods and services. From the fair’soutset, side-show and refreshmentvendors had to bid for the use of aconcession stand in order to ply theirtrade. My analysis incorporated data forall such stands that engaged in the saleof any consumable goods or services.Analysis of these concession data foreach year provides a longitudinal indexof the rate of consumption at the fair.
The third type of data analyzedconsisted of spoken or written discourseabout the fair. These qualitative datawere collected from a variety of sources.A primary source was the annual reports
of the Minnesota State AgriculturalSociety (the organizers of the fair),which contained the minutes of eachmeeting, debates and addresses byinvited speakers from the community,and the annual speeches of the MSASpresident and secretary responsible fororganizing each fair. In addition, allavailable popular press accounts aboutfair activity—from the original territorialfairs of the 1850s to the 1997 MinnesotaState Fair—were analyzed. Theseaccounts were drawn from localMinneapolis and St. Paul newspapers, as well as national publications such asHarper’s and The Farmer. Photographsfrom the state archives were anothersource of data, as were popular cultureartifacts such as novellas, films, musicals,and cartoons. In all, over 14,000 pagesof data were read and analyzed, with thegoal of chronicling in human terms therelationship between production andconsumption at the Minnesota State Fair.
Quantitative Measures of Productionand Consumption at the State FairFigure 1 compares premium and concessions data for the Minnesota State Fair from 1883 to 1995, adjustedfor inflation. This graph represents therespective roles of production andconsumption at the fair, and demon-strates how the relationship betweenthese two cultural activities changedthroughout the fair’s history.
From this data, it is possible to iden-tify three distinct historical periods thatcharacterized the state fair. During theproduction era, from 1883 to 1932,premium awards dominated concessionsincome. Aside from two short periodsaround 1910 and then again duringWorld War I, significantly more revenuewas used to reward production exhibitsthan was received for concession stands.From 1933 to 1946, a transition periodoccurred in which the dollar amount ofpremium awards and concessionsincome was relatively equal. Finally,during the consumption era, from 1947to the present, concessions incomeincreased steadily while premiumawards initially remained constant andthen began to diminish in real terms. In short, the quantitative data fromthese three periods seem to confirm theexistence of a production-consumptionreversal, which many theorists arguemarks the emergence of a consumerculture in the West.
Qualitative Measures of Production andConsumption at the State FairAlthough the data cited above clearlyshow that the (modernist) production-oriented fairs of the early twentiethcentury gave way to the (postmodernist)consumption-oriented fairs of today,they do not tell the entire story. Quanti-tative data show us only what changeshappened at the fair and when they
Cover photo: Since the end of WorldWar II, the symbols of agricultural production at the Minnesota State Fairhave been replaced by new consumption-oriented traditions such as deep-friedcheese curds and pronto-pups.
$500
$1,000
$1,500
$2,000
$2,500
$3,000
$3,500
Th
ou
san
ds
of
Do
lla
rs (
1995
Va
lue)
The Era of Production1859-1932*
TheTransition
Period1933-1946
The Era of Consumption1947-Present
$01883 1890 1900 1910 1920 1930 1940 1950 1960 1970 1980 1990
Year
Concession Data(Consumption Index)
Premium List Data(Production Index)
Figure 1. Premium List and Concession Data for the Minnesota State Fair, 1883–1995* Data for the years 1859–1882 were unavailable

SEPTEMBER 2000 3
happened; they do not give us a sense of why this production-consumptionreversal occurred or, equally important,how this reversal came about and wasactually experienced by everydayMinnesotans attending the state fair. Inthe following sections, I attempt to lookbeyond the statistics in order to under-stand the nature of the production-consumption transition identifiedabove. Specifically, what did the fairmean to the people who organized andattended the event, and how did thesemeanings change over time? Like thequantitative data cited above, qualitativedata show that the Minnesota State Fairhas been characterized by three distincthistorical periods: an era in which theculture of the fair was dominated byproduction, an era characterized bytransition from a production-orientationto a consumption-orientation, andfinally an era in which the culture of thefair was dominated by consumption.Each of these periods is now describedin turn.
The Era of Production (1859–1932).Although the territorial fairs thatpreceded Minnesota’s statehood in 1858are often regarded as precursors to thestate fair, most historians date the firstannual Minnesota State Fair to the eventheld in Minneapolis in October 1859.The fair lasted three days, and was
attended by up to 3,000 people eachday. The premiums awarded that yearfor best exhibits of production rangedfrom a $4 purse for the best bull to $2for the finest display of wheat. Over thenext 20 years, the event grew rapidlyand made an important contribution tothe growth of the state, the culture ofMinnesota, and the production ethos ofthe period. These contributions wererecognized in 1885 by an act of the statelegislature that defined the MinnesotaState Fair as:
the annual exhibition of the agricul-tural, stock breeding, horticultural,mining, mechanical, industrial andother products and resources of theState of Minnesota, including properexhibition of arts, science, and allother public displays pertinent to orattendant upon exhibitions andexpositions of human art, industryand skill.
As this definition suggests, theemphasis of the fair was squarely onproduction. In 1870, just under half ofMinnesota workers were employed inagriculture, and the fair’s exhibition oflocal products, machinery, and produc-tion methods made it the most impor-tant annual event in the state. The fair’semphasis on production was consistentwith the American pioneer culture of the
mid-nineteenth century, which definedindividuals by their ability to build ahome, raise crops and livestock, and beproductive in their new environment.Immigrants newly arrived to the Midwestconfronted a world of material demandsin which nothing awaited them exceptthe land and its productive promise.Ralph Waldo Emerson observed thatunder such circumstances, individualscoined themselves with their labor, andthe products of their labor representedthe only visible sign of their power.
Reflecting this emphasis on produc-tion, the earliest state fairs served as aplace for the practical study and discus-sion of production-related concernscharacteristic of the pioneer lifestyle.Farmers could discuss livestock, observenew machines in action, and improvetheir productive techniques. Agriculturalproduction itself was an index ofprogress. Initially this index simplyconfirmed that production was possiblein the new territory. In describing thestate’s contribution to the World’s Fairin 1853, for example, The St. AnthonyExpress proclaimed that the exhibitrepresented “tangible proof” that grains“could grow and ripen to the highestperfection in Minnesota.” Over time,production came to represent triumphover the hardships of immigration andsettlement. In 1860, the fair was held atFt. Snelling, which had originally servedas an important frontier base during thesettlement of Minnesota. Those whoattended the fair at Ft. Snelling keenlysensed the emergence of a productionethos that superseded the conflictinherent in the pioneer culture of theearly settlers. In the book History of theMinnesota State Agricultural Society,written in 1910, local historians DarwinHall and R.I. Holcombe were able torecall the tangible sense of progress thatpervaded the 1860 fair.
The old fort never looked so attrac-tive and the plains beyond and thelovely valley of the Minnesota neverbefore so charming. No grim-visagedsoldiers, no muskets and bayonets,no deep-mouthed cannon were to beseen on the parade grounds, but thegrass was covered with peaceful anduseful plows, harrows, and otherfarm machinery. There were cabbageheads and squashes in lieu ofcannon balls and bombshells, whilein the former barracks rare speci-mens of domestic manufacture,millinery, and other pretty thingshad taken the place of military
In the nineteenth century, agricultural exhibits at the fair served as a tangibleindex of progress. The annual display of agricultural products demonstrated boththe fertility of the soil and the productivity of the people of the state.

4 CURA REPORTER
accouterments. No stern sentinelspaced the ramparts, and the gatewaywas guarded only by Ike Conway,who charged but a quarter to let avisitor see the advent of whatpromised to be Minnesota’s agricul-tural millennium.
As tangible evidence of Minnesota’sagricultural millennium began toemerge, the fair and the increasinglyimpressive exhibits on display served asan index of production that demon-strated to fairgoers the magnitude of theMidwest’s remarkable evolution. As theMinneapolis Times of September 15,1890, reported:
Strolling through the crowdeddepartments in Agriculture Hall andover the well-filled grounds, andseeing how the farmer hadconscripted the laws of elements of the earth into his service, how our domestic animals have beentransformed under his breeding andcare until we scarcely recognize theoriginal type in the new creation,how the coarse and common fruitshave been metamorphosed into thegrape, and apple, and plum, andberry, and melon, that take thepalate captive with their deliciousflavors, how our bleak westernprairies have been made to bloomwith products once thought peculiaronly to more general latitudes, howevery line of industry and everydepartment of nature vie with eachother in the production of rich andbeautiful and helpful results, italmost seemed that the old condi-tion of things had been repealed andwe were living under a new order.
To the growing population ofMinnesota, the fair also served as anannual celebration of the riches of thestate. The display of goods produced byMinnesotans demonstrated the fertilityof the soil and the productivity of thepeople of the state. It was hoped thatsuch displays would persuade immi-grants passing through to settle inMinnesota, rather than continue west.They were also an opportunity for resi-dents to develop a sense of statehoodand share in communal celebration ofthe fact that the gamble of immigrationhad paid off. As an 1890 promotionalbrochure for state immigration observed,Minnesota was filled with people whohad “brought nothing with them to thisnew country except stout hands, adisposition to industry and faith in their
own future.” The state fair was an idealopportunity to present concrete affirma-tions of that pioneer faith.
By the end of the nineteenth century,remarkable strides were being made inmanufacturing, farming, and mining,and the United States was reveling in anever-ending era of expansion thatappeared to have no limit. In the finaldecade of the nineteenth century alone,the area of land farmed in Minnesotadoubled, and agricultural productivityincreased by more than 50%. The rangeof agricultural products also increased asdifferent regions of the state began tospecialize in particular products. Withthe possibilities of production confirmed,fairgoers no longer needed tangibleconfirmation of Minnesota’s evolutionfrom a “wilderness.” Instead, the fairbecame a celebration and an index ofthe amount and diversity of productiontaking place in Minnesota. The MSASsecretary’s report for 1895 exclaimed:
The Buildings were filled and manyacres of outdoor area covered, spacebeing at a premium everywhere. Themain exposition building was socrowded that the old dining hall andtwo large tents were needed andutilized to accommodate the over-flow. The horticultural and floricul-tural displays, in quantity, variety,and arrangement, have never beenequaled at any previous fair. Theagricultural display was great beyonddescription. The present year hasbeen remarkably productive in all
branches of agriculture, and thisexhibit fittingly represented theimmense results of this season ofunparalleled productiveness.
Aside from its role as an index ofproduction, the fair had an importantcultural impact by orienting fairgoerstoward the goal of increased productionlevels. The emphasis throughout theproduction era was on progress andconstant improvement, and the fairstood as an annual reminder thatfarmers had to match the potential ofthe land with their productive capabili-ties. The Minneapolis Tribune ofSeptember 9, 1890 noted:
Minnesota has already a nationalreputation as a dairy and grazingstate. To maintain this position andrise to that supremacy which naturalconditions seem to indicate as easilypossible, the breeding of fine stockand the production of high grades ofbutter and cheese must be fosteredand encouraged. . . . It is to awakenand stimulate in the farmingcommunity a desire for better thingsthat the fair was established.
Similarly, the president of the MSASproclaimed that the goal of the 1909state fair was to ensure that “eachfarmer is stimulated to learn how toproduce twice as much to the acre as henow produces, and at less cost.”
Given the focus on production, thequintessential activity at every fairbecame the award of premiums, with
SEPTEMBER 2000 5
the ultimate premium—the blueribbon—reserved for the finest exampleof a particular product. Prize winnerswere then exhibited as “living exem-plars” of production perfection thatevery farmer should emulate, andfarmers were offered education in thenew “scientific” methods of productionthat would allow them to achieve suchperfection and increase their yields.Classes held in tents throughout thefairgrounds taught them how to recog-nize better-quality crops and livestock,and generally improve their farmingtechniques. Farmers were also encour-aged to use the new, more technologi-cally advanced farm machineryexhibited on the fair’s Machinery Hill.By 1909, the President of the MSASconcluded that one of the major advan-tages of the fair was that it enabled localfarmers to “understand the benefitswhich science has conferred on agricul-ture.” Science, method, and educationbecame the new watchwords at the fair.
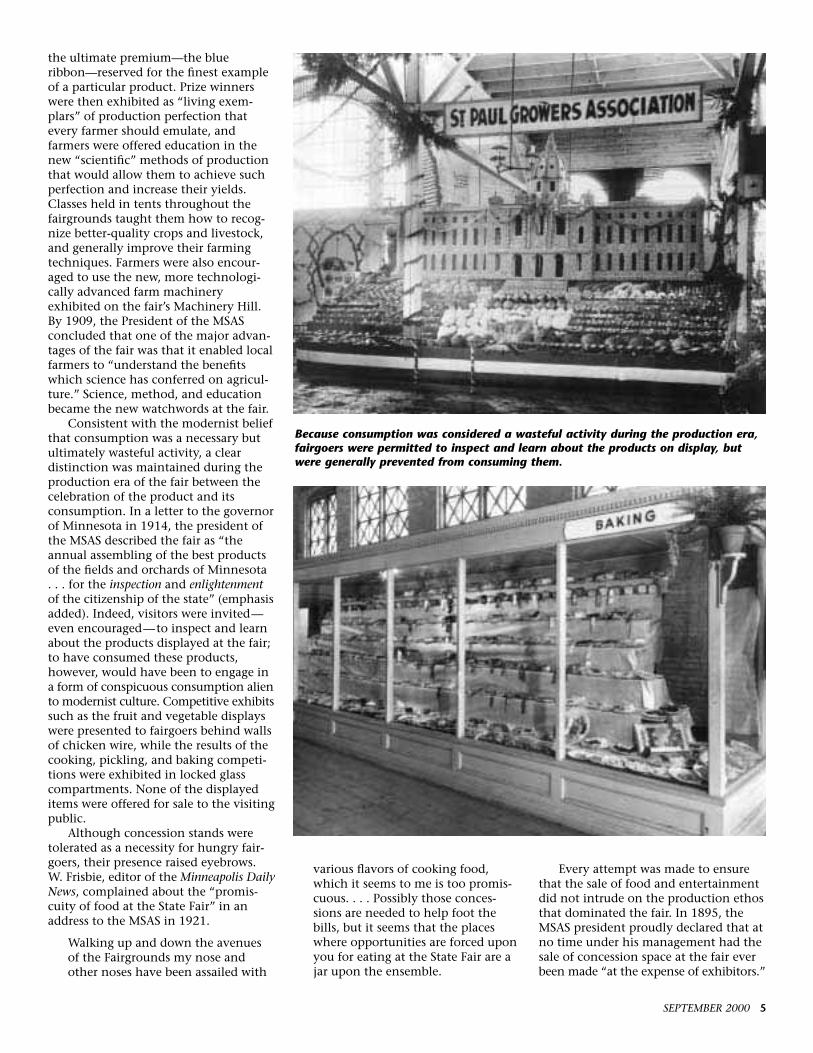
Consistent with the modernist beliefthat consumption was a necessary butultimately wasteful activity, a cleardistinction was maintained during theproduction era of the fair between thecelebration of the product and itsconsumption. In a letter to the governorof Minnesota in 1914, the president ofthe MSAS described the fair as “theannual assembling of the best productsof the fields and orchards of Minnesota. . . for the inspection and enlightenmentof the citizenship of the state” (emphasisadded). Indeed, visitors were invited—even encouraged—to inspect and learnabout the products displayed at the fair;to have consumed these products,however, would have been to engage ina form of conspicuous consumption aliento modernist culture. Competitive exhibitssuch as the fruit and vegetable displayswere presented to fairgoers behind wallsof chicken wire, while the results of thecooking, pickling, and baking competi-tions were exhibited in locked glasscompartments. None of the displayeditems were offered for sale to the visitingpublic.
Although concession stands weretolerated as a necessity for hungry fair-goers, their presence raised eyebrows.W. Frisbie, editor of the Minneapolis DailyNews, complained about the “promis-cuity of food at the State Fair” in anaddress to the MSAS in 1921.
Walking up and down the avenuesof the Fairgrounds my nose andother noses have been assailed with
various flavors of cooking food,which it seems to me is too promis-cuous. . . . Possibly those conces-sions are needed to help foot thebills, but it seems that the placeswhere opportunities are forced uponyou for eating at the State Fair are ajar upon the ensemble.
Every attempt was made to ensurethat the sale of food and entertainmentdid not intrude on the production ethosthat dominated the fair. In 1895, theMSAS president proudly declared that atno time under his management had thesale of concession space at the fair everbeen made “at the expense of exhibitors.”
Because consumption was considered a wasteful activity during the production era,fairgoers were permitted to inspect and learn about the products on display, butwere generally prevented from consuming them.
6 CURA REPORTER
In 1907, the MSAS secretary admitted toa lapse in management that yearbecause the aisles of the main exhibitbuilding had not been “cleared of thecandy counters and souvenir boothswhich now clutter them up and obstructpassage of the crowds and convenientinspection of the exhibits.” Efforts weremade to separate areas of the fairdevoted to production and consump-tion. In 1904, all the amusement stallswere confined to a separate enclosurecalled The Pike where, according to theMSAS secretary, “their noise and clamorcould not distract the attention of thosewho were interested only in the moresubstantial features of the fair.” In 1909,odors emanating from the food conces-sions resulted in their being relocated toa part of the fairgrounds that becameknown as Hamburger Row. MSAS evencreated a new position—the superinten-dent of concessions—to police conces-sionaires and restrict sales activity onthe part of exhibitors. In 1909, thesuperintendent reported that he wouldlike to eliminate the “show business” ofsome exhibitors; under his supervision,“Exhibitors would be permitted to showtheir wares in a quiet manner but theremust be no hawking of goods.”
The Transition Period (1933–1946).During the transition period of theMinnesota State Fair, which coincidedroughly with the Great Depression andWorld War II, the distinction betweenproduction and consumption began toerode, and both came to be seen asimportant attractions for the fair-goingpublic. As the head of the Farm CreditAdministration noted in a 1936 speechto the MSAS, “the average person’sconception of a Fair is a place where onefinds a combination of animals andplants and flowers and exhibits of this sort and hot dog stands, horse races, andwhat not—a kind of polyglot.” Butmany senior members of the MSASactively resisted the dual emphasis onproduction and consumption thatemerged during this period. A stirringspeech by the MSAS president in 1940,for example, concluded with a question:“As boys we went to the county fairsfrom county to county to see what thefarmers were doing to develop betterlivestock and agricultural products. Dowe now have to change our fairs so as tobe more of an amusement and carnivalspirit for the public in order to receiverevenues?” Despite their attempts, theMSAS proved unable to preserve theproduction-oriented state fair of theprevious era; the social, economic, and
cultural changes taking place in Amer-ican society during this period simplyproved too powerful. Four such changesmade an important contribution to thetransition from production to consump-tion at the Minnesota State Fair:commercial expansion, market orienta-tion, urban rationalization, and thelegitimation of recreation.
Initially this building contained only aragtag assortment of local blanketmakers, trinket importers, and phono-graph companies. After the GreatDepression, the number of commercialexhibitors and the income they gener-ated at the fair increased dramatically.Between 1936 and 1941, the stallincome received from commercialexhibitors more than tripled. The natureof these exhibitors also began to change.By 1941, many of the 250 commercialexhibitors at the fair were large nationalmanufacturers selling household appliances such as vacuum cleaners andsewing machines. As the relative sizeand importance of the manufacturersand retailers who sponsored thesecommercial exhibits grew, so did theirinfluence with the MSAS, and thisbecame an important factor in legit-imizing the role and the activities of theconsumer at the fair. The president ofthe International Association of Fairsand Expositions noted in a 1937 addressto the MSAS:
[The Fair] provides a place for themanufacturer of goods to place anew article before the public andintroduce it to thousands andhundreds of thousands who can seeit. . . . The fair offers the commercialman or manufacturer an opportu-nity to show his goods in competi-tion with others, not in competitionfor prizes as the farmer does, but incompetition for the favor of thepublic which is even more importantthan premiums.
Economic interests created otherimportant changes as well. The produc-tion orientation of the fairs of theprevious period contrasted sharply withthe market orientation that began toemerge during the transition period.Increasing agricultural productionlevels, improving production methods,and attaining idealistic levels of productquality, with no reference to consumerdemand or desires, were the hallmarksof the modernist production ethos. The1920s and 1930s, however, were a timeof great upheaval in the farmingeconomies of the Midwest. As theyrecovered from World War I, Europeancountries became less reliant during the1920s on agricultural products fromabroad. As a result, agriculturalcommodity prices in the United Statesdecreased by over 30% in less than fiveyears. The Great Depression of 1929dealt another blow to U.S. farmers asdomestic demand for farm goods also
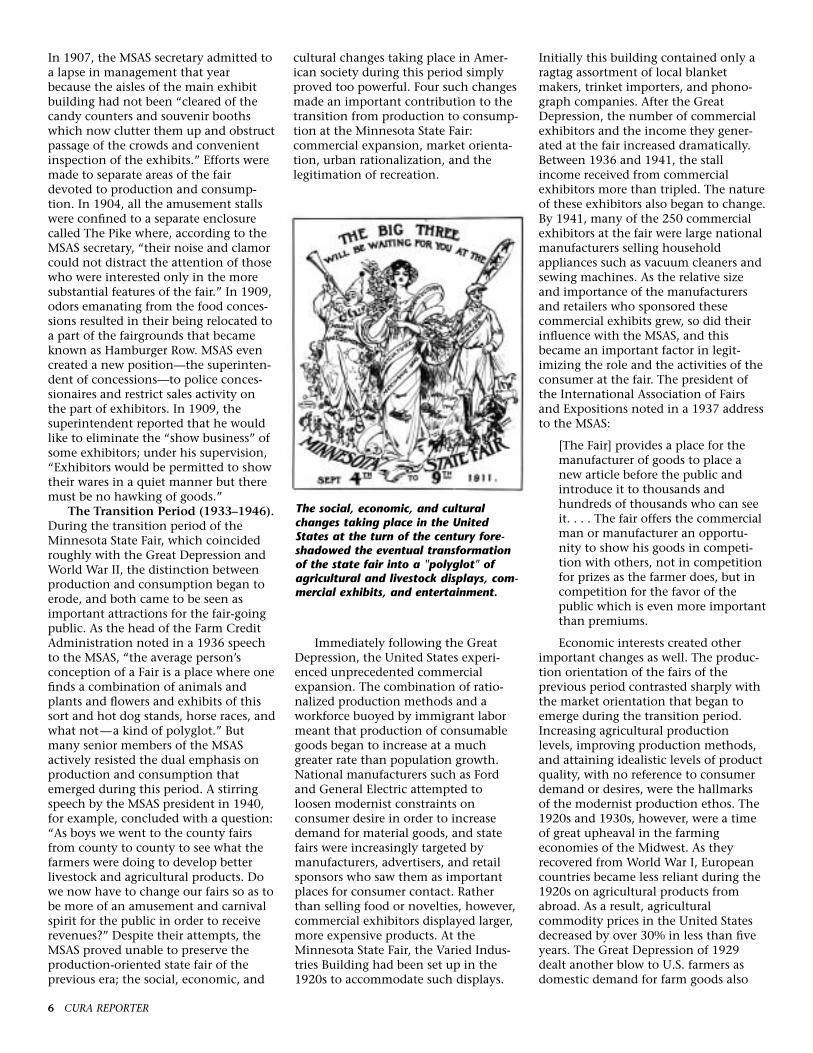
The social, economic, and culturalchanges taking place in the UnitedStates at the turn of the century fore-shadowed the eventual transformationof the state fair into a "polyglot" ofagricultural and livestock displays, com-mercial exhibits, and entertainment.
Immediately following the GreatDepression, the United States experi-enced unprecedented commercialexpansion. The combination of ratio-nalized production methods and aworkforce buoyed by immigrant labormeant that production of consumablegoods began to increase at a muchgreater rate than population growth.National manufacturers such as Fordand General Electric attempted toloosen modernist constraints onconsumer desire in order to increasedemand for material goods, and statefairs were increasingly targeted bymanufacturers, advertisers, and retailsponsors who saw them as importantplaces for consumer contact. Ratherthan selling food or novelties, however,commercial exhibitors displayed larger,more expensive products. At theMinnesota State Fair, the Varied Indus-tries Building had been set up in the1920s to accommodate such displays.
SEPTEMBER 2000 7
decreased. The result was a gradual shiftin emphasis away from an exclusivelyproduction-oriented approach to agri-culture and a growing sensitivity to themarket. For the first time, farmers had tolook beyond the product as the culmi-nation of all their efforts and considerits eventual consumption as well. TheMinnesota State Fair became a place forexplicit marketing efforts designed toincrease demand for local agriculturalproduce, and thereby increase consump-tion. The 1931 MSAS president’s addressproclaimed:
The fairs, not only the State Fair, butall the county fairs must realize thatthey have a new problem to solve,and that is one of surplus. . . .Instead of stressing this point ofincreased production fairs mustchange their curriculum to includein their course of study the problemof dealing with greater consumption.
In 1920, census data revealed thatfor the first time, more Americans livedin cities than on farms. The growth inurban population resulted fromincreasing numbers of jobs on theproduction lines and factory floors ofAmerica’s emerging manufacturingcenters. During the interwar years,entrepreneurs such as Henry Ford ratio-nalized their production lines usingtime and motion studies. These studiesresulted in individual workers beinggiven specific production quotas eachworkday and assigned mundane, frag-mented, and repetitive tasks on the newproduction lines. The effect on theeconomy was revolutionary, as produc-tivity levels soared and the quantity ofconsumer goods increased. The effect onAmerican culture was equally revolu-tionary. Rationalized production dehu-manized labor and removed all sense ofcreativity. No longer able to find socialvalue or social identity in either their laboror the production process, urban workersturned for satisfaction to the consump-tion of the goods that they produced.
The rationalization of the Americanworkforce also produced a heightenedsense of the distinction between worktime and leisure, and led to the legitima-tion of recreation. Nineteenth-centuryAmerican culture did not encouragerecreational pursuits, because to explicitlyvalue leisure time was to question themost basic precept of the Protestantwork ethic: the moral preeminence ofwork. With the shift from a moral to arational basis for labor and productionduring the twentieth century, American
society began to embrace leisure timeand recreation. This change wasreflected at the Minnesota State Fair inthe growing importance and increaseddiversity of recreational activities. By the1930s, the fair’s promotional materialfocused heavily on entertainmentfeatures at the event. As early as 1913,D.C. Wing, the editor of the Breeders’Gazette, noted in an address to the MSAS:
A modern state fair is a celebration, afestival, a vacation, a recreation, itsessential spirit is entirely foreign tothe morbidly serious purpose whichour toiling forefathers had in mindwhen they brought fairs into exis-tence. We have outgrown many ofthe restraints and dogmas that mayhave been useful in earlier days. Wedemand more freedom, more joy,more life, than our ancestors daredeven to seek.
money in savings. After the war ended,these cash reserves, the progressivegrowth policies instituted by the govern-ment, the need to make householdpurchases delayed during the war, and ageneral optimism on the part of theAmerican public combined to fuel theconsumer culture. Consumer spendingrose by 60% between 1945 and 1950,and a succession of new products (tele-visions, transistor radios, Polaroidcameras) became everyday necessities.
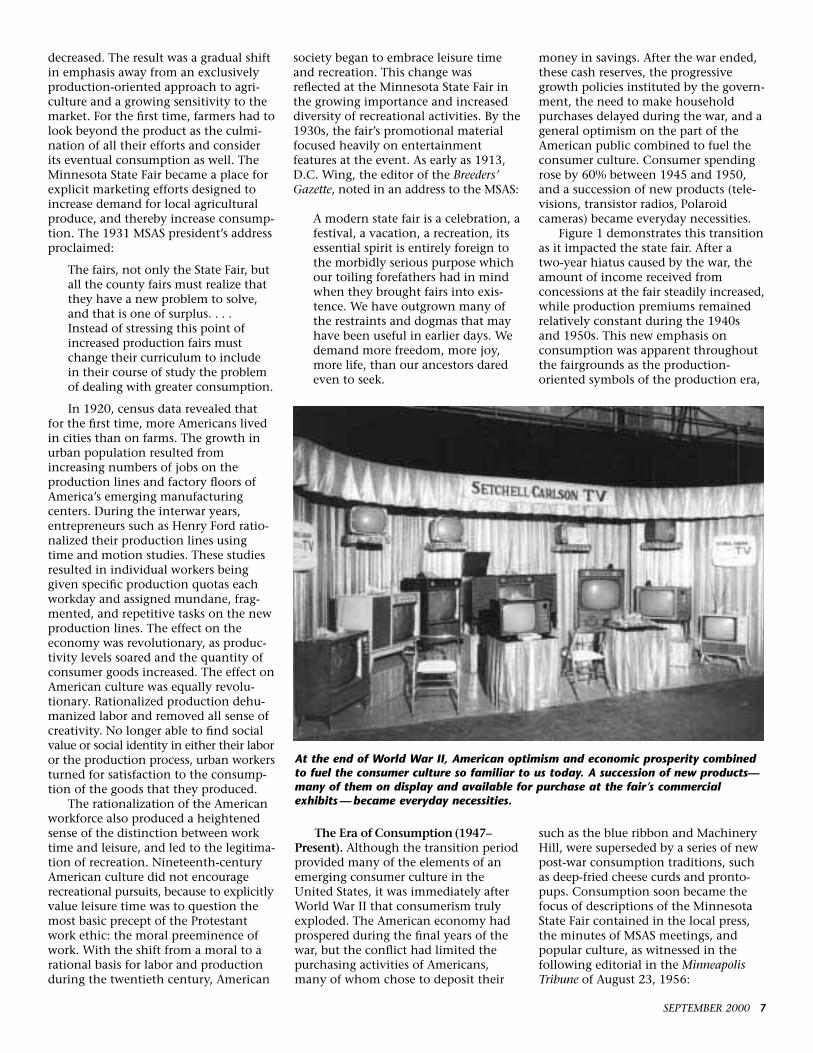
Figure 1 demonstrates this transitionas it impacted the state fair. After a two-year hiatus caused by the war, theamount of income received fromconcessions at the fair steadily increased,while production premiums remainedrelatively constant during the 1940sand 1950s. This new emphasis onconsumption was apparent throughoutthe fairgrounds as the production-oriented symbols of the production era,
such as the blue ribbon and MachineryHill, were superseded by a series of newpost-war consumption traditions, suchas deep-fried cheese curds and pronto-pups. Consumption soon became thefocus of descriptions of the MinnesotaState Fair contained in the local press,the minutes of MSAS meetings, andpopular culture, as witnessed in thefollowing editorial in the MinneapolisTribune of August 23, 1956:
At the end of World War II, American optimism and economic prosperity combinedto fuel the consumer culture so familiar to us today. A succession of new products—many of them on display and available for purchase at the fair’s commercialexhibits —became everyday necessities.
The Era of Consumption(1947–Present). Although the transition periodprovided many of the elements of anemerging consumer culture in theUnited States, it was immediately afterWorld War II that consumerism trulyexploded. The American economy hadprospered during the final years of thewar, but the conflict had limited thepurchasing activities of Americans,many of whom chose to deposit their

8 CURA REPORTER
Every year the Minnesota State Fairfinds as many as a million peoplewolfing down gastronomic novelties.The pronto pup—that Ferris wheelwith weenies dipped in batter thendunked in hot fat—has become astandard. The cotton candy — gooey,sickly sweet, and a wonderful deco-ration for car upholstery, braids andeverything a child can touch. The“foot long dog” is a certainty. As arethe endless griddles with weeniesand hamburgers. . . . They’re justdying to be buying at the State Fair!
The economic boom of the 1950sand 1960s fostered a postmodernconsumer culture in the United States —a culture in which conspicuousconsumption was no longer taboo, andwhere the consumer was considered theessential ingredient to a healthyeconomy. In the 1950s, people came tothe state fair to examine and purchase awide array of new products that theyhad previously glimpsed in advertise-ments. Annual surveys of the fair-goingpublic conducted in the 1950s revealedthat approximately half the attendeeseither intended to “make some majorpurchase of equipment in the nearfuture” or “wanted to see and hearabout the machines or household itemsthey wanted to buy.” Press descriptionsannually extolled the wide array ofgoods now available at the fair. Suchwas the emphasis on consumption that,from 1950 to the present, theMinneapolis Tribune has published anannual guide called “What’s Free at theFair” for those on lower incomes. By the1990s, MSAS annual reports were vari-ously describing the fair as a “shoppers’Mecca” and the “ultimate shoppingexperience.”
During the production era, state fairvisitors and organizers had used theamount and variety of production exhib-ited at the fair as a cultural index. Thisrole was now replaced by consumption.Production-era descriptions of the quan-tity and diversity of fruits and vegetablesbeing exhibited were replaced by annualaccounts of the amount of goodsconsumed by fair-goers, as in thisaccount from the Minneapolis Star ofAugust 22, 1947:
A food distributor on the groundsmakes this estimate as to how muchfood will be consumed: 23,000pounds of hamburgers, 20,000pounds of frankfurters, two carloadsof onions, four carloads of potatoes,
50,000 pounds of beef and roastpork and a carload of chicken.
Similarly, the focus on the numberof producers in attendance or productssubmitted for exhibition was replacedby a concern for the number ofconsumers who would attend the event.As an advertisement for the 1956 fairproudly declared, the event offered anopportunity to “approach fifty thousandpotential customers who will view theexhibits each day.” And amazement atthe ingenuity of new production tech-niques and machinery—which hadbeen a source of state pride forMinnesotans of the production era—was now replaced by satisfaction at thedegree of prosperity represented byhordes of consumers at the fairpurchasing all the essential elementsnecessary for “modern” living.
Yet another consequence of theproduction-consumption reversal at thestate fair was the decreasing influence ofand interest in production-orientedexhibits at the event. As Figure 1 illus-trates, from the 1960s on, the growth inconsumption at the fair is matched by asteady decline in the real value ofawards for production exhibits. Thedeclining emphasis on production atthe fair is perhaps the most significant
evidence of the presence of a newcultural order focused on consumption.As far back as 1938, an editorial in TheFarmer had noted that the “lack of inter-ested spectators at the ringside” for thejudging of the livestock awards was a“disquieting sign.” By 1950, generaldisinterest in the production exhibitsprompted the Pioneer Press to declarethat although “some city slickers maynot believe it, the livestock and poultryshows at the Minnesota State Fair havehad a great deal to do with making itthe nation’s biggest.” By 1978, the lackof interest in these exhibits led to areorganization of the livestock exhibits,which were scaled down to reduce thenumber of animals on show.
The decreasing emphasis on production also manifested itself in theconsumerization of many of the originalproduction-oriented features thatremained at the Minnesota State Fair.The blue ribbon, perhaps the mostpotent and pristine symbol of theproduction ethos of the past, waslicensed to a national company thatbought the rights to the winning picklesand preserves each year, and then massproduced them for national consump-tion under the brand name State Fair.Commercial exhibit spaces that hadinitially been limited to local manufac-turers and other companies of localorigin were sold to national and interna-tional manufacturers. Specific areas ofthe fair such as the Marlboro Countryeating area, and particular days in thefair calendar such as Pepsi Day, appearedas national brands with no production-oriented relationship to Minnesotabegan sponsorship deals with fairorganizers. Machinery Hill, which forover a century had displayed the latestfarm and production machinery for theeducation and enlightenment offarmers, also succumbed to the newemphasis on consumption. By 1993,large manufacturers such as Ford andCase I-H had withdrawn all their prod-ucts from the event. Those thatremained, such as John Deere, replacedfarm machinery with their latest homegardening and yard tools, which wereavailable for sale. The remaining spacewas occupied by an assortment of otherpurchasable home appliances, such ashot tubs and spas.
The story of the Minnesota State Fairis inevitably the story of Minnesota,which is itself representative of the largerchanges that took place throughout theUnited States during the twentieth
During the production era, the blue ribbon was the ultimate premiumawarded. Prize winners were exhibitedas living examples of production perfec-tion that every person should emulate.More recently, disinterest in livestockshows and other production-orientedexhibits at the fair has led to theirbeing significantly scaled back in size.

SEPTEMBER 2000 9
century. From an historical standpoint,the fair is particularly interestingbecause it presents a uniquely detailedlongitudinal account of the emergenceof a consumer culture in the AmericanMidwest. Like all good stories, however,the story of the Minnesota State Fair is atale without end. Just as Minnesotanswho attended the first territorial fairslikely could not grasp a society in whichfarmers were a distinct minority andproduction was no longer the center ofdaily life, it is equally hard for us, livingin the midst of a culture of consumption,to imagine a future in which consump-tion itself might be displaced. Still, it isplausible that 100 or 200 years fromnow, an historian of economics willanalyze fragments from the 2000Minnesota State Fair in an effort tounderstand what it must have been likefor people of the previous era to live in a culture dominated by consumption.
■ Mark Ritson was an assistant professorof marketing at the University ofMinnesota's Carlson School of Manage-ment at the time this research project wasconducted. He now teaches marketing atthe London Business School. His researchfocuses on consumer behavior and adver-tising, and has earned him the Best PaperPrize at the European Marketing Academyconference in Paris (1995) and the FerberPrize (2000).
This research project was originallypresented to CURA as a new initiative infall 1998. CURA supported the project by providing the services of a graduateresearch assistant, Jennifer Gabrys, whoconducted archival research at theMinnesota Historical Society and in thearchives of the Minnesota State Fair.
For over a century, Machinery Hill displayed the latest agricultural production equip-ment for the education and enlightenment of farmers and the public. After WorldWar II, however, the emphasis on consumption led manufacturers to begin displayingproducts targeted toward the average consumer. By the 1990s, manufacturers suchas Ford and Case I-H had withdrawn all their products from the event, while otherssuch as John Deere had replaced farm machinery with home gardening tools.

10 CURA REPORTER
Spatial Data Mining: An Emerging Tool for Policy Makersby Sanjay Chawla, Shashi Shekhar, Wei Li Wu, and Xinhong Tan
Just as the widespread use of relational databases triggeredinterest in classic data mining(CDM) techniques, widespread use of spatial databases has
increased interest in “mining” usefulbut implicit spatial patterns among data.Data mining products are being success-fully used as decision-making and plan-ning tools in both the public and privatesectors. Knowledge extraction from geo-spatial data was highlighted as a keyarea of research at a recently concludedNational Science Foundation workshopon geographic information systems, anda January 20, 2000, article in the NewYork Times on spatial data mining (SDM)demonstrates that interest in this tech-nology has spread to the public domain.
One of the corollaries of the infor-mation age is that society has becomeinundated with large quantities of data.The sheer size of these data sets oftenmakes it difficult to search for mean-ingful patterns or relationships amongdata. Data mining is a technique thatallows researchers to overcome thisobstacle and discover potentially inter-esting and useful patterns of informationembedded in large databases. A patterncan be a summary statistic such as theaverage or mean, or a statistical relation-ship such as a correlation between twoevents. A well-publicized pattern that hasnow become part of data mining lorewas discovered in the transaction data-base of a national retailer: People whobuy diapers in the afternoon also tend tobuy beer. This was an unexpected findingthat the company put to profitable useby rearranging store merchandise.
The promise of data mining is theability to rapidly and automaticallysearch for local and potentially high-utility patterns using computer algorithms.Data mining draws on techniques frommachine-learning, database manage-ment, and statistics to rapidly search forpatterns in the data. Although manydata mining techniques were inspiredby classic statistical techniques, there isone major difference: In statistics, data
are used to test the validity of a hypoth-esis, while in data mining, patterns andhypotheses are “discovered” by exploringthe data. Thus, data mining encompassesa set of techniques to automaticallygenerate hypotheses, followed by theirvalidation and verification via standardstatistical tools.
Identifying efficient tools forextracting information from geo-spatialdata is important to organizations thatown, generate, and manage large geo-spatial data sets. In this article, we willdiscuss the differences between CDMand spatial data mining (SDM) tech-niques, develop a model for incorpo-rating spatial properties into both classicstatistical analyses and a data miningframework, apply this model to anexample from ecology involving wildlifehabitat, and discuss the implications ofthe SDM model for policy makers.
Classic Data Mining vs. Spatial DataMiningThe difference between CDM and SDMis similar to the difference betweenclassic and spatial statistics. One of thefundamental assumptions of classicstatistical analysis is that data samplesare independently generated, much likesuccessive tosses of a coin or rolls of adie, where each toss or roll has no rela-tionship to the previous one. When itcomes to the analysis of spatial data,however, the assumption of indepen-dence is generally false because spatialdata tend to be highly self-correlated.For example, people with similar charac-teristics, occupations, and backgroundstend to cluster together in the sameneighborhoods. The economies of aregion tend to be similar. Changes innatural resources, wildlife distribution,and temperature usually vary graduallyover an area.
The tendency of like things tocluster in a space is so fundamental thatgeographers have elevated this phenom-enon to the status of the first law ofgeography: “Everything is related toeverything else, but nearby things are
more related than distant things.” Inspatial statistics, an area within statisticsdevoted to the analysis of spatial data,this tendency is called spatial autocorre-lation. Ignoring spatial autocorrelationwhen analyzing data with spatial characteristics may produce hypothesesor models that are inaccurate or incon-sistent with the data set. Thus, CDMalgorithms often perform poorly whenapplied to spatial data sets.
Any data set that has a spatial, loca-tional, or geographic component can beconsidered a spatial database. Examplesof common spatial databases includemaps, repositories of remote-sensingimages, and the decennial census.Spatial data mining involves the searchfor patterns embedded in large spatialdatabases. Although contemporary SDMinvolves the use of computers, thefollowing well-known examples of whatwe now call SDM occurred long beforethe invention of computers:
� In 1855, when Asiatic cholera was sweeping through London, an epidemiologist marked on a map those locations where the disease had struck. The epidemiologist discovered that the locations formed a cluster, at the center of which was a water pump. When government authorities turned off the water pump, the cholera epidemic began to subside.
� In 1909, a group of dentists discoveredthat the residents of Colorado Springs had unusually healthy teeth. They attributed this occurrence to the high level of natural fluoride in the local drinking water. Now all municipalitiesin the United States ensure that their drinking water supply is fortified with fluoride.
� In 1919, an investigator discovered (using maps) that all the continents could be fitted together like a giant jigsaw puzzle. Based on this discovery,the theory of Gondwanaland—which states that all the continents once formed a single landmass—was proposed.

SEPTEMBER 2000 11
Over the years, information data-bases have grown so large that it hasbecome both useful and necessary toautomate the search for potentiallymeaningful patterns. For example, aninteresting problem in crime analysis isthe detection, explanation, and predic-tion of “hot spots”—locations in acommunity or city that experienceoutbreaks of increased criminal activity.The classic statistical approach to detec-tion of such spots is for an expert to usea GIS to correlate different map-layers ofattribute data available for that city. Thepromise of data mining is that it allowsthe analysis to be recast as a searchproblem in a database. By using high-speed computers and smart algorithms,it is possible to search the database forclusters of data that may characterizepotential hot spots. Thus, the domainexpert who earlier searched for hot spotswith the aid of a GIS is now involved insetting up the correct problem, and theninterpreting the output from a datamining algorithm to determine whichof the hot spots are worthy of furtheranalysis using standard statistical tech-niques. Data mining is a tool for gener-ating candidate hypotheses from dataon which no a priori information isavailable.
Spatial data mining holds thepromise of discovering patterns withinexisting spatial databases with minimalhuman intervention. As such, SDM canbe a powerful aid in policy decisionmaking. The following areas in whichSDM is already playing an importantrole were showcased in a January 20,2000, New York Times article:
� Monitoring lending patterns of insti-tutions. Consumer advocacy groups are using SDM to map the lending practices of banks and other lending institutions. By relating the location of banks with the demographics of surrounding neighborhoods, SDM techniques can provide more accurate information about whether poor neighborhoods are being denied fair access to credit.
� Crime mapping and hot-spot analysis.Techniques from SDM can be used to detect local patterns in crime data-bases and examine related databases to search for an explanation. For example, a sudden spurt in crime in a given neighborhood may be the resultof an ex-convict moving into the neighborhood.
� Protecting the environment. Spatial data mining is being used to design
optimal habitat environments for birds on the endangered species list. For example, by using SDM to identifyfactors that influence a bird’s choice of nesting location, conservation managers can ensure that these factors are preserved.
Developing a Spatial Regression Model In the previous section, we gave ageneral overview of SDM and examplesof some potential applications of SDMtechniques. In this section, we attemptto develop a new model for SDM byincorporating the concept of spatialautocorrelation—the idea that “Every-thing is related to everything else, butnearby things are more related thandistant things.” The value of such amodel can be illustrated by consideringthe case of standard regression analysis.
Regression analysis is a standardtechnique in statistics that is used toquantify the relationship between adependent variable Y and an indepen-dent variable (or variables) X. Forexample, Y might be the number ofcrime incidents in different Twin Citiesneighborhoods, and X might be theaverage house value in each of theseneighborhoods. The goal of an investi-gator concerned with identifying crimehot-spots in the Twin Cities might be tobuild a model that can predict thenumber of crime incidents likely to occurin a given neighborhood based on theaverage house value in that neighborhood.
The classic statistical approach tobuilding such a model consists of twosteps. First, the investigator describesthe relationship between Y and X usinga linear regression equation such as theone shown in Figure 1 (a). In this equa-tion, ε represents the residual error. In
the classic approach, the value of ε isassumed to be generated from identicaland independent distributions (forexample, a standard bell-curve distribu-tion). This assumption is based on thepresupposition that an error associatedwith one data-sample observation is notdependent on or related to errors associ-ated with other data-sample observations.
In the second step, the investigatoruses the linear regression equation tocalculate the parameter β based on theavailable data for X and Y. Solving for βin this equation is similar to calculatingthe slope and intercept of a straight linethat represents, in graphic terms, therelationship between the dependent andindependent variable. Theoretically, theresulting value for β could then be usedas a predictive instrument. In the case ofcrime incidence in the Twin Cities, forexample, β could be used to predict theincidence of crime for a given neighbor-hood based on average house values forthe neighborhood.
Although useful, the classic statisticalapproach ignores spatial characteristicsof the data used to generate the model—specifically, the spatial relationshipsthat might exist among the differentlocations where the data were collected.This explains why, when classic linearregression is used to model phenomenonwhere the data samples have a spatialcomponent, the value of the error termε is not always distributed identicallyand independently across the data set.Instead, the value of ε often variessystematically over space. This is becausethe independent and dependent variablesthemselves are spatially related in waysthat differentially affect the values ofthese variables, and in turn the value of ε.In short, because the classic approachignores the first law of geography andassumes that there is no spatial autocor-relation present among the data, it cannotadequately account for such relationships.
The spatial regression approachattempts to overcome this problem byintroducing into the regression equationan additional “correction” term. Aninvestigator using such an approach toconstruct a model would describe therelationship between X and Y using aspatial regression equation such as theone shown in Figure 1 (b). In this equa-tion, the correction term ρWy attemptsto capture the spatial characteristics of the data. The spatial information is encoded using what is called a conti-guity matrix, abbreviated W. Forexample, Figure 2 (a) shows a map ofthe seven counties that constitute the
a
(a) The classic regression model todetermine the relationship betweenvariable Y and variable X.
Figure 1. Classic and Spatial RegressionModels
b
(b) The classic regression model, modified to account for spatial autocor-relation in the dependent variable byinclusion of a “correcting” term.

12 CURA REPORTER
Twin Cities metropolitan area. Thecontiguity matrix (W) for this map isshown in Figure 2 (b). Counties whoseborders touch each other are indicatedby a 1 in the matrix, and counties whoseborders do not touch are indicated by a0. The contiguity matrix essentiallyquantifies the first law of geography —that nearby things are more related thandistant things — because counties thattouch each other are more “nearby” thanthose that do not touch. The investigatorwould use the available data to solve forρ and β, where ρ signifies the degree towhich the values in the dependent variable are spatially autocorrelated.
Another shortcoming of the classicapproach involves the way that theoutcomes of various models are inter-preted. Consider the example shown in
Figure 3. Here the goal is to predict theactual location of bird nests marked byan A in Figure 3 (a). Figures 3 (b) and3 (c) show the results of two modelsused to predict the location of nests,indicated by a P. Although the predic-tions of the model used in Figure 3 (c)are clearly closer to the actual locationof the nests than are the predictions ofthe model used in Figure 3 (b), theclassic approach would fail to distin-guish between the predictions of thesetwo models.
Having argued that there are significant drawbacks to using a classicapproach to spatial data analysis, and that the introduction of a spatialregression equation can overcome theseproblems and lead to more accuratepredictions, we now demonstrate the
value of a spatial regression analysisframework using the example ofecological habitat prediction.
Applying a Spatial Regression Model to Ecological Habitat PredictionThe availability of accurate spatialhabitat models is an important tool forwildlife management, as well as protec-tion of critical habitat and endangeredspecies. Because the underlying processgoverning the interaction betweenwildlife and environmental factors iscomplex, statistical techniques are oftenused to gain insight into the process on the basis of data collected duringfieldwork. Writing in the 1997 issue ofEcological Modelling, Uygar Ozesmi andWilliam Mitsch developed a spatialhabitat model for predicting the nestinglocations of the wetland-breeding red-winged blackbird (Agelaius phoeniceus L.)in the Great Lakes region. We will usetheir model, and the accompanyingdata they used to generate it, to illustrate the benefits of using spatialregression analysis techniques.
The goal of the Ozesmi and Mitschstudy was to create a model able topredict nest locations (dependent variable) based on several explanatory(independent) variables, includingdistance to open water, water depth,and dominant vegetation durability.Data were collected in 1995 and 1996from two wetland sites — Darr andStubble — located on the shores of LakeErie in Ohio. The data collected at theDarr site were used to build a classicregression model. This model was thentested using the data collected at theStubble site in order to evaluate themodel’s predictive power.
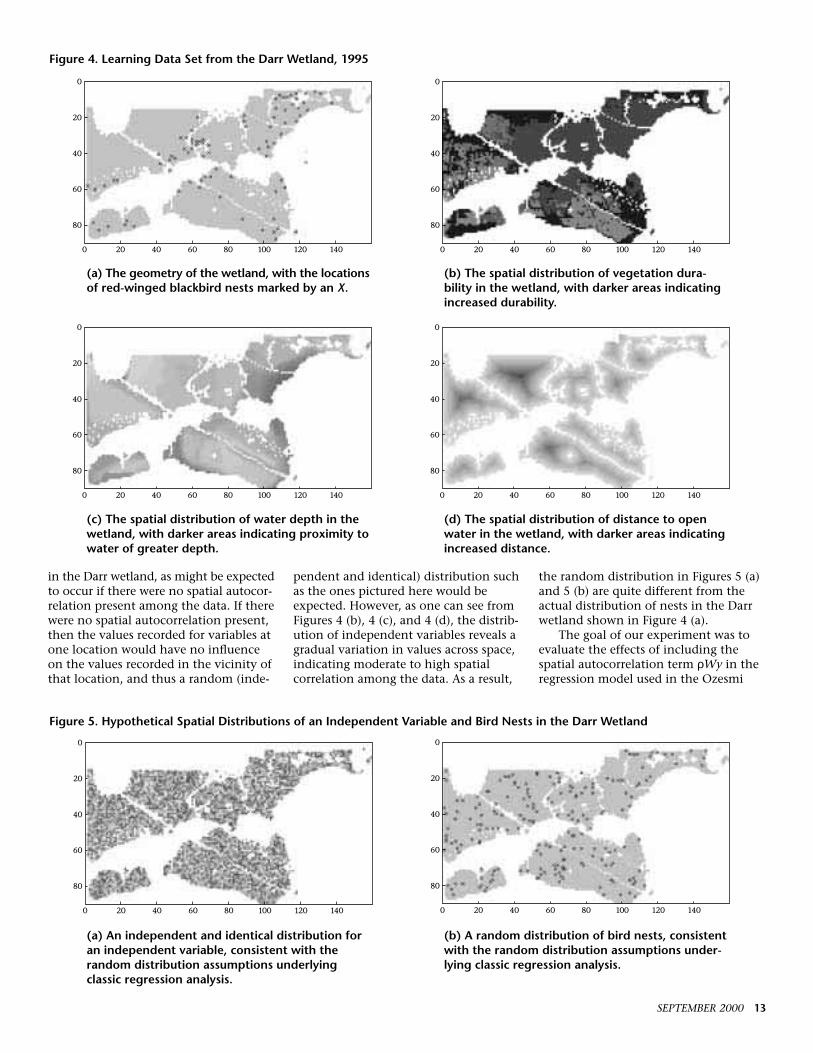
To create the model, a uniform gridwas imposed on the Darr wetland, andin each cell the values of severalstructural and environmental factors (independent variables) were recorded. These included water depth, dominantvegetation durability, and distance toopen water. For each cell, it was alsonoted whether or not a red-wingedblackbird nest was present (dependentvariable). The geometry of the Darrwetland, the locations of the nests, andthe spatial distribution of the indepen-dent variables are shown in Figure 4.
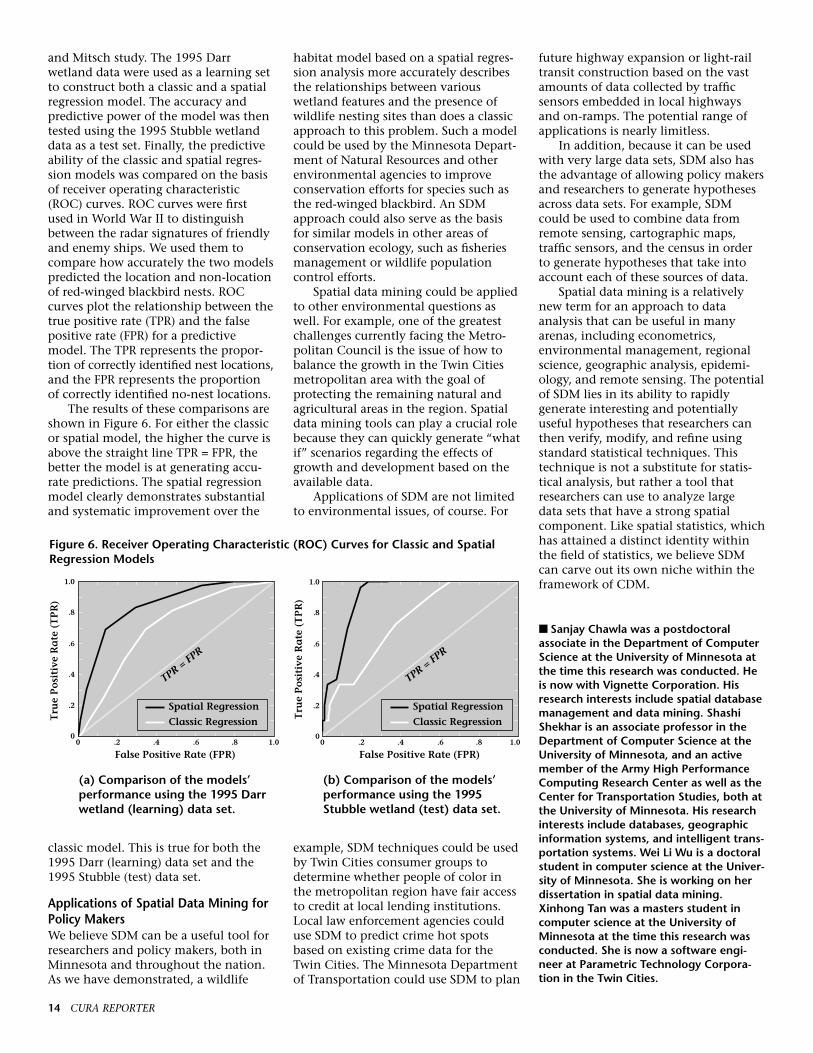
When the data are mapped, it isapparent that both the dependent andindependent variables show a moderateto high degree of spatial autocorrelation.For example, Figure 5 shows hypothet-ical random spatial distributions for anindependent variable and for bird nests
W
A
H
C
S D
R
A = Anoka County R = Ramsey CountyC = Carver County S = Scott CountyD = Dakota County W = Washington CountyH = Hennepin County
a b
(b) The contiguity matrix(abbreviated W) for the mapshown in (a). A non-zero entryin the matrix indicates that thecorresponding spatial entities onthe map (in this case, counties)are neighbors.
A = actual nest in pixel
(a) The actual locationsof nests in a grid, withlocations marked by an A.
(a) A map of the seven counties in the TwinCities metropolitan region.
A C D H R S W
A 0 0 0 1 1 0 1
C 0 0 0 1 0 1 0
D 0 0 0 1 1 1 1
H 1 1 1 0 1 1 0
R 1 0 1 1 0 0 1
S 0 1 1 1 0 0 0
W 1 0 1 0 1 0 0
Figure 2. Map with Corresponding Contiguity Matrix
A
AA
P
PP
A
A
A
P
A
A
A
P
P
Figure 3. Classic and Spatial Model Interpretation
(c) The locations of nestspredicted by Model 2,with predicted locationsmarked by a P. Althoughthe predictions producedby Model 2 are spatiallymore accurate than thoseproduced by Model 1,classic measures of classi-fication accuracy areunable to recognize thisdistinction.
(b) The locations of nestspredicted by Model 1,with predicted locationsmarked by a P.
P = predicted nest in pixel
SEPTEMBER 2000 13
in the Darr wetland, as might be expectedto occur if there were no spatial autocor-relation present among the data. If therewere no spatial autocorrelation present,then the values recorded for variables atone location would have no influenceon the values recorded in the vicinity ofthat location, and thus a random (inde-
pendent and identical) distribution suchas the ones pictured here would beexpected. However, as one can see fromFigures 4 (b), 4 (c), and 4 (d), the distrib-ution of independent variables reveals agradual variation in values across space,indicating moderate to high spatialcorrelation among the data. As a result,
the random distribution in Figures 5 (a)and 5 (b) are quite different from theactual distribution of nests in the Darrwetland shown in Figure 4 (a).
The goal of our experiment was toevaluate the effects of including thespatial autocorrelation term ρWy in theregression model used in the Ozesmi
0
20
40
60
80
0 20 40 60 80 100 120 140
(d) The spatial distribution of distance to openwater in the wetland, with darker areas indicatingincreased distance.
0
20
40
60
80
0 20 40 60 80 100 120 140
(a) An independent and identical distribution foran independent variable, consistent with therandom distribution assumptions underlyingclassic regression analysis.
0
20
40
60
80
0 20 40 60 80 100 120 140
0
20
40
60
80
0 20 40 60 80 100 120 140
c
0
20
40
60
80
0 20 40 60 80 100 120 140
Figure 4. Learning Data Set from the Darr Wetland, 1995
(a) The geometry of the wetland, with the locationsof red-winged blackbird nests marked by an X.
(b) The spatial distribution of vegetation dura-bility in the wetland, with darker areas indicatingincreased durability.
(c) The spatial distribution of water depth in thewetland, with darker areas indicating proximity towater of greater depth.
0
20
40
60
80
0 20 40 60 80 100 120 140
Figure 5. Hypothetical Spatial Distributions of an Independent Variable and Bird Nests in the Darr Wetland
(b) A random distribution of bird nests, consistentwith the random distribution assumptions under-lying classic regression analysis.
14 CURA REPORTER
and Mitsch study. The 1995 Darrwetland data were used as a learning setto construct both a classic and a spatialregression model. The accuracy andpredictive power of the model was thentested using the 1995 Stubble wetlanddata as a test set. Finally, the predictiveability of the classic and spatial regres-sion models was compared on the basisof receiver operating characteristic(ROC) curves. ROC curves were firstused in World War II to distinguishbetween the radar signatures of friendlyand enemy ships. We used them tocompare how accurately the two modelspredicted the location and non-locationof red-winged blackbird nests. ROCcurves plot the relationship between thetrue positive rate (TPR) and the falsepositive rate (FPR) for a predictivemodel. The TPR represents the propor-tion of correctly identified nest locations,and the FPR represents the proportionof correctly identified no-nest locations.
The results of these comparisons areshown in Figure 6. For either the classicor spatial model, the higher the curve isabove the straight line TPR = FPR, thebetter the model is at generating accu-rate predictions. The spatial regressionmodel clearly demonstrates substantialand systematic improvement over the
classic model. This is true for both the1995 Darr (learning) data set and the1995 Stubble (test) data set.
Applications of Spatial Data Mining forPolicy Makers We believe SDM can be a useful tool forresearchers and policy makers, both inMinnesota and throughout the nation.As we have demonstrated, a wildlife
habitat model based on a spatial regres-sion analysis more accurately describesthe relationships between variouswetland features and the presence ofwildlife nesting sites than does a classicapproach to this problem. Such a modelcould be used by the Minnesota Depart-ment of Natural Resources and otherenvironmental agencies to improveconservation efforts for species such asthe red-winged blackbird. An SDMapproach could also serve as the basisfor similar models in other areas ofconservation ecology, such as fisheriesmanagement or wildlife populationcontrol efforts.
Spatial data mining could be appliedto other environmental questions aswell. For example, one of the greatestchallenges currently facing the Metro-politan Council is the issue of how tobalance the growth in the Twin Citiesmetropolitan area with the goal ofprotecting the remaining natural andagricultural areas in the region. Spatialdata mining tools can play a crucial rolebecause they can quickly generate “whatif” scenarios regarding the effects ofgrowth and development based on theavailable data.
Applications of SDM are not limitedto environmental issues, of course. For
example, SDM techniques could be usedby Twin Cities consumer groups todetermine whether people of color inthe metropolitan region have fair accessto credit at local lending institutions.Local law enforcement agencies coulduse SDM to predict crime hot spotsbased on existing crime data for theTwin Cities. The Minnesota Departmentof Transportation could use SDM to plan
future highway expansion or light-railtransit construction based on the vastamounts of data collected by trafficsensors embedded in local highways and on-ramps. The potential range ofapplications is nearly limitless.
In addition, because it can be usedwith very large data sets, SDM also hasthe advantage of allowing policy makersand researchers to generate hypothesesacross data sets. For example, SDMcould be used to combine data fromremote sensing, cartographic maps,traffic sensors, and the census in orderto generate hypotheses that take intoaccount each of these sources of data.
Spatial data mining is a relativelynew term for an approach to dataanalysis that can be useful in manyarenas, including econometrics, environmental management, regionalscience, geographic analysis, epidemi-ology, and remote sensing. The potentialof SDM lies in its ability to rapidlygenerate interesting and potentiallyuseful hypotheses that researchers canthen verify, modify, and refine usingstandard statistical techniques. Thistechnique is not a substitute for statis-tical analysis, but rather a tool thatresearchers can use to analyze large data sets that have a strong spatialcomponent. Like spatial statistics, whichhas attained a distinct identity withinthe field of statistics, we believe SDMcan carve out its own niche within theframework of CDM.
■ Sanjay Chawla was a postdoctoral associate in the Department of ComputerScience at the University of Minnesota atthe time this research was conducted. Heis now with Vignette Corporation. Hisresearch interests include spatial databasemanagement and data mining. ShashiShekhar is an associate professor in theDepartment of Computer Science at theUniversity of Minnesota, and an activemember of the Army High PerformanceComputing Research Center as well as theCenter for Transportation Studies, both atthe University of Minnesota. His researchinterests include databases, geographicinformation systems, and intelligent trans-portation systems. Wei Li Wu is a doctoralstudent in computer science at the Univer-sity of Minnesota. She is working on herdissertation in spatial data mining.Xinhong Tan was a masters student incomputer science at the University ofMinnesota at the time this research wasconducted. She is now a software engi-neer at Parametric Technology Corpora-tion in the Twin Cities.
0 .2 .4 .6 .8 1.00
.2
.4
.6
.8
1.0
TPR = FPR
Spatial Regression
Classic RegressionTru
e P
osi
tive
Ra
te (
TP
R)
False Positive Rate (FPR)
TPR = FPR
Spatial Regression
Classic RegressionTru
e P
osi
tive
Ra
te (
TP
R)
False Positive Rate (FPR)a b
0
.2
.4
.6
.8
1.0
0 .2 .4 .6 .8 1.0
(a) Comparison of the models’ performance using the 1995 Darrwetland (learning) data set.
Figure 6. Receiver Operating Characteristic (ROC) Curves for Classic and SpatialRegression Models
(b) Comparison of the models’performance using the 1995Stubble wetland (test) data set.

SEPTEMBER 2000 15
This study was supported by an inter-active research grant from CURA and theOffice of the Vice President for Research,University of Minnesota. Interactiveresearch grants have been created toencourage University faculty to carry outresearch projects that involve significantissues of public policy for the state andthat include interaction with community
groups, agencies, or organizations inMinnesota. These grants are available toregular faculty members at the Universityof Minnesota and are awarded annuallyon a competitive basis.
The study was also sponsored in partby the United States Army High Perfor-mance Computing Research Center underthe auspices of the Department of the
Army, Army Research Laboratory Coopera-tive Agreement No. DAAH04-95-2-0003and Contract No. DAAH04-95-C-0008. Thecontents of this study do not necessarilyreflect the position or the policy of thegovernment, and no official endorsementshould be inferred.
To keep our readers up-to-dateabout CURA projects, eachissue of the CURA Reporterfeatures a few capsule descrip-
tions of new projects underway. Theprojects highlighted in this issue aremade possible through CURA’sCommuniversity Personnel Grants. Thegrants are awarded twice each year tograssroots organizations in the commu-nity. Each grant supports the extrapersonnel needed by local organiza-tions, usually by providing an advancedgraduate student who works directlywith the organization receiving theaward. The grants are competitive, andorganizations working with people ofcolor are favored. The projects describedhere are only a sampling of projectsthat will receive CURA support duringthe coming year.
■ Empowering Latino Youth. LaEscuelita is a youth-serving organiza-tion that focuses on the development ofLatino youth, specifically in the areas ofacademic enrichment, service-learning,recreation, and cultural empowerment.A graduate student will research litera-ture on youth development and Latinoyouth-serving organizations, and writea report that includes a framework forevaluating such organizations.
■ Resources for American IndianWomen. The Minnesota Indian Women’sResource Center in the Phillips neigh-borhood of Minneapolis provides servicesto American Indian women and theirfamilies in the Twin Cities metro regionand on several area reservations. A grad-uate student will assist the center’s staffin gathering resource material anddeveloping new curricula in severalareas, including culturally-based chem-ical dependency treatment, parenting,domestic violence, and sexual assault.
■ Real Estate Foreclosures. This projectwill focus on real estate home loan fore-closures by subprime lenders throughoutthe Twin Cities metro area during the1990s. A graduate student will workwith Minnesota ACORN (Association ofCommunity Organizations for ReformNow)—an advocate for low- andmoderate-income families in the TwinCities—to determine whether there is acorrelation between foreclosures andnon-conventional mortgages, andwhether the hardest hit areas are neigh-borhood minority communities with astable rate of home ownership.
■ Racial and Low-Income HousingImpact Statement. The MetropolitanInterfaith Council on AffordableHousing (MICAH) mobilizes congrega-tions and people of all faiths to advocatefor public policies that increase thesupply of affordable housing in theTwin Cities metro area and promote fairhousing for all residents. A graduatestudent will research and reviewexisting literature on affordable housing,identify particular housing policies andpractices in the Twin Cities area, andwork with MICAH staff to prepare aracial and low-income impact statementregarding metro area housing policies.
■ Business Plan for Social ServiceOrganization. Damiano is a community-based organization that provides socialservice programs to low-income familiesin the central hillside neighborhood ofdowntown Duluth. Using a local archi-tectural firm’s feasibility study as afoundation, the organization will workwith a graduate student to develop abusiness plan for development of rentalspace in the Damiano Center, where theorganization is housed.
■ Legal Advocacy for Battered Women.Based in St. Paul, the Battered Women’sLegal Advocacy Project works to elimi-nate oppression of and violence againstwomen. Project staff will work with agraduate student to assess the status ofbattered female criminal defendants inHennepin County and southwesternMinnesota, and to identify how manywere in need of legal representation inthe year prior to the project start date.The research project will document thenature of the representation provided,the defense strategies employed at trial,the length of sentences, and theadequacy of representation.
■ Services for American Indian Children at Risk. The Indian ChildWelfare Law Center is a nonprofitagency that provides culturally appro-priate legal services to American Indianfamilies in the child protection system.The center serves as a communitydevelopment resource for education,advocacy, and public policy, and helpsconnect American Indian children atrisk with an existing network of servicepeople and programs. The organizationwill have a graduate student update andreorganize its information database inorder to assist the center in setting goalsfor the future.
■ Preventing Child Abuse andNeglect in the Latino Community.Unidas Para Los Ninos (United for Chil-dren) is a coalition of individuals andorganizations formed to prevent childabuse and neglect in the growing metroarea Latino community. A graduatestudent will research culturally appro-priate resources on child abuse andneglect for use by social serviceprograms and health practitionersworking with Spanish-speaking familiesin the area.
Project Awards
16 CURA REPORTER
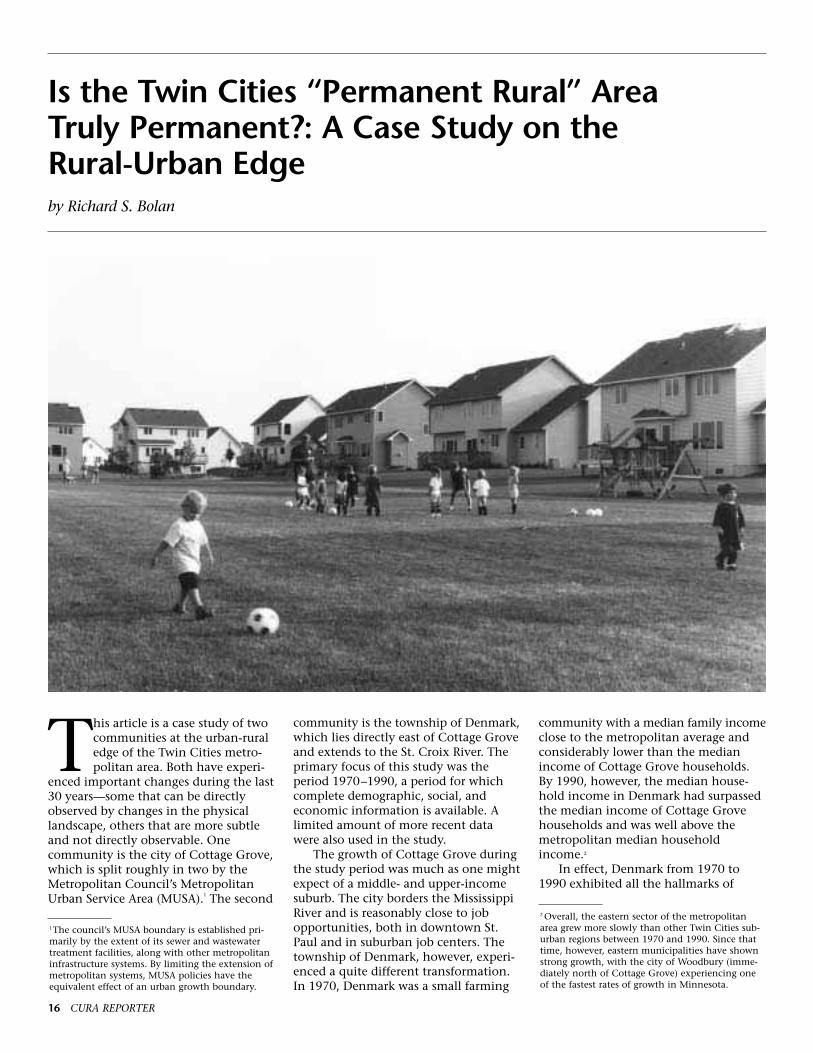
This article is a case study of twocommunities at the urban-ruraledge of the Twin Cities metro-politan area. Both have experi-
enced important changes during the last30 years—some that can be directlyobserved by changes in the physicallandscape, others that are more subtleand not directly observable. Onecommunity is the city of Cottage Grove,which is split roughly in two by theMetropolitan Council’s MetropolitanUrban Service Area (MUSA).1 The second
community is the township of Denmark,which lies directly east of Cottage Groveand extends to the St. Croix River. Theprimary focus of this study was theperiod 1970–1990, a period for whichcomplete demographic, social, andeconomic information is available. Alimited amount of more recent datawere also used in the study.
The growth of Cottage Grove duringthe study period was much as one mightexpect of a middle- and upper-incomesuburb. The city borders the MississippiRiver and is reasonably close to jobopportunities, both in downtown St.Paul and in suburban job centers. Thetownship of Denmark, however, experi-enced a quite different transformation.In 1970, Denmark was a small farming
community with a median family incomeclose to the metropolitan average andconsiderably lower than the medianincome of Cottage Grove households.By 1990, however, the median house-hold income in Denmark had surpassedthe median income of Cottage Grovehouseholds and was well above themetropolitan median householdincome.2
In effect, Denmark from 1970 to1990 exhibited all the hallmarks of
Is the Twin Cities “Permanent Rural” Area Truly Permanent?: A Case Study on the Rural-Urban Edgeby Richard S. Bolan
1The council’s MUSA boundary is established pri-marily by the extent of its sewer and wastewatertreatment facilities, along with other metropolitaninfrastructure systems. By limiting the extension ofmetropolitan systems, MUSA policies have theequivalent effect of an urban growth boundary.
2 Overall, the eastern sector of the metropolitanarea grew more slowly than other Twin Cities sub-urban regions between 1970 and 1990. Since thattime, however, eastern municipalities have shownstrong growth, with the city of Woodbury (imme-diately north of Cottage Grove) experiencing oneof the fastest rates of growth in Minnesota.

SEPTEMBER 2000 17
becoming an affluent exurban community.This phenomenon has been observed onthe outer edges of most large metropol-itan areas in the United States, yet therehas been very little study of the demo-graphic and lifestyle characteristics ofexurbanites, their attachment to ruralliving, or the implications of theirlifestyle for metropolitan and regionalplanning. This article examines theevidence of changes in Denmark andCottage Grove during the period1970 –1990, and traces some of thesocial, fiscal, and transportation implica-tions of these changes based on thisevidence. This examination raisesnumerous questions about the challengeof maintaining the agricultural and ruralcharacter of communities on the outeredges of the Twin Cities as people whosettled in exurban areas age, and beginto seek out alternative living arrange-ments. This article then considersregional policies and regulatory tools forretaining viable agricultural activitiesand assuring that designated permanentrural areas remain rural.
Development in Cottage Grove andDenmark: 1970 to 1990The contrast between suburban andexurban change can be seen bycomparing key economic, demographic,and social indicators for Cottage Groveand Denmark.
Economic Conditions. Census datapertaining to median family incomehighlight the most dramatic changes incommunity character between 1970 and1990. Although both communities wereabove the metropolitan average forfamily income for each census year,Denmark’s population had a 37% lowermedian family income in 1970 than
Cottage Grove. By 1990, however, themedian family income in Denmark was15% higher than in Cottage Grove. Thisstriking change in relative wealth over20 years is also shown by the data onpersons living below the poverty line(Figure 1). In 1970, almost 12% ofDenmark’s population lived below thepoverty line. By 1990, this number haddwindled to 2.5%. Cottage Grove alsosaw a decline in persons living belowpoverty in 1990, but its poverty levelsstayed relatively stable during the 20-year period at 2-3%. Table 1 provides
detailed income and poverty statisticsfor the two communities in bothconstant and current dollars.
Tables 2 and 3 show the distributionof the labor force in the two communi-ties by economic sector and occupationbased on 1990 Census data. Labordistribution in Cottage Grove was signif-icantly different than in Denmark inthat 25% of Cottage Grove’s work force
was employed in manufacturing,compared with only 15% of Denmark’slabor force. Denmark still retained 11%of its labor force in agriculture, but thissector employed less than 1% of CottageGrove workers. It is noteworthy that, in1990, 30% of Denmark’s workers werein professional and related services.There were also more jobs available inDenmark than there was labor force tooccupy them. With the generalmismatch between the jobs available intown and the occupational profile of thelabor force, it can be assumed that therewere as many workers commuting intoDenmark as there were going out—albeit in very small numbers each way.As with most suburbs, Cottage Grovehad a much larger labor force than ithad jobs available, so the net effect wasconsiderable outward commuting toother communities as discussed below.
The primary occupations in CottageGrove reflected a typical middle-incomesuburban community, with over 23% of residents in professional positions,29% in technical and craft occupations,and 46% in sales and clerical positions.Statistics for Denmark are comparablewith respect to both professional andcraft occupations, but significantly fewerpeople in Denmark were employed inclerical and sales positions, and morepeople were employed in agriculture.
Demographic and Social Changes.Overall, Cottage Grove grew from apopulation of 13,624 in 1970 to a popu-lation of 22,941 in 1990, an averageannual change of 3.4%. The city’sgrowth during this period can be charac-terized as modest, yet steady. Denmarkstarted from a significantly smaller basein 1970 with only 818 residents. Withits 1990 population at 1,178, Denmark
Cottage Grove Denmark Township
1970 1980 1990 1970 1980 1990
Median family income in current dollars* $12,986 $27,064 $47,153 $9,450 $28,214 $54,418
Median family income in 1982 dollars* $33,426 $32,883 $36,119 $24,324 $34,280 $41,684
Families with public assistance income 76 196 248 5 4 10(2.7%)† (3.9%)† (3.6%) (2.4%)† (1.3%)† (2.7%)†
Persons below poverty line 424 471 601 96 52 30(3.1%)‡ (2.4%)‡ (2.6%) (11.7%)‡ (4.6%)‡ (2.5%)‡
Table 1. Family Income, Public Assistance, and Poverty Statistics for Cottage Grove and Denmark Township, 1970, 1980, and 1990
0%
2%
4%
6%
8%
10%
12%
1970 1980 1990
Cottage Grove
Denmark Township
Year
Perc
enta
ge b
elow
pov
erty
lin
e
Source: 1970, 1980, and 1990 Census of Population and Housing STF3*Mean family income figures were used for the year 1970 †Calculated as the share of the families with positive income ‡Calculated as the share of the total population
Figure 1. Poverty Rate for CottageGrove and Denmark Township, 1970,1980, and 1990

18 CURA REPORTER
had experienced a net change of only360 additional residents in a 20-yearperiod (or an average of 18 new residentsper year).
For both communities, the datasuggest that young families with childrenwere responsible for the growth periodof the 1970s. With growth slowing inthe 1980s, young children and youngadults began to constitute a smallerproportion of the population, while theproportion of older adults increased.Denmark Township saw a relativedecline in elderly population. Thebiggest increase in population for thetownship occurred among those aged 45to 64, people in their prime both profes-sionally and in terms of earning capacity.Few residents in Cottage Grove duringthe study period were elderly. Thoseaged 65 or older were slightly under 2%of the total in 1970, and by 1990 theelderly population had only grown to2.6% of the population.
As might be expected, an over-whelming majority of homes in bothcommunities were single-family homes.Between 1980 and 1990, multifamilyhousing increased in Cottage Grovefrom 5% to almost 9%, while suchhousing actually decreased in Denmarkfrom 6% to less than 4% during thesame period. Denmark exhibited themost dramatic increase in the value of owner-occupied housing with a 70% rise in value, while Cottage Groveexperienced a 37% increase. This difference reflects the marked changesin household income noted above.
Impacts of Growth and ChangeKey concerns arising from growth andchange at the edge of urban areasinclude (1) the impact on productivefarmland and the scenic character thatdistinguish rural areas, (2) the impact on congestion and air quality resultingfrom more frequent auto trips andincreased vehicle miles traveled, (3) theimpact on housing markets at the urbanedge and the creation of greater levels ofsocial-class differentiation across themetropolitan region, and (4) the impacton the fiscal viability of small localgovernments faced with demands forincreased urban services such as schools,roads, and police and fire protection.This section summarizes the findings of studies carried out for Cottage Groveand Denmark that illustrate the distinction between suburb and exurb.
Changes in Rural Land Use. In theTwin Cities metropolitan area as a whole,recent data from the U.S. Department of
Cottage Grove Denmark Township
Occupation Residents Jobs Residents Jobs
Executive and professional specialty* 2,803 1,059 144 129(23.4%) (22.9%) (22.9%) (15.9%)
Technicians and craft occupations† 3,516 1,367 179 310(29.4%) (29.5%) (28.5%) (38.1%)
Sales and clerical‡ 5,533 2,138 250 289(46.2%) (46.3%) (39.8%) (35.6%)
Farming, forestry, and fishing 117 63 56 85(1.0%) (1.4%) (8.9%) (10.5%)
All 11,969 4,627 629 813(100.0%) (100.0%) (100.0%) (100.0%)
Table 2. Occupation Distribution in Cottage Grove and Denmark Township byResidency and Employment Locations, 1990
Cottage Grove Denmark Township
Industry Residents Jobs Residents Jobs
Manufacturing 3,005 1,134 93 61(25.1%) (24.5%) (14.8%) (7.5%)
Finance, insurance, and real estate 1,033 163 25 35(8.6%) (3.5%) (4.0%) (4.3%)
Professional and related services* 3,306 1,466 191 191(27.6%) (31.7%) (30.4%) (23.5%)
Wholesale and retail trade 2,363 1,242 107 143(19.7%) (26.8%) (17.0%) (17.6%)
Personal and related services† 437 169 29 78(3.7%) (3.7%) (4.6%) (9.6%)
Construction, transportation, 1,722 363 114 198communication, and public utilities (14.4%) (7.9%) (18.1%) (24.4%)
Agriculture, forestry, fisheries, 103 89 70 107and mining (0.9%) (1.9%) (11.1%) (13.2%)
All 11,969 4,627 629 813(100.0%) (100.0%) (100.0%) (100.0%)
Table 3. Economic Sector Distribution in Cottage Grove and Denmark Township byResidency and Employment Locations, 1990
Source: 1990 Census of Transportation Planning Package, 1990 Census of Population and Housing STF3*This category includes administrative and managerial occupations†This category includes precision production, repair, machine operators, assemblers, inspectors, transportation,material moving, handlers, equipment cleaners, helpers, and laborer occupations‡This category includes administrative support, protective service, private household, and other service occupations
Source: 1990 Census of Transportation Planning Package, 1990 Census of Population and Housing STF3*This category includes business and repair services, health services, educational services, and public administration†This category includes entertainment and recreation services

SEPTEMBER 2000 19
Agriculture indicate that farmland orvacant land has been lost to urbandevelopment at a rate of 3.1% per yearfrom 1982 to 1992, while annual rates
of population growth during that periodwere only 1.5%. These data indicate thetrend toward lower population densitiesfor the region, trends that are also
evident in Cottage Grove and Denmark.Table 4 shows changes in the use of landin both communities. Overall, the cityof Cottage Grove contains about 24,000acres of land, of which about 6,000 acreslie within the MUSA line delineated bythe Metropolitan Council. Denmark isslightly smaller in size with about19,000 acres. Denmark Township hasbeen designated by both WashingtonCounty and the Metropolitan Councilas either permanent agricultural land(mostly the western portion of thetownship) or permanent rural land(mostly the eastern portion of the town-ship along the St. Croix River).
From information provided by theLand Management Information Centerof Minnesota Planning for 1984 and1990, it can be seen that both commu-nities lost considerable agricultural andvacant land to development in just sixyears. Cottage Grove saw a net 6%decline in such land (almost 1,000 acres,or roughly 164 acres lost per year).During this same period, Cottage Groveissued 1,558 building permits for resi-dential construction on 617 acres ofland. Thus, new residential development
Single-family home construction in Cottage Grove increased 29% between 1980and 1990, nearly double the rate in Denmark Township. However, the mean valueof housing in Cottage Grove declined during the same period.
City of Cottage Grove Absolute Percent Mean annual1984 area 1990 area change change change
(acres) (acres) (acres) (acres)
Residential 2,481 3,098 +617 +24.9% +102.8
Commercial and industrial ,792 1,048 +256 +32.3% +42.7
Parks and public, semi-public ,898 ,914 +16 +1.8% +2.7
Agricultural and vacant 17,007 16,025 -982 -5.8% -163.7
Water 2,653 2,708 +55 +2.1% +9.2
Other ,476 ,514 +38 +8.0% +6.3
Total 24,307 24,307 0 ——— 0.0
Denmark Township Absolute Percent Mean annual1984 area 1990 area change change change
(acres) (acres) (acres) (acres)
Residential ,225 ,442 +217 +96.4% +36.2
Commercial and industrial ,045 ,083 +38 +84.4% +6.3
Parks and public, semi-public 1,020 1,081 +61 +6.0% +10.2
Agricultural and vacant 16,518 16,030 -488 -3.0% -81.3
Water 1,207 1,298 +91 +7.5% +15.1
Other ,209 ,290 +81 +38.8% +13.5
Total 19,224 19,224 0 ——— 0.0
Table 4. Changes in Land Use in Cottage Grove and Denmark Township, 1984–1990
Source: Land Management Information Center of Minnesota Planning
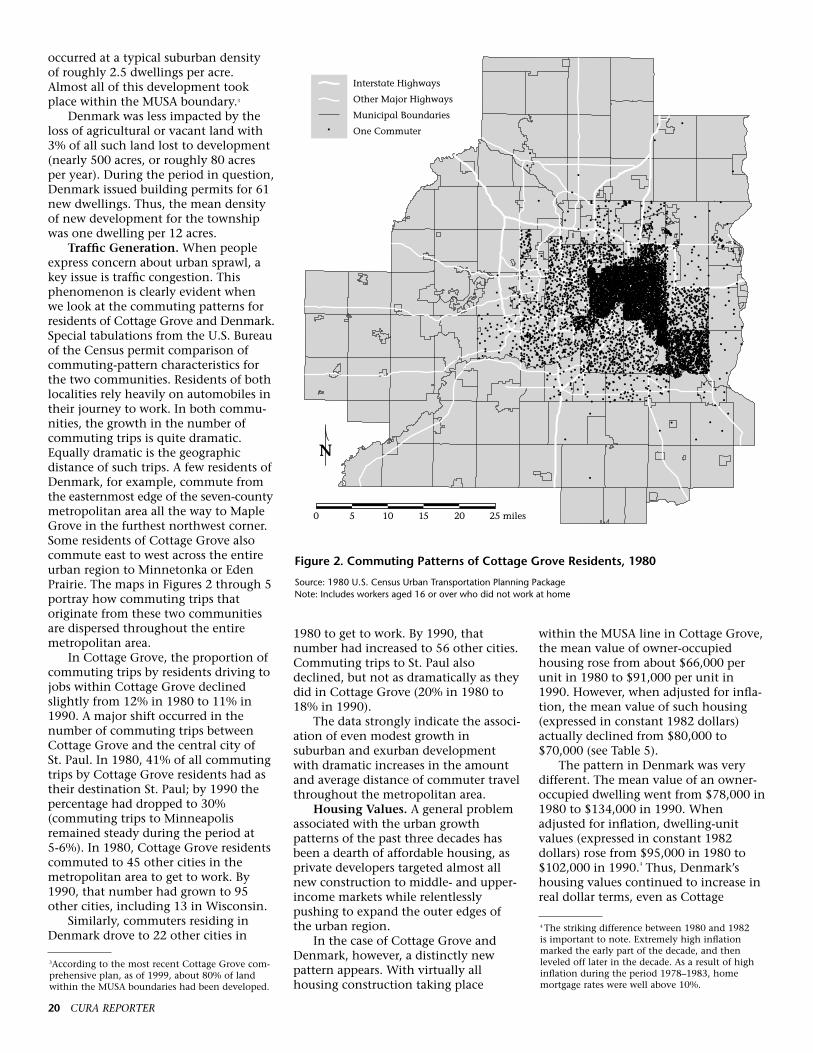
20 CURA REPORTER
occurred at a typical suburban density of roughly 2.5 dwellings per acre.Almost all of this development tookplace within the MUSA boundary.3
Denmark was less impacted by theloss of agricultural or vacant land with3% of all such land lost to development(nearly 500 acres, or roughly 80 acresper year). During the period in question,Denmark issued building permits for 61new dwellings. Thus, the mean densityof new development for the townshipwas one dwelling per 12 acres.
Traffic Generation. When peopleexpress concern about urban sprawl, akey issue is traffic congestion. Thisphenomenon is clearly evident when we look at the commuting patterns for residents of Cottage Grove and Denmark.Special tabulations from the U.S. Bureauof the Census permit comparison ofcommuting-pattern characteristics forthe two communities. Residents of bothlocalities rely heavily on automobiles intheir journey to work. In both commu-nities, the growth in the number ofcommuting trips is quite dramatic.Equally dramatic is the geographicdistance of such trips. A few residents ofDenmark, for example, commute fromthe easternmost edge of the seven-countymetropolitan area all the way to MapleGrove in the furthest northwest corner.Some residents of Cottage Grove alsocommute east to west across the entireurban region to Minnetonka or EdenPrairie. The maps in Figures 2 through 5portray how commuting trips thatoriginate from these two communitiesare dispersed throughout the entiremetropolitan area.
In Cottage Grove, the proportion ofcommuting trips by residents driving tojobs within Cottage Grove declinedslightly from 12% in 1980 to 11% in1990. A major shift occurred in thenumber of commuting trips betweenCottage Grove and the central city of St. Paul. In 1980, 41% of all commutingtrips by Cottage Grove residents had astheir destination St. Paul; by 1990 thepercentage had dropped to 30%(commuting trips to Minneapolisremained steady during the period at5-6%). In 1980, Cottage Grove residentscommuted to 45 other cities in themetropolitan area to get to work. By1990, that number had grown to 95other cities, including 13 in Wisconsin.
Similarly, commuters residing inDenmark drove to 22 other cities in
1980 to get to work. By 1990, thatnumber had increased to 56 other cities.Commuting trips to St. Paul alsodeclined, but not as dramatically as theydid in Cottage Grove (20% in 1980 to18% in 1990).
The data strongly indicate the associ-ation of even modest growth insuburban and exurban developmentwith dramatic increases in the amountand average distance of commuter travelthroughout the metropolitan area.
Housing Values. A general problemassociated with the urban growthpatterns of the past three decades hasbeen a dearth of affordable housing, asprivate developers targeted almost allnew construction to middle- and upper-income markets while relentlesslypushing to expand the outer edges ofthe urban region.
In the case of Cottage Grove andDenmark, however, a distinctly newpattern appears. With virtually allhousing construction taking place
within the MUSA line in Cottage Grove,the mean value of owner-occupiedhousing rose from about $66,000 perunit in 1980 to $91,000 per unit in1990. However, when adjusted for infla-tion, the mean value of such housing(expressed in constant 1982 dollars)actually declined from $80,000 to$70,000 (see Table 5).
The pattern in Denmark was verydifferent. The mean value of an owner-occupied dwelling went from $78,000 in1980 to $134,000 in 1990. Whenadjusted for inflation, dwelling-unitvalues (expressed in constant 1982dollars) rose from $95,000 in 1980 to$102,000 in 1990.4 Thus, Denmark’shousing values continued to increase inreal dollar terms, even as Cottage
3According to the most recent Cottage Grove com-prehensive plan, as of 1999, about 80% of landwithin the MUSA boundaries had been developed.
0 25 miles10 15 205
Interstate Highways
Other Major Highways
Municipal Boundaries
One Commuter
Figure 2. Commuting Patterns of Cottage Grove Residents, 1980
Source: 1980 U.S. Census Urban Transportation Planning PackageNote: Includes workers aged 16 or over who did not work at home
4 The striking difference between 1980 and 1982is important to note. Extremely high inflationmarked the early part of the decade, and thenleveled off later in the decade. As a result of highinflation during the period 1978–1983, homemortgage rates were well above 10%.

SEPTEMBER 2000 21
Grove’s were declining. This evidencefurther indicates the transformation ofDenmark from a rural to an exurbancommunity.
Fiscal Impacts. Urban sprawl is alsoassociated with growing strain on state,county, and local government budgets.Cottage Grove, with all the marks of agrowing suburb, had significant fiscalproblems during the period studied.Denmark, in contrast, experienced virtu-ally no financial strain.
Tax rates can vary considerably, evenwithin the same municipality. Thisproved to be true in Cottage Grove, acity affected by taxing jurisdictionsbeyond its control. Within CottageGrove, tax rates differ not only becauseof differences between urban and ruraltaxing districts, but also because ofdiffering tax rates of school districts andother taxing jurisdictions within cityboundaries. In 1995, the differencebetween the highest and lowest overalltax rates in Cottage Grove translated
into a tax differential of $165 per yearon a $100,000 house.
Cottage Grove belongs to two separate school districts. The first—which encompasses most of the city—experienced rapidly increasing studentpopulations, even though CottageGrove itself experienced only moderategrowth. However, the school districtalso services the city of Woodbury,which is one of the most rapidlygrowing municipalities in the TwinCities area.5 The second school district isslower growing, and only a small part ofit lies within Cottage Grove. The part ofCottage Grove in the rapid-growthschool district required 19% of the locallevy for debt service in 1995, whereasthe part in the low-growth districtrequired only 6% for debt service.
Denmark Township has, for themost part, escaped the problems experi-enced by Cottage Grove, in part becauseof the different services that areprovided by cities and townships. Townships are unincorporated.Consequently, a good deal of localservices in Denmark are provided byWashington County. Traditionally, localroads and bridges have been the focus of
0 25 miles10 15 205
Interstate Highways
Other Major Highways
Municipal Boundaries
One Commuter
Figure 3. Commuting Patterns of Cottage Grove Residents, 1990
Source: 1990 U.S. Census Urban Transportation Planning PackageNote: Includes workers aged 16 or over who did not work at home
Cottage Grove Denmark Township
1980 1990 1980 1990
Occupied housing units 5,127 6,856 319 364
Single-family occupied housing units 4,851 6,261 300 350(one unit in structure, detached)
Multifamily occupied housing units 276 595 19 14
Owner-occupancy rate 94.5% 93.5% 91.2% 91.2%
Mean housing value of owner-occupied units (non-condominium, $66,265 $90,740 $77,774 $133,518 in current dollars)
Median gross rent for renter-occupied housing units (in current dollars) $423 $610 $275 $463
Table 5. Housing Characteristics in Cottage Grove and Denmark Township, 1980and 1990
Source: 1980 and 1990 Census of Population and Housing STF3
5 According to the State of Minnesota demographer,between 1990 and 1995, the city of Woodburygrew from 20,075 to 31,258. This reflects a growthrate of 6% per year, or approximately 2,300 newresidents per year. Building permits have been inthe range of 650 to 700 per year, as opposed to anaverage of 385 units per year in Cottage Grove,whose estimated population for 1995 is 27,726.This reflected a 2% annual rate of growth forCottage Grove, or approximately 950 new peopleper year since 1990.

22 CURA REPORTER
township budgets. In Denmark, thepercentage of the local township levydedicated to roads and bridges has beenconsistently higher than the townshiplevy for general government services.6
However, townships provide very fewother services. Typically, law enforce-ment, libraries, planning, and otherservices are provided by the county, andtownship debt is kept at a minimum.
Low populations, slow growth rates,and access to county services allowtownships to maintain minimalbudgets. All other county residents pickup the tab for whatever growth occursin these areas, and township tax ratesand budgets rarely reflect the full costsof providing local services.
The Overall Context of Develop-ment. Overall, both Denmark andCottage Grove have experienced slow tomoderate rates of growth, yet the type
of growth and its relation to the urbancontext has continually changed.Because part of Cottage Grove is withinthe MUSA line, its growth is moretypical of a suburban community.However, as the analysis of publicfinance documents illustrates, the rapidgrowth of neighboring communities candrastically affect suburbs. A moderatelygrowing community can be overbur-dened with debt and taxes if it shares aschool district with a rapidly growingcommunity. Although Denmark mayseem immune to these conflicts, its rela-tionship to the MUSA line clearly drivesthe type of growth that occurs there aswell. If the MUSA line determines therate of growth that can occur, thencommunities outside the line canattempt to increase their tax basethrough the development of high-income homes. This limited, high-enddevelopment within a high-amenityrural area is typical of exurbia. Both ofthese examples illustrate how the local
and regional context influence qualityand quantity of growth.
Implications for Regional GrowthThere has been surprisingly littleresearch on the exurban phenomenon.One assumption of existing studies thathas served to constrain research aboutthe exurban phenomenon is the ideathat exurban development is basicallyan extension of suburban development.However, the most detailed studies —carried out in Portland, Oregon, and inthe Sierra region of California7—suggestthat the sociological and economicimplications of exurban developmentare more complex. In many respects,exurbanites appear to be escaping notonly the city but also the suburbs insearch of a lifestyle typical of the landedgentry.
A key finding of both the Oregonand California studies was that the newexurbanites have distinctly differentlifestyles than traditional rural residents.Traditional rural residents develop asense of small-town communitythrough participation in local churchesand community organizations. Incomestend to be relatively low, with littlemoney for discretionary or luxuryspending. Exurbanites, on the otherhand, retain close ties with centralurban and suburban job centers, andhave very high incomes and relativelyflexible work schedules. As the authorsof the Oregon study suggest, “Whilerural households depend on resourceexploitation for a living, exurban house-holds flee the city to enjoy unexploitedresources.”8 Traditional rural residentsseek outlets for socializing throughchurches and clubs, while exurbanitesprefer their quiet and privacy.
Indeed, the term hobby farm is oftenused to describe the land occupied byexurbanites. One observer referred tonew developments in the easternborders of Washington County alongthe St. Croix River as “horse subdivi-sions.” Raising wine grapes, engaging insmall-scale vegetable farming, and
0 25 miles10 15 205
Interstate Highways
Other Major Highways
Municipal Boundaries
One Commuter
Figure 4. Commuting Patterns of Denmark Township Residents, 1980
Source: 1980 U.S. Census Urban Transportation Planning PackageNote: Includes workers aged 16 or over who did not work at home
6 In 1988, township road and bridge needs con-sumed nearly 70% of the local levy in Denmark.
7 Judy Davis, Arthur Nelson, and Kenneth Dueker,“The New ‘Burbs: The Exurbs and TheirImplications for Planning Policy,” Journal of theAmerican Planning Association 60 (Winter 1994):45–59; Timothy P. Duane, Shaping the Sierra: Nature,Culture and Conflict in the Changing West (Berkeley,CA: University of California Press, 1999).8In economic terms, this represents the classic dis-tinction between exchange value and use value. Anexchange value perspective views natural resourcesas they might be sold as commodities in a marketplace. A use value perspective attributes value tonatural resources as they exist in situ and undisturbed.

SEPTEMBER 2000 23
pursuing nursery or horticultural inter-ests are also characteristic of hobbyfarmers. Thus, land can be said toremain in agricultural use, but the exur-banite farms part-time as an avocationand not to earn a living. In short, theexurban “farm” is not a commercialenterprise, and it is not intended to be.
Some exurbanites may be pursuinglower taxes, but this does not seem to bea primary motive for taking up theexurban life style. The pursuit of a Jeffer-sonian lifestyle means a greater willing-ness to incur any inconveniencesinherent in exurban living. Because theyrely on private wells and septic tanks,the primary public infrastructuredemand of the exurbanite is access tofreeways. With sufficient income forprivate schools, personal libraries, andother replacements for urban services,exurbanites have a sense of independentself-sufficiency. In short, exurban resi-dents seek a truly country lifestyle,
much in the manner of English countryestates, but with all of the advantages ofurban opportunities. Overall, it appearsthat exurban development requires notonly the addition of a further geographicdistinction, but also the addition of anew urban socio-economic class. A“landed gentry” has emerged for whomeven the suburb poses dissatisfaction.Between 1970 and 1990, DenmarkTownship appears to have become onehome for this new social class.
Exurban development does raisequestions about policies to maintainpermanent agricultural and rural land.These distinctions are set forth in theRegional Blueprint of the MetropolitanCouncil, and are carried forward in thecomprehensive plans for WashingtonCounty and the city of Cottage Grove.The major policy tool available is theimposition of large-lot zoning for bothagricultural and rural areas. For perma-nent agricultural areas, the Metropolitan
Council indicates that it will support adensity of no more than one housingunit per 40 acres. In permanent ruralareas, the recommendation is athreshold of one unit for 10 acres grossdensity (although cluster developmentis encouraged as another means ofprotecting environmentally sensitiveareas).
One additional tool employed by the Metropolitan Council is the Metro-politan Agricultural Preserves Program.Started in 1980, this program offersincentives for farmers to keep their landin agricultural use. Protection and bene-fits continue for 8 years following thedate an expiration notice is filed, soparticipation is time-limited. In 1997,approximately 38% of agricultural landeligible for the program was actuallyenrolled, according to the 1998 Metro-politan Agricultural Preserves Status Report.In Washington County, 69% of landcertified as eligible was enrolled. InCottage Grove, 41% of eligible land(5,400 acres) was enrolled. In DenmarkTownship, 92% of eligible land (2,800acres) was enrolled. However, it shouldbe noted that only 17.5% of Denmark’s16,000 acres of agricultural land wascertified as eligible for the program.9
Given the unusual character ofexurban development, many issues needto be addressed if current policies aimedat protecting permanent agriculturaland rural areas are to be effective. First,it is important to note that at stake inthese policies is not only the protectionof commercial agricultural enterprise,but also the protection of wildlifehabitat, wetlands, forested areas, floodzones, areas prone to erosion, and areassusceptible to groundwater contamina-tion. Husbandry of land thus entailsmore than good farming practices.When exurbanites own and occupymore land than they need, will they bemotivated and able to properly manageit if they work the land on only a part-time basis?
Second, after the initial honeymoonperiod of peaceful, exurban living, howmuch more prominent will the inconve-niences of rural living become, givingrise to a demand for enhanced urbanservices? Third, as the recent influx ofresidents between 45 and 65 begin to
0 25 miles10 15 205
Interstate Highways
Other Major Highways
Municipal Boundaries
One Commuter
Figure 5. Commuting Patterns of Denmark Township Residents, 1990
Source: 1990 U.S. Census Urban Transportation Planning PackageNote: Includes workers aged 16 or over who did not work at home
9On February 2, 2000, Washington County adopted a voluntary transfer-of-development-rightsprogram. Because of its voluntary nature, one critichas suggested that not many farmers are likely toparticipate because many see their farmland as“their 401(k) retirement program.”
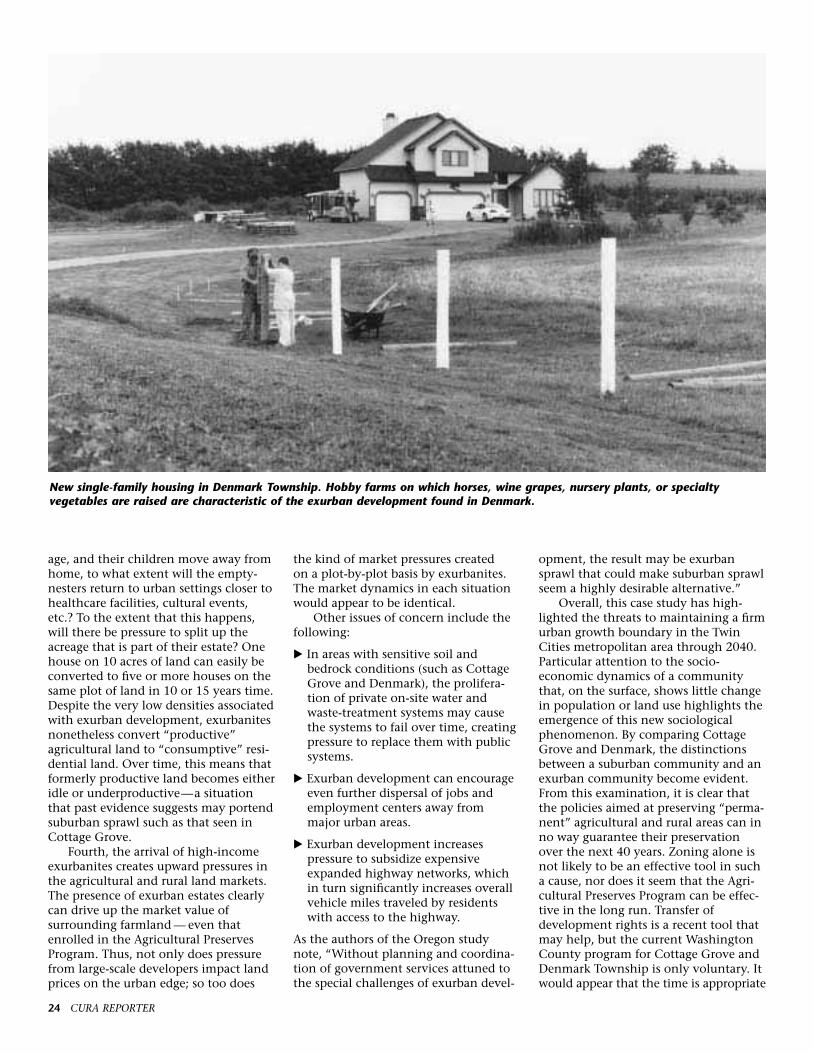
24 CURA REPORTER
age, and their children move away fromhome, to what extent will the empty-nesters return to urban settings closer tohealthcare facilities, cultural events,etc.? To the extent that this happens,will there be pressure to split up theacreage that is part of their estate? Onehouse on 10 acres of land can easily beconverted to five or more houses on thesame plot of land in 10 or 15 years time.Despite the very low densities associatedwith exurban development, exurbanitesnonetheless convert “productive” agricultural land to “consumptive” resi-dential land. Over time, this means thatformerly productive land becomes eitheridle or underproductive—a situationthat past evidence suggests may portendsuburban sprawl such as that seen inCottage Grove.
Fourth, the arrival of high-incomeexurbanites creates upward pressures inthe agricultural and rural land markets.The presence of exurban estates clearlycan drive up the market value ofsurrounding farmland — even thatenrolled in the Agricultural PreservesProgram. Thus, not only does pressurefrom large-scale developers impact landprices on the urban edge; so too does
the kind of market pressures created on a plot-by-plot basis by exurbanites.The market dynamics in each situationwould appear to be identical.
Other issues of concern include thefollowing:
� In areas with sensitive soil and bedrock conditions (such as Cottage Grove and Denmark), the prolifera-tion of private on-site water and waste-treatment systems may cause the systems to fail over time, creating pressure to replace them with public systems.
� Exurban development can encourage even further dispersal of jobs and employment centers away from major urban areas.
� Exurban development increases pressure to subsidize expensive expanded highway networks, which in turn significantly increases overall vehicle miles traveled by residents with access to the highway.
As the authors of the Oregon studynote, “Without planning and coordina-tion of government services attuned tothe special challenges of exurban devel-
opment, the result may be exurbansprawl that could make suburban sprawlseem a highly desirable alternative.”
Overall, this case study has high-lighted the threats to maintaining a firmurban growth boundary in the TwinCities metropolitan area through 2040.Particular attention to the socio-economic dynamics of a communitythat, on the surface, shows little changein population or land use highlights theemergence of this new sociologicalphenomenon. By comparing CottageGrove and Denmark, the distinctionsbetween a suburban community and anexurban community become evident.From this examination, it is clear thatthe policies aimed at preserving “perma-nent” agricultural and rural areas can inno way guarantee their preservationover the next 40 years. Zoning alone isnot likely to be an effective tool in sucha cause, nor does it seem that the Agri-cultural Preserves Program can be effec-tive in the long run. Transfer ofdevelopment rights is a recent tool thatmay help, but the current WashingtonCounty program for Cottage Grove andDenmark Township is only voluntary. Itwould appear that the time is appropriate
New single-family housing in Denmark Township. Hobby farms on which horses, wine grapes, nursery plants, or specialty vegetables are raised are characteristic of the exurban development found in Denmark.

SEPTEMBER 2000 25
Although exurban development is usually low density, it still converts productive agricultural land to consumptive residentialland. In addition, the presence of exurban estates can drive up the market value of surrounding farmland. Over time, these fac-tors can lead to suburban sprawl.
to consider more vigorous public actionin the form of easements, land trusts,and outright purchase of critical areason the urban fringe. Indeed, with onlythe tools that are presently at ourdisposal, the loss of “permanent” ruraland agricultural areas may be closerthan we imagine.
renewal planning for the Boston Redevelopment Authority.
CURA provided support for thisproject in the form of a graduate researchassistant. The project was also funded bythe University of Minnesota ExtensionService. Student assistants whocontributed to the article include Andrew Caddock, Catherine Freeman,Jennifer Gabrys, Hin Kin Lam, Pam Neary,Jacqueline Obst, and Ann Olson.
■ Richard S. Bolan is professor emeritusof planning and public affairs at theHubert H. Humphrey Institute of PublicAffairs. Before joining the Institute in 1985,he was a professor of social planning atBoston College, and edited the Journal ofthe American Institute of Planners. Previ-ously he was on the staff of the JointCenter for Urban Studies at Massachu-setts Institute of Technology (MIT) andHarvard University, and was director of
26 CURA REPORTER
John S. Adams, professor of geog-raphy, planning, and public affairsand chair of the Department ofGeography, has been named to the
first Fesler-Lampert Chair in Urbanand Regional Affairs. Adams’ appoint-ment, which was announced this pastJune, was made by the Dean of theGraduate School and Vice President forResearch Christine Maziar, based onrecommendations from CURA.
“I’m highly honored and gratified tobe associated with [the Fesler family’s]generous support . . . of the University,”Adams replied when asked for his reac-tion to the announcement. “Urban andregional analysis is often unfashionableamong social scientists, but I’ve alwaysfelt that our land-grant university has aspecial mission to help Minnesotansunderstand our state and its place in theregion, the nation, and the world.” Thisendowment, he says, demonstrates thatthe Fesler family “understands thecrucial role of philanthropy in makingcertain work possible that otherwisewould remain undone.”
The Fesler-Lampert Chair in Urbanand Regional Affairs is one of fourendowed chairs and two named profes-sorships made possible through a gen-erous contribution to the University ofMinnesota by David R. and Elizabeth P.Fesler. The Fesler-Lampert Endowmentin Interdisciplinary and GraduateStudies was initially established in 1985through a $1 million grant from theDavid R. Fesler Fund of the Saint PaulFoundation, Inc. The gift was matchedby a $1 million allocation from thePermanent University Fund, and thecombined endowment and matchingfunds have now grown in value to over$9.5 million. The endowment isintended to stimulate interdisciplinaryresearch and teaching through theappointment of distinguished, broadlylearned scholars to endowed facultypositions at the University ofMinnesota.
Tom Scott, director of the Center forUrban and Regional Affairs, calledAdams “the logical and obvious choice
to be the first holder of the Fesler-Lampert Chair. The quality and quantityof his contributions to our under-standing of urban affairs—through hisresearch, teaching, and communityoutreach—are unmatched by anyoneelse at this or most other universities.”Scott noted that Adams’ “entire acad-emic career as a student, teacher, andresearcher has been focused on urbanand regional change,” and praised his“extensive contributions to the Univer-sity, to professional geographers, and tothe broader Minnesota community.”
David Fesler also was pleased whenhe learned of Adams’ appointment. “I took a course from Professor Adamsmany years ago on the geography of theTwin Cities,” he explained, “and Ienjoyed him very much as a teacher.Even though I’m a native of the TwinCities and have lived here all my life, Ilearned a tremendous amount from thatcourse. So when he was selected as thechair, I was elated.” In addition, Feslernoted that Adams is a good choice forthe honor because he has “always beeninvolved in the community” and hasbeen "very active in University affairs,above and beyond his contributions
[in the Humphrey Institute and Department of Geography].”
John Adams has been a professor of geography at the University ofMinnesota for the last 30 years. Hereceived his bachelor’s degree at theUniversity of St. Thomas and hismaster’s degree at the University ofMinnesota before completing his Ph.D.in economic geography at the Univer-sity of Minnesota in 1966. Adams took a position as assistant professor at thePennsylvania State University beforereturning to the University ofMinnesota in 1970 as associate professorin the Department of Geography.During his career, Adams has also taughtas a Fulbright Professor at Moscow StateUniversity and at the Economic Univer-sity of Vienna, and has been a visitingprofessor or lecturer at literally dozensof colleges and universities throughoutEurope, Asia, and North America.
In addition to his many teachingaccomplishments, Adams served as thefirst director of the Hubert H. HumphreyInstitute of Public Affairs from 1976 to1979. He has also directed the UrbanStudies Program in the College ofLiberal Arts, coordinated the HumphreyNorth-South Fellowship Program (aFulbright Exchange program for officialsfrom developing countries), and serveda term as president of the Association ofAmerican Geographers.
Through his research, Adams hascontributed significantly to knowledgeand understanding of urban andregional affairs. He has written, edited,or co-authored over 100 articles, books,and reports on the American city,regional economic development, intra-urban migration, housing markets,urban transportation, and urban devel-opment. His publications include thefour-volume Contemporary MetropolitanAmerica (Ballinger, 1976), A ComparativeAtlas of America’s Great Cities (withRonald Abler and Ki-Suk Lee; Universityof Minnesota Press, 1976), HousingAmerica in the 1980s (Russell Sage Foun-dation, 1987), and The Path of UrbanDecline (with Barbara VanDrasek and
John S. Adams
John Adams Appointed to Fesler-Lampert Chairin Urban and Regional Affairs
SEPTEMBER 2000 27
Laura Lambert; Center for Urban andRegional Affairs, 1995). In addition,Adams has been a regular collaboratorwith CURA as well as a frequent contrib-utor to the CURA Reporter over the past25 years.
Currently, Adams is engaged inresearch with the University ofMinnesota Center for TransportationStudies on land-use and transportationissues in Minnesota’s major urban areas.He says he plans to use the resourcesprovided by his appointment to reviseand update Minneapolis–St. Paul: People,Place and Public Life—a book he co-authored with Barbara VanDrasek andpublished (with help from the Feslerfamily) with the University ofMinnesota Press in 1993—based onpopulation and housing data from the2000 Census. “Much has changed sincethe first edition of that book,” Adamsexplained. "[T]he number of householdsin our area has expanded faster than thehousing stock, raising house prices andrents, and encouraging reinvestment inareas that had been deteriorating forseveral decades. Meanwhile, our first-ring suburbs are showing signs of aging,and property tax collections often arerising more slowly than what communi-ties would like to spend on maintenanceand improvement. At the outer edges ofthe greater Twin Cities region, low-density development adds to congestionon the region’s trunk highway system,fraying nerves and challenging legisla-tors and planners to figure out betterways to foster growth and guide change.These are just a few of the topics andissues facing us as we plan our revision.”Adams added, “Our earlier book helped
many local citizens and leaders under-stand the way this area works. I hopethat the revision will do the same.”
The Fesler-Lampert Endowment isintended as a tribute to David Fesler’sgrandfathers, Bert Fesler and JacobLampert. Despite very different educa-tional backgrounds, David Fesler noted,“they were both extremely interested ineducation.” Bert Fesler graduated fromIndiana University with a degree inichthyology, became a self-taughtlawyer, and then served as a districtcourt judge in Duluth for nearly 30years. In contrast, Jacob Lampert was animmigrant from Switzerland who Feslersaid “never finished fifth grade. But hewas very concerned that his childrenand grandchildren receive a good educa-tion.” Lampert bought a retail lumbermill in 1887 that eventually grew intoLampert Yards, Inc., with lumber yardsthroughout the Midwest.
In addition to the chair in urban and regional affairs, the Fesler-Lampertendowment will be used to fund threeother endowed chairs and two namedprofessorships: The Fesler-Lampert Chairin Ecological/Environmental Economics(Steven Polasky, Applied Economics),The Fesler-Lampert Chair in Humanities(Madelon Sprengnether, English), TheFesler-Lampert Chair in Aging Studies(LaDora Thompson, Physical Medicine& Rehabilitation), The Fesler-LampertProfessor in Humanities (AnatolyLiberman, German, Scandinavian, &Dutch), and another professorship in an area of study yet to be determined.
The Fesler-Lampert Chair in Urbanand Regional Affairs will be funded for a minimum of three years, with each
chairholder appointed for a one-yearperiod. The position will be fundedinitially by $1 million of the Fesler-Lampert endowment which, at thecurrent rate of payout, will provide the chairholder with approximately$55,000 for research, salary, and logis-tical support. The funds will be jointlyadministered by the University ofMinnesota Foundation and the University of Minnesota.
Meet CURA’s New Editor andCommunications CoordinatorThis past June, CURA welcomed aboard Mike Greco, our new publicationseditor and communications coordinator. He takes over the position of editorfrom Judith Weir, who retired in January after 23 years at CURA.
Mike has been a freelance writer and editor for the past eight years, andstarted Dire Wolf Publishing Services in 1994. He has also taught communica-tion studies at the University of North Carolina at Chapel Hill (where he earneda masters degree), the University of Illinois (where he was a doctoral candidate),the General College at the University of Minnesota, and most recently St. OlafCollege.
In addition to editing the Reporter and other CURA publications, Mike willbe responsible for public outreach, media relations, and website development.He can be reached by phone at (612) 625-7501, or by e-mail [email protected].
Credits
Photos on cover, pages 3, 4, 5, 6, 7,and 8 appear courtesy of the MinnesotaHistorical Society.
Photos on pages 16, 19, 24, and 25 byBob Friedman.
Photo on page 26 courtesy of John S.Adams.
All figures prepared by the CartographyLaboratory, Department of Geography,University of Minnesota.
Design by West 44th Street Graphics.
Shirley Bennett RetiresShirley Bennett, who started with CURA some 33 yearsago and for quite a while was CURA’s only staff member,retired from her position as departmental AdministrativeDirector at the end of July. For many years and for manypeople, CURA and Shirley Bennett were synonymous.There is no way to describe adequately the importance ofher role with CURA, nor to express fully our appreciationfor her years of faithful and dedicated service.
Shirley came to the West Bank from West Concord,Minnesota as a teenager, and although she leaves CURA,her heart will remain in the vicinity. Years ago she rodewith the West Bank Motorcycle Club; her more recent rid-ing has been confined to a chair in the local coffee shop.
Her long-term plans are indefinite at the moment, butshe plans to visit friends in Ireland this fall. Shirley is partof CURA’s heritage, and we will miss her!
Conference on NaturalCapitalism and Eco-IndustrialDevelopment, October 4–5“The Greening of Economic Opportunity: At the Firm,Industry, and Community Level,” a conference on naturalcapitalism and eco-industrial development, will be heldOctober 4–5, 2000, at the Earle Brown Center on the St. Paulcampus of the University of Minnesota. The conference willfeature a keynote address by Hunter Lovins, pioneer insustainable development, and workshops by staff of the RockyMountain Institute. Also included will be workshops andpresentations on eco-industrial development by staff of theWork and Environment Initiative at Cornell University. Theconference is co-sponsored locally by CURA, the Green Insti-tute, the Minnesota Pollution Control Agency, and the Officeof Environmental Assistance. For more information, visit theGreen Institute website at http://www.greeninstitute.org orcall (612) 278-7100.
Volume XXX, Number 3 September 2000
CURA connects University faculty and studentswith the people and public institutions workingon significant community issues in Minnesota.CURA helps:
■ faculty and students produce more relevant research on critical issues
■ students strengthen their education through practical experience
■ government agencies and community organizations get the assistance they request
■ the University of Minnesota fulfill its land grant and urban missions
The CURA Reporter is published quarterly to provide information about CURA projects andprograms. This publication is available in alter-nate formats upon request.
Thomas M. Scott, directorWilliam J. Craig, associate director Michael D. Greco, editor
Phone: (612) 625-1551 Fax: (612) 626-0273
E-mail: [email protected] Website: http://www.umn.edu/cura
The University of Minnesota is committed to the policy thatall persons shall have equal access to its programs, facilities,and employment without regard to race, color, creed, religion, national origin, sex, age, marital status, disability,public assistance status, veteran status, or sexual orientation.
Printed with soy-based ink on recycled paper,including 20% post-consumer fiber.t
REPORTER CURAUniversity of Minnesota330 HHH Center301–19th Avenue S.Minneapolis, MN 55455
ADDRESS SERVICE REQUESTED
Nonprofit Org.U.S. Postage
PAIDMinneapolis, MNPermit. No. 155