center for drug evaluation and research · 8 2 introduction . 2.1 overview insulin glargine...
TRANSCRIPT

CENTER FOR DRUG EVALUATION AND RESEARCH
APPLICATION NUMBER: 206538Orig1s000
STATISTICAL REVIEW(S)
U.S. Department of Health and Human Services Food and Drug Administration Center for Drug Evaluation and Research Office of Translational Sciences Office of Biostatistics
S T A T I S T I C A L R E V I E W A N D E VA L U A T I O N CLINICAL STUDIES
NDA/BLA #: NDA 206538
Drug Name: HOE901-U300 (insulin glargine 300 U/mL)
Indication(s): To improve glycemic control in adults with diabetes mellitus
Applicant: Sanofi-Aventis
Date(s): Stamp date: 4/25/2014
Review Priority: Standard
Biometrics Division: Division of Biometrics II
Statistical Reviewer: Anna Kettermann, Dipl. Math, MA
Concurring Reviewers: Mark Rothmann, Ph.D., Statistical Team Leader
Thomas Permutt, Ph.D., Division Director
Medical Division: Division of Metabolism and Endocrinology Products
Clinical Team: Tania Condarco, M.D., Medical Officer
Lisa Yanoff, M.D., Medical Team Leader
Project Manager: Richard Whitehead
Keywords: NDA reviews, clinical studies, mixed models, endpoint
analysis/LOCF
Reference ID: 3692426
2
Table of Contents 1 EXECUTIVE SUMMARY .................................................................................................... 6
2 INTRODUCTION .................................................................................................................. 8
2.1 OVERVIEW .......................................................................................................................... 8 2.2 DATA SOURCES ................................................................................................................ 11
3 STATISTICAL EVALUATION ......................................................................................... 12
3.1 DATA AND ANALYSIS QUALITY ........................................................................................ 12 3.2 EVALUATION OF EFFICACY ............................................................................................... 12
3.2.1 Study Design and Endpoints ..................................................................................... 12 3.2.2 Statistical Methodologies .......................................................................................... 17 3.2.3 Patient Disposition, Demographic and Baseline Characteristics ............................ 20 3.2.4 Results and Conclusions ........................................................................................... 23
3.3 EVALUATION OF SAFETY .................................................................................................. 39
4 FINDINGS IN SPECIAL/SUBGROUP POPULATIONS ............................................... 39
4.1 GENDER, RACE, AGE, AND GEOGRAPHIC REGION ............................................................ 39
5 SUMMARY AND CONCLUSIONS................................................................................... 40
5.1 STATISTICAL ISSUES ......................................................................................................... 40 5.2 LABELING RECOMMENDATIONS ....................................................................................... 41
APPENDIX A .............................................................................................................................. 42
APPENDIX B .............................................................................................................................. 44
Reference ID: 3692426
3
LIST OF TABLES Table 1. List of all studies included in analysis ............................................................................ 10 Table 2. Racial distribution of patients with diabetes in the US ................................................... 16 Table 3. Demographic data ........................................................................................................... 21 Table 4. Missing data EFC11628.................................................................................................. 24 Table 5. Missing data EFC11629.................................................................................................. 24 Table 6. Missing data EFC12347.................................................................................................. 25 Table 7. Missing data EFC12456.................................................................................................. 26 Table 8. Primary Analysis study EFC11628................................................................................. 30 Table 9. Primary Analysis study EFC11629................................................................................. 31 Table 10. Primary Analysis study EFC12347............................................................................... 32 Table 11. Primary Analysis study EFC12456............................................................................... 33 Table 12. Primary Analysis study EFC12456............................................................................... 34 Table 13. Hypoglycemia ............................................................................................................... 35 Table 14. Nocturnal Hypoglycemia .............................................................................................. 36 Table 15. Sub-study EFC11628 .................................................................................................... 38 Table 16. Sub-study EFC11629 .................................................................................................... 39 Table 17. Subgroup analysis by age ............................................................................................. 44 Table 18. Subgroup analysis by gender ........................................................................................ 45 Table 19. Subgroup analysis by race ............................................................................................ 46 Table 20. Subgroup analysis by geographic region ...................................................................... 47
Reference ID: 3692426

4
LIST OF FIGURES Figure 1. A schematic description of the submission ..................................................................... 9 Figure 2. Studies EFC11628 and EFC11629 ................................................................................ 13 Figure 3. Study EFC12347 ........................................................................................................... 14 Figure 4. Study EFC12456 ........................................................................................................... 14 Figure 5. Racial distribution within each study ............................................................................ 15 Figure 6. Age-Adjusted Percentage of Civilian, Noninstitutionalized Population with Diagnosed Diabetes, by Race, United States, 1980–2011 (CDC) .................................................................. 16 Figure 7. Distributions of HbA1c ................................................................................................. 22 Figure 8. Baseline age by trial arm ............................................................................................... 23 Figure 9. Kaplan-Meier plot EFC11628 ....................................................................................... 42 Figure 10. Kaplan-Meier plot EFC11629 ..................................................................................... 42 Figure 11. Kaplan-Meier plot EFC12347 ..................................................................................... 43 Figure 12. Kaplan-Meier plot EFC12456 ..................................................................................... 43
Reference ID: 3692426

5
List of Abbreviations AHA: antihyperglycemic agents ANCOVA: analysis of covariance BMI: body mass index CDC: Centers for Disease Control and Prevention CGM: continuous glucose monitoring CI: confidence interval CMH: Cochran-Mantel-Haenszel CSR: clinical study report FPG: fasting plasma glucose HbA1c: glycated hemoglobin A1C IMP: investigational medicinal product IQR: interquartile range LOCF: Last Observation Carried Forward mITT: Modified intention-to-treat MMRM: Mixed Model with Repeated Measurements OAD: oral antihyperglycemic drugs SAP: statistical analysis plan SD: standard deviation SE: standard error SMPG: self-monitored plasma glucose T1DM: type 1 diabetes mellitus T2DM: type 2 diabetes mellitus
Reference ID: 3692426


8
2 INTRODUCTION 2.1 Overview Insulin glargine (HOE901-U300) is indicated in diabetes mellitus where treatment with insulin is required. Insulin glargine, like human insulin, acts via the human insulin receptor system. The primary activity of insulin, including insulin glargine, is regulation of glucose metabolism. The submission is based on results from the main 6-month on-treatment period of 4 multinational, open-label, randomized, controlled, Phase 3 studies in patients with T1DM (EFC12456) and T2DM (EFC11628, EFC11629 and EFC12347). In these Phase 3 studies, the objectives were to demonstrate that HOE901-U300 is as effective as Lantus in terms of HbA1c reduction. This submission contains data on all subjects/patients exposed to HOE901-U300 in completed studies or completed 6-month main study periods (EFC11628, EFC11629, EFC12347 and EFC12456) and the 16-week exploratory CGM study PDY12777. The study PDY12777 is not covered in this review. The Phase 3 program included 4 pivotal Phase 3 studies to assess the efficacy and safety of HOE901-U300 in patients with T1DM and T2DM; EFC11628, EFC11629 and EFC12347 in T2DM and study EFC12456 in T1DM. These studies were designed as randomized, controlled studies in a broad range of patient populations requiring insulin treatment, including insulin-naïve patients with T2DM not adequately controlled on non-insulin AHA (EFC12347) or insulin-pretreated T2DM patients, where the basal insulin was given in combination with mealtime insulin (EFC11628) or in combination with OADs (EFC11629) or patients with T1DM (EFC12456). The comparator in all studies was Lantus (insulin glargine 100 U/mL). Results from two 3-month administration sub-studies embedded in the extension periods of studies EFC11628 and EFC11629 in patients with T2DM are submitted in support of the efficacy and safety of HOE901-U300 when administered at intervals up to 3 hours earlier or later than the patient’s usual 24-hour injection interval. The sponsor presented efficacy data by study for the 4 Phase 3 studies. The results of pooled analysis of studies EFC11629 and EFC12347 in T2DM were also presented. Regarding pooled analysis, the sponsor states the following “Pooling efficacy data from the 4 Phase 3 studies was not considered appropriate due to differences between studies in the insulin regimens (basal insulin in combination with mealtime insulin or in combination with non-insulin AHA), and in the type of diabetes mellitus.” A schematic description of the submission is presented below.
Reference ID: 3692426

9
Figure 1. A schematic description of the submission The study population consisted of adult patients at least 18 years of age with a screening HbA1c in the range of ≥7.0 to ≤10.0% for insulin-pretreated patients (EFC11628, EFC11629, EFC12456) and ≥7.0 to ≤11.0% in insulin-naïve patients (EFC12347). Patients with T1DM had to be on basal insulin in combination with a mealtime insulin for at least one year, insulin-naïve T2DM patients had to have a known history of T2DM for at least one year and pretreatment with non-insulin AHA for 6 months (EFC12347), T2DM patients pretreated with basal insulin in combination with OAD had to be receiving this insulin regimen for at least 6 months (EFC11629), and patients with T2DM on basal insulin in combination with a mealtime insulin had to be on this regimen for at least 1 year (EFC11628). In studies EFC11628 and EFC11629 in T2DM patients pretreated with basal insulin, the daily basal insulin dose had to be at least 42 U.
Pivotal studies
EFC11628
T2DM T1DM
EFC11629 (combination with OAD)
EFC12347 (insulin naïve combination w/non-insulin AHA)
EFC12456 (morning and evening)
Sub-study dosing 24±3 hrs
Sub-study dosing 24±3 hrs
Reference ID: 3692426

10
The description of each trial is presented below: Table 1. List of all studies included in analysis Phase
and Design
Treatment Period
Region Randomization
# of Subjects per Arm
Study Population
EFC
1245
6
Phase 3 multicenter, open-label, parallel group design
6 months North America, Europe, Japan
1:1:1:1 HOE901-U300 morning injection HOE901-U300 evening injection Lantus morning injection Lantus evening injection
HOE901-U300: 274 Lantus: 275
T1DM on basal insulin in combination with mealtime insulin analog
EFC
1162
8 Phase 3 multicenter, open-label, parallel group design
6 months North America, South America, Europe, South Africa
1:1 HOE901-U300 Lantus
HOE901-U300: 404 Lantus: 403
T2DM on basal insulin in combination with mealtime insulin analog
EFC
1162
8 su
b-st
udy
3 months (Month 6 – Month 9 extension period)
1:1 at fixed 24-hour intervals at intervals of 24±3 hours
Fixed intervals: 53 Adaptable intervals: 56
Patients randomized and treated with HOE901-U300 during the main study period
EFC
1162
9 Phase 3 multicenter, open-label, parallel group design
6 months North America, South America, Europe, South Africa
1:1 HOE901-U300 Lantus
HOE901-U300: 404 Lantus: 407
T2DM on basal insulin in combination with OAD
EFC
1162
9 su
b-st
udy
3 months (Month 6 – Month 9 extension period)
1:1 at fixed 24-hour intervals at intervals of 24±3 hours
Fixed intervals: 44 Adaptable intervals: 45
Patients randomized and treated with HOE901-U300 during the main study period
EFC
1234
7
Phase 3 multicenter, open-label, parallel group design
6 months North America, Europe, Japan
1:1 HOE901-U300 Lantus
HOE901-U300: 439 Lantus: 439
Insulin-naïve T2DM not adequately controlled on non-insulin AHA
Reference ID: 3692426

11
2.2 Data Sources Overview documents: \\cdsesub1\evsprod\NDA206538\0000\m2\25-clin-over\ clinical-overview.pdf \\cdsesub1\evsprod\NDA206538\0000\m2\27-clin-sum\summary-clin-efficacy-diabetes.pdf Labeling: \\cdsesub1\evsprod\NDA206538\0000\m1\us\annotatedpi.pdf Statistical analysis plan (SAP): \\CDSESUB1\evsprod\NDA206538\0000\m5\53-clin-stud-rep\535-rep-effic-safety-stud\diabetes\5351-stud-rep-contr\efc11628\efc11628-16-1-9-sap.pdf \\CDSESUB1\evsprod\NDA206538\0000\m5\53-clin-stud-rep\535-rep-effic-safety-stud\diabetes\5351-stud-rep-contr\efc11628-ss\efc11628-16-1-9-sap.pdf \\CDSESUB1\evsprod\NDA206538\0000\m5\53-clin-stud-rep\535-rep-effic-safety-stud\diabetes\5351-stud-rep-contr\efc11629\efc11629-16-1-9-sap.pdf \\CDSESUB1\evsprod\NDA206538\0000\m5\53-clin-stud-rep\535-rep-effic-safety-stud\diabetes\5351-stud-rep-contr\efc11629-ss\efc11629-16-1-9-sap.pdf \\CDSESUB1\evsprod\NDA206538\0000\m5\53-clin-stud-rep\535-rep-effic-safety-stud\diabetes\5351-stud-rep-contr\efc12347\efc12347-16-1-9-sap.pdf \\CDSESUB1\evsprod\NDA206538\0000\m5\53-clin-stud-rep\535-rep-effic-safety-stud\diabetes\5351-stud-rep-contr\efc12456\efc12456-16-1-9-sap.pdf Efficacy reports: \\CDSESUB1\evsprod\NDA206538\0000\m5\53-clin-stud-rep\535-rep-effic-safety-stud\diabetes\5351-stud-rep-contr\efc11628\efc11628-15-2-eff-data.pdf \\CDSESUB1\evsprod\NDA206538\0000\m5\53-clin-stud-rep\535-rep-effic-safety-stud\diabetes\5351-stud-rep-contr\efc11629\efc11629-15-2-eff-data.pdf \\CDSESUB1\evsprod\NDA206538\0000\m5\53-clin-stud-rep\535-rep-effic-safety-stud\diabetes\5351-stud-rep-contr\efc12347\efc12347-15-2-eff-data.pdf \\CDSESUB1\evsprod\NDA206538\0000\m5\53-clin-stud-rep\535-rep-effic-safety-stud\diabetes\5351-stud-rep-contr\efc12456\efc12456-15-2-eff-data.pdf Electronic analysis datasets: \\CDSESUB1\evsprod\NDA206538\0000\m5\datasets\efc11628\analysis\legacy\datasets \\CDSESUB1\evsprod\NDA206538\0000\m5\datasets\efc11628-ss\analysis\legacy\datasets \\CDSESUB1\evsprod\NDA206538\0000\m5\datasets\efc11629\analysis\legacy\datasets \\CDSESUB1\evsprod\NDA206538\0000\m5\datasets\efc11629-ss\analysis\legacy\datasets \\CDSESUB1\evsprod\NDA206538\0000\m5\datasets\efc12347\analysis\legacy\datasets \\CDSESUB1\evsprod\NDA206538\0000\m5\datasets\efc12456\analysis\legacy\datasets
Reference ID: 3692426

12
SAS codes: \\cdsesub1\evsprod\NDA206538\0000\m5\datasets\efc11628\analysis\legacy\programs \\cdsesub1\evsprod\NDA206538\0003\m5\datasets\efc11628-ss\analysis\legacy\programs \\cdsesub1\evsprod\NDA206538\0000\m5\datasets\efc11629\analysis\legacy\programs \\cdsesub1\evsprod\NDA206538\0003\m5\datasets\efc11629-ss\analysis\legacy\programs \\cdsesub1\evsprod\NDA206538\0003\m5\datasets\ efc12347\analysis\legacy\programs \\cdsesub1\evsprod\NDA206538\0003\m5\datasets\ efc12347\analysis\legacy\programs 3 STATISTICAL EVALUATION 3.1 Data and Analysis Quality This submission is in electronic common technical document (eCTD) format. Study datasets were provided as SAS XPORT transport files. The analysis datasets were joinable by unique identifier (SUBJID). The datasets were in good organization. Define.pdf file was clear enough. The reported analysis results were in good quality. The reviewer’s analysis on the primary and secondary efficacy endpoints gives approximately the same results as those reported in the clinical study report (CSR). The submission included SAPs for each of the studies. 3.2 Evaluation of Efficacy
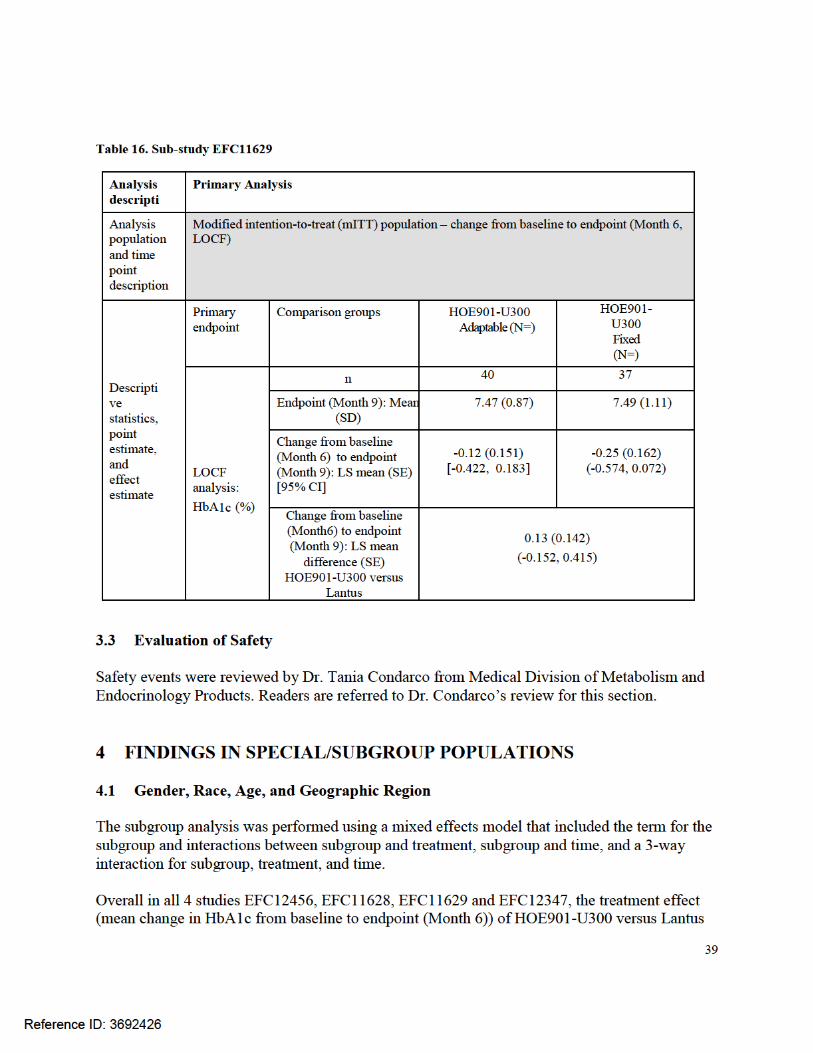
3.2.1 Study Design and Endpoints The studies utilized a common core protocol that standardized most aspects of the study design, including the comparator Lantus (insulin glargine 100 U/mL). The sample sizes were determined by sponsor for the 4 pivotal Phase 3 studies with 99% power to detect differences of 0.4% in the change in HbA1c from baseline to week 26 (month 6) between HOE901-U300 and Lantus. This calculation assumed a common standard deviation of 1.3%. I recalculated the sample size and arrived at the number that was close to the number provided by the sponsor, i.e. my sample size was n=390 per group. The primary efficacy endpoint for all four main studies was change from baseline to Month 6 in HbA1c. A stepwise closed testing approach was used. The first endpoint was the noninferiority which was tested with a noninferiority margin of 0.4% HbA1c. The second primary endpoint was superiority of HOE901-U300 over Lantus. The second primary endpoint was tested only if noninferiority was demonstrated. The primary endpoints (month 6) were examined using one-sided test at level α = 0.025. In the two substudies during the extension periods of EFC11628 and EFC11629 comparing adaptable versus fixed dosing intervals, the primary endpoint was the mean change in HbA1c from Month 6 (= baseline of substudy) to Month 9 (= endpoint of substudy) of the main study.
Reference ID: 3692426
13
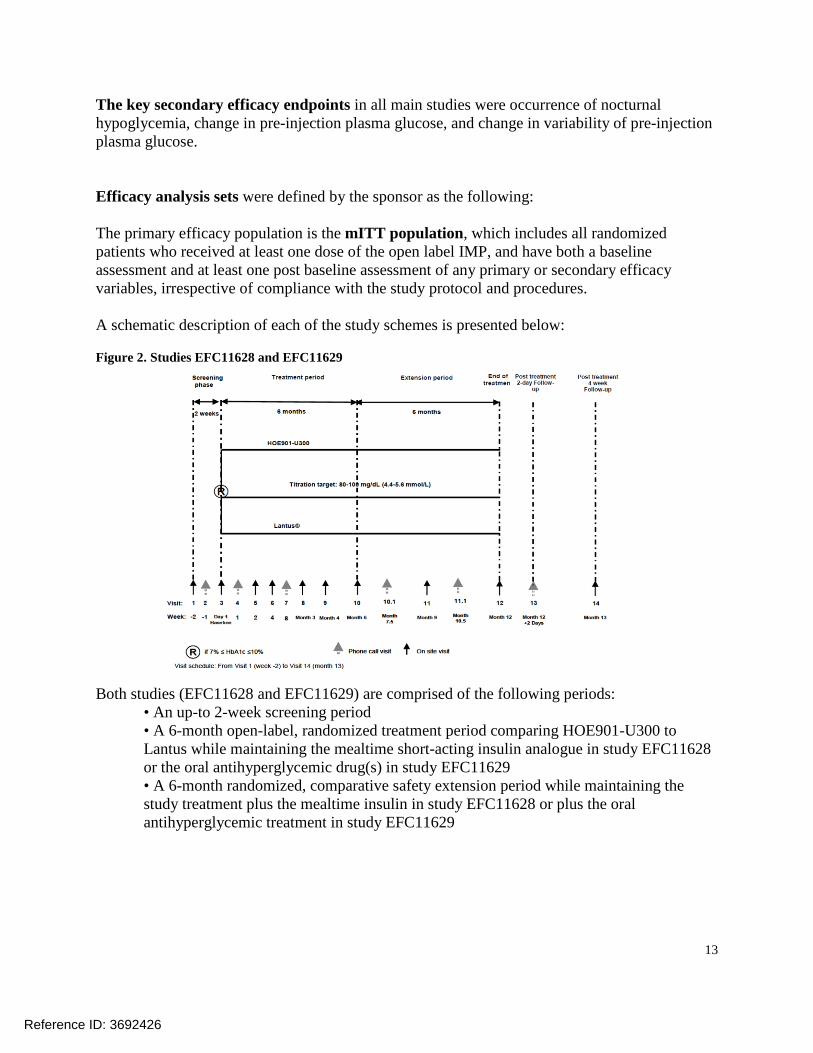
The key secondary efficacy endpoints in all main studies were occurrence of nocturnal hypoglycemia, change in pre-injection plasma glucose, and change in variability of pre-injection plasma glucose. Efficacy analysis sets were defined by the sponsor as the following: The primary efficacy population is the mITT population, which includes all randomized patients who received at least one dose of the open label IMP, and have both a baseline assessment and at least one post baseline assessment of any primary or secondary efficacy variables, irrespective of compliance with the study protocol and procedures. A schematic description of each of the study schemes is presented below: Figure 2. Studies EFC11628 and EFC11629
Both studies (EFC11628 and EFC11629) are comprised of the following periods:
• An up-to 2-week screening period • A 6-month open-label, randomized treatment period comparing HOE901-U300 to Lantus while maintaining the mealtime short-acting insulin analogue in study EFC11628 or the oral antihyperglycemic drug(s) in study EFC11629 • A 6-month randomized, comparative safety extension period while maintaining the study treatment plus the mealtime insulin in study EFC11628 or plus the oral antihyperglycemic treatment in study EFC11629
Reference ID: 3692426
14
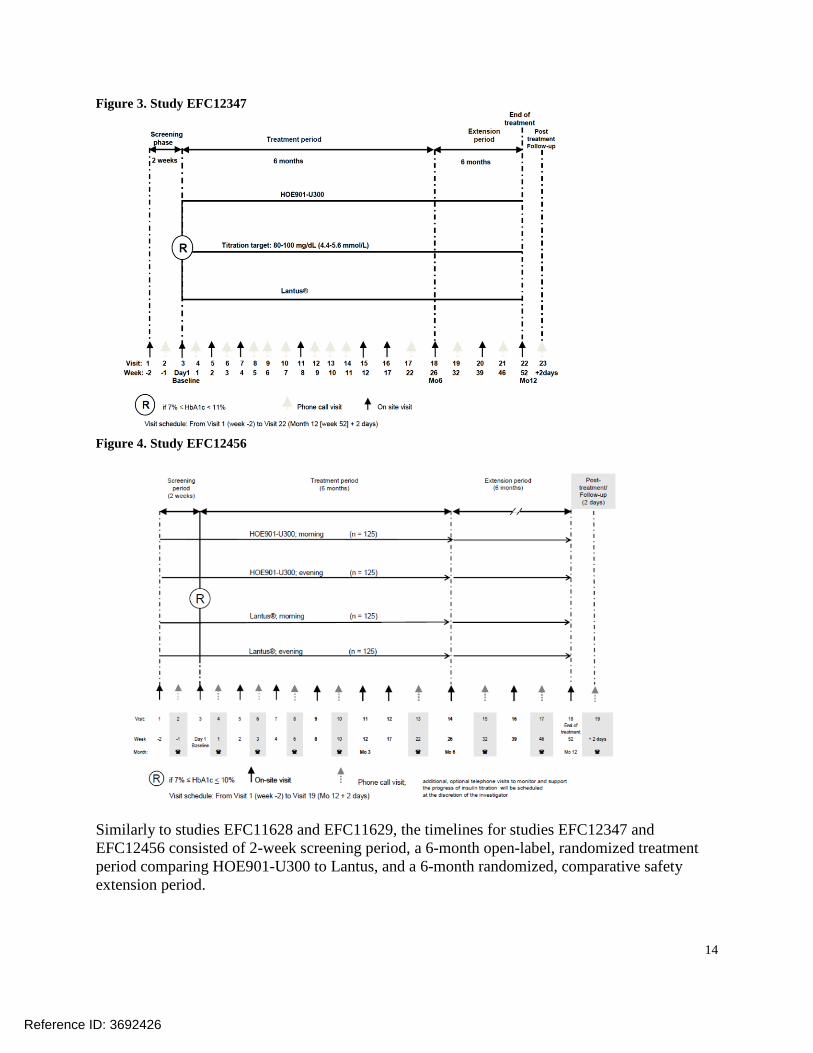
Figure 3. Study EFC12347
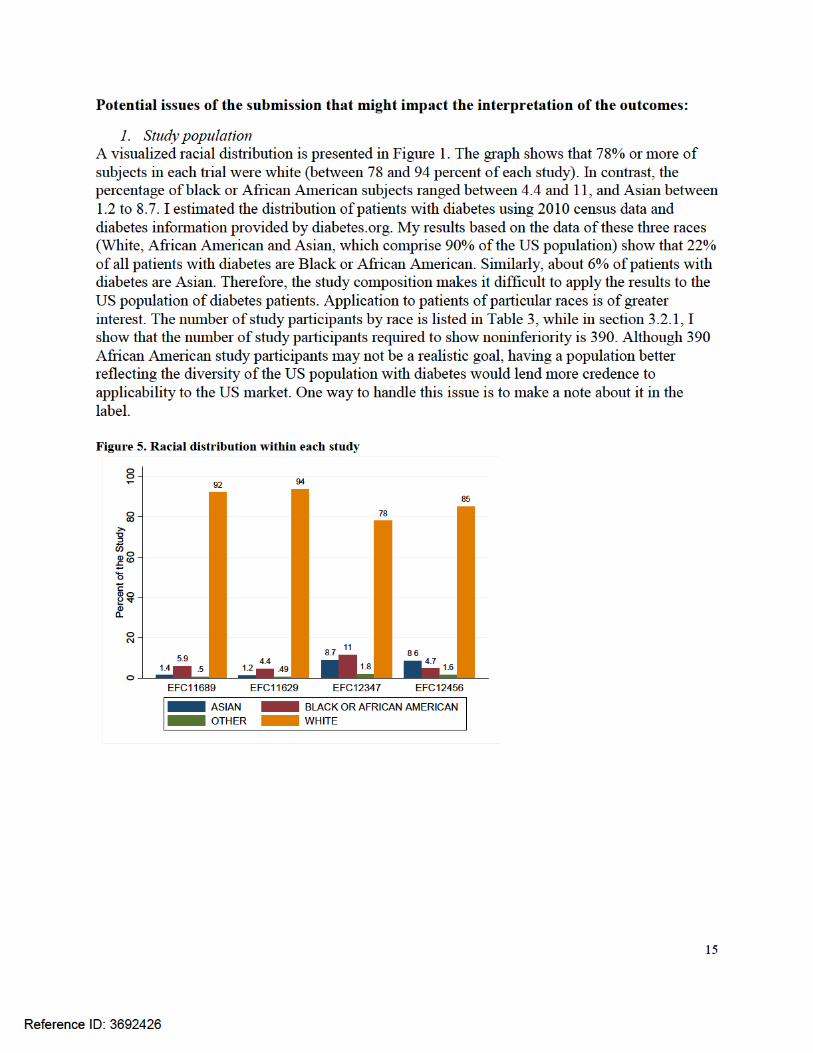
Figure 4. Study EFC12456
Similarly to studies EFC11628 and EFC11629, the timelines for studies EFC12347 and EFC12456 consisted of 2-week screening period, a 6-month open-label, randomized treatment period comparing HOE901-U300 to Lantus, and a 6-month randomized, comparative safety extension period.
Reference ID: 3692426
16
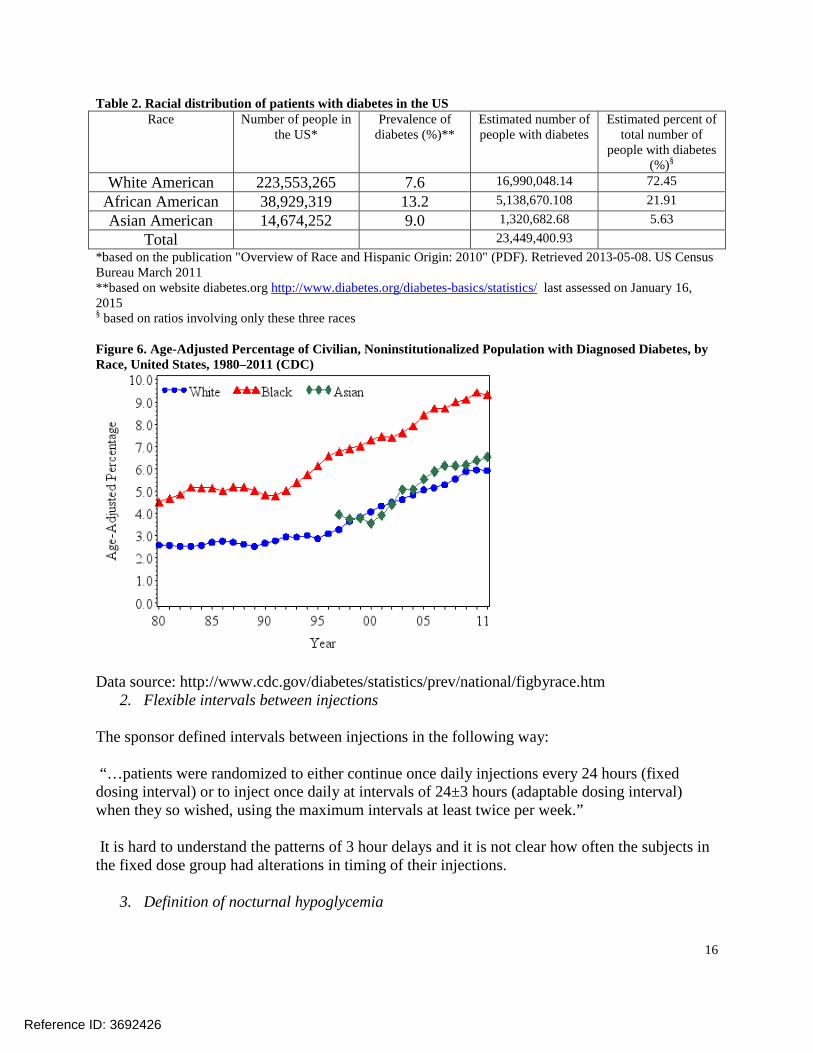
Table 2. Racial distribution of patients with diabetes in the US Race Number of people in
the US* Prevalence of
diabetes (%)** Estimated number of people with diabetes
Estimated percent of total number of
people with diabetes (%)§
White American 223,553,265 7.6 16,990,048.14 72.45 African American 38,929,319 13.2 5,138,670.108 21.91 Asian American 14,674,252 9.0 1,320,682.68 5.63
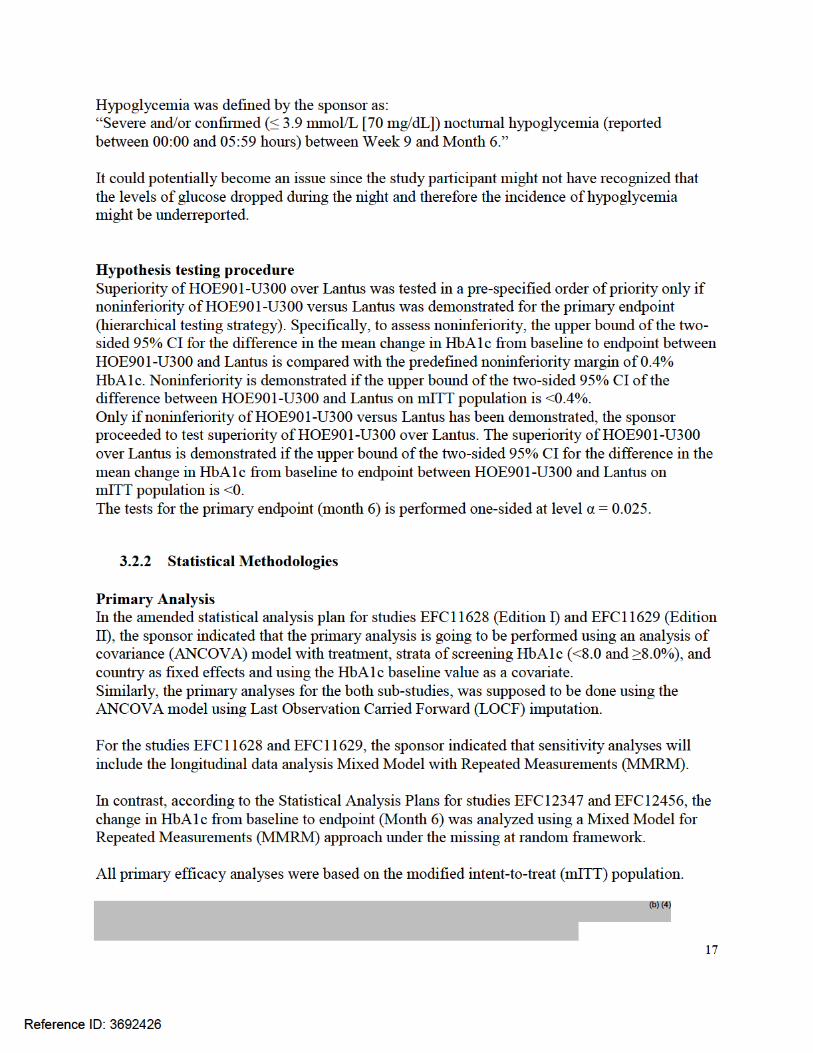
Total 23,449,400.93 *based on the publication "Overview of Race and Hispanic Origin: 2010" (PDF). Retrieved 2013-05-08. US Census Bureau March 2011 **based on website diabetes.org http://www.diabetes.org/diabetes-basics/statistics/ last assessed on January 16, 2015 § based on ratios involving only these three races Figure 6. Age-Adjusted Percentage of Civilian, Noninstitutionalized Population with Diagnosed Diabetes, by Race, United States, 1980–2011 (CDC)
Data source: http://www.cdc.gov/diabetes/statistics/prev/national/figbyrace.htm
2. Flexible intervals between injections The sponsor defined intervals between injections in the following way: “…patients were randomized to either continue once daily injections every 24 hours (fixed dosing interval) or to inject once daily at intervals of 24±3 hours (adaptable dosing interval) when they so wished, using the maximum intervals at least twice per week.” It is hard to understand the patterns of 3 hour delays and it is not clear how often the subjects in the fixed dose group had alterations in timing of their injections.
3. Definition of nocturnal hypoglycemia
Reference ID: 3692426
18
The sponsor provided datasets that included indicator variables for the observations utilized in LOCF analysis in all main studies. The observations used in MMRM analyses were identified by the sponsor only in studies EFC12347 and EFC12456. Similarly, the sponsor provided SAS codes for longitudinal data analyses only for those two studies. I performed my own MMRM analysis for the studies EFC11628 and EFC11629. My results were close to the results provided by the sponsor. I was also able to verify all LOCF analyses. A stepwise closed testing approach was used for the primary efficacy variable to assess noninferiority and superiority sequentially:
• Step 1 proceeds to assess noninferiority of HOE901-U300 versus Lantus. Non-inferiority is demonstrated if the upper bound of the two-sided 95% CI of the difference between HOE901-U300 and Lantus on mITT population is <0.4%. • Only if noninferiority of HOE901-U300 versus Lantus has been demonstrated, step 2 is proceeded to test superiority of HOE901-U300 over Lantus. The superiority of HOE901-U300 over Lantus is demonstrated if the upper bound of the two-sided 95% CI for the difference in the mean change in HbA1c from baseline to endpoint between HOE901-U300 and Lantus on mITT population is <0.
The tests for the primary endpoint (month 6) is performed one-sided at level α= 0.025. Secondary efficacy analysis The main secondary objectives of these two studies are to compare HOE901-U300 and Lantus in terms of:
• occurrence of nocturnal hypoglycemia; Endpoint: proportion of patients with at least one nocturnal hypoglycemia between start of week 9 and endpoint (month 6), indicated as severe and/or confirmed by plasma glucose ≤ 70 mg/dL (3.9 mmol/L) that occurred between 00:00 and 05:59 hours, is analyzed as the first main secondary endpoint on the mITT population. The analysis was performed using Cochran-Mantel-Haenszel (CMH) method with treatment as a factor and stratified on strata of screening HbA1c (<8.0 and ≥8.0%).
• change in pre-injection plasma glucose; The analysis was performed using an ANCOVA model with treatment, strata of screening HbA1c (<8.0 and ≥8.0%), and country as fixed effects and using the pre-injection SMPG baseline value as a covariate.
• change in variability of pre-injection plasma glucose; The analysis was performed using an analysis of variance (ANOVA) model with treatment, strata of screening HbA1c (<8.0 and ≥8.0%), and country as fixed effects.
Additional secondary objectives include: • a comparison of HOE901-U300 and Lantus in terms of reaching target HbA1c values and controlled plasma glucose (all and reaching target without hypoglycemia); • a comparison of HOE901-U300 and Lantus in terms of treatment satisfaction of patients with T2DM;
Reference ID: 3692426

19
• a comparison of HOE901-U300 and Lantus in terms of the frequency of occurrence and diurnal distribution of hypoglycemia (symptomatic, asymptomatic, nocturnal, severe, probable and relative); • an assessment of the safety and tolerability (including development of anti-insulin antibodies) of HOE901-U300.
Statistical analysis issues:
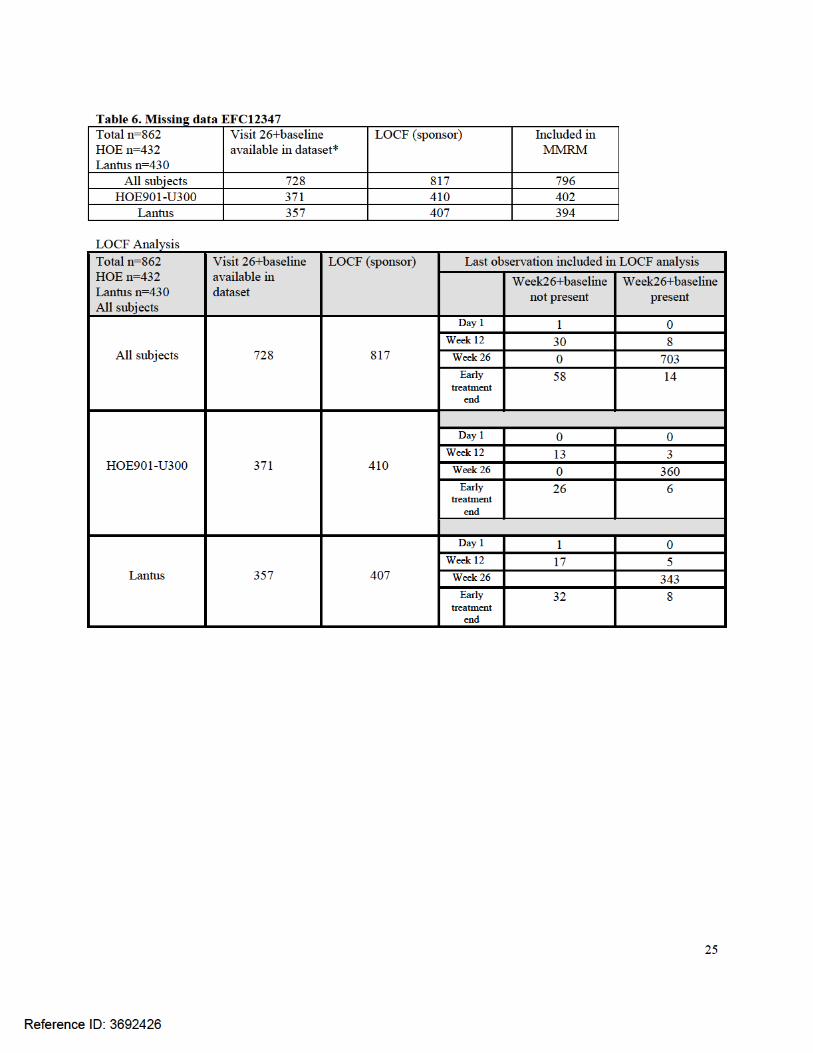
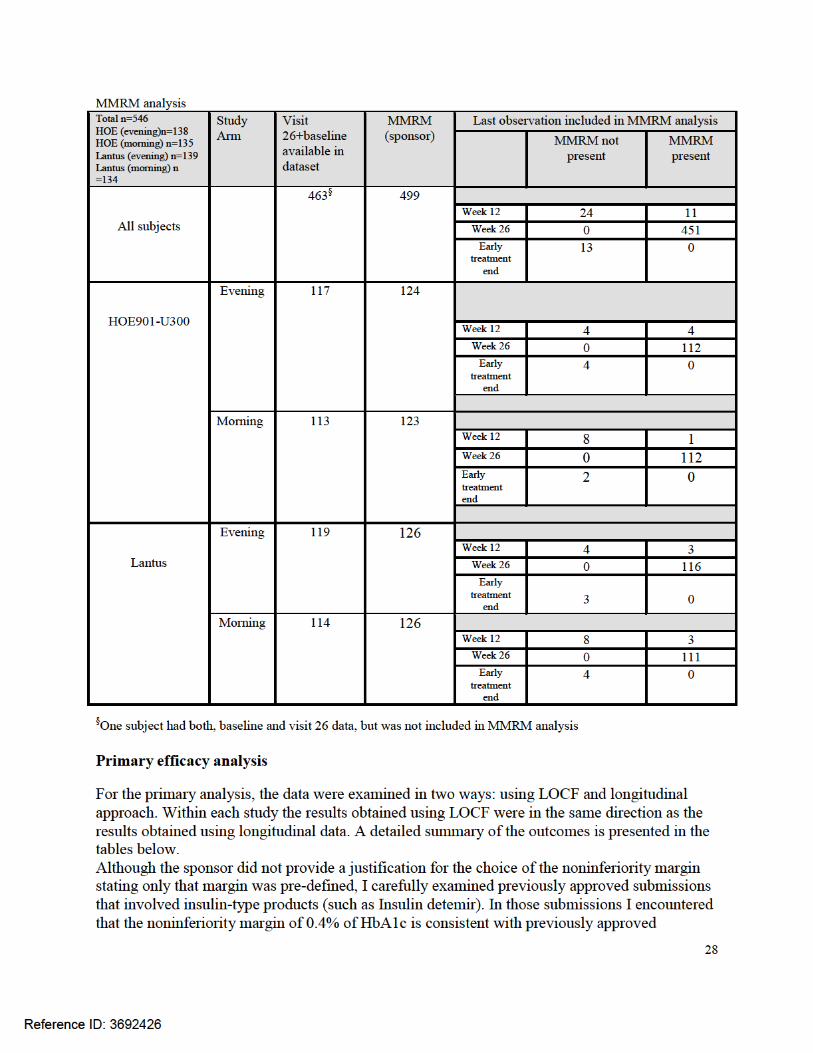
1. Missing data Subjects who had data at baseline and week 26, but observations at week 26 were not included in the analysis [LOCF analysis: study EFC11628 n=13, study EFC11629 n=12, study EFC12347 n=8, study EFC12456 n=12; MMRM analysis: study EFC12347 n=24, study EFC12456 n=11]. A more detailed description of missing data is located in the results section of this review. The sponsor addressed some of the missing data issues by conducting the sensitivity analyses based on MMRM. In my view, the MMRM analysis does not completely solve the issue of missing data since the MMRM model assumes that subjects with missing HbA1C values at the end of the study may be characterized by those with measurements. Such an assumption could lead to a clinically meaningless treatment effect just based on the outcomes from the statistical model. To examine the impact of rescue medications (rescue therapy was permitted in studies EFC11629 and EFC12347) , the sponsor proposed the following analyses:
a. In study EFC11629 only: analysis based on all scheduled HbA1c measurements during the main 6-month treatment period, to assess the impact of rescue medication. Any unscheduled measurements are excluded from the analysis. A multilevel model with random slopes and intercepts, proposed by White, et al , is used to adjust for the effect of rescue medication. The model includes fixed-effect factors for treatment, visit, treatment-by-visit interaction, randomization strata of screening HbA1c (<8.0, ≥8.0%), country, baseline HbA1c-by-visit interaction, and the number of days spent on rescue medications. The multilevel model is implemented via PROC MIXED. The treatment group has two levels (HOE901-U300 and Lantus) and the visit factor (with nominal visits) has two levels (visit 8 [week 12] and visit 10 [month 6]). Parameters are estimated using restricted maximum likelihood method with the Newton-Raphson algorithm. Denominator degrees of freedom are estimated using Kenward-Roger approximation by fitting values from all post-randomization visits in the main 6-month treatment period (1).
b. 6-months completers analysis: A sensitivity analysis is conducted with the 6-month completers (i.e., all patients who complete the main 6-month period of treatment and do not start rescue therapy before 6 months in study EFC11629 only) using the month 6 values and the same ANCOVA model described in the above section.
c. Penalized LOCF analysis: it is derived from the primary LOCF analysis (with censoring at first initiation of rescue medication) as follows: for those patients who do not have a valid assessment of HbA1c at month 6 (due to dropout and/or initiation of rescue
Reference ID: 3692426
20
medication before month 6), the endpoint is imputed as LOCF + Δ (Δ >0) for HOE901-U300 group and LOCF – Δ for Lantus group. This amounts to applying a penalty Δ to the experimental group and a bonus Δ to the control group. The greatest value of Δ preserving noninferiority is searched for.
2. MMRM analysis and SAS codes (label) [studies EFC11628 and EFC11629]
According to the SAP documentation for both trials (EFC11628 and EFC11629), MMRM was not supposed to be the main method for the primary analysis. In contrast, for studies EFC12347 and EFC12456 MMRM was planned to be the main method for the HbA1c analysis.
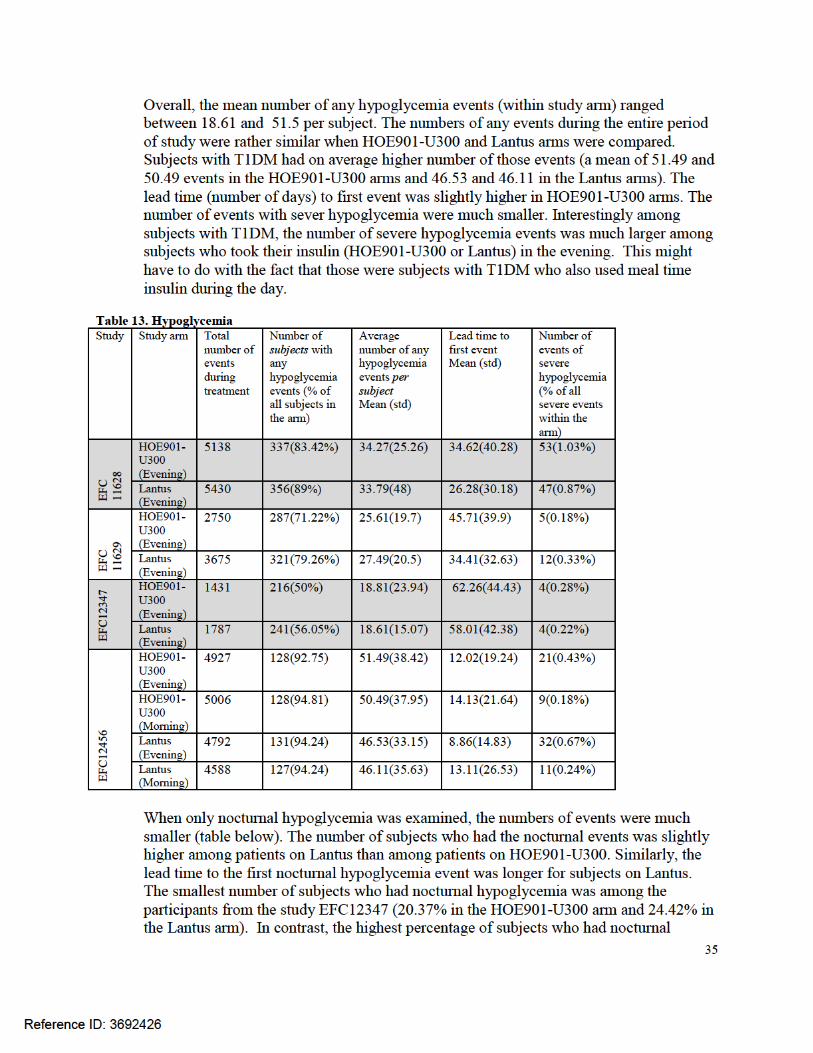
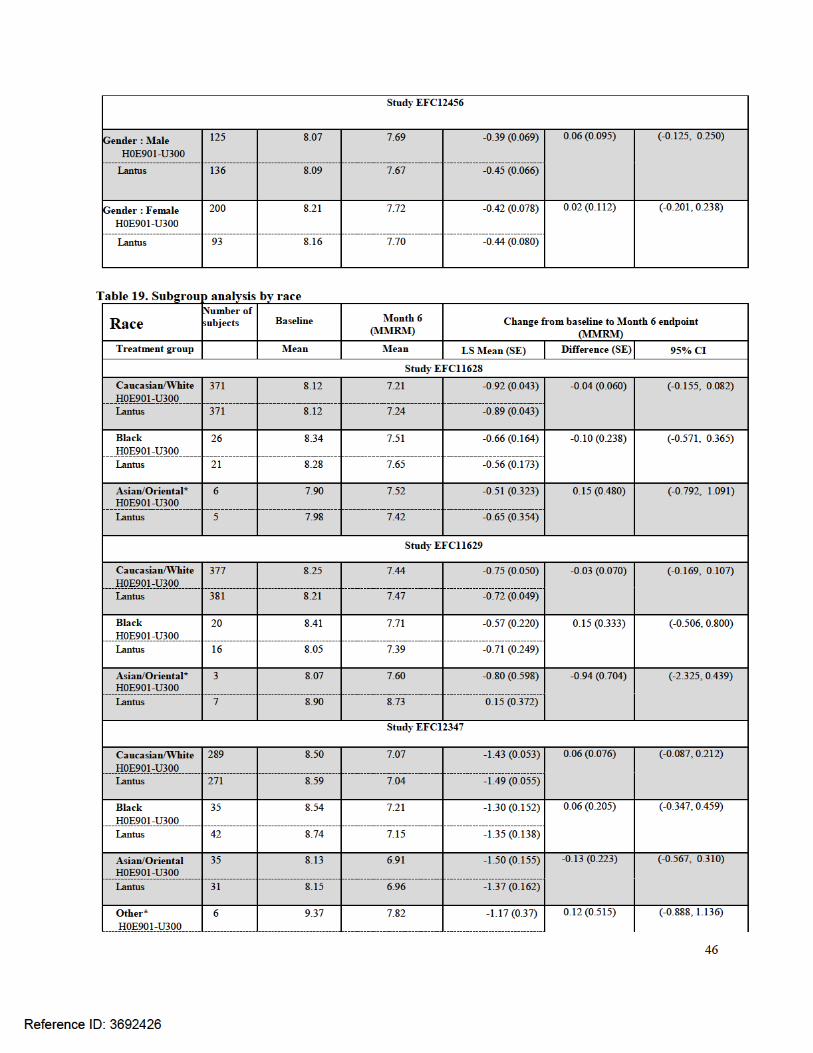
3.2.3 Patient Disposition, Demographic and Baseline Characteristics The studies included 549 randomized patients with T1DM and 2496 randomized patients with T2DM; 717 (23.5%) patients were aged 65 years or older, 1872 (75.0%) patients with T2DM had a body mass index (BMI) of at least 30 kg/m² and 488 (16%) patients had some degree of renal impairment (GFR [MDRD] ≤60 mL/min). The majority of the patients were Caucasian/white (n=2667; 87.6%), other ethnicities were represented by n=210 (6.9%) Black, n=144 (4.7%) Asian/Oriental, and n=463 (15.2%) Hispanic. Geographical areas included North America, South America, Europe, South Africa, and Japan. The Kaplan-Meier curves depicting a detailed description of drop out patterns for each study is presented in Appendix A.
Reference ID: 3692426
(b) (4)

21
Table 3. Demographic data
T1DM T2DM
EFC12456 EFC11628 EFC11629 EFC12347 Number of patients
N=549
N=807
N=811
N=878
Age (years; mean
47.3 (13.7) 60.0 (8.6) 58.2 (9.2) 57.7 (10.1) ≥ 65 years (%) 55 (10.0%) 246 (30.4%) 190 (23.4%) 226 (25.7) Male, N (%) 313 (57.0%) 427 (52.9%) 372 (45.9%) 507 (57.7%) Weight (kg;
81.8 (18.7) 106.3 (20.8) 98.3 (21.6) 95.3 (22.9)
BMI (kg/m² mean;
27.6 (5.1) 36.6 (6.4) 34.8 (6.4) 33.0 (6.7) ≥ 30 kg/m² 153 (27.9%) 699 (86.6%) 614 (75.7%) 559 (63.6%)
GFR (MDRD) < 60 mL/min/1.73m²
67 (12.2%)
188 (23.3%)
114 (14.1%)
119 (13.6%)
Duration of diabetes
21.0 (12.9)
15.8 (7.5)
12.6 (7.0)
9.8 (6.4)
≥ 10 years 431 (78.9%) 633 (78.4%) 501 (61.9%) 372 (42.7%) Total insulin dose prior to study (U/kg; mean) in the last 7 days prior to
0.719 (0.262)
1.197 (0.466)
0.671 (0.238)
NA
Caucasian/white 467 (85.1%) 745 (92.3%) 761 (93.8%) 685 (78.0%) Asian/Oriental 47 (8.6%) 11 (1.4%) 10 (1.2%) 76 (8.7%) Black 26 (4.7%) 47 (5.8%) 36 (4.4%) 101 (11.5%) Hispanic 26 (4.7%) 51 (6.3%) 193 (23.8%) 193 (22.0%) SD=Standard deviation; N=number; GFR= Glomerular filtration rate; MDRD= Modification of diet in renal disease (MDRD) formula; NA = not applicable.
A graphical comparison of baseline age and HbA1c between the arms within each trial revealed that the differences between arms were not significant within each study. Overall, subjects diagnosed with T1DM were younger than subjects diagnosed with T2DM. Please see figures below.
Reference ID: 3692426


29
medications. Based on a margin of 0.4%, the noninferiority of HOE901-U300 compared with Lantus was shown when the upper bound of the 95% CI was below 0.4%. This was achieved in all four studies. The results were similar when morning and night groups were compared among subjects with T1DM (study EFC12456). The superiority of HOE901-U300 to Lantus was not identified in any of the studies.
Reference ID: 3692426


37
groups in EFC12456 and EFC11628. In study EFC11629 variability decreased more in the HOE901-U300 group than Lantus group.
4. Change in FPG from baseline to endpoint (Month 6) In all 4 pivotal studies, FPG had decreased in the HOE901-U300 and Lantus groups at endpoint (Month 6).
5. 8-point SMPG profile Eight-point profiles were comparable between treatment groups at baseline in all 4 studies and had decreased similarly at all time points and at endpoint (Month 6) in both treatment groups.
6. 24-hour average plasma glucose
In all 4 studies, 24-hour average plasma glucose based on the 8-point SMPG profile was comparable between the treatment groups and had decreased similarly in the HOE901-U300 and Lantus group at Month six.
Efficacy in morning and evening injection In study EFC12456, conducted in patients with T1DM, patients were randomized to receive HOE901-U300 or Lantus once daily in the morning (any time prior to breakfast until lunch) or evening (anytime immediately prior to the evening meal until bedtime). At the end of the 6-month treatment period in the study EFC12456, HbA1c had decreased similarly in the morning injection groups of HOE901-U300 and Lantus, whereas a smaller decrease was seen in the HOE901-U300 evening injection group compared with the Lantus evening injection group (Table 12). Comparing morning and evening injection groups within the HOE901-U300 group, the morning injection resulted in a larger decrease of HbA1c than the evening injection, although the LS mean difference between HOE901-U300 morning and evening injection group was not clinically relevant.
Reference ID: 3692426


42
Appendix A Kaplan-Meier plot of time to treatment discontinuation due to any reason during the main
treatment period Randomized and treated population
Figure 9. Kaplan-Meier plot EFC11628
Figure 10. Kaplan-Meier plot EFC11629
Reference ID: 3692426

43
Figure 11. Kaplan-Meier plot EFC12347
Figure 12. Kaplan-Meier plot EFC12456
Reference ID: 3692426


---------------------------------------------------------------------------------------------------------This is a representation of an electronic record that was signedelectronically and this page is the manifestation of the electronicsignature.---------------------------------------------------------------------------------------------------------/s/----------------------------------------------------
ANNA E KETTERMANN01/26/2015
MARK D ROTHMANN01/26/2015I concur
Reference ID: 3692426

STATISTICS FILING CHECKLIST FOR A NEW NDA/BLA
NDA Number: 206538 Applicant: Sanofi-aventis U.S. LLC Stamp Date: 4/25/2014
Drug Name: insulin glargine [rDNA origin] injection, 300 units/mL
NDA/BLA Type:
On initial overview of the NDA/BLA application for RTF:
Content Parameter Yes No NA Comments
1 Index is sufficient to locate necessary reports, tables, data, etc. x
2 ISS, ISE, and complete study reports are available (including original protocols, subsequent amendments, etc.) x
3 Safety and efficacy were investigated for gender, racial, and geriatric subgroups investigated. x
4 Data sets in EDR are accessible and conform to applicable guidances (e.g., existence of define.pdf file for data sets). x
IS THE STATISTICAL SECTION OF THE APPLICATION FILEABLE? Yes
Please identify and list any potential review issues to be forwarded to the Applicant for the 74-day letter.
Content Parameter (possible review concerns for 74-day letter)
Yes No NA Comment
Designs utilized are appropriate for the indications requested. x
Endpoints and methods of analysis are specified in the protocols/statistical analysis plans.
x
Interim analyses (if present) were pre-specified in the protocol and appropriate adjustments in significance level made. DSMB meeting minutes and data are available.
x
Appropriate references for novel statistical methodology (if present) are included.
x
Safety data organized to permit analyses across clinical trials in the NDA/BLA.
x
Investigation of effect of dropouts on statistical analyses as described by applicant appears adequate.
x
Comments for the 74-day letter:
Reference ID: 3525536
STATISTICS FILING CHECKLIST FOR A NEW NDA/BLA
The applicant provided SAS codes for calculations involving only primary endpoint (HbA1C). There were no SAS codes submitted supporting other endpoints. Additionally, SAS program codes were not provided for any of the sub studies. Please provide SAS programs for all efficacy endpoints that will appear in the product label.
Reference ID: 3525536

STATISTICS FILING CHECKLIST FOR A NEW NDA/BLA
Anna Kettermann 6/5/2014
Reviewing Statistician Date
Team Leader Date
Reference ID: 3525536

---------------------------------------------------------------------------------------------------------This is a representation of an electronic record that was signedelectronically and this page is the manifestation of the electronicsignature.---------------------------------------------------------------------------------------------------------/s/----------------------------------------------------
ANNA E KETTERMANN06/16/2014
MARK D ROTHMANN06/16/2014I concur
Reference ID: 3525536