census of tasmanian genral practices - primary health · pdf file2014 census of tasmanian ......
TRANSCRIPT

2014 Census of Tasmanian General Practices
Tasmania Medicare Local Limited ABN 47 082 572 629
i
Document history This table records the document history. Version numbers and summary of changes are recorded below.
Version No. Date Description of revision
V01.a February 2015 Final release
Tasmania Medicare Local Limited
2014 Census of Tasmanian General Practices
ABN 47 082 572 629
www.tasmedicarelocal.com.au
GPO Box 1827 Hobart TAS 7001
Level 4, 172 Collins Street Hobart TAS 7000
t 1300 653 169
f 03 6213 8260
Tasmania Medicare Local gratefully acknowledges the financial and other support of the Australian Government
Department of Health

ii
Contents
1 Executive summary .............................................................................................................................. 1
2 Introduction .......................................................................................................................................... 2
3 General practitioner workforce ............................................................................................................. 4
4 Practice nurses .................................................................................................................................. 13
5 Supply of GPs and PNs by LGA ........................................................................................................ 14
6 Closing ............................................................................................................................................... 15
iii
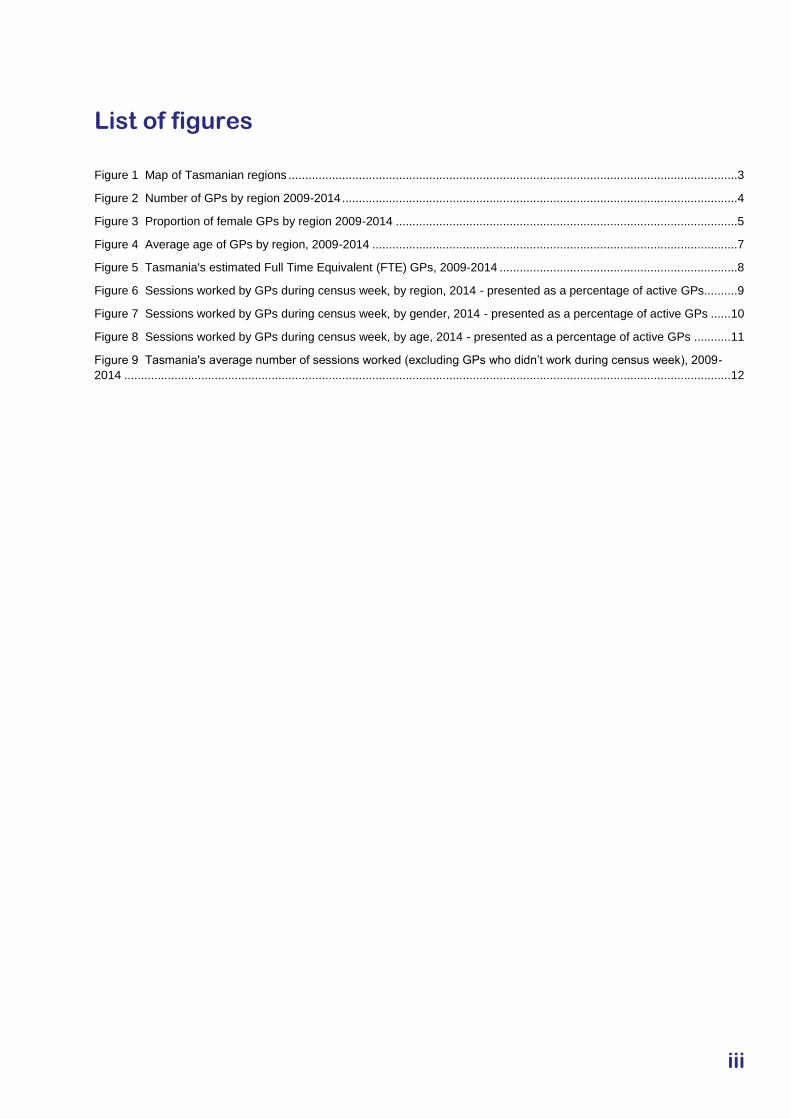
List of figures
Figure 1 Map of Tasmanian regions ......................................................................................................................................3
Figure 2 Number of GPs by region 2009-2014 ......................................................................................................................4
Figure 3 Proportion of female GPs by region 2009-2014 ......................................................................................................5
Figure 4 Average age of GPs by region, 2009-2014 .............................................................................................................7
Figure 5 Tasmania's estimated Full Time Equivalent (FTE) GPs, 2009-2014 .......................................................................8
Figure 6 Sessions worked by GPs during census week, by region, 2014 - presented as a percentage of active GPs ..........9
Figure 7 Sessions worked by GPs during census week, by gender, 2014 - presented as a percentage of active GPs ...... 10
Figure 8 Sessions worked by GPs during census week, by age, 2014 - presented as a percentage of active GPs ........... 11
Figure 9 Tasmania's average number of sessions worked (excluding GPs who didn’t work during census week), 2009-
2014 ..................................................................................................................................................................................... 12

iv
List of tables
Table 1 Age distribution of Tasmania’s GPs ..........................................................................................................................6
Table 2 Age distribution, Tasmania and Australia comparison, 2009-2014 ...........................................................................6
Table 3 Practice Nurses (PN) by region, 2012 & 2014 ........................................................................................................ 13
Table 4 GP and PN FTE comparison .................................................................................................................................. 13
1
1 Executive summary
Tasmania’s general practitioner (GP) workforce has seen a significant increase in supply since 2009, with not only a rise in
GP numbers, but also an increase in overall GP workforce participation during the snapshot census week. However, there
remains, pockets of under-supply and areas of GP shortages particularly in the more remote areas of the State.
The trend of increasing feminisation of the workforce continues, with the increase in numbers of female GPs since 2009 at
over twice the rate of increase of male GPs. At 44% of the GP workforce, Tasmania’s female GPs continue to exceed the
national proportion of female GPs by 4.9%. Female GPs across all age groups practise fewer sessions than their male
counterparts.
Since 2009 GPs aged 45 to 54 years have comprised the highest proportion of the age structure. GPs aged less than 35
years account for the largest growth in numbers since 2009. However, since the census began, 2014 has returned the
highest proportion (24.5%) of GPs not disclosing their age.
Practice nurse (PN) numbers have increased significantly since 2012 (13.8%), with a higher rate of practice nurse
employment in general practices (78.1% in 2014, compared to 75.0% in 2012). The ratio (headcount) of practice nurse to
GP is approximately one practice nurse to every two GPs.
Census week 2014 key findings
There were 698 GPs practising within 158 general practices across Tasmania, representing an increase of 93 GPs
(13.3%) since census week 2012 when 605 GPs were reported.
Of the 698 GPs, 362 (51.9%) were male and 336 (48.1%) were female, representing an increase of 25 male GPs and
68 female GPs since census 2012.
The average age of GPs was 51.6 years, over seven years greater for males at 55.0 years compared to females at
47.7 years.
According to census data, GPs aged over 45 constitute 73% of the workforce.
The highest proportion by age structure continues to be the 45-54 year age group, at 30.9% of the workforce.
The average number of sessions practised in direct patient care statewide was 6.6 sessions, higher for males at 7.2
sessions than females at 5.9 sessions.
306 GPs (43.8%) participated in 8 or more sessions during census week, 175 GPs (25.1%) practised 5-7 sessions,
and 163 (23.3%) participated in 1-4 sessions.
The estimated number of Full-Time Equivalent (FTE) GPs in Tasmania has increased since 2012 by 38 FTE GPs
(9.9%) to 422.7 FTE GPs in 2014. This is represented by regional increases of 16.6 FTE GPs (17.1%) in the north,
15.9 FTE GPs (7.5%) in the south and 5.5 FTE GPs (7.2%) in the north west.
Tasmania’s GP supply was 1,214 people per GP FTE, close to the national GP supply of 1,223 per GP FTE.
There were 372 practice nurses (PNs) working in 118 (75%) of Tasmania’s general practices, an increase of 45 PNs
from 2012. The number of practices employing PNs increased from 114 (75% of practices) in 2012.
There were an estimated 197.3 PN FTEs, with an FTE PN to FTE GP ratio statewide of 0.47:1.
Tasmania’s estimated PN supply was 2,600 people per PN FTE.
2
2 Introduction
In May 2005, the former Tasmanian Divisions of General Practice launched the first statewide census of
general practitioners, known as the GP census. Since then, the census has continued to be run on an
annual basis to enable the analysis of workforce data, practice operation characteristics and practice
support requirements. From 2009, the census has also collected data on the nurse workforce within
Tasmania’s general practices.
In 2014, census week ran from October 13 to 19. Informing workforce planning and needs assessments,
the census aims to obtain timely workforce information through a ‘real-time’ snapshot of the GP and
practice nurse workforce.
A small number of additional survey questions are included in the census each year to gather information
relevant to TMLs current projects or for future planning purposes. This year the census contained survey
questions on the following areas:
after hours services
access to other services
Practice Incentives Program (PIP) claims
practice teaching.
cultural awareness training
eHealth
disaster and emergency management
education and areas of interest
emergency management equipment
patient access
The disaster and emergency management and education and areas of interest responses have been used
to update TML’s database and are not included in this report
The census was conducted through the distribution of two separate surveys, one sent to GPs and the
other to practice managers, with questions relevant to each role. Questions concerning the role of practice
nurses were asked of practice managers. An online survey platform was used to conduct the survey,
supplemented by ‘hard copy’ distribution to 128 GPs and 8 practices that were not contactable via email.
Following the initial distribution, two email reminders and one hard copy reminder were sent out to GPs
and practice managers. Follow up phone calls to practice managers were conducted a month after the
census commenced to collect GP and practice nurse workforce information for GPs and practices that had
not completed a survey.
.
Ethics approval
This study has been approved by the Tasmanian Social Sciences Human Research Ethics Committee
(HREC) – project number H11208. If you have concerns or complaints about the conduct of this study,
you can contact the Executive Officer of the HREC (Tasmania) Network on 03 6226 7479 or email
3
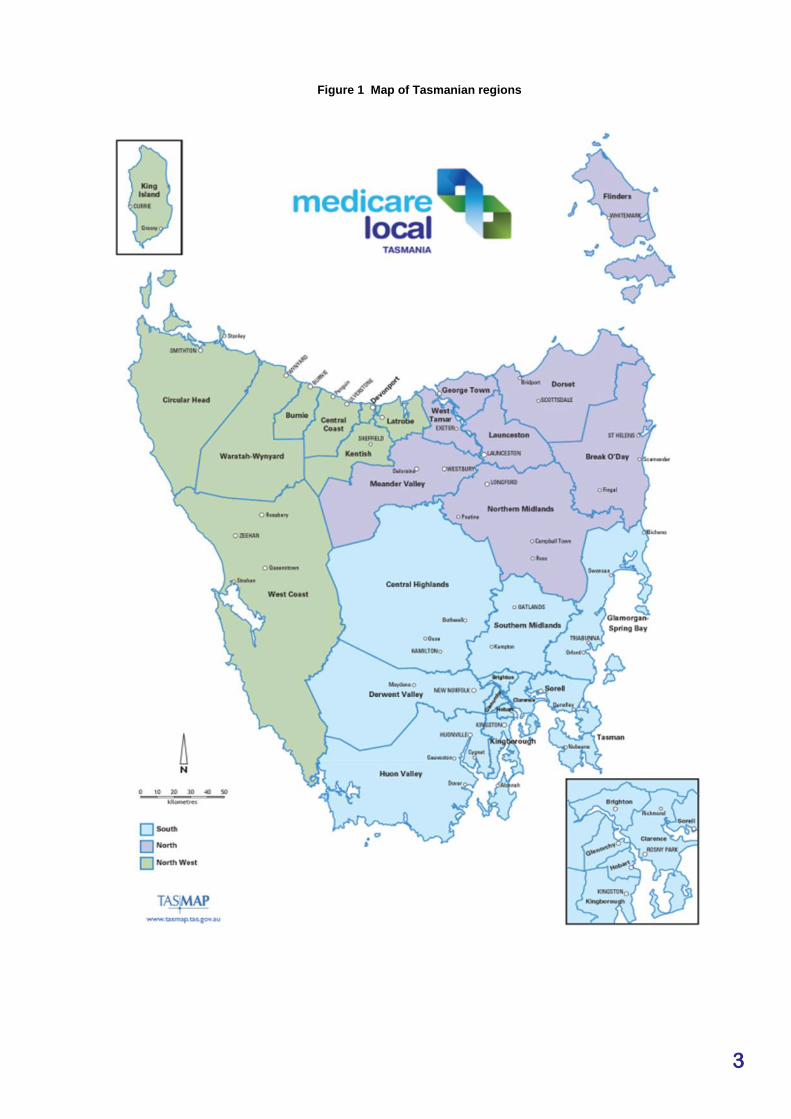
Figure 1 Map of Tasmanian regions

4
3 General practitioner workforce
The response rate for the 2014 GP census was approximately 41% for the GP survey and 48% for the practice managers’
survey. This response rate for the GP survey was similar to 2013 (42%) and fractionally higher for the practice managers’
survey (42% in 2013). Data on GP and practice nurse sessions worked was collected for non-respondent GPs and
practices via follow up practice calls, increasing the response rate for this core data to over 95%.
In the past five years the number of GPs in the state has increased by 143, an increase of 26%. The largest percentage
increase occurred in the north west (29%), followed by the north and south, both at 24%. Practice follow up phone calls
were not conducted in 2013, hence GP and practice nurse demographic data for that year was incomplete and not
included in the trend analyses in this report.
Figure 2 Number of GPs by region 2009-2014

5
3.1 Gender
Of the 698 GPs practising in Tasmania during census week 2014, 362 (51.9%) were male and 336 (48.1%) were female.
The proportion of female GPs in Tasmania is higher than the national rate of 43.2%. In the past five years the percentage
of female GPs in Tasmania has increased by 4.5%, representing an actual increase of 94 female GPs. The north west
region has seen the largest increase in female GPs on a proportional basis (up by 9.6%) and the north region has seen the
smallest increase (up by 2%).
Figure 3 Proportion of female GPs by region 2009-2014
6
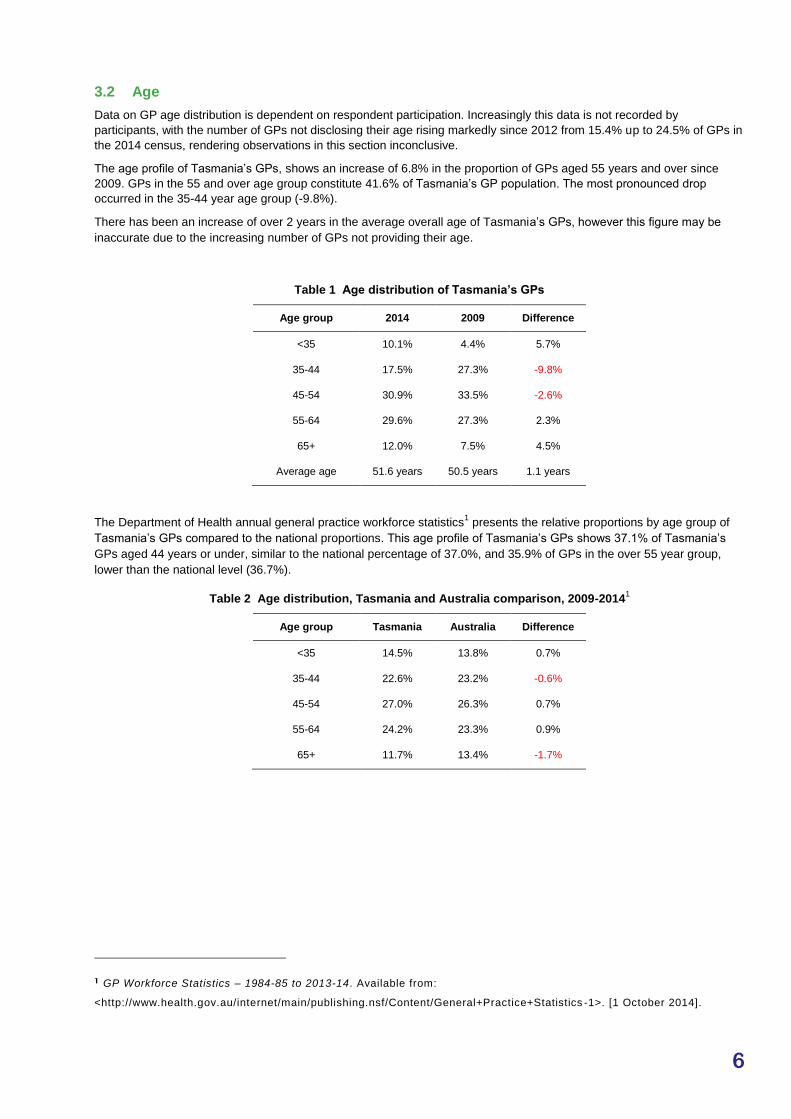
3.2 Age
Data on GP age distribution is dependent on respondent participation. Increasingly this data is not recorded by
participants, with the number of GPs not disclosing their age rising markedly since 2012 from 15.4% up to 24.5% of GPs in
the 2014 census, rendering observations in this section inconclusive.
The age profile of Tasmania’s GPs, shows an increase of 6.8% in the proportion of GPs aged 55 years and over since
2009. GPs in the 55 and over age group constitute 41.6% of Tasmania’s GP population. The most pronounced drop
occurred in the 35-44 year age group (-9.8%).
There has been an increase of over 2 years in the average overall age of Tasmania’s GPs, however this figure may be
inaccurate due to the increasing number of GPs not providing their age.
Table 1 Age distribution of Tasmania’s GPs
Age group 2014 2009 Difference
<35 10.1% 4.4% 5.7%
35-44 17.5% 27.3% -9.8%
45-54 30.9% 33.5% -2.6%
55-64 29.6% 27.3% 2.3%
65+ 12.0% 7.5% 4.5%
Average age 51.6 years 50.5 years 1.1 years
The Department of Health annual general practice workforce statistics1 presents the relative proportions by age group of
Tasmania’s GPs compared to the national proportions. This age profile of Tasmania’s GPs shows 37.1% of Tasmania’s
GPs aged 44 years or under, similar to the national percentage of 37.0%, and 35.9% of GPs in the over 55 year group,
lower than the national level (36.7%).
Table 2 Age distribution, Tasmania and Australia comparison, 2009-20141
Age group Tasmania Australia Difference
<35 14.5% 13.8% 0.7%
35-44 22.6% 23.2% -0.6%
45-54 27.0% 26.3% 0.7%
55-64 24.2% 23.3% 0.9%
65+ 11.7% 13.4% -1.7%
1 GP Workforce Statistics – 1984-85 to 2013-14. Available from:
<http://www.health.gov.au/internet/main/publishing.nsf/Content/General+Practice+Statistics -1>. [1 October 2014].
7
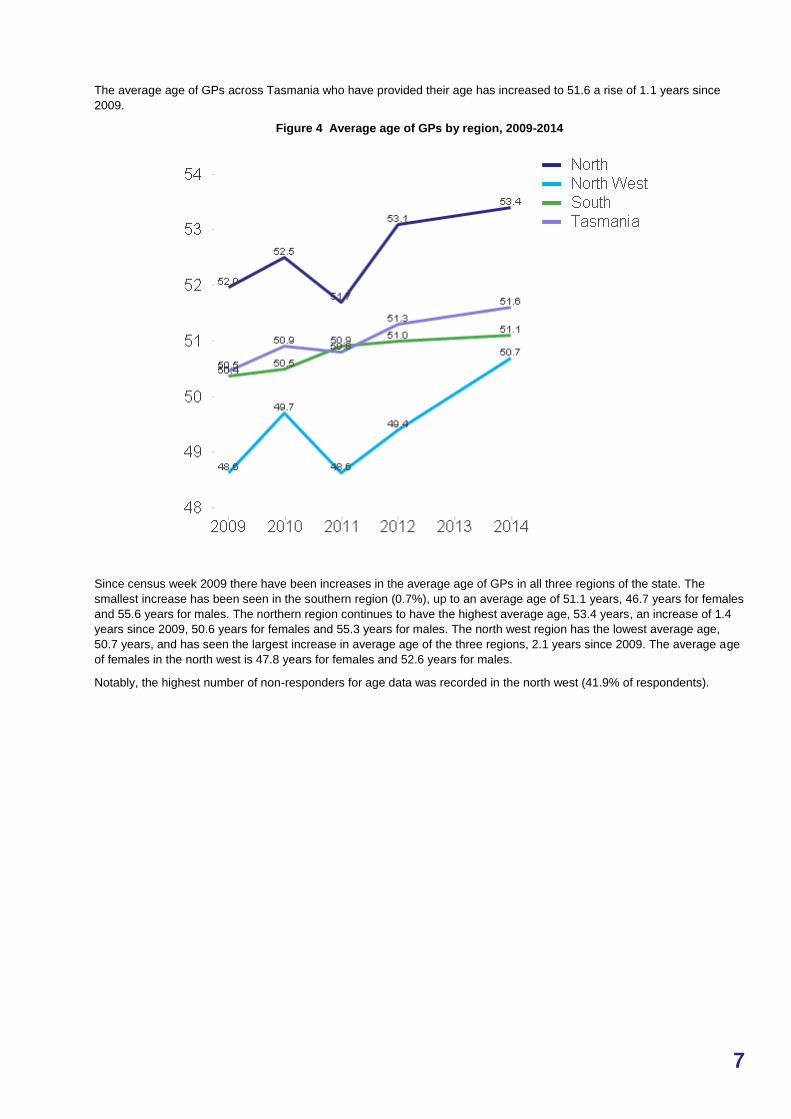
The average age of GPs across Tasmania who have provided their age has increased to 51.6 a rise of 1.1 years since
2009.
Figure 4 Average age of GPs by region, 2009-2014
Since census week 2009 there have been increases in the average age of GPs in all three regions of the state. The
smallest increase has been seen in the southern region (0.7%), up to an average age of 51.1 years, 46.7 years for females
and 55.6 years for males. The northern region continues to have the highest average age, 53.4 years, an increase of 1.4
years since 2009, 50.6 years for females and 55.3 years for males. The north west region has the lowest average age,
50.7 years, and has seen the largest increase in average age of the three regions, 2.1 years since 2009. The average age
of females in the north west is 47.8 years for females and 52.6 years for males.
Notably, the highest number of non-responders for age data was recorded in the north west (41.9% of respondents).

8
3.3 Full time equivalent GPs
During census week the number of hour sessions recorded for each GP practising in Tasmania’s 158 general practices
yielded a total of 422.7 Full-Time Equivalent (FTE) GPs. FTE GPs are calculated on the basis of the number of 3.5-hour
sessions spent providing direct patient care (including referrals, home, aged care and hospital visits, patient notes) during
census week. For Census purposes, full-time is measured as ten or more sessions per week and part-time fewer than ten
sessions per week (n<10 sessions = 0.n FTE).
Department of Health figures state Tasmania’s FTE GPs as 2.3% (436 FTE) of the national FTE GP workforce of 19,364
FTE in 2013-14. However, the calculation of full-time equivalent (FTE) and full-time workload equivalent (FWE) GPs is
based solely on the number and the dollar value of Medicare claims made by a provider over a given reference period.
While these can be useful measures of overall service provision under Medicare, they do not reflect the number of hours
worked in providing medical services or services provided that are not claimed or are not claimable through Medicare, nor
do they correlate to number of sessions spent in direct patient care.
Since Census 2009, there has been an increase of 67.6 FTE GPs. The net gain statewide is represented by increases in
all three regions. The South increased by 33.3 FTEs (17.2%), 24.2 FTEs in the North (27.2%), and a 10.1 FTE gain in the
North West (14.0%).
Figure 5 Tasmania's estimated Full Time Equivalent (FTE) GPs, 2009-2014

9
3.4 Workforce participation
The average number of sessions (3.5 hours) per week spent in direct patient care by Tasmania’s GPs at a regional level
presented as a percentage of active GPs, is given in Figure 6. The data in the graph is presented numerically in the table
below. The highest workforce participation regionally was seen in the north west, at an average of 7.5 sessions (excluding
active GPs who worked no sessions), well above the State average of 6.6. GPs that were active but didn’t work during
census week were recorded as working zero hours. The southern region had the lowest average sessions worked at 6.2
and the average in the north was 6.8 sessions. The north west had the highest percentage of GPs working ten or more
sessions a week (20.9%) and 58.9% of GPs working eight or more sessions during census week.
Figure 6 Sessions worked by GPs during census week, by region, 2014 - presented as a percentage of active GPs
North North west South Tasmania
10+ 14.9% 20.9% 10.2% 13.3%
9 11.4% 16.3% 7.4% 10.0%
8 25.1% 21.7% 18.0% 20.5%
7 5.7% 3.9% 7.9% 6.6%
6 10.3% 4.7% 16.0% 12.5%
5 5.7% 3.9% 6.9% 6.0%
4 8.6% 3.1% 11.4% 9.2%
3 4.6% 0.8% 5.1% 4.2%
2 8.0% 7.8% 8.4% 8.2%
1 0.6% 2.3% 2.0% 1.7%
0 5.1% 14.7% 6.9% 7.9%
Ave (excl. 0
sessions worked
GPs)
6.8 7.5 6.2 6.6

10
The average number of sessions per week spent in direct patient care by Tasmania’s GPs broken down by gender
presented as a percentage of active GPs is shown in Figure 7. Male GPs had a higher average number of sessions
worked than females, 7.2 sessions (excluding active GPs who worked no sessions during census week) compared to 5.9
sessions for females GPs. 19.3% of male GPs worked ten or more sessions compared to only 6.8% for females. The
proportion of male GPs who worked eight or more sessions a week was 55.5% compared to 31.2% for females.
Figure 7 Sessions worked by GPs during census week, by gender, 2014 - presented as a percentage of active GPs
Female Male All
10+ 6.8% 19.3% 13.3%
9 7.1% 12.7% 10.0%
8 17.3% 23.5% 20.5%
7 6.8% 6.4% 6.6%
6 13.7% 11.3% 12.5%
5 8.0% 4.1% 6.0%
4 12.5% 6.1% 9.2%
3 5.4% 3.0% 4.2%
2 10.4% 6.1% 8.2%
1 1.8% 1.7% 1.7%
0 10.1% 5.8% 7.9%
Ave (excl. 0
sessions worked
GPs)
5.9 7.2 6.6

11
The average number of sessions per week spent in direct patient care by Tasmania’s GPs broken down by age bracket is
shown in Figure 8. The 55-64 age bracket had the highest average sessions worked during census week at 7.0, the 45-54
age bracket had the second highest average sessions worked at 6.8 per week. The average number of sessions worked
by GPs increased from the <35 to 55-64 age groups and decreased for the over 65s. The percentage of GPs working eight
or more sessions was highest amongst the 45-54 and 55-64 age groups, 46.7% and 46.8% respectively, compared to the
state percentage of 43.8%. The over 65 age group had the lowest proportion of GPs who worked eight or more sessions
during census week at 36.5%.
Figure 8 Sessions worked by GPs during census week, by age, 2014 - presented as a percentage of active GPs
<35 35-44 45-54 55-64 65+
Age
unspecified
(-)
All
10+ 3.8% 11.1% 12.0% 16.7% 17.2% 11.1% 7.9%
9 7.5% 7.9% 13.0% 11.5% 12.3% 6.4% 1.7%
8 30.2% 17.5% 16.3% 18.6% 17.2% 25.7% 8.2%
7 3.8% 6.3% 8.7% 6.4% 8.0% 5.3% 4.2%
6 15.1% 9.5% 13.0% 15.4% 12.9% 9.4% 9.2%
5 5.7% 7.9% 6.5% 6.4% 8.6% 2.3% 6.0%
4 9.4% 11.1% 16.3% 6.4% 6.7% 9.4% 12.5%
3 5.7% 6.3% 4.3% 3.8% 3.7% 3.5% 6.6%
2 9.4% 11.1% 6.5% 4.5% 7.4% 11.7% 20.5%
1 0.0% 1.6% 1.1% 0.6% 2.5% 2.9% 10.0%
0 9.4% 9.5% 2.2% 9.6% 3.7% 12.3% 13.3%
Ave (excl. 0
sessions worked
GPs)
6.3 6.5 6.8 7 6.2 6.3 6.6

12
The average number of sessions worked by GPs has dropped across all three regions in the past five years. The drop has
been similar in all three regions, -0.5 sessions in the north west and -0.4 sessions in the north and south.
Figure 9 Tasmania's average number of sessions worked (excluding GPs who didn’t work during census week), 2009-2014

13
4 Practice nurses
During census week 2014, 327 practice nurses (PNs) were working in 118 (75%) of Tasmania’s general practices. This is
an increase of 45 PNs since census week 2012, represented by a gain of 22 PNs in the north, 15 PNs in the south and 8 in
the north west.
The number PN FTE’s has increased across all three regions since 2012, with an extra 7.6 FTEs in the north, 3.1 FTE in
the north west and 17.9 FTE in the south. There has been a 17.0% increase in PN FTEs over the state to 197.3.
Table 3 Practice Nurses (PN) by region, 2012 & 2014
2014 2012
Region Practices
with nurses
% of
practices
with PNs
Practice
Nurses PN FTEs
Practices
with nurses
% of
practices
with PNs
Practice
Nurses PN FTEs
North 34 74% 119 59.0 32 74% 97 51.4
North west 24 86% 83 44.8 22 85% 75 41.7
South 62 74% 170 93.5 60 72% 155 75.6
Tasmania 120 76% 372 197.3 114 75% 327 168.6
The number of practice nurse FTEs in the state has increased relative to the number of GP FTEs in the past two years. GP
FTEs have increased by 9.9% whereas PN FTEs have increased by 17.0% bringing the ratio of PN:GP FTEs to 0.47:1, up
from 0.44:1 in 2012. The largest percentage increase in PN FTEs occurred in the south (23.7%) compared to 14.8% in the
north and 7.4% in the north west.
Table 4 GP and PN FTE comparison
2014 2012
Region GP FTEs PN FTEs PN FTE:GP
FTE ratio GP FTEs PN FTEs
PN FTE:GP
FTE ratio
North 113.3 59.0 0.52 96.7 51.4 0.53
North west 82.1 44.8 0.55 76.6 41.7 0.54
South 227.3 93.5 0.41 211.4 75.6 0.36
Tasmania 422.7 197.3 0.47 384.7 168.6 0.44
14
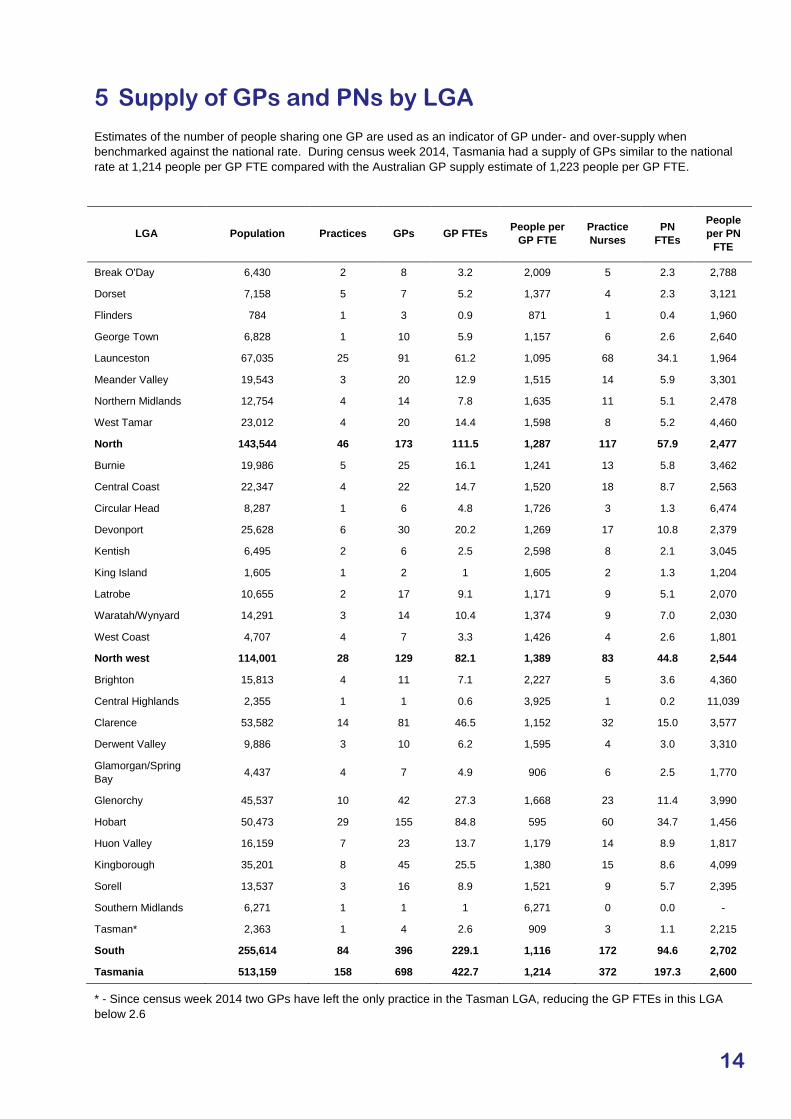
5 Supply of GPs and PNs by LGA
Estimates of the number of people sharing one GP are used as an indicator of GP under- and over-supply when
benchmarked against the national rate. During census week 2014, Tasmania had a supply of GPs similar to the national
rate at 1,214 people per GP FTE compared with the Australian GP supply estimate of 1,223 people per GP FTE.
LGA Population Practices GPs GP FTEs People per
GP FTE
Practice
Nurses
PN
FTEs
People
per PN
FTE
Break O'Day 6,430 2 8 3.2 2,009 5 2.3 2,788
Dorset 7,158 5 7 5.2 1,377 4 2.3 3,121
Flinders 784 1 3 0.9 871 1 0.4 1,960
George Town 6,828 1 10 5.9 1,157 6 2.6 2,640
Launceston 67,035 25 91 61.2 1,095 68 34.1 1,964
Meander Valley 19,543 3 20 12.9 1,515 14 5.9 3,301
Northern Midlands 12,754 4 14 7.8 1,635 11 5.1 2,478
West Tamar 23,012 4 20 14.4 1,598 8 5.2 4,460
North 143,544 46 173 111.5 1,287 117 57.9 2,477
Burnie 19,986 5 25 16.1 1,241 13 5.8 3,462
Central Coast 22,347 4 22 14.7 1,520 18 8.7 2,563
Circular Head 8,287 1 6 4.8 1,726 3 1.3 6,474
Devonport 25,628 6 30 20.2 1,269 17 10.8 2,379
Kentish 6,495 2 6 2.5 2,598 8 2.1 3,045
King Island 1,605 1 2 1 1,605 2 1.3 1,204
Latrobe 10,655 2 17 9.1 1,171 9 5.1 2,070
Waratah/Wynyard 14,291 3 14 10.4 1,374 9 7.0 2,030
West Coast 4,707 4 7 3.3 1,426 4 2.6 1,801
North west 114,001 28 129 82.1 1,389 83 44.8 2,544
Brighton 15,813 4 11 7.1 2,227 5 3.6 4,360
Central Highlands 2,355 1 1 0.6 3,925 1 0.2 11,039
Clarence 53,582 14 81 46.5 1,152 32 15.0 3,577
Derwent Valley 9,886 3 10 6.2 1,595 4 3.0 3,310
Glamorgan/Spring
Bay 4,437 4 7 4.9 906 6 2.5 1,770
Glenorchy 45,537 10 42 27.3 1,668 23 11.4 3,990
Hobart 50,473 29 155 84.8 595 60 34.7 1,456
Huon Valley 16,159 7 23 13.7 1,179 14 8.9 1,817
Kingborough 35,201 8 45 25.5 1,380 15 8.6 4,099
Sorell 13,537 3 16 8.9 1,521 9 5.7 2,395
Southern Midlands 6,271 1 1 1 6,271 0 0.0 -
Tasman* 2,363 1 4 2.6 909 3 1.1 2,215
South 255,614 84 396 229.1 1,116 172 94.6 2,702
Tasmania 513,159 158 698 422.7 1,214 372 197.3 2,600
* - Since census week 2014 two GPs have left the only practice in the Tasman LGA, reducing the GP FTEs in this LGA
below 2.6

15
GP supply per Local Government Area (LGA) given above is for census week 2014 and is indicative only as a snapshot of
GP, practice nurse and general practice supply. It is important to note that GP numbers can change quite rapidly and this
is particularly the case when data is estimated at a LGA level and numbers are small. The loss or gain of one GP to an
LGA can have a significant impact on the estimate of GP availability. It is also common for people to see a GP outside the
LGA in which they live. For these reasons, care should be taken in drawing conclusions about GP availability at the
individual LGA level, particularly LGAs with small populations, eg the Bass Strait Islands.
GP undersupply is most evident in the Central Highlands, Kentish, Southern Midlands, Brighton, and Break O’Day LGAs.
Undersupply is also evident on a people per GP FTE basis in the majority of Tasmania’s LGAs in comparison to the
nationwide average (1,223). Oversupply is apparent only in the cities of Hobart and Launceston, and George Town, Huon
Valley and Latrobe LGAs.
6 Closing
Tamania Medicare Local (TML) would like to thank all GPs and practice managers who responded to our census survey.
The data and feedback gathered are key inputs into TML’s planning processes. The information will also be made
available to other health organisations in the state.
Further information can be obtained from:
Ian Tye
Data Analyst
Tasmania Medicare Local
E [email protected] T 03 6213 8200

16
Tasmania Medicare Local Limited
2014 Census of Tasmanian General Practices
ABN 47 082 572 629
www.tasmedicarelocal.com.au
GPO Box 1827 Hobart TAS 7001
Level 4, 172 Collins Street Hobart TAS 7000
t 1300 653 169
f 03 6213 8200
Tasmania Medicare Local gratefully acknowledges the financial and other support of the Australian Government Department of Health