censorship on high voltage power equipments & …...detailed consideration on worldwide...
TRANSCRIPT

Censorship on High Voltage Power Equipment & Systems in Europe and North America
Mr. Ettore Figini DeMEPA Partner and Vice President Dr. Roberto Iorio DeMEPA Partner, Senior Advisor
Taiwan Research Institute Taipei, Taiwan, R.O.C. Taipei, October 5th, 2011

2 /118
Lessons learnt from the European and North American experience and knowledge
Abstract This magisterial lecture will offer a technical and business survey on the main trends of the Electrical Power System relevant to: Compliance with the non-postponing issues of the carbon
reduction
New generation mix with the consequent possible unbalance due to increasing share of the renewable sources
Super Grids and DC Power connections for electric energy transmission on long distances, energy exports, connections with large generation plants: off-shore and on-shore Wind Farm (Europe and USA), Solar Power Plant (Mediterranean Countries and Europe), Bulk Hydro Plant (South America, Asia and Africa)
Taiwan Research Institute (TRI) Taipei, October 5th, 2011
3 /118
Lessons learnt from the European and North American experience and knowledge
Abstract (foll.)
Re-engineering of the HV and MV power system infrastructures
Evolution of the MV grid as a consequence of the increasing share of the Distributed Generation
MV and LV micro grid application growth
The new scenarios are changing drastically the way to design, plan, operate and maintain the power systems, with a strong impact on the HV network backbones and HV and MV infrastructures and components. With regards to the new components, the market requires the manufacturers to supply advanced features with particular regard to short circuit management.
Taiwan Research Institute (TRI) Taipei, October 5th, 2011
4 /118
Lessons learnt from the European and North American experience and knowledge
Abstract (foll.) Other non negligible issues are: Meshed DC grid development
Needs of fast changing in the power flow versus. All the above indicated has a serious follow–up in the: • Network management, giving more role (and investments) to the DSOs
than to the TSOs
• Development of the new advanced Large Electrical Laboratories and/or the refurbishment of the existing, in order to support the development of new components, new standards and interoperability criteria
• Development of new modalities to ensure the quality and the performances in those cases where the laboratories are not yet existing or available.
Taiwan Research Institute (TRI) Taipei, October 5th, 2011

5 /118
Lessons learnt from the European and North American experience and knowledge
Lecture main goals
1. Strategic items: • market • technological • economical • industrial • regulatory • investment return
Taiwan Research Institute (TRI) Taipei, October 5th, 2011
6 /118
Lessons learnt from the European and North American experience and knowledge
Lecture main goals (foll.)
2. Operative aspects • standard evolution • development of Large Electrical Laboratories, with a
particular emphasis to High Power Laboratories • alternative modalities to check the product quality and
performances
3. Discussion with the audience about possible technical analogies and market symmetry (or asymmetry) of the Asian market (with particular regards to the Taiwanese situation).
Taiwan Research Institute (TRI) Taipei, October 5th, 2011

7 /118
Lessons learnt from the European and North American experience and knowledge
Main sources • The experience and knowledge of DeMEPA partners and friend experts • DeMEPA internal technical and business development surveys • American Recovery and Reinvestment Act • Strategic Energy Technology (SET) Plan • EPIA – European Photovoltaic Industry Association. • National Renewable Energy Action Plans (NREAPs) • TEN-YEAR NETWORK DEVELOPMENT PLAN 2010-2020”, European Network of
Transmission System Operators for Electricity, 28 June 2010 • K.U.Leuven – ESAT/Electa • International Energy Agency • Fraunhofer Institute • RTE – Gestionnaire du Rèseau de Transport de l’Electricité • Siemens • ABB
Taiwan Research Institute (TRI) Taipei, October 5th, 2011
8 /118
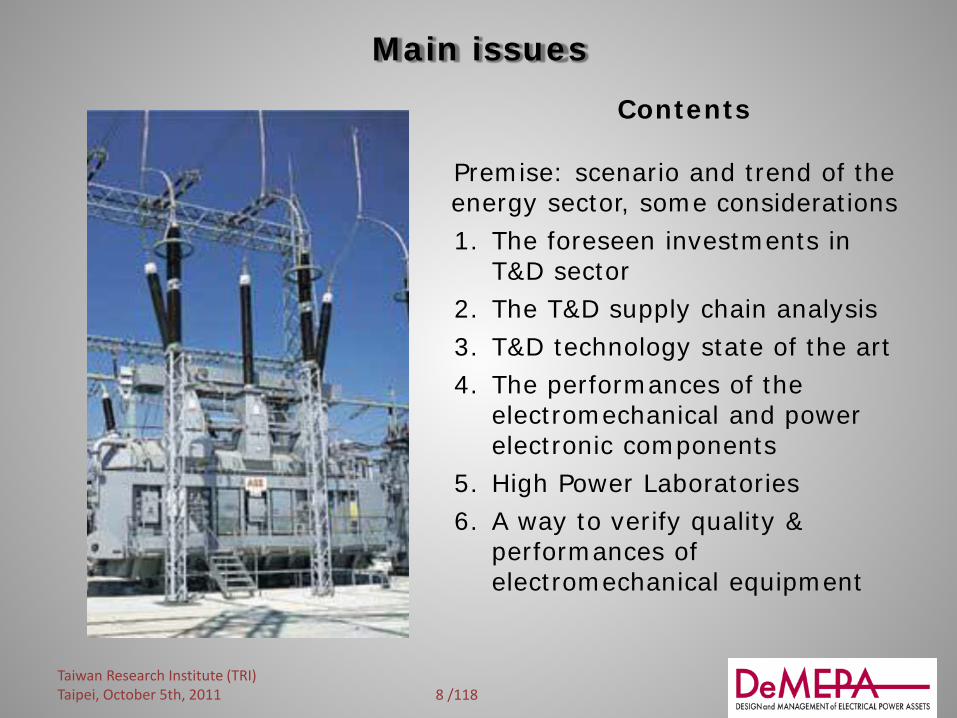
Main issues Contents
Premise: scenario and trend of the energy sector, some considerations 1. The foreseen investments in
T&D sector 2. The T&D supply chain analysis 3. T&D technology state of the art 4. The performances of the
electromechanical and power electronic components
5. High Power Laboratories 6. A way to verify quality &
performances of electromechanical equipment
Taiwan Research Institute (TRI) Taipei, October 5th, 2011

9 /118
Premise - Scenario and trend of the energy sector - Some considerations
• a worldwide level awareness of the urgent need for a sustainable development models for the electricity
sector is growing
• the theme of climate change is now central for the development and operation of the electrical system
• The opposing economic interests of developed countries (USA, EU, Japan), BRIC countries (Brazil, Russia, India, China,Turkey) and developing countries have not led yet to a global agreement
• However, the leading countries are developing national measures to reduce greenhouse gas emissions and to increase the use of renewable clean energy production
Taiwan Research Institute (TRI) Taipei, October 5th, 2011
10 /118
Premise - Scenario and trend of the energy sector - Some considerations
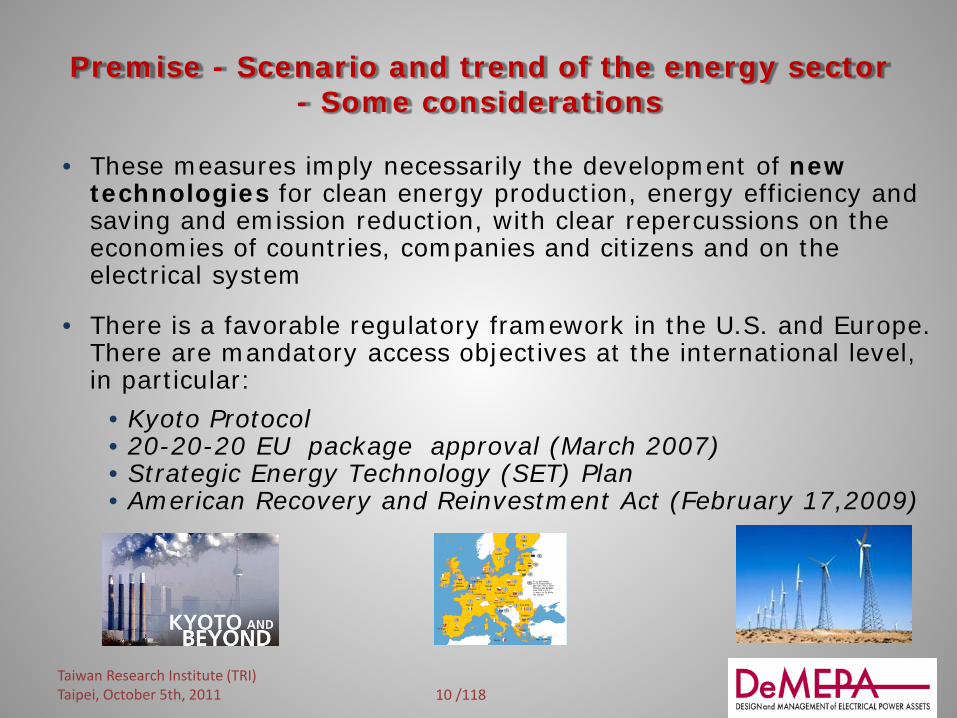
• These measures imply necessarily the development of new technologies for clean energy production, energy efficiency and saving and emission reduction, with clear repercussions on the economies of countries, companies and citizens and on the electrical system
• There is a favorable regulatory framework in the U.S. and Europe. There are mandatory access objectives at the international level, in particular:
• Kyoto Protocol • 20-20-20 EU package approval (March 2007) • Strategic Energy Technology (SET) Plan • American Recovery and Reinvestment Act (February 17,2009)
Taiwan Research Institute (TRI) Taipei, October 5th, 2011

11 /118
Premise - Scenario and trend of the energy sector - Some considerations
• The low-carbon and renewable generation targets, coupled with system efficiency, reliability and internal market development objectives, require extensive changes to the power grids
• The future grids must fully exploit the use of both large centralised generators and smaller distributed power sources
Conclusion: the push for decarbonization is a major challenge for operators in the electricity sector to significantly redirect their developments, new investments and also the modality of operation and maintenance of existing assets
Source: M. Sánchez. European Commission DG TREN. European Smart Grids Strategies Berlin 17-18 September
Taiwan Research Institute (TRI) Taipei, October 5th, 2011

12 /118
Premise - Scenario and trend of the energy sector - Some considerations
Over the course of 2010, the total capacity installed in the world was nearly 40 GW, producing about 50 TWh of electrical energy every year.
In 2010, gas was the leading energy technology in terms of capacity growth in Europe, with a total installation of about 20 GW.
In 2010, PV was the leading renewable energy technology in terms of capacity growth in Europe, with 13.3 GW installed, followed by wind with 9.3 GW; PV was second only to gas power plants.
Although 2010 Renewable Energy reached high levels of installations, the road to a carbon-free power generation mix is still a long way off.
Taiwan Research Institute (TRI) Taipei, October 5th, 2011

13 /118
Premise - Scenario and trend of the energy sector - Some considerations
It is possible to question whether the increase in gas installations is related to the increase in the use of variable electricity sources (such as PV and wind).
Today the investments in the electricity sector are driven more by strong financial business causes than network stability considerations. This situation could become critical, since there is no responsible "institution" at the national and international levels for the planning and verification of investments in generation (amount, localization and mix) in regard to transmission.
There is a global trend currently pushing investors to redirect investments into gas and re-newables, rather than coal and nuclear.
Taiwan Research Institute (TRI) Taipei, October 5th, 2011
14 /118
Premise - Scenario and trend of the energy sector
- Some considerations
The number of coal power plant projects cancelled in 2010 results directly from the increase in investments in re-newables, reducing the need for any additional capacities that are insufficiently flexible to integrate in tomorrow’s power generation mix.
The other re-newables are also progressing, but without
reaching the high levels that PV and wind reach. The new generation mix, with a strong emphasis on non
programmable RE, such as wind and solar, creates a possible unbalance due to the increasing share of the renewable sources.
Taiwan Research Institute (TRI) Taipei, October 5th, 2011

15 /118
Chapter 1 - The foreseen investments in T&D
sector
Contents
1. Present European power system 2. European investments in 2010-2030
period 3. Worldwide investments in 2010-2030
period 4. Detailed consideration on worldwide
investments in 2012–2017 period
Taiwan Research Institute (TRI) Taipei, October 5th, 2011
16 /118
Chapter 1.1 Present European Power system
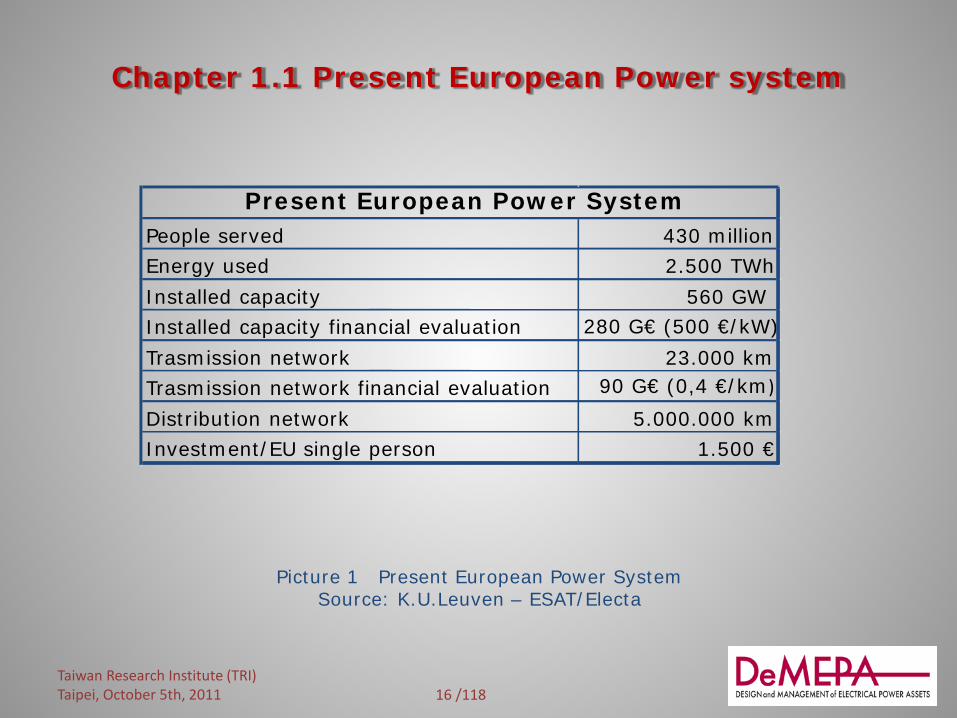
Picture 1 Present European Power System Source: K.U.Leuven – ESAT/Electa
People served 430 million Energy used 2.500 TWh Installed capacity 560 GW Installed capacity financial evaluation 280 G€ (500 €/kW) Trasmission network 23.000 km Trasmission network financial evaluation 90 G€ (0,4 €/km) Distribution network 5.000.000 km Investment/EU single person 1.500 €
Present European Power System
Taiwan Research Institute (TRI) Taipei, October 5th, 2011
17 /118
Chapter 1.2 European investments in 2010-2030 period
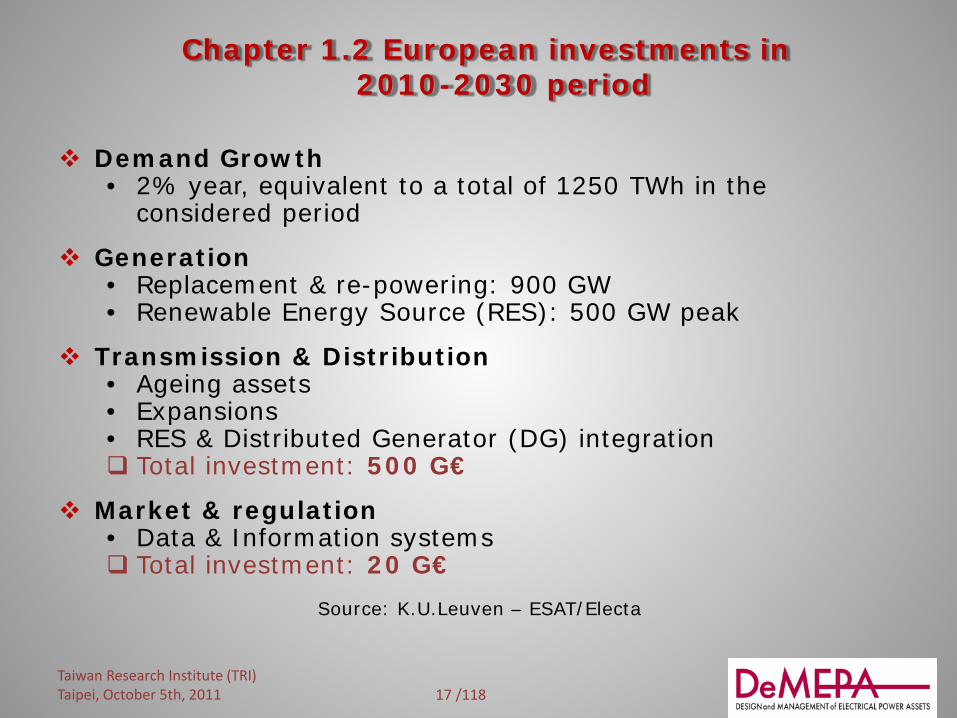
Demand Growth
• 2% year, equivalent to a total of 1250 TWh in the considered period
Generation
• Replacement & re-powering: 900 GW • Renewable Energy Source (RES): 500 GW peak
Transmission & Distribution • Ageing assets • Expansions • RES & Distributed Generator (DG) integration Total investment: 500 G€
Market & regulation • Data & Information systems Total investment: 20 G€
Source: K.U.Leuven – ESAT/Electa
Taiwan Research Institute (TRI) Taipei, October 5th, 2011
18 /118
Chapter 1.2 European investments in 2010–2030 period
The European commitment to support the low carbon economy could increase electricity demand, not reduce it! Key aspects:
• Investment growth for all the phases of the power infrastructure supply chain
• The T&D weight is similar to the power generator weight • The Transmission weight is about three times the Distribution
weight • The refurbishment/reinforcement investments are about the
60% of the total investment in the T&D sector • In 2010 the renewable energy weights 55% of the total energy,
in 2020 it will weight about 75-80%
Source: DeMEPA analysis
Taiwan Research Institute (TRI) Taipei, October 5th, 2011
19 /118
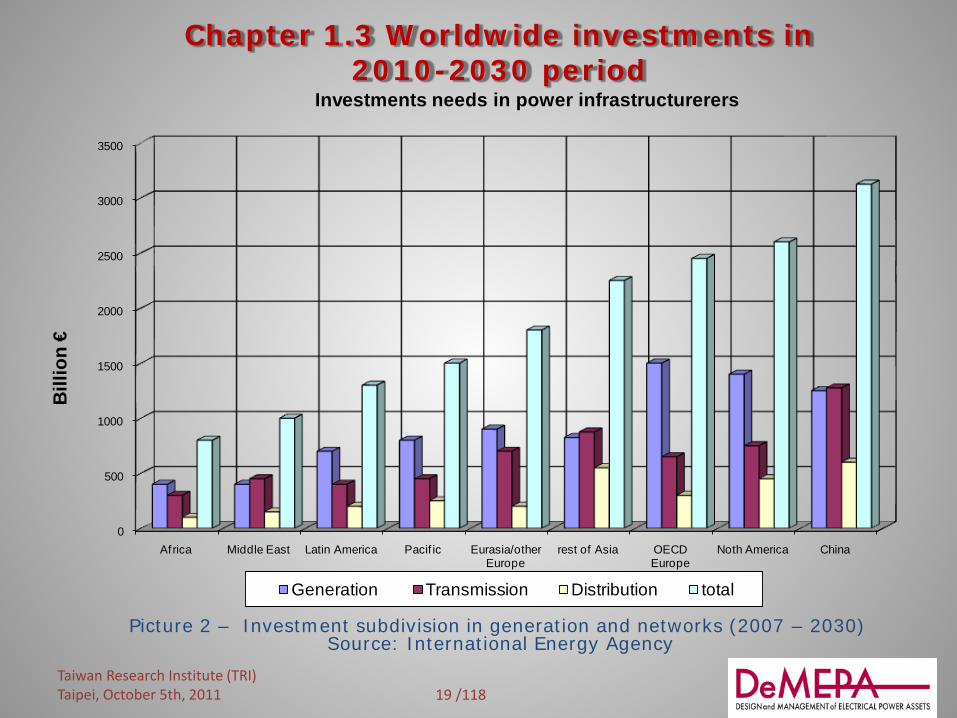
Chapter 1.3 Worldwide investments in 2010-2030 period
Picture 2 – Investment subdivision in generation and networks (2007 – 2030) Source: International Energy Agency
0
500
1000
1500
2000
2500
3000
3500
Africa Middle East Latin America Pacif ic Eurasia/other Europe
rest of Asia OECD Europe
Noth America China
Bill
ion
€
Investments needs in power infrastructurerers
Generation Transmission Distribution total
Taiwan Research Institute (TRI) Taipei, October 5th, 2011
20 /118
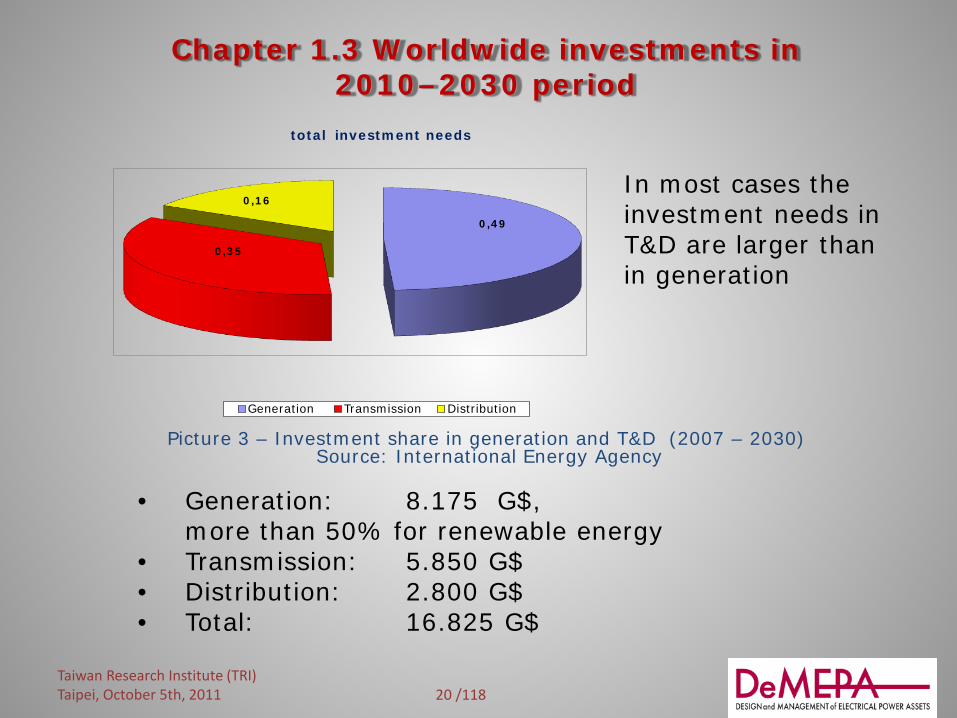
Chapter 1.3 Worldwide investments in 2010–2030 period
In most cases the investment needs in T&D are larger than in generation
Picture 3 – Investment share in generation and T&D (2007 – 2030) Source: International Energy Agency
• Generation: 8.175 G$, more than 50% for renewable energy • Transmission: 5.850 G$ • Distribution: 2.800 G$ • Total: 16.825 G$
0,49
0,35
0,16
total investment needs
Generation Transmission Distribution
Taiwan Research Institute (TRI) Taipei, October 5th, 2011

21 /118
Chapter 1.3 Worldwide investments in 2010-2030 period
Picture 4 Yearly worldwide investments, 2007 – 2030 period Source: DeMEPA analysis
0
50
100
150
200
250
300
350
2007
2008
2009
2010
2011
2012
2013
2014
2015
2016
2017
2018
2019
2020
2021
2022
2023
2024
2025
2026
2027
2028
2029
2030
G€
Yearly worldwide additional investments (2007 - 2030)
Transmission Distribution
Taiwan Research Institute (TRI) Taipei, October 5th, 2011
22 /118
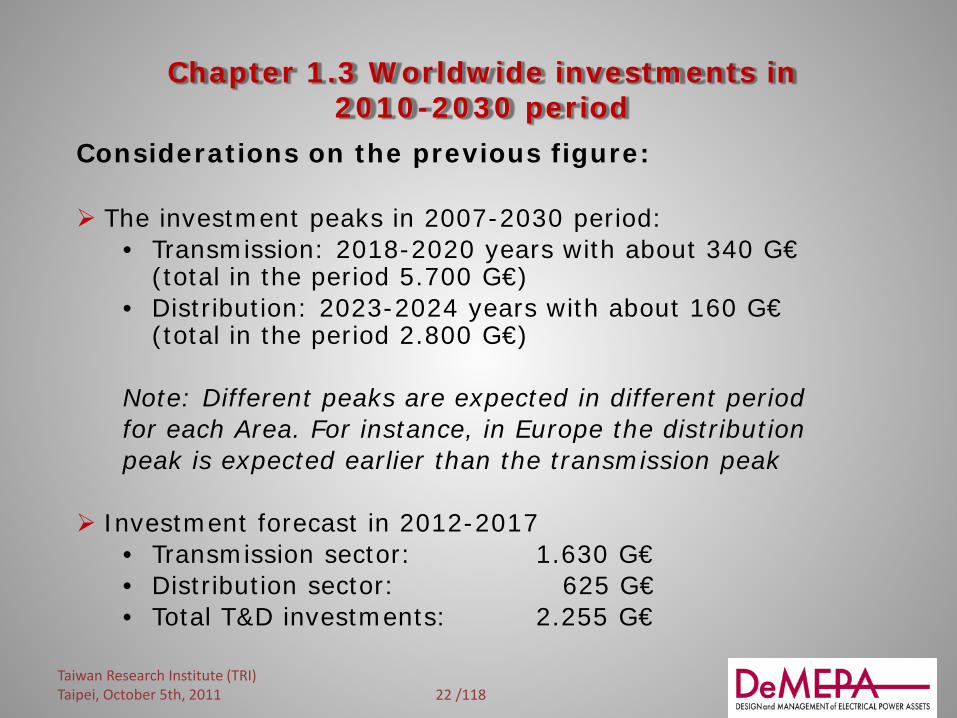
Chapter 1.3 Worldwide investments in 2010-2030 period
Considerations on the previous figure: The investment peaks in 2007-2030 period:
• Transmission: 2018-2020 years with about 340 G€ (total in the period 5.700 G€)
• Distribution: 2023-2024 years with about 160 G€ (total in the period 2.800 G€)
Note: Different peaks are expected in different period for each Area. For instance, in Europe the distribution peak is expected earlier than the transmission peak
Investment forecast in 2012-2017 • Transmission sector: 1.630 G€ • Distribution sector: 625 G€ • Total T&D investments: 2.255 G€
Taiwan Research Institute (TRI)
Taipei, October 5th, 2011

23 /118
Chapter 1.4 Detailed consideration on worldwide investments in 2012-2017 period
It appears that, in the considered period, the investments increase of about 50% for Transmission and Distribution
Picture 5 T&D investment (2012-2017). Source: DeMEPA analysis
years Transmission Distribution2012 210 802013 250 902014 270 1002015 275 1102016 300 1202017 325 125total 1.630 625
super total
T&D investments - 2012-2017 (G€)
2.255
Taiwan Research Institute (TRI) Taipei, October 5th, 2011
24 /118
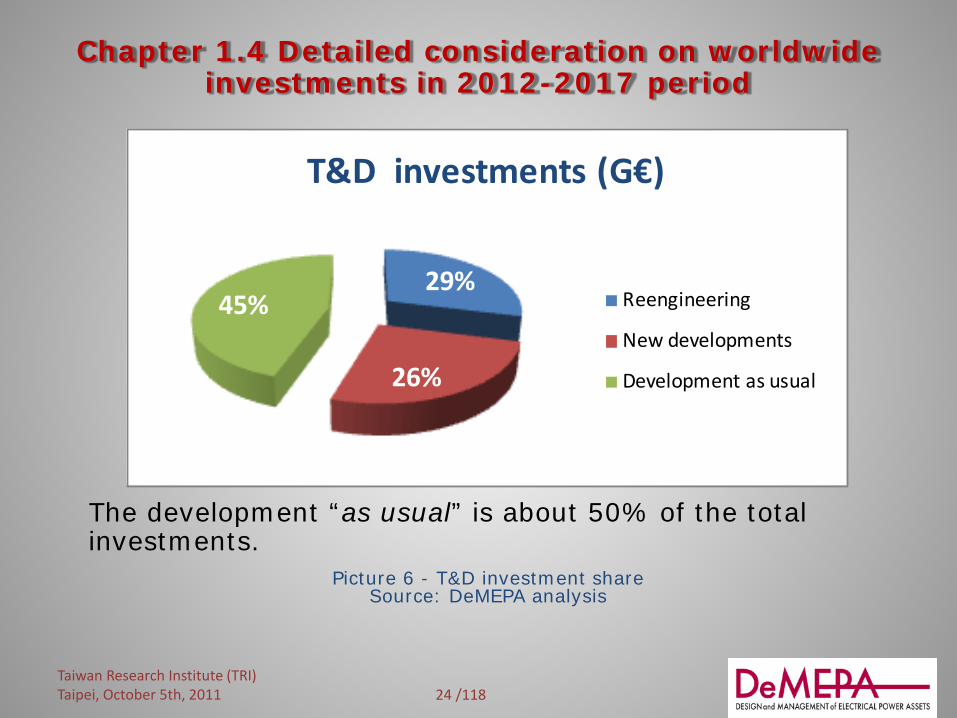
Chapter 1.4 Detailed consideration on worldwide investments in 2012-2017 period
The development “as usual” is about 50% of the total investments.
Picture 6 - T&D investment share Source: DeMEPA analysis
29%
26%
45%
T&D investments (G€)
Reengineering
New developments
Development as usual
Taiwan Research Institute (TRI) Taipei, October 5th, 2011

25 /118
Chapter 1.4 Detailed consideration on worldwide investments in 2012-2017 period
Re-engineering
In “re-engineering” the following activities are included: • Capacity performance improvements related to voltage
level, short circuit capacity (it may include replacement of electrical component)
• Automation performance improvement • Update or replacement of protection systems • Update or replacement of diagnostic apparatuses • Update or replacement of telecommunication apparatuses
Note: “re-engineering” brings together the meaning of refurbishment, reinforcement, revamping, improvement
Taiwan Research Institute (TRI) Taipei, October 5th, 2011

26 /118
Chapter 1.4 Detailed consideration on worldwide investments in 2012-2017 period
Picture 7 - Transmission investment/activity matrix. Source: DeMEPA analysis
Taiwan Research Institute (TRI) Taipei, October 5th, 2011
gg g investment subdivision jiiijh
gggggggggggggggggggggggggggg gggggggggggggggggggggggggggg gggggggggggggggggggggggggggg gggggggggggggggggggggggggggg gggggggggggggggggggggggggggg gggggggggggggggggggggggggggg gggggggggggggggggggggggggggg gggggggggggggggggggggggggggg gggggggggggggggggggggggggggg gggggggggggggggggggggggggggg
gggggggggg activity subdivisio n
Tran
smis
sion
nve
stm
ents
(%
)
elec
tric
al c
ompo
nent
s (%
)
pow
er e
lect
roni
cs (
%)
lines
(%
)
diag
nost
ic &
aut
omat
ion
(%)
tele
com
mun
icat
ion
(%)
tota
l (%
)
Reengineering (%) 29 34 8 20 20 18 100 New developments (%) 26 38 7 35 10 10 100
Development as usual (%) 45 32 5 50 8 5 100
Total (%) 100 34 6 37 12 10 100 Note : civil works are excluded in this analysis

27 /118
Chapter 1.4 Detailed consideration on worldwide investments in 2012-2017 period
Picture 8 T&D investment/activity matrix Source: DeMEPA analysis
Taiwan Research Institute (TRI) Taipei, October 5th, 2011
inve
stm
ents
(%)
0%
10%
20%
30%
40%
50%
60%
70%
80%
90%
100%
transmission distribution
34% 41%
37% 22%
12% 17%
10% 20% 6%
elect. comp. lines diagn. & autom. telecomm. power electron.
28 /118
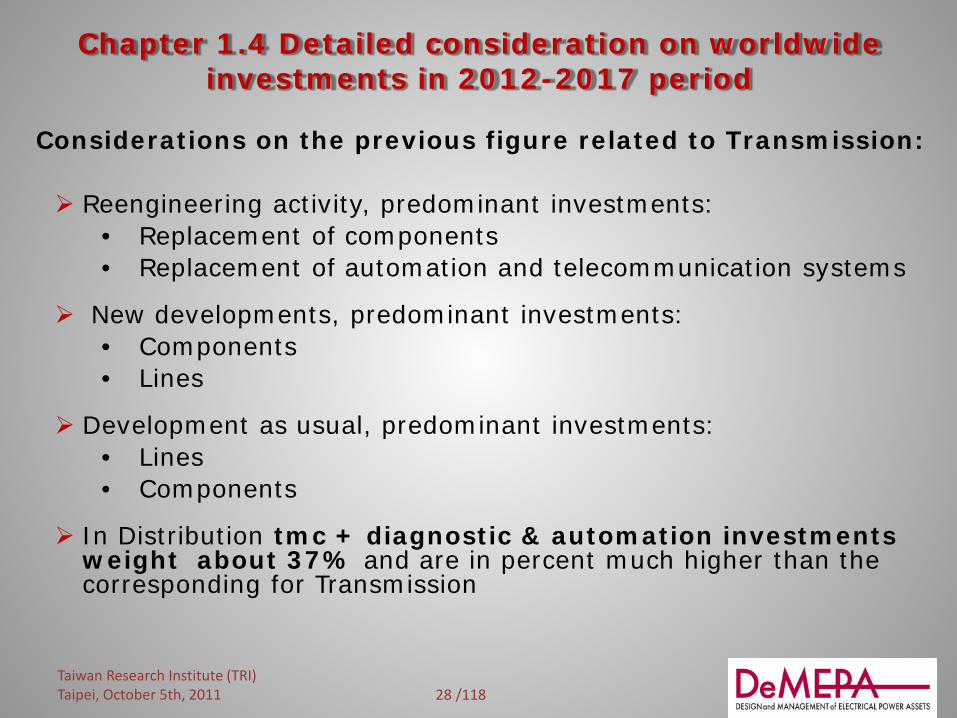
Chapter 1.4 Detailed consideration on worldwide investments in 2012-2017 period
Considerations on the previous figure related to Transmission: Reengineering activity, predominant investments:
• Replacement of components • Replacement of automation and telecommunication systems
New developments, predominant investments: • Components • Lines
Development as usual, predominant investments: • Lines • Components
In Distribution tmc + diagnostic & automation investments weight about 37% and are in percent much higher than the corresponding for Transmission
Taiwan Research Institute (TRI) Taipei, October 5th, 2011

29 /118
Chapter 2. T&D supply chain analysis
Contents
1. T&D supply chain analysis 2. The average margins 3. Purchasing modality
Taiwan Research Institute (TRI) Taipei, October 5th, 2011
30 /118
Chapter 2.1 T&D supply chain analysis
In this strategic analysis the following business areas are considered:
• Electromechanical component manufacturers (cable included)
• Power electronics manufacturers • Line constructors • Diagnostic and automation system manufacturers • Telecommunication system manufacturers • Installers (system integrators and EPC)
Sales and O&M activities are excluded in this analysis
Taiwan Research Institute (TRI) Taipei, October 5th, 2011
31 /118
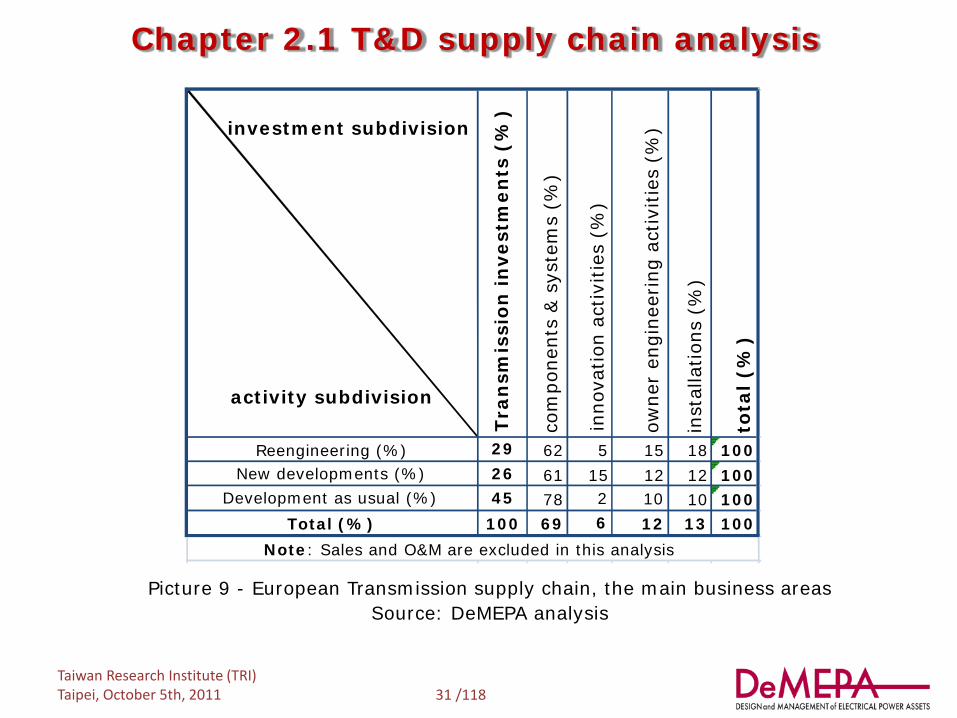
Chapter 2.1 T&D supply chain analysis
Picture 9 - European Transmission supply chain, the main business areas Source: DeMEPA analysis
Taiwan Research Institute (TRI) Taipei, October 5th, 2011
10
investment subdivision ggg
gggggggggggggggggggggggg gggggggggggggggggggggggg gggggggggggggggggggggggg gggggggggggggggggggggggg gggggggggggggggggggggggg gggggggggggggggggggggggg gggggggggggggggggggggggg ggggggggggggggjjjjjjjjjjjjjjjjjjjjj
jjjjggggggggggggg activity subdivision
Tran
smis
sion
inve
stm
ents
(%
)
com
pone
nts
& s
yste
ms
(%)
inno
vatio
n ac
tiviti
es (
%)
owne
r en
gine
erin
g ac
tiviti
es (
%)
inst
alla
tions
(%
)
tota
l (%
)
Reengineering (%) 29 62 5 15 18 100 New developments (%) 26 61 15 12 12 100
Development as usual (%) 45 78 10 100 Total (%) 100 69 6 12 13 100
Note : Sales and O&M are excluded in this analysis
2

32 /118
Chapter 2.2 The average margins
The knowledge of these information is fundamental for any interested operator in starting up businesses in the European market, selecting the most interesting business model to follow. The available data about the “whole European average margins” is not sufficient to support the operator as the variance is too big and it gives no information on the effective remunerability of the different business areas.
Taiwan Research Institute (TRI) Taipei, October 5th, 2011
It has to be noted that we are talking about gross margin (EBITDA) and that it is necessary to find the net value to subtract the depreciation of machinery for the production.

33 /118
Chapter 2.2 The average margins
To know the real average margin, it is necessary to segment the European market, better focusing the analysis over:
• country
• market sector (transmission, distribution, industry, railways, etc.)
• business scenario (products as usual, advanced products re-engineering phase, etc.)
• product typology (transformers, circuit breakers, power cables, etc.)
In the course of early 2000s, an increase of variance and volatility was experienced, especially in manufacturing and system integration areas, often accompanied by low margins. The average margin was about 10%, with some big companies with negative margins and others with positive margins, even over 20%.
Taiwan Research Institute (TRI) Taipei, October 5th, 2011

34 /118
Chapter 2.2 The average margins
In the period 2012-2014, a reversal trend for the margin is expected, in particular for manufacturers and system integrators, as a consequence of:
a better production standardization that allows to maintain/increase the profitability level
investment in the "upstream" stage (integrated production not only related to the single component)
investment in the "downstream" stage (enhancing the project management skills, better design and supervision on construction and installation activities etc.)
new development in Distribution (smart metering, electrical station automation) and in Transmission areas (cross border interconnection, wind farm integration and super grids)
Taiwan Research Institute (TRI) Taipei, October 5th, 2011
35 /118
Chapter 2.2 The average margins
Currently, the manufacturing area is still volatile, mainly due to the competition impact coming from the: Eastern Europe companies (Poland, Hungary, Chzech
Republic, Turkey) for distribution components Asian companies (India, China, Malaysia) for LV components,
MV fuses, MV/HV insulators The consequent difficulties for some European manufacturers
to saturate their capacity.
These Eastern Europe and Asian companies operating in Europe have reached in the above segments significant results (20%), while the European companies have got a smaller result (10%). On the contrary, a significant margin growth is seen for advanced products, such as power cables (in particular for DC applications), HV power components, MV/HV power electronics, automation and telecommunication systems.
Taiwan Research Institute (TRI) Taipei, October 5th, 2011
36 /118
Chapter 2.2 The average margins
The system integrator area is still volatile. The variability is due to the extreme different characteristics of market segments and above all the applications.
Low margins are foreseen for poor applications. Extremely interesting margins are foreseen when
complex system, integrating electrical and power electronic components, automation and telecommunication systems are involved.
It clearly appears that the only production of components by European Manufacturers, especially in LV/MV (without any added value such as energy efficiency design, products for special niches, automation and diagnostic integrated systems) is not able to ensure an acceptable level of profitability, especially when compared with the profitability obtained by integrated operators (14÷18%).
Taiwan Research Institute (TRI) Taipei, October 5th, 2011
37 /118
Chapter 2.2 The average margins
Sales and distributions are clearly another "critical" issues in terms of profitability.
In 2008 the average values were equal to 5% because of the aggressive approach of the competitors, represented by: integrated manufacturers and system integrators, that in
many cases jump the distribution chain to reach directly the final customer
the installers (especially the large ones) that take advantage of their greater power coming from the market control and monitoring.
Taiwan Research Institute (TRI) Taipei, October 5th, 2011
For the owner engineering companies, which design and support the buyers, the average margin got back to the levels of first 2000 years (15%). The EPC contractor are able to achieve even higher margins (up to 20%).

38 /118
Chapter 2.3 Purchasing modality Scenario 1 The Utility, with the technical support of the Owner’s Engineer, has a direct relationship with the manufacturer. In this case, the buyer makes direct shopping, choosing among the various component suppliers. This model is based on the figure of the "Owner's Engineer" which supports the buyer in the preliminary studies: choice of components, tender documents, selection of suppliers and project implementation supervision
Taiwan Research Institute (TRI) Taipei, October 5th, 2011
The role of the Owner’s Engineer is mostly carried out by external engineering companies.
39 /118
Chapter 2.3 Purchasing modality Scenario 2 The Utility (buyer) has a direct relationship with the system integrators which provide technological and system expertise in addition to the whole system supply capability.
This model is especially applicable in the "early stage" contexts with innovative technologies, such as:
• Smart metering. The position of Systems Integrator with a strong background in IT and telecommunication fields is strengthened. These system integrators are often charged for the development of SW applications and integration. They may also have an extended role by participating in the design phase, in the system architecture definition, in the technology selection and selection of vendors.
• HVDC interconnection lines, where the system integrators have
electromechanical and power electronics background.
Taiwan Research Institute (TRI) Taipei, October 5th, 2011

40 /118
Chapter 3 Technology state of the art in T&D sector
• Contents • The new generation
paradigm • Intelligent future use of
Energy • European framework for
MV/HV grids • Super grids • HVDC interconnections • Smart grids • Micro grids • TSO and DSO • Technology state of the art
in T&D sector
• Evaluations based on the European technology
Taiwan Research Institute (TRI) Taipei, October 5th, 2011
41 /118
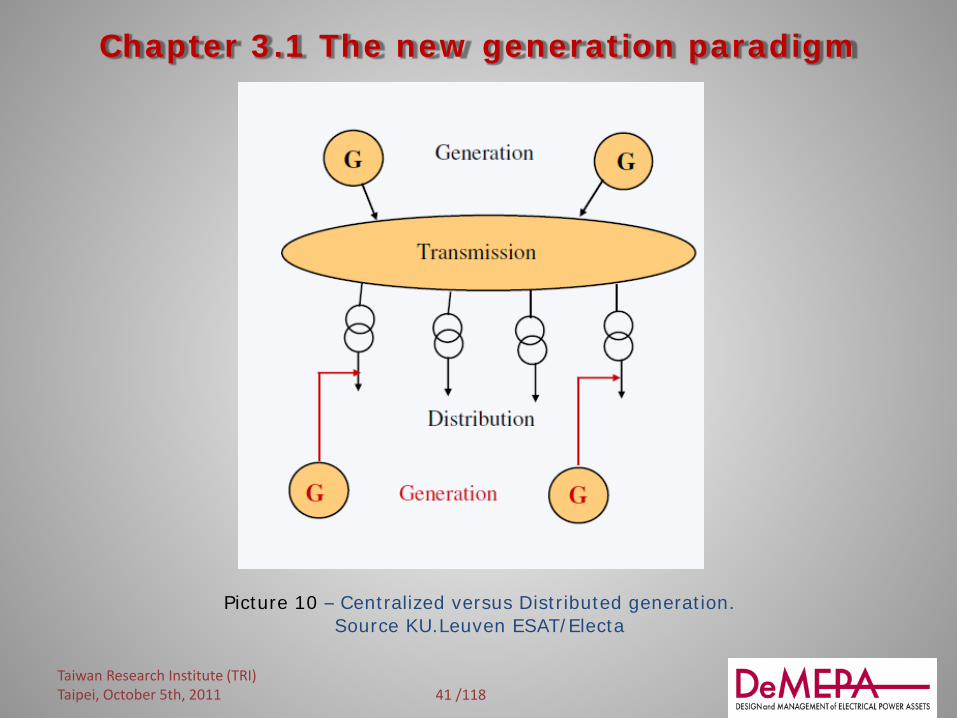
Chapter 3.1 The new generation paradigm
Picture 10 – Centralized versus Distributed generation. Source KU.Leuven ESAT/Electa
Taiwan Research Institute (TRI) Taipei, October 5th, 2011

42 /118
Chapter 3.1 The new generation paradigm
Picture 11 – Centralized versus Distributed generation. Source KU.Leuven ESAT/Electa
Taiwan Research Institute (TRI) Taipei, October 5th, 2011
43 /118
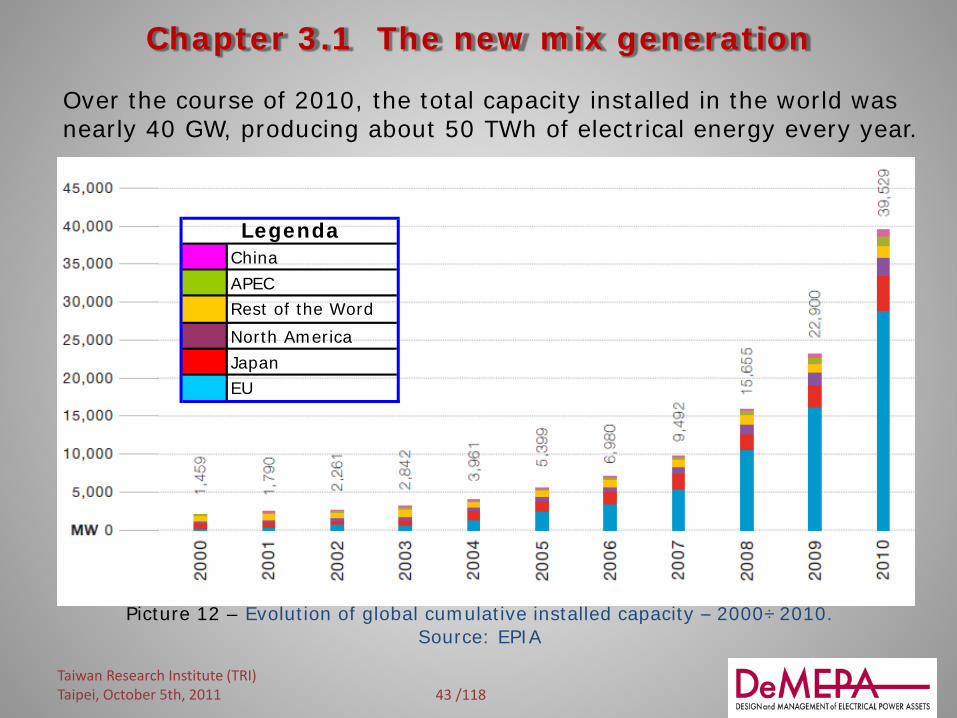
Chapter 3.1 The new mix generation
Picture 12 – Evolution of global cumulative installed capacity – 2000÷2010. Source: EPIA
China APECRest of the WordNorth AmericaJapanEU
Legenda
Taiwan Research Institute (TRI) Taipei, October 5th, 2011
Over the course of 2010, the total capacity installed in the world was nearly 40 GW, producing about 50 TWh of electrical energy every year.

44 /118
Chapter 3.1 The new mix generation
Picture 13 – Power generation capacities added in 2010 in EU 27.
Source: EPIA
Taiwan Research Institute (TRI) Taipei, October 5th, 2011
45 /118
Chapter 3.1 The new mix generation
In 2010, gas was the leading energy technology in terms of capacity growth in Europe, with a total installation of about 20 GW.
In 2010, PV was the leading renewable energy technology in terms of capacity growth in Europe, with 13.3 GW installed in 2010, followed by wind with 9.3 GW; PV was thus second only to gas power plants.
Although in 2010 the Renewable Energy reached high levels of installations, the road to a carbon-free power generation mix is still a long way off.
It is possible to wonder whether the increase in gas installations is related to the increase in the use of variable electricity sources (such as PV and wind).
Taiwan Research Institute (TRI) Taipei, October 5th, 2011

46 /118
Chapter 3.1 The new mix generation
Today the investments in the electricity sector are driven more by strong financial business cases, than network stability considerations. This situation could become critical, since there is no responsible "institution" at the national and European level for the planning and verification of generation investments (amount, localization and mix) as for the transmission.
There is a global trend currently pushing investors to redirect investments into gas and renewables, rather than coal and nuclear.
The number of coal power plant projects cancelled in 2010 results directly from the increase in investments in renewables, reducing the need for additional capacities that are insufficiently flexible to integrate in tomorrow’s power generation mix.
Taiwan Research Institute (TRI) Taipei, October 5th, 2011
47 /118
Chapter 3.1 The new mix generation
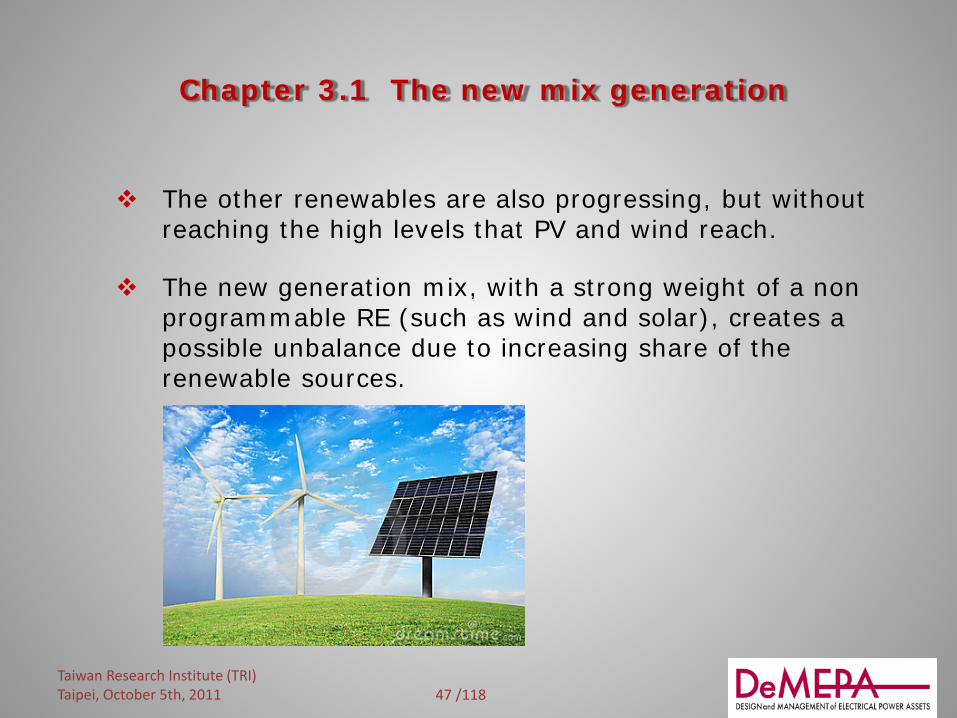
The other renewables are also progressing, but without reaching the high levels that PV and wind reach.
The new generation mix, with a strong weight of a non programmable RE (such as wind and solar), creates a possible unbalance due to increasing share of the renewable sources.
Taiwan Research Institute (TRI) Taipei, October 5th, 2011
48 /118
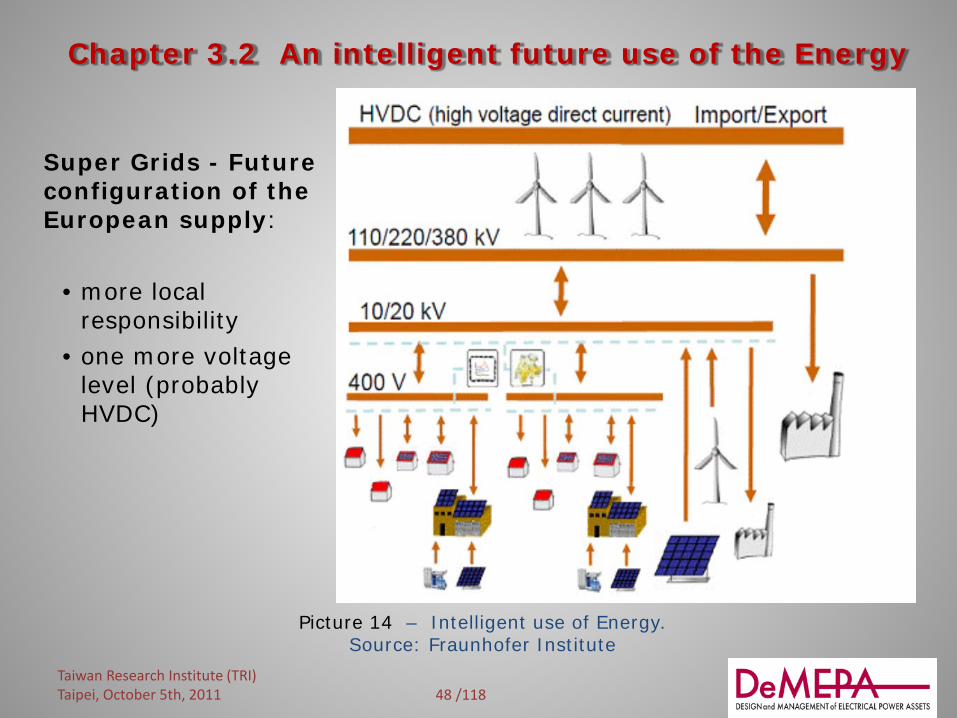
Chapter 3.2 An intelligent future use of the Energy
Super Grids - Future configuration of the European supply:
• more local responsibility
• one more voltage level (probably HVDC)
Picture 14 – Intelligent use of Energy. Source: Fraunhofer Institute
Taiwan Research Institute (TRI) Taipei, October 5th, 2011
49 /118
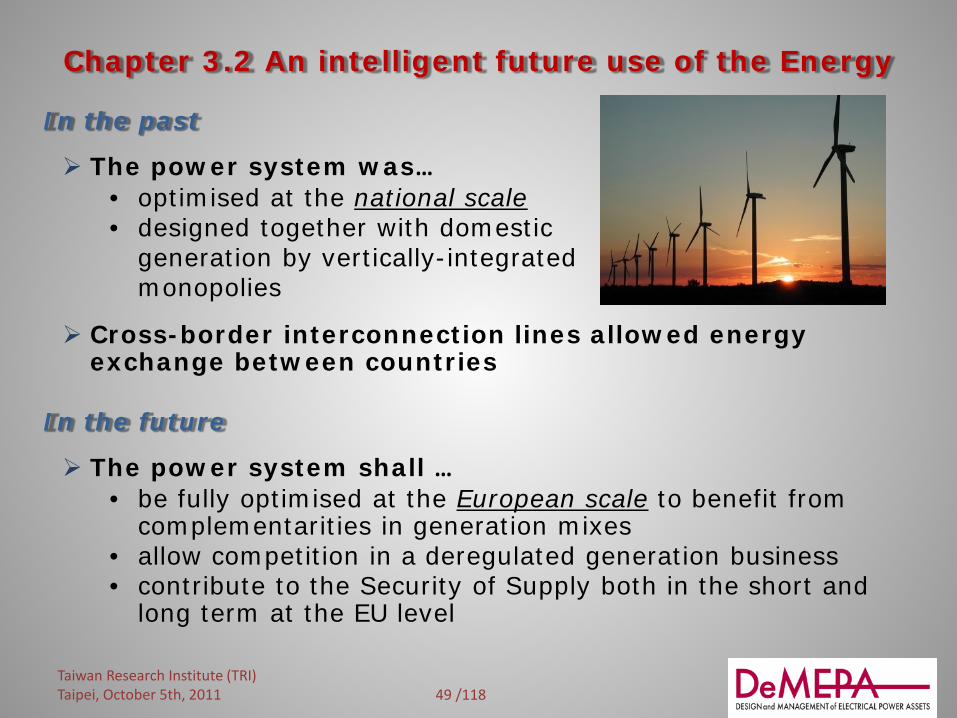
Chapter 3.2 An intelligent future use of the Energy
In the past
The power system was… • optimised at the national scale • designed together with domestic generation by vertically-integrated monopolies
Cross-border interconnection lines allowed energy exchange between countries
In the future
The power system shall … • be fully optimised at the European scale to benefit from
complementarities in generation mixes • allow competition in a deregulated generation business • contribute to the Security of Supply both in the short and
long term at the EU level
Taiwan Research Institute (TRI) Taipei, October 5th, 2011
50 /118
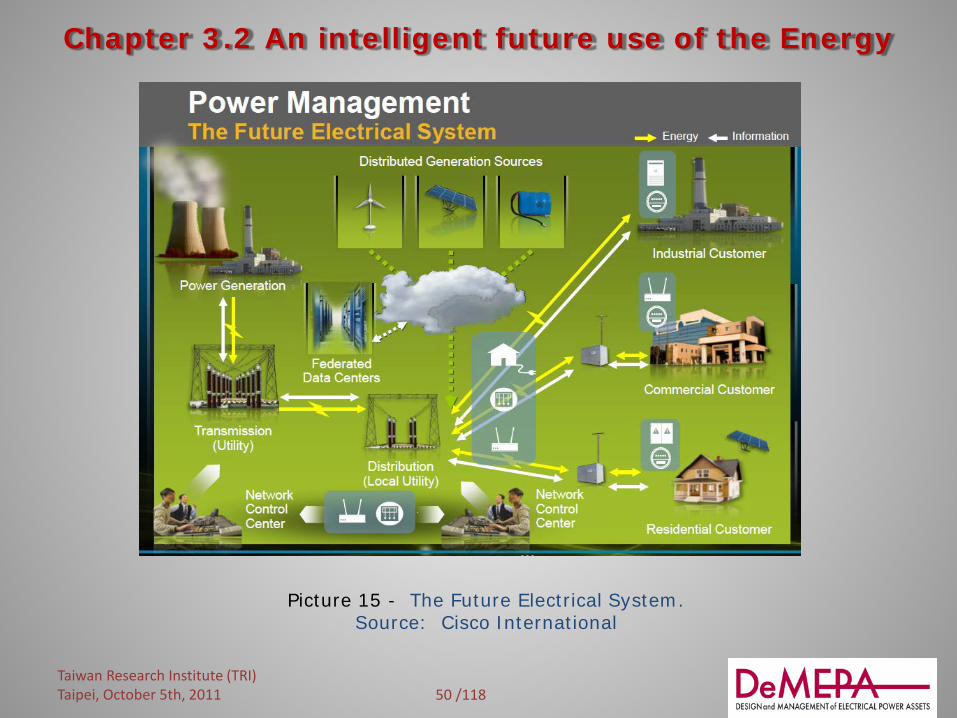
Chapter 3.2 An intelligent future use of the Energy
Picture 15 - The Future Electrical System. Source: Cisco International
Taiwan Research Institute (TRI) Taipei, October 5th, 2011

51 /118
Picture 16- The European electricity grid. Source: M. Sánchez. European Commission DG TREN.
Chapter 3.3 European framework for MV/HV grids
Taiwan Research Institute (TRI) Taipei, October 5th, 2011

52 /118
Chapter 3.3 European framework for MV/HV grids
Today’s Market Framework – A Passive DSO role
Picture 17 – The Future Electrical System. Source: Cisco International
Taiwan Research Institute (TRI) Taipei, October 5th, 2011

53 /118
Chapter 3.3 European framework for MV/HV grids Future European market framework –
DSO as Central and Active Player
Picture 18 – The Future Electrical System. Source: Cisco International
Taiwan Research Institute (TRI) Taipei, October 5th, 2011

54 /118
Chapter 3.4 Super Grids Super Grid an electricity transmission system, mainly
based on direct current, designed to facilitate large-scale sustainable power generation in remote areas for transmission to centers of consumption.
Super Grid fundamental attribute: the enhancement of the electricity market.
Super Grid is not an extension of existing point-to-point HVDC interconnectors between some EU Member States!
Super Grid will allow future generation to be built where resources are optimal and not constrained and transported to existing grids at key nodes.
Taiwan Research Institute (TRI) Taipei, October 5th, 2011
55 /118

56 /118
Chapter 3.4 Super Grids
Picture 19 – Wind power development in Europe. Source: EWEA
Wind power development in Europe: an impetus for change in transmission business
Taiwan Research Institute (TRI) Taipei, October 5th, 2011
57 /118
Chapter 3.4 Super Grids
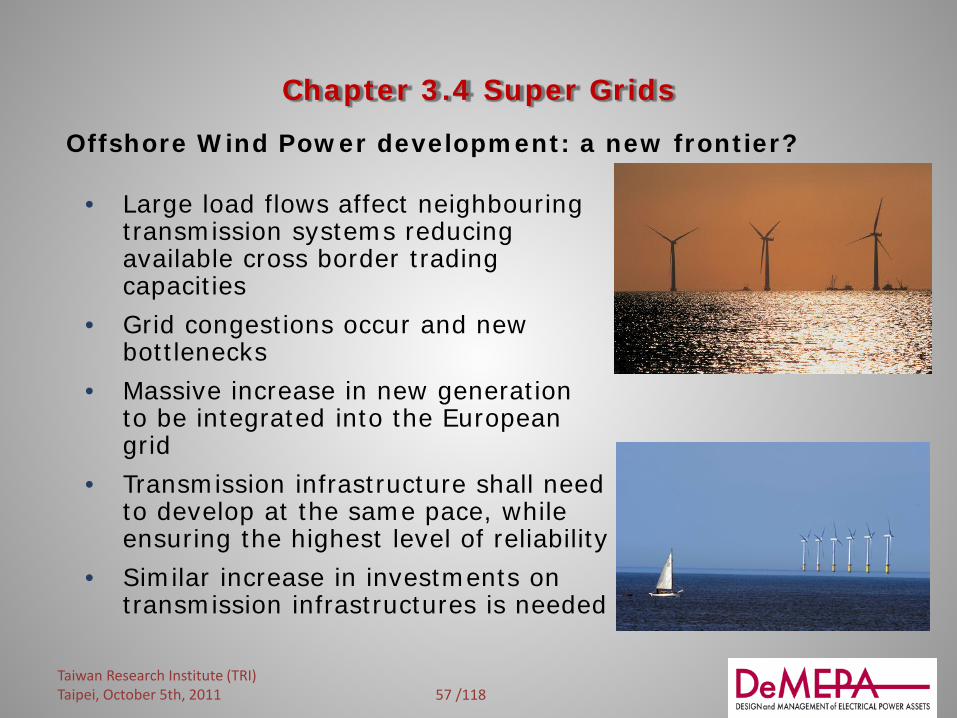
Offshore Wind Power development: a new frontier?
• Large load flows affect neighbouring transmission systems reducing available cross border trading capacities
• Grid congestions occur and new bottlenecks
• Massive increase in new generation to be integrated into the European grid
• Transmission infrastructure shall need to develop at the same pace, while ensuring the highest level of reliability
• Similar increase in investments on transmission infrastructures is needed
Taiwan Research Institute (TRI)
Taipei, October 5th, 2011

58 /118
Chapter 3.4 Super Grids
Picture 20 – The Central and Northern situation. Source: Statnett
How to transfer power from North Europe to Central Europe? Through the super grids !!!
Taiwan Research Institute (TRI) Taipei, October 5th, 2011

59 /118
Chapter 3.4 Super Grids
How to connect renewable & to expand the offshore grids? Through the super grids !!!
Picture 21 – Connecting European Renewable Energies. Source: Siemens
Taiwan Research Institute (TRI) Taipei, October 5th, 2011
60 /118
Chapter 3.4 Super Grids
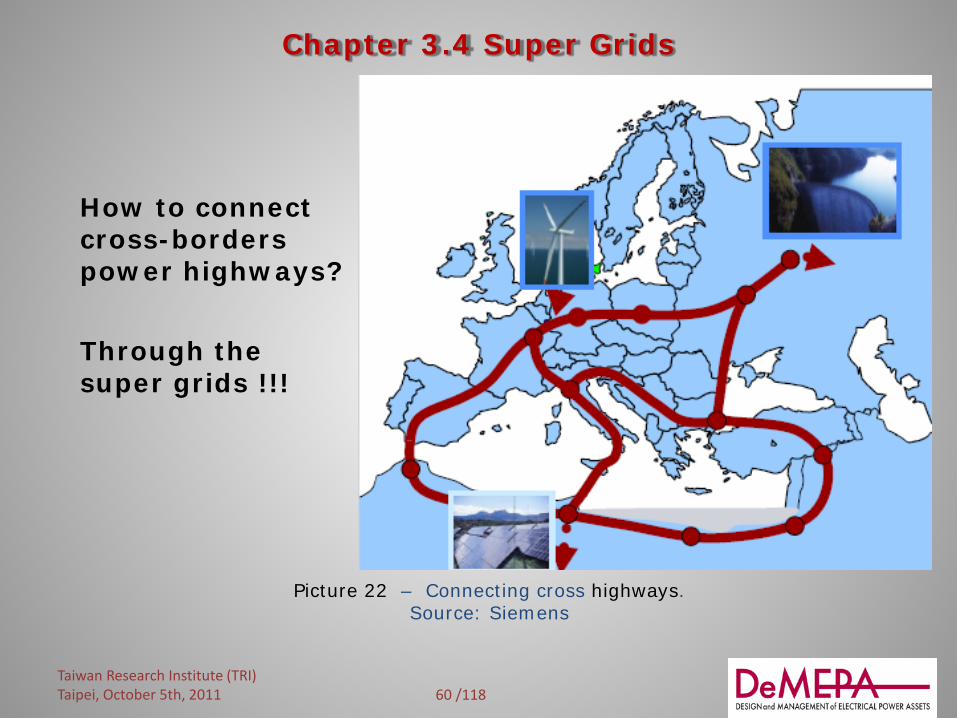
Picture 22 – Connecting cross highways. Source: Siemens
Introdurre figura How to connect cross-borders power highways? Through the super grids !!!
Taiwan Research Institute (TRI) Taipei, October 5th, 2011
61 /118
Chapter 3.4 Super Grids
Super Grids, open problems The HVDC super grids, unlike the point-to-point HVDC interconnections, are networks and must be operated as networks. For example: High and very high Short Circuit Current interruption Protection System Automation and Control
Taiwan Research Institute (TRI) Taipei, October 5th, 2011
62 /118
Chapter 3.4 Super Grids
Super Grids, open problems (foll.) Increasing value of wind power will require increasing
amount of flexible balancing capacity
Real time balancing (spinning and fast reserves for primary and secondary control)
Hour and short/medium term balancing Additional backup to manage hourly, daily, weekly variations
in the wind More flexible generation that will make it possible to integrate
more wind (better system and balance control)
Increasing amount of wind power will require a new approach for the transmission
New transmission capacity New O&M modalities New design and plan approach
Taiwan Research Institute (TRI) Taipei, October 5th, 2011
63 /118
Chapter 3.4 Super Grids
Super grids, open problems (foll.) Increasing amount of wind power will require a more
structured market
How to design the market to manage huge amounts of wind power?
Which new market instruments and other products to be developed?
How to design the market to include huge amounts of wind power?
How to manage the power system with more flexibility? How to manage the congestion in the network?
Increasing amount of wind power will require a new approach for automation of the European smart grid
Will it require an European EMS (Energy Management System) or will a strong coordination between the existing local EMS be sufficient ?
Taiwan Research Institute (TRI) Taipei, October 5th, 2011

64 /118
Chapter 3.5 HVDC interconnections
DC Power connection are used for: long distance transmission energy exports connections point-to-point with large generation
plants: offshore and onshore Wind Farm (e.g. Europe and USA), Solar Power Plant (e.g. Mediterranean Countries and Europe), Bulk Hydro Plant (e.g. South America, Asia and Africa)
redundancy reasons connection among networks with different
frequencies (50 and 60 Hz)
Taiwan Research Institute (TRI) Taipei, October 5th, 2011

65 /118
Chapter 3.5 HVDC interconnections
Picture 23 - North American HVDC Interconnections Source: Power System Interconnections using HVDC Links. Mr John Graham (ABB Brazil)
and Others
Taiwan Research Institute (TRI) Taipei, October 5th, 2011

66 /118
What is Smart Grids 20th Century Grid 21st Century Grid Electromechanical Digital Very limited (or one) way communications Two ways communications every where Few, if any, sensors – “Blind” operations Monitors and sensors throughout – usage, system status,
equipment condition Limited control over flows Pervasive control systems – substations, distribution &
feeder automation Reliability concerns – Manual restoration Adaptive protection, Semi automated restoration and,
eventually, self healing Sub - optimal asset utilization Asset life and system capacity extension trough condition
monitoring and dynamic limits Stand – alone information system and applications Enterprise Level Information Integration, Inter –
operability and coordinated automation Very limited, if any, distributed resources Large penetration of distributed, Intermittent and demand
– side resources Carbon based generation Carbon limits and Green Power Credits Emergency decision by Committee and phone Decision support systems, predictive reliability Limited price information, static tariff Full price information, dynamic tariff, demand response Few customer choices Many customer choices, value added services, integrated
demand – side automation
Chapter 3.6 Smart Grids
Picture 23 - What is a Smart Grid. Source CEER Workshop on Smart Grid, June 2009
Taiwan Research Institute (TRI) Taipei, October 5th, 2011

67 /118
Chapter 3.6 Smart Grids
The current distribution network is designed as "passive.” This means the network transports and distributes electricity in a one-way flow, (from the power station to the end user) and absorbs power only from the higher-voltage network levels.
The introduction of distributed generation in this network presents problems that can only be partially overcome. A massive penetration of distributed generation would provoke an unacceptable degradation of the service quality and would cause serious operational and protection problems.
Taiwan Research Institute (TRI) Taipei, October 5th, 2011
The main objectives of the Smart Grids consist of making consumers active parts in the energy supply and promoting the use of renewable sources and distributed generation.
68 /118
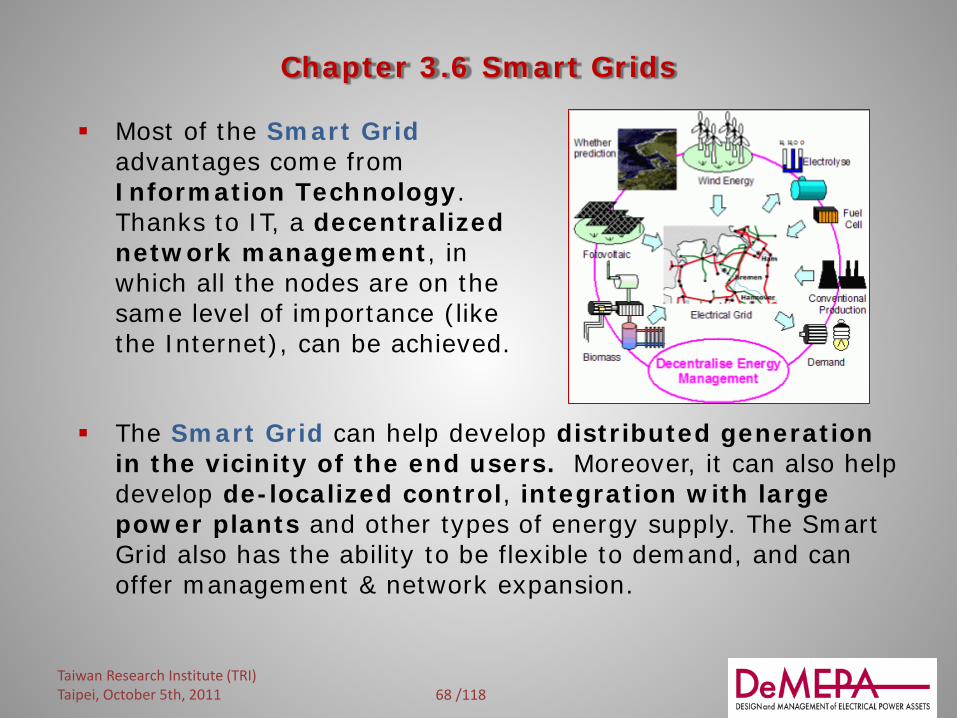
Chapter 3.6 Smart Grids
The Smart Grid can help develop distributed generation
in the vicinity of the end users. Moreover, it can also help develop de-localized control, integration with large power plants and other types of energy supply. The Smart Grid also has the ability to be flexible to demand, and can offer management & network expansion.
Taiwan Research Institute (TRI) Taipei, October 5th, 2011
Most of the Smart Grid advantages come from Information Technology. Thanks to IT, a decentralized network management, in which all the nodes are on the same level of importance (like the Internet), can be achieved.
69 /118
Chapter 3.6 Smart Grids
The active distribution system has three layers:
1. Copper-based energy infrastructures (electricity distr.) • Optimized topology • Power electronic devices
2. Communications layer • requirements of speed, quality, reliability, dependence on
costs • different communication technologies at the same time
3. Software layer • multiple software functions for normal operation • network reconfiguration • self-healing procedures • fault management • forecasting, modeling and planning.
Taiwan Research Institute (TRI) Taipei, October 5th, 2011
70 /118
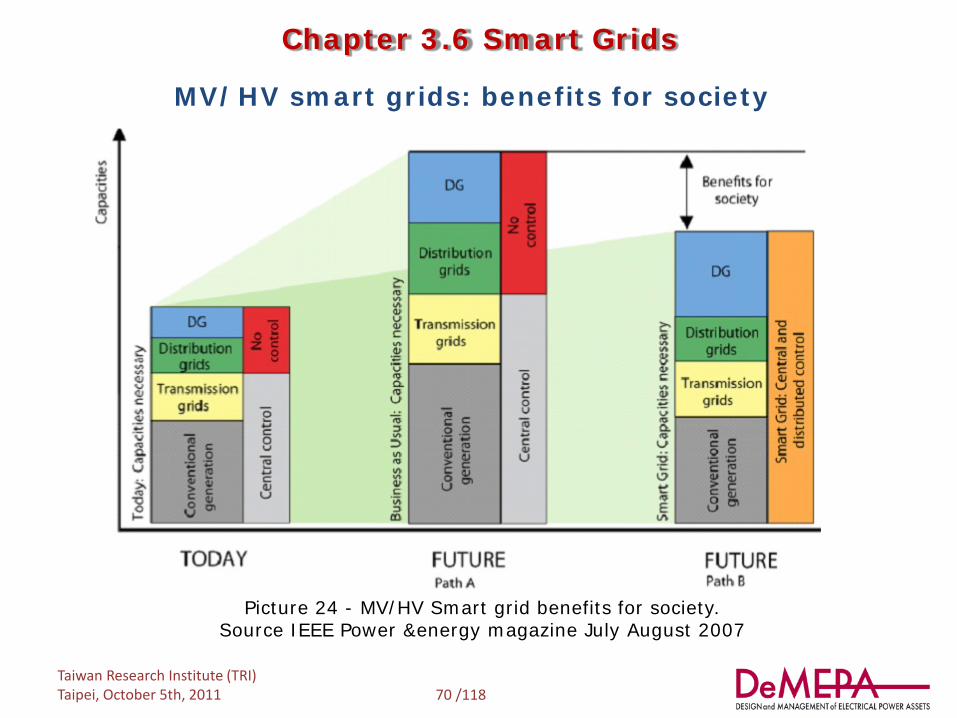
Chapter 3.6 Smart Grids
Picture 24 - MV/HV Smart grid benefits for society. Source IEEE Power &energy magazine July August 2007
MV/HV smart grids: benefits for society
Taiwan Research Institute (TRI) Taipei, October 5th, 2011
71 /118
Chapter 3.7 Micro Grids
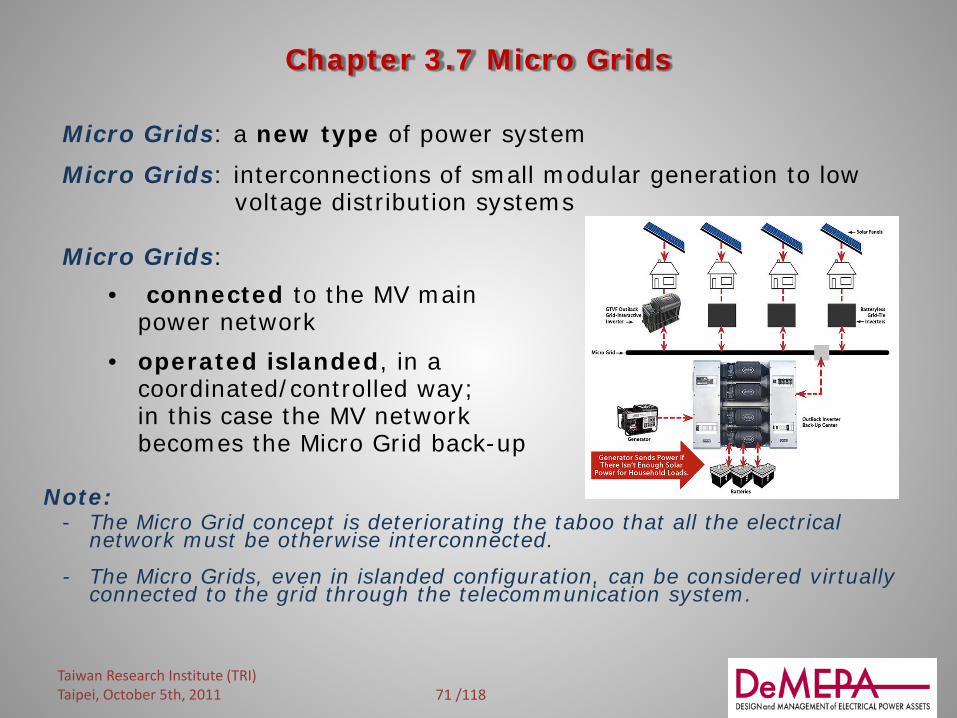
Micro Grids: a new type of power system
Micro Grids: interconnections of small modular generation to low voltage distribution systems Micro Grids:
• connected to the MV main power network
• operated islanded, in a coordinated/controlled way; in this case the MV network becomes the Micro Grid back-up
Note: - The Micro Grid concept is deteriorating the taboo that all the electrical
network must be otherwise interconnected.
- The Micro Grids, even in islanded configuration, can be considered virtually connected to the grid through the telecommunication system.
Taiwan Research Institute (TRI) Taipei, October 5th, 2011
72 /118
Chapter 3.7 Micro Grids
The first class of Micro Grids:
“Utility Micro Grid”
This is (part of) a feeder for a distribution grid, with local energy sources and consumers. This type of micro grid can facilitate a large-scale introduction of distributed sources and is able to satisfy increased user requests (either completely or partially), so that congestion problems can be avoided or reduced.
A utility micro grid can also deliver ancillary services to the grid. For example, the local delivery or absorption of reactive power and the guarantee of excellent power quality for (some of) the local users.
The principal objectives for the implementation of this structure are the reduction in the impact of grid faults on local users and the simplification of connecting distributed sources. This can be applied to both urban and rural areas.
Taiwan Research Institute (TRI) Taipei, October 5th, 2011

73 /118
Chapter 3.7 Micro Grids The second class of Micro Grids:
“Industrial or Commercial Micro Grids”
These are typically a collection of critical and/or sensitive loads requiring high power quality and reliability.:
data centers, university campuses, shopping centers, factories, industrial installations, residential neighbourhoods, etc.
Principal aims: increase of power quality, higher reliability and energy efficiency. Potentially, different loads can be further sub-divided into groups according to the required grade of power quality and reliability.
The micro grid can switch over to islanded operation in the event of a grid fault, during maintenance, periods of poor power quality, or when grid energy prices are high.
Taiwan Research Institute (TRI) Taipei, October 5th, 2011
74 /118
Chapter 3.7 Micro Grids
The third class of Micro Grids:
“Remote Micro Grid”
For the provision of energy in remote areas, in developing countries and islands, locally available energy sources, often renewable sources, are usually preferred. Combined Heat and Power (CHP) may be used. An autonomous micro grid is an appropriate network structure for such cases, with the possibility of its future connection to the electric grid. Frequently the extension to the electric grid of these remote areas is hard to carry out. As a consequence, they must operate as pure islanded grids. The local generator MUST be adequate and its energy production sufficiently reliable. Should this fail, certain loads would have to be disconnected on an irregular basis to guarantee the stability and the correct operation of the network. The application of energy storage can greatly help the spread of this type of micro grid.
Taiwan Research Institute (TRI) Taipei, October 5th, 2011
75 /118
Chapter 3.8 New roles of TSO and DSO
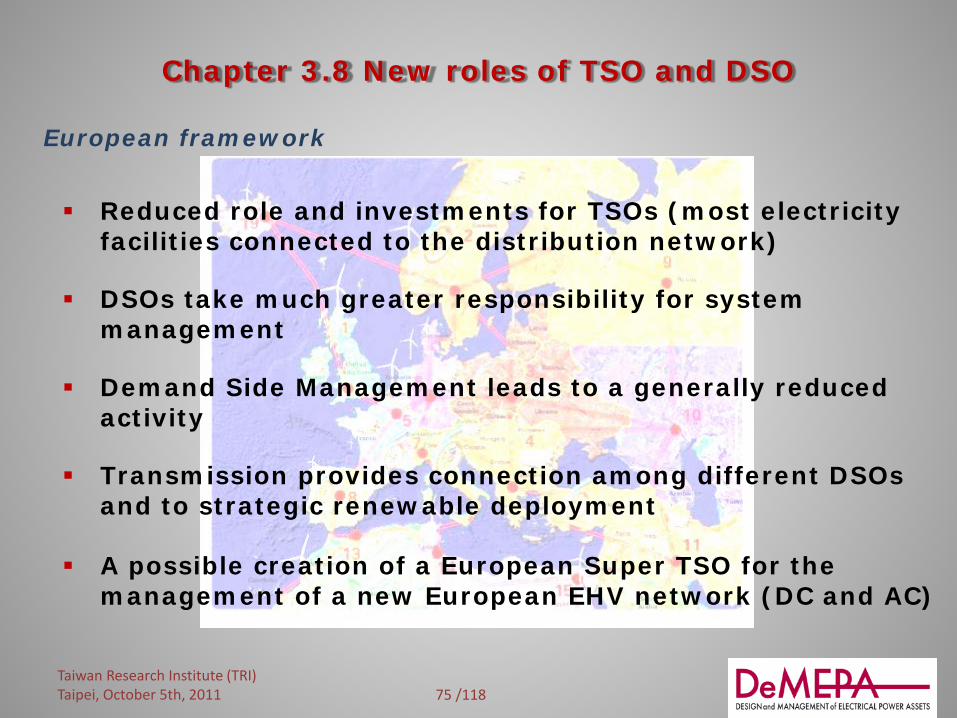
European framework
Reduced role and investments for TSOs (most electricity facilities connected to the distribution network)
DSOs take much greater responsibility for system management
Demand Side Management leads to a generally reduced activity
Transmission provides connection among different DSOs and to strategic renewable deployment
A possible creation of a European Super TSO for the management of a new European EHV network (DC and AC)
Taiwan Research Institute (TRI) Taipei, October 5th, 2011

76 /118
Chapter 3.8 New roles of TSO and DSO
Trasmission Network development Every year, TSOs, after having consulted all the relevant stakeholders, shall submit a 10-year network development plan based on existing and forecast supply and demand to the regulatory Authority. The plan shall contain efficient measures in order to guarantee the adequacy of the system and the security of supply. While elaborating the 10-year network development plan, the transmission system operator shall make reasonable assumptions about the evolution of the generation, supply, consumption and exchanges with other Countries, taking into account investment plans for regional and Community-wide networks.
Taiwan Research Institute (TRI) Taipei, October 5th, 2011
77 /118
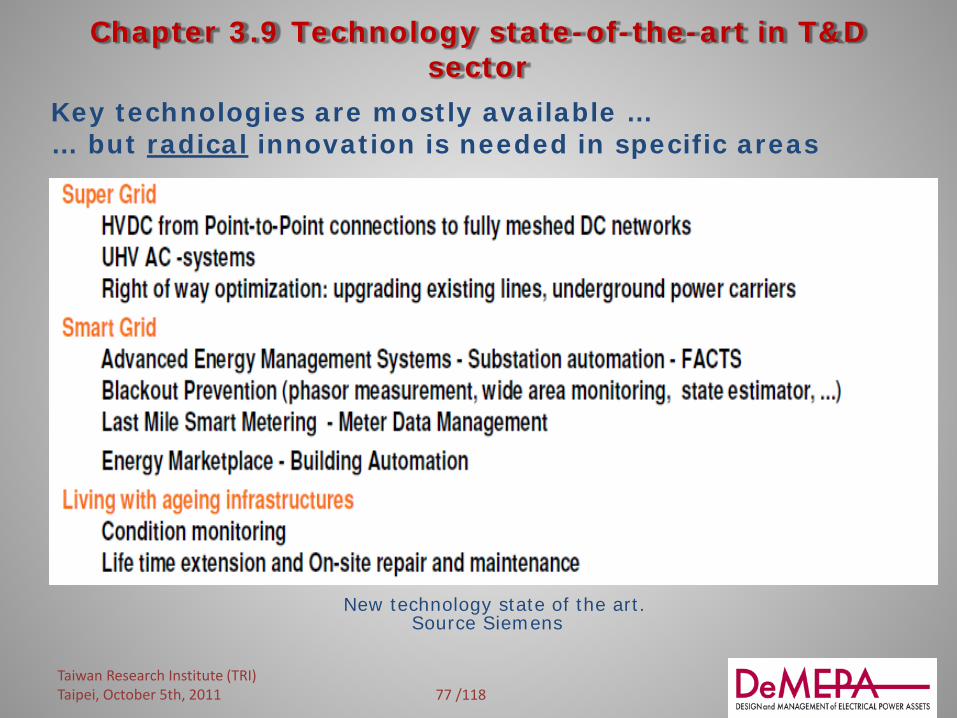
Chapter 3.9 Technology state-of-the-art in T&D sector
Key technologies are mostly available … … but radical innovation is needed in specific areas
New technology state of the art. Source Siemens
Taiwan Research Institute (TRI) Taipei, October 5th, 2011
78 /118
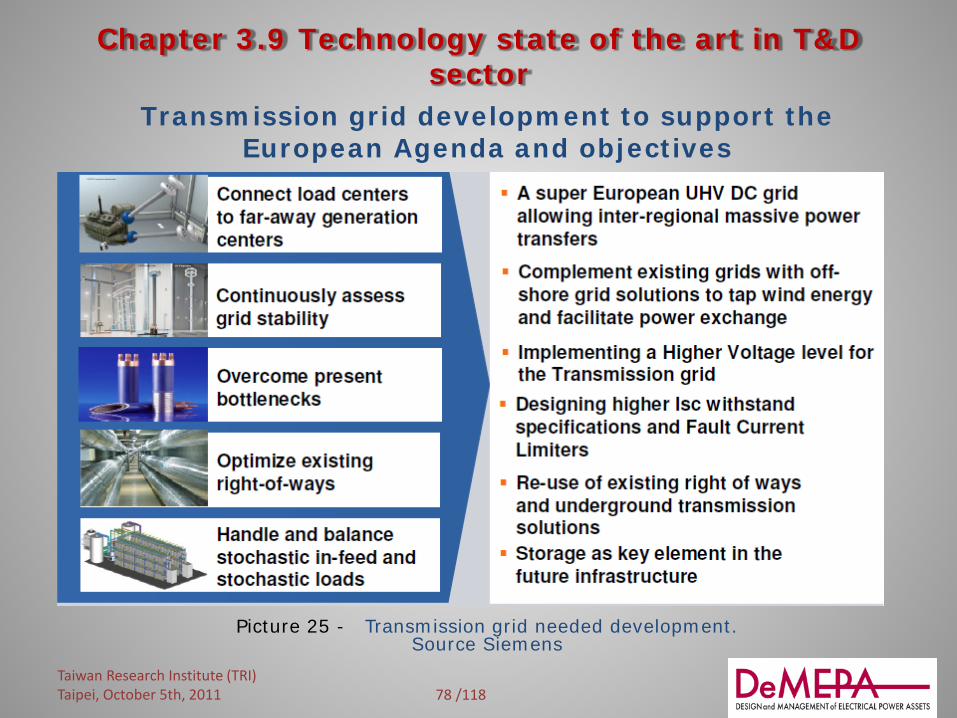
Chapter 3.9 Technology state of the art in T&D
sector Transmission grid development to support the
European Agenda and objectives
Picture 25 - Transmission grid needed development. Source Siemens
Taiwan Research Institute (TRI) Taipei, October 5th, 2011
79 /118
Chapter 3.9 Technology state of the art
in T&D sector
Is it necessary to increase the AC voltage level for the European network?
• The European Transmission grid concept – with the voltage level at 420kV – has proved extremely stable for the last 30 years
• Will it last for the next 50 years? • Should a higher voltage level be introduced (i.e. 550 or
750 kV)? The main European TSOs are discussing this matter with the manufacturers, taking into account the development of the super grids.
Taiwan Research Institute (TRI) Taipei, October 5th, 2011
80 /118
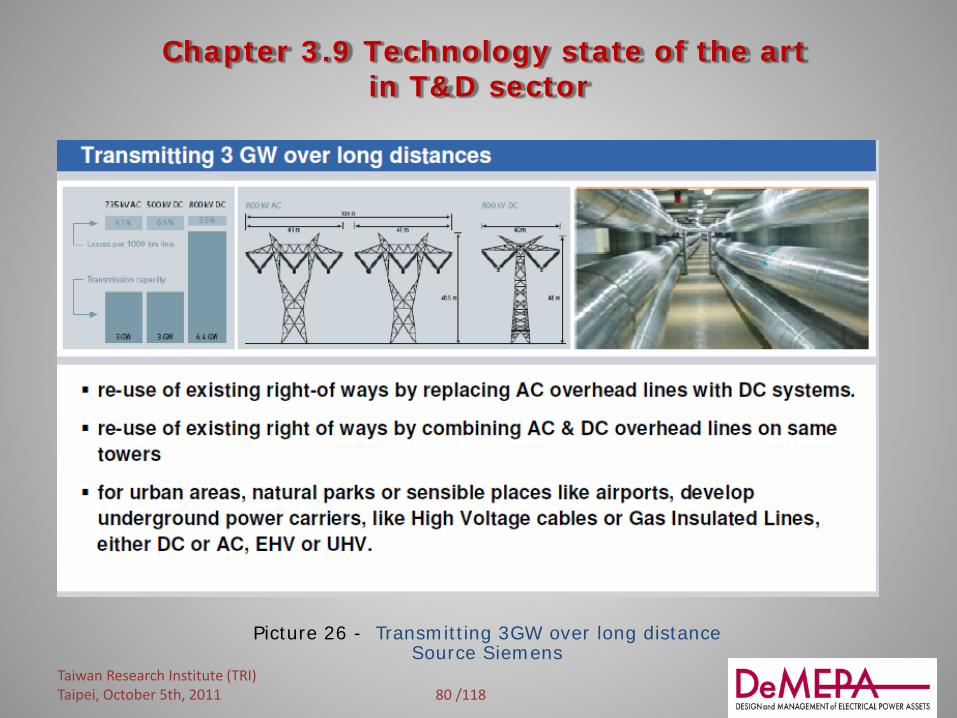
Chapter 3.9 Technology state of the art
in T&D sector
Picture 26 - Transmitting 3GW over long distance Source Siemens
Taiwan Research Institute (TRI) Taipei, October 5th, 2011
81 /118
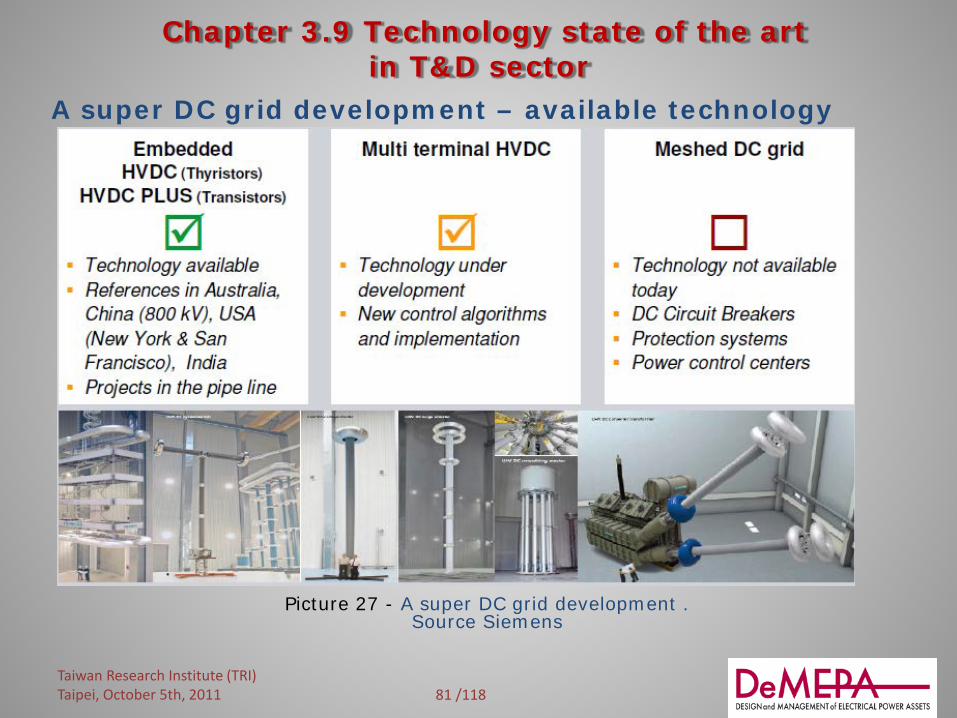
Chapter 3.9 Technology state of the art
in T&D sector A super DC grid development – available technology
Picture 27 - A super DC grid development . Source Siemens
Taiwan Research Institute (TRI) Taipei, October 5th, 2011
82 /118
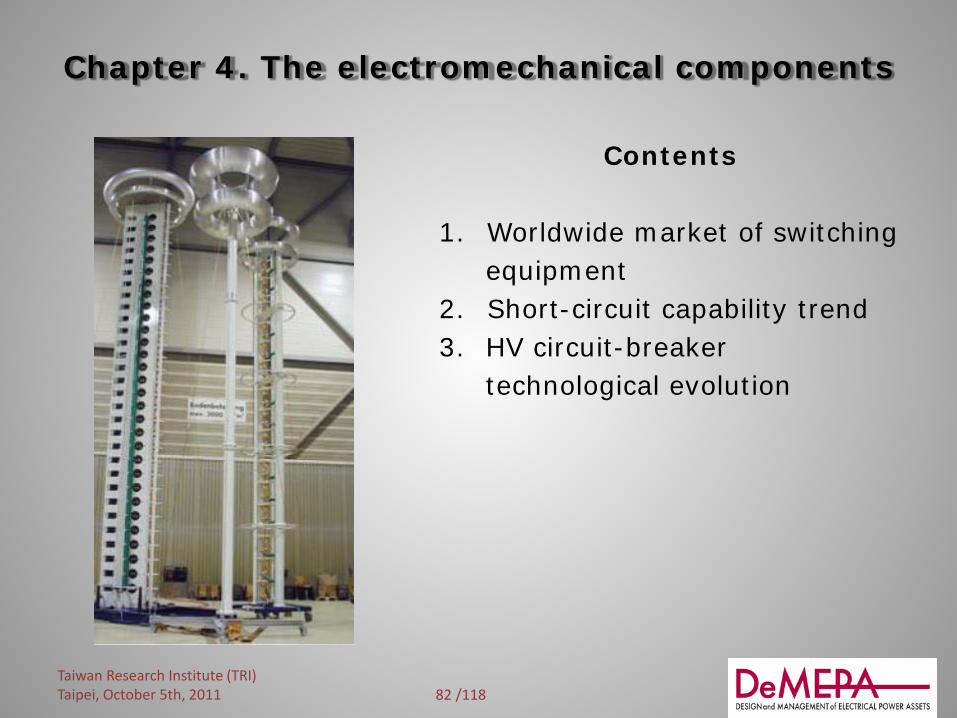
Chapter 4. The electromechanical components
Contents
1. Worldwide market of switching equipment 2. Short-circuit capability trend 3. HV circuit-breaker technological evolution
Taiwan Research Institute (TRI)
Taipei, October 5th, 2011
83 /118
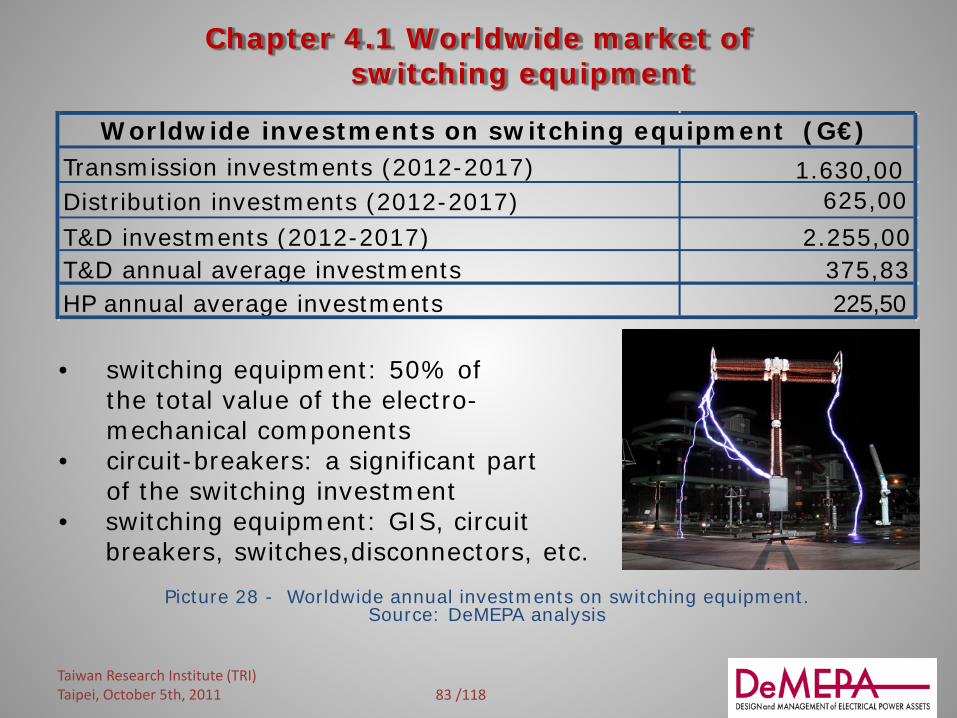
Chapter 4.1 Worldwide market of switching equipment
Picture 28 - Worldwide annual investments on switching equipment. Source: DeMEPA analysis
• switching equipment: 50% of the total value of the electro- mechanical components • circuit-breakers: a significant part of the switching investment • switching equipment: GIS, circuit breakers, switches,disconnectors, etc.
Taiwan Research Institute (TRI) Taipei, October 5th, 2011
Transmission investments (2012-2017) 1.630,00 Distribution investments (2012-2017) 625,00 T&D investments (2012-2017) 2.255,00 T&D annual average investments 375,83 HP annual average investments 225,50
Worldwide investments on switching equipment (G€)

84 /118
Chapter 4.1 Worldwide market of switching equipment
Picture 29 - Circuit beaker weight subdivision (%) Source: DeMEPA analysis
In this analysis, the maximum circuit-breaker performances are considered. In the following slides, the extent of the market is represented by the sphere diameter.
Taiwan Research Institute (TRI) Taipei, October 5th, 2011
EHV-AC CB 25
HV-AC CB 15 MV-AC CB 25 MV-DC CB 3
AC Gen breaker 10 LV-AC CB 15 LV-DC CB 7
switching equipment weight (%)

85 /118
Chapter 4.2 Short circuit capability trend
Picture 30 - Circuit breaker short-circuit capability at present Source: DeMEPA analysis
EHV-AC CB
HV-AC CB MV-AC CB
MV-DC CB
AC Gen Breaker
LV-AC CB
LV-DC CB
1
10
100
1000
10000
0 10 20 30 40 50 60 70 80 90 100 110 120 130 140
KV
-log
arith
m s
cale
kA
Present circuit breakers short circuit capability
EHV-AC CB HV-AC CB MV-AC CB MV-DC CB AC Gen Breaker LV-AC CB LV-DC CB
Taiwan Research Institute (TRI) Taipei, October 5th, 2011

86 /118
Chapter 4.2 Short circuit capability trend
Picture 31 - HV AC circuit breaker short-circuit capability trend Source DeMEPA analysis
EHV-AC CB
HV-AC CB
EHV-AC CB
HV-AC CB
0
200
400
600
800
1000
1200
1400
0 10 20 30 40 50 60 70 80 90 100 110 120
KV
kA
HV AC circuit breaker capalibity trend
EHV-AC CB HV-AC CB EHV-AC CB HV-AC CB
Taiwan Research Institute (TRI) Taipei, October 5th, 2011

87 /118
Chapter 4.2 Short circuit capability trend
Picture 32 - MV (AC&DC) Circuit breaker short-circuit capability trend Source: DeMEPA analysis
MV-AC CBMV-DC CB
AC Gen CB
MV-AC CB
MV-DC CB
AC Gen CB0
50
100
150
200
0 10 20 30 40 50 60 70 80 90 100 110 120 130 140 150 160 170 180
KV
kA
MV(AC&DC) circuit breaker & generation breaker trend
MV-AC CB MV-DC CB AC Gen CB MV-AC CB MV-DC CB AC Gen CB
Taiwan Research Institute (TRI) Taipei, October 5th, 2011
88 /118
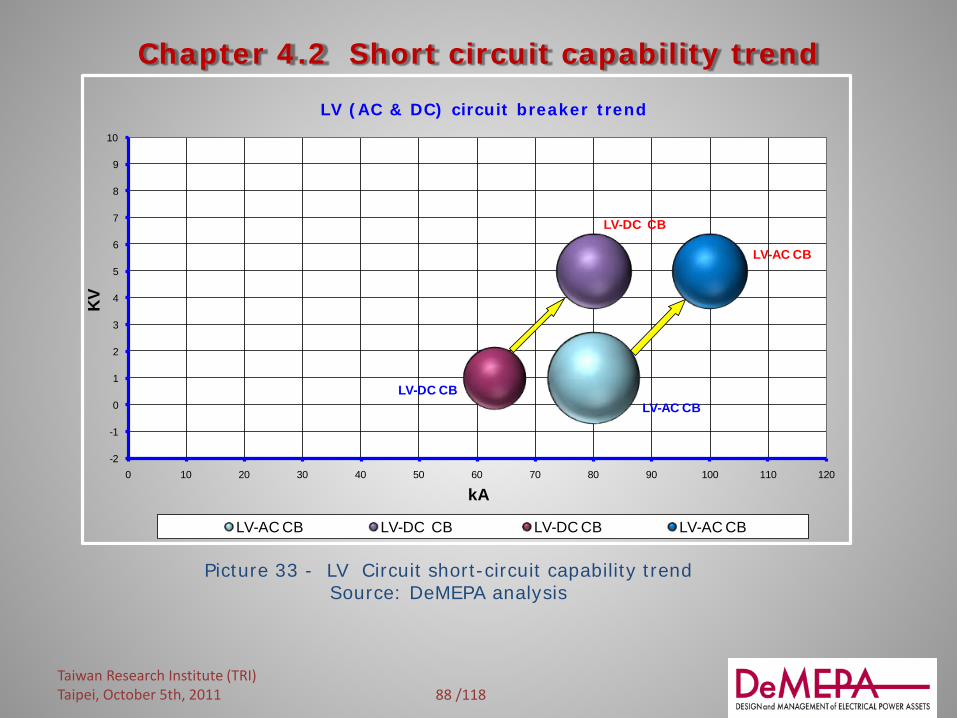
Chapter 4.2 Short circuit capability trend
Picture 33 - LV Circuit short-circuit capability trend Source: DeMEPA analysis
LV-AC CB
LV-DC CB
LV-DC CB
LV-AC CB
-2
-1
0
1
2
3
4
5
6
7
8
9
10
0 10 20 30 40 50 60 70 80 90 100 110 120
KV
kA
LV (AC & DC) circuit breaker trend
LV-AC CB LV-DC CB LV-DC CB LV-AC CB
Taiwan Research Institute (TRI) Taipei, October 5th, 2011

89 /118
Chapter 4.3 HV circuit-breaker technological evolution
Picture 34 - Overview HV SF6 Circuit-breakers technological evolution Source: ABB
1st Gen: Puffer Breaker
2nd Gen: Self Blast Breaker
3rd Gen: Advanced Puffer Breaker
4th Gen: Double Linear Move Self Blast Breaker
5th: Gen: Non-Linear Double Move Self Blast Brea
6th: Gen: Non Linear Puffer Breaker
Leggenda
Taiwan Research Institute (TRI) Taipei, October 5th, 2011
90 /118
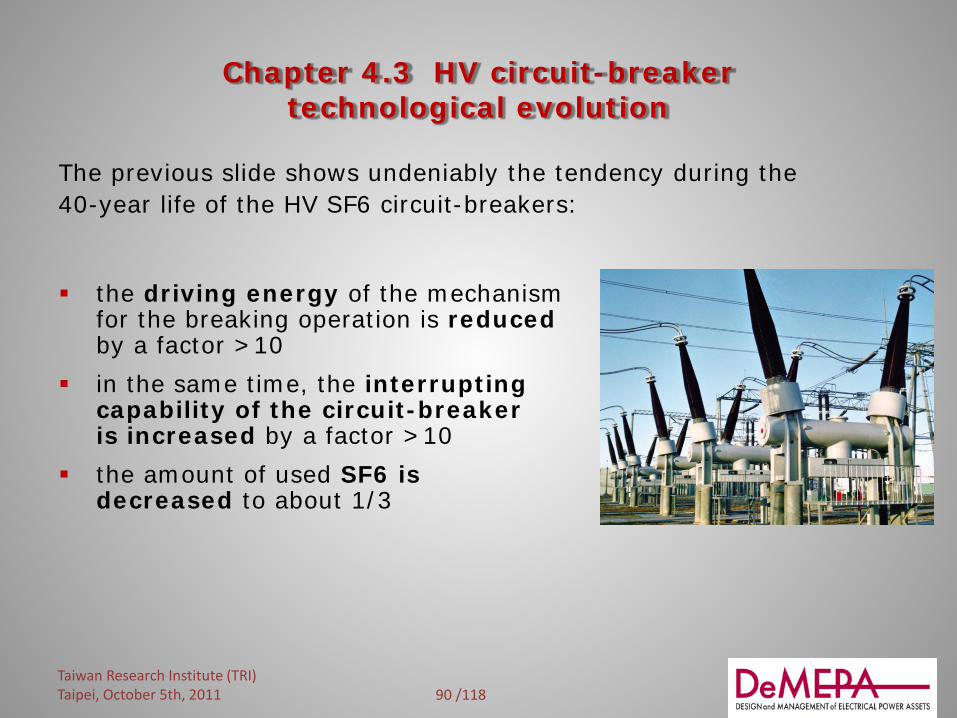
Chapter 4.3 HV circuit-breaker technological evolution
The previous slide shows undeniably the tendency during the 40-year life of the HV SF6 circuit-breakers: the driving energy of the mechanism for the breaking operation is reduced by a factor >10
in the same time, the interrupting capability of the circuit-breaker is increased by a factor >10
the amount of used SF6 is decreased to about 1/3
Taiwan Research Institute (TRI) Taipei, October 5th, 2011
91 /118
Chapter 5. High Power Laboratories
Index
1. Market 2. Main characteristics 3. Synthetic circuits 4. Reengineering of HP
laboratories
Taiwan Research Institute (TRI) Taipei, October 5th, 2011

92 /118
Chapter 5.1 Market
Three types of laboratories are considered: Manufacturer labs, such as Siemens, ABB, Alstom, AE Japan,
Mitsubishi, etc. Main goals:
• Development tests • Sometimes, type tests when third part lab is not requested
Economical justification: to support component development Commercial and third part labs, such as KEMA, CESI, KERI,
XI’ARI, TERTEC, etc. Main goals:
• Type tests • Sometimes, development tests
Economical justification: to make business through commercial test activities
Taiwan Research Institute (TRI) Taipei, October 5th, 2011
93 /118
Chapter 5.1 Market
Three types of laboratories are considered (foll.) Institutional and National R&D labs, such as SGEPRI,
CPRI, JSTC, etc. Main goals:
• R&D • Standard developments • Development tests • Sometimes, type tests
Economical justification: to support the national electrical industries and local manufacturers in:
• Component development • Export activities
Taiwan Research Institute (TRI) Taipei, October 5th, 2011
94 /118
Chapter 5.1 Market
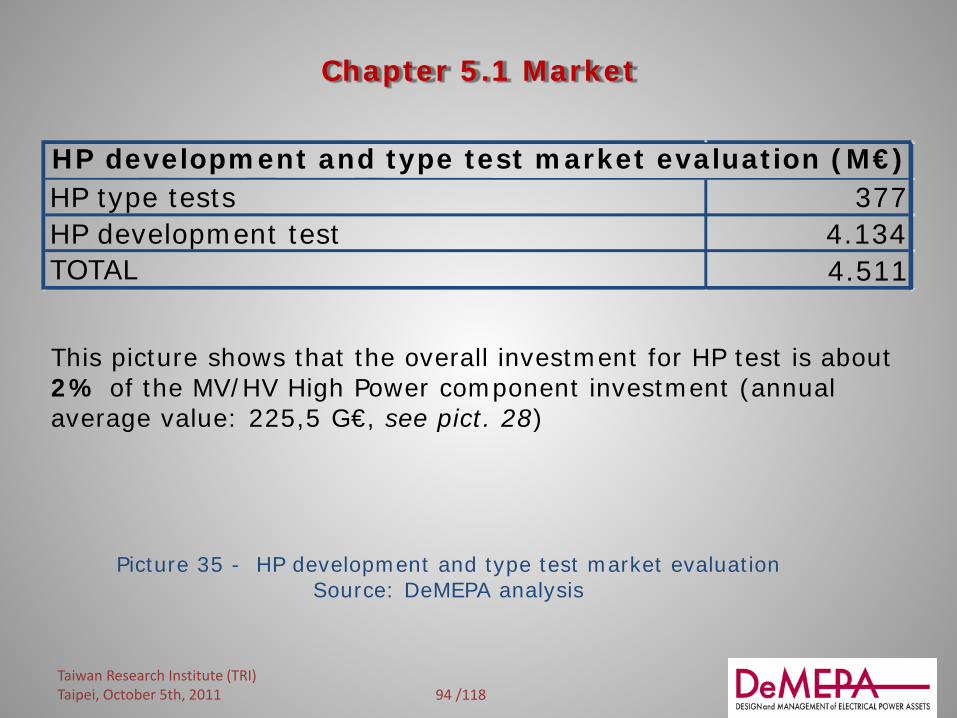
Picture 35 - HP development and type test market evaluation Source: DeMEPA analysis
This picture shows that the overall investment for HP test is about 2% of the MV/HV High Power component investment (annual average value: 225,5 G€, see pict. 28)
Taiwan Research Institute (TRI) Taipei, October 5th, 2011
HP type tests 377 HP development test 4.134 TOTAL
HP development and type test market evaluation (M€)
4.511

95 /118
Chapter 5.1 Market
For the commercial laboratories, the market, at the international rates, is estimated at 25-30% of the above figures.
Picture 36 - HP development and type test market evaluation Source: DeMEPA analysis
Taiwan Research Institute (TRI) Taipei, October 5th, 2011
segmentation HP dev. Test HP type test TOTAL manufacture lab 3.307 38 3.345 commercial lab 207 301 507 institutional lab 620 38 658 TOTAL 4.134 377 4.510
type and development test - market segmentation (M€)

96 /118
Chapter 5.1 Market
Picture 37 - Present and expected testing market evolution Source: DeMEPA analysis
• the maximum circuit-breaker performance trend is considered • the sphere diameter represents the testing market • the arrow shows the expected trend of the “day after tomorrow” • the sphere diameter of the new Institutional lab (on the “top right”)
represents the additional achievable market, with respect to the other labs
new HP Istitutional lab
MV labMV lab
generation lab generation lab
LV lab
LV lab
UHV lab
UHV lab
-100
100
300
500
700
900
1100
0 20 40 60 80 100 120 140 160
Volta
ge le
vels
(kV)
short circuit capacity (kA)
HP laboratory trends, capabilities and ratings
n ew HP Istitutional lab
MV lab
MV lab
generation lab
generation lab
LV lab
LV lab
UHV lab
UHV lab
Taiwan Research Institute (TRI) Taipei, October 5th, 2011

97 /118
Chapter 5.1 Market
The previous slide supports the potential investors in high power laboratories as far as the choice of the new investment is concerned. The following options have to be taken into consideration: construction of a new laboratory
re-engineering of an existing laboratory
purchase of an existing laboratory
cooperation with existing laboratories
Taiwan Research Institute (TRI) Taipei, October 5th, 2011
98 /118
Chapter 5.2 Main characteristics
The following laboratory schemes are considered:
LV – HP lab MV – HP lab MV/HV – HP lab (up to 150 kV) Generator circuit breaker - HP lab HV/EHV – HP lab (up to 1200 kV)
Taiwan Research Institute (TRI) Taipei, October 5th, 2011
99 /118
Chapter 5.2 Main characteristics
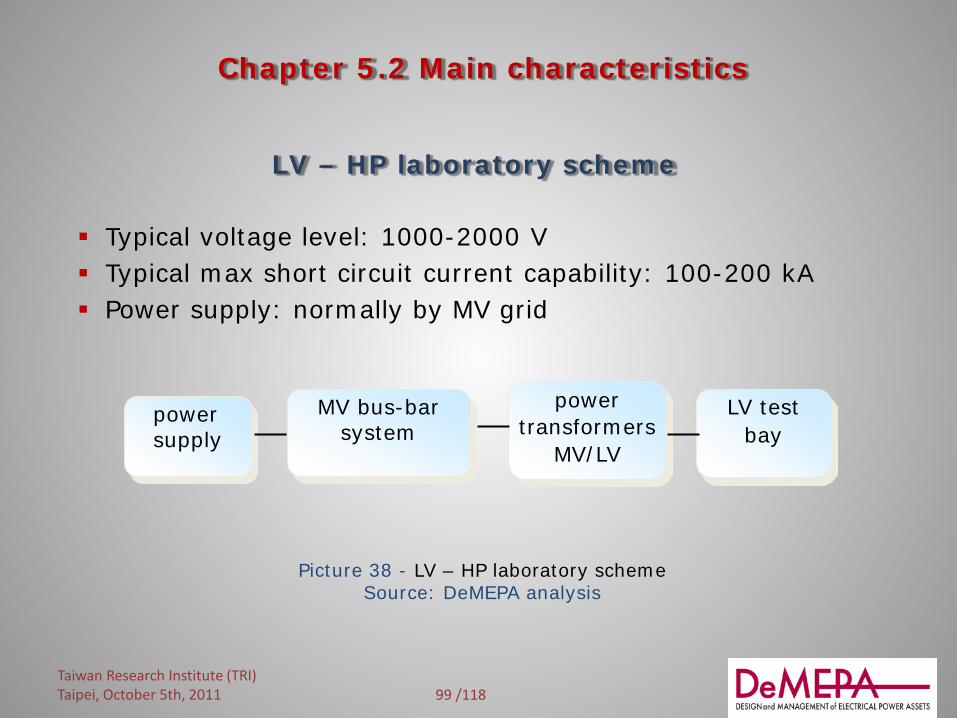
Typical voltage level: 1000-2000 V Typical max short circuit current capability: 100-200 kA Power supply: normally by MV grid
LV – HP laboratory scheme
power supply
power transformers
MV/LV
MV bus-bar system
LV test bay
Picture 38 - LV – HP laboratory scheme Source: DeMEPA analysis
Taiwan Research Institute (TRI) Taipei, October 5th, 2011

100 /118
Chapter 5.2 Main characteristics
Typical voltage level: ≤ 40,5 kV Typical max short circuit current capability: ≤ 100 kA Power supply: by HV grid or short-circuit generator Testing method: direct
MV– HP laboratory scheme
generator
grid
power transformers
HV/MV
power transformers
MV/MV MV bus-bar
system MV test bay
Picture 39 - MV – HP laboratory scheme Source: DeMEPA analysis
Taiwan Research Institute (TRI) Taipei, October 5th, 2011
101 /118
Chapter 5.2 Main characteristics
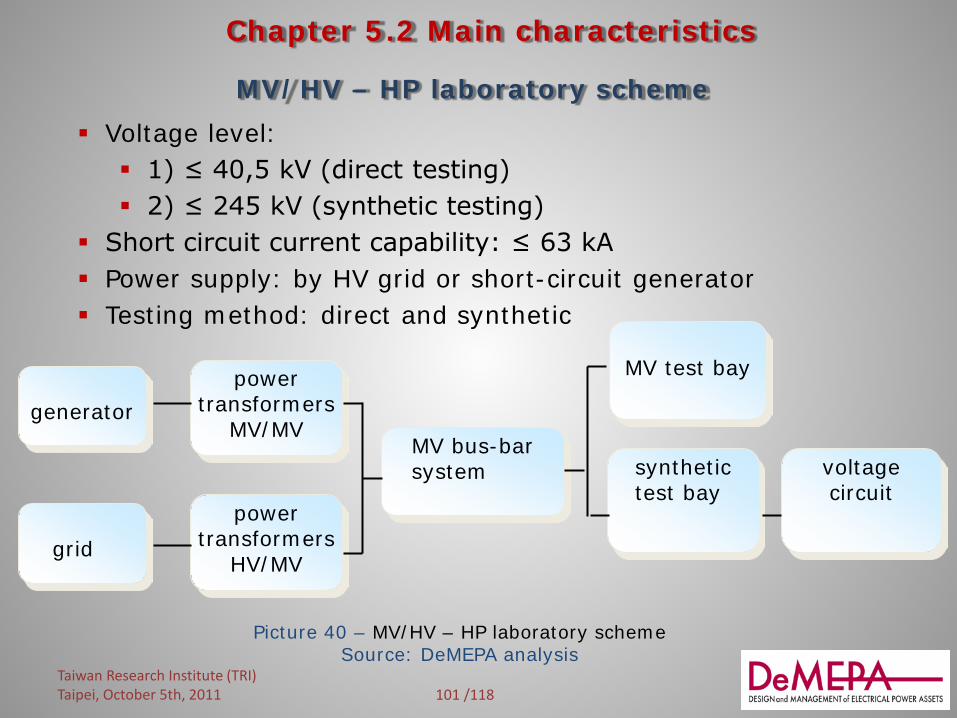
Voltage level: 1) ≤ 40,5 kV (direct testing) 2) ≤ 245 kV (synthetic testing)
Short circuit current capability: ≤ 63 kA Power supply: by HV grid or short-circuit generator Testing method: direct and synthetic
MV/HV – HP laboratory scheme
generator
grid
power transformers
MV/MV
power transformers
HV/MV
MV bus-bar system
MV test bay
voltage circuit
synthetic test bay
Picture 40 – MV/HV – HP laboratory scheme Source: DeMEPA analysis
Taiwan Research Institute (TRI) Taipei, October 5th, 2011
102 /118
Chapter 5.2 Main characteristics
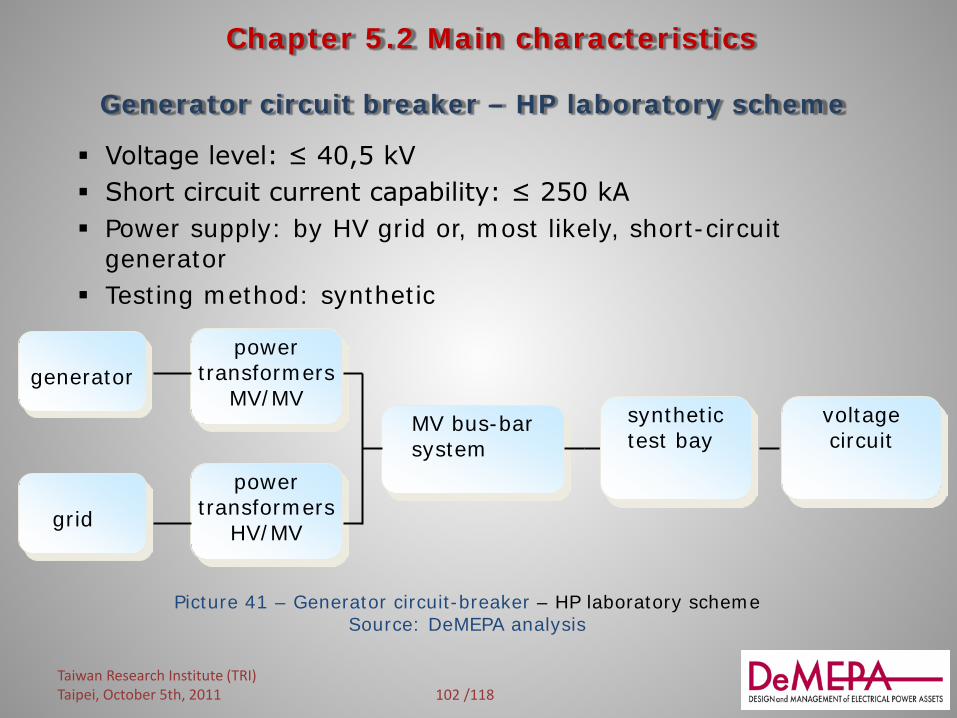
Voltage level: ≤ 40,5 kV Short circuit current capability: ≤ 250 kA Power supply: by HV grid or, most likely, short-circuit
generator Testing method: synthetic
Generator circuit breaker – HP laboratory scheme
generator
grid
power transformers
MV/MV
power transformers
HV/MV
MV bus-bar system
voltage circuit
synthetic test bay
Picture 41 – Generator circuit-breaker – HP laboratory scheme Source: DeMEPA analysis
Taiwan Research Institute (TRI) Taipei, October 5th, 2011
103 /118
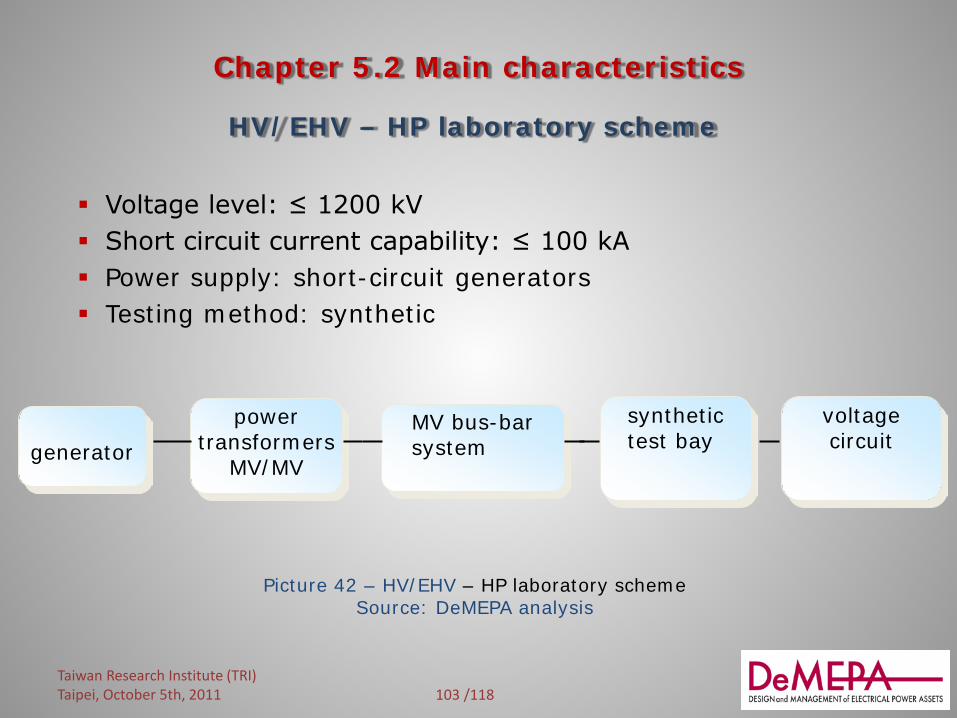
Chapter 5.2 Main characteristics
Voltage level: ≤ 1200 kV Short circuit current capability: ≤ 100 kA Power supply: short-circuit generators Testing method: synthetic
HV/EHV – HP laboratory scheme
generator
power transformers
MV/MV
MV bus-bar system
voltage circuit
synthetic test bay
Picture 42 – HV/EHV – HP laboratory scheme Source: DeMEPA analysis
Taiwan Research Institute (TRI) Taipei, October 5th, 2011

104 /118
Chapter 5.3 Synthetic circuits
Industrially introduced into the electromechanical market at the early 1970s, at present the use of the synthetic circuits is the only method available for the tests of the HV circuit-breakers.
Basically studied for the tests of single pole circuit-breakers, nowadays the standards consider also circuits for 3-phase synthetic tests of GIS circuit-breakers with three poles in one enclosure.
There are several synthetic circuits with different characteristics that wholly or partly satisfy the standard requirements. The capacity to design and construct a HP laboratory based on the synthetic methods is limited to Engineering Companies which have got experience in: HP testing electromechanical components, particularly CBs design of special laboratory components
Taiwan Research Institute (TRI) Taipei, October 5th, 2011

105 /118
Chapter 5.3 Synthetic circuits
Picture 43 Current injection circuit Source: IEC 62271-101
The circuit shown in the figure is the most common synthetic circuit used all over the world. It is the only circuit that fulfills the standard requirements in terms of thermal stress applications: this is the reason why it is the only circuit that must be used for the short-line fault tests.
Taiwan Research Institute (TRI) Taipei, October 5th, 2011
106 /118
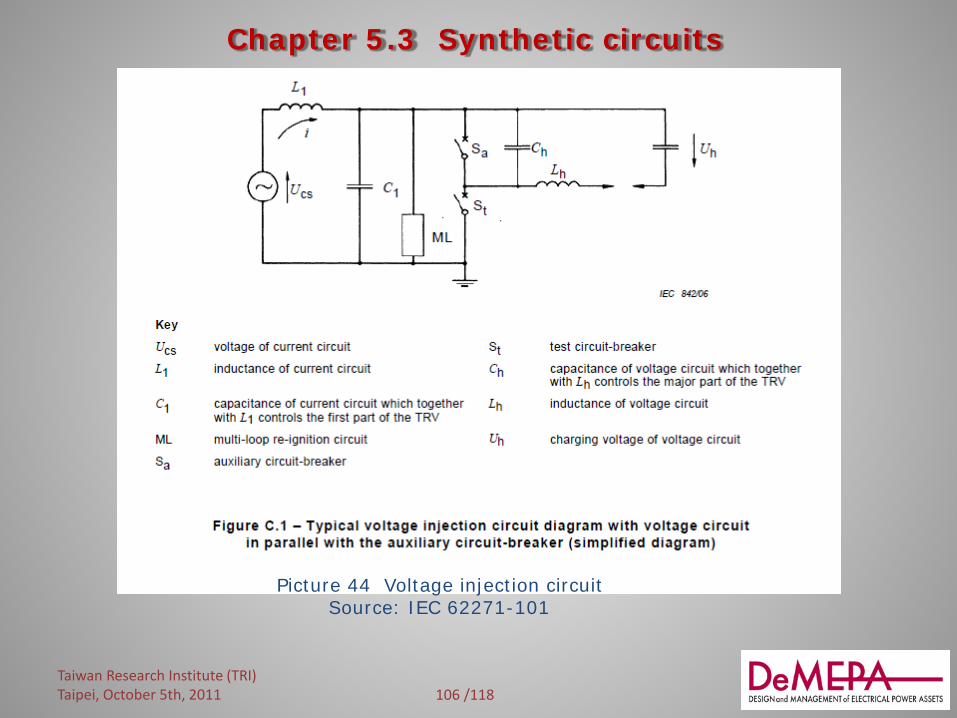
Chapter 5.3 Synthetic circuits
Picture 44 Voltage injection circuit Source: IEC 62271-101
Taiwan Research Institute (TRI) Taipei, October 5th, 2011
107 /118
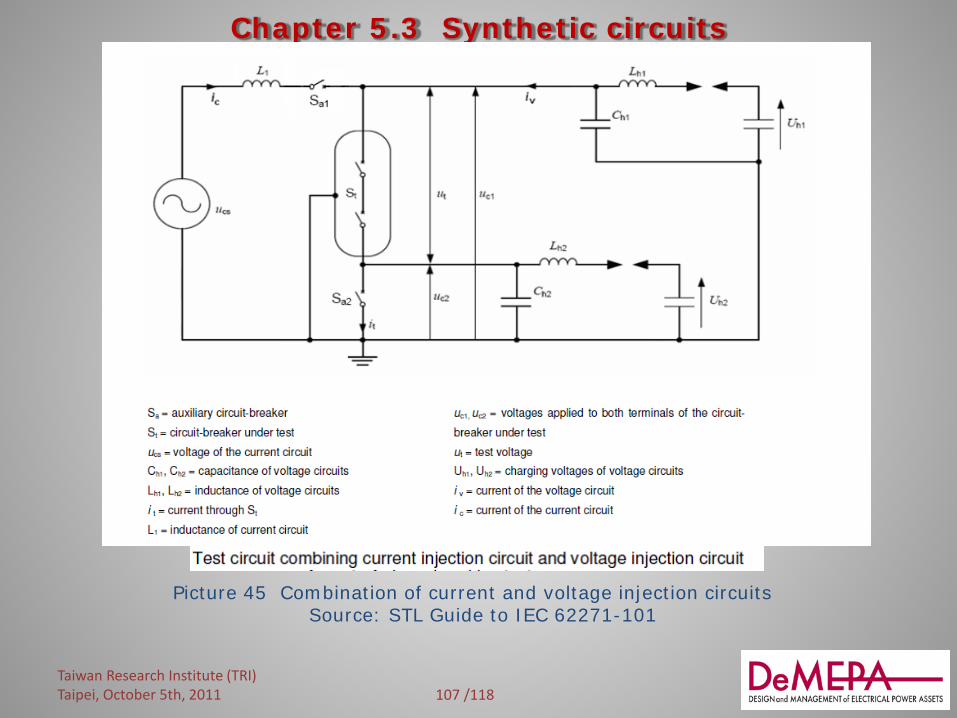
Chapter 5.3 Synthetic circuits
Picture 45 Combination of current and voltage injection circuits Source: STL Guide to IEC 62271-101
Taiwan Research Institute (TRI) Taipei, October 5th, 2011
108 /118
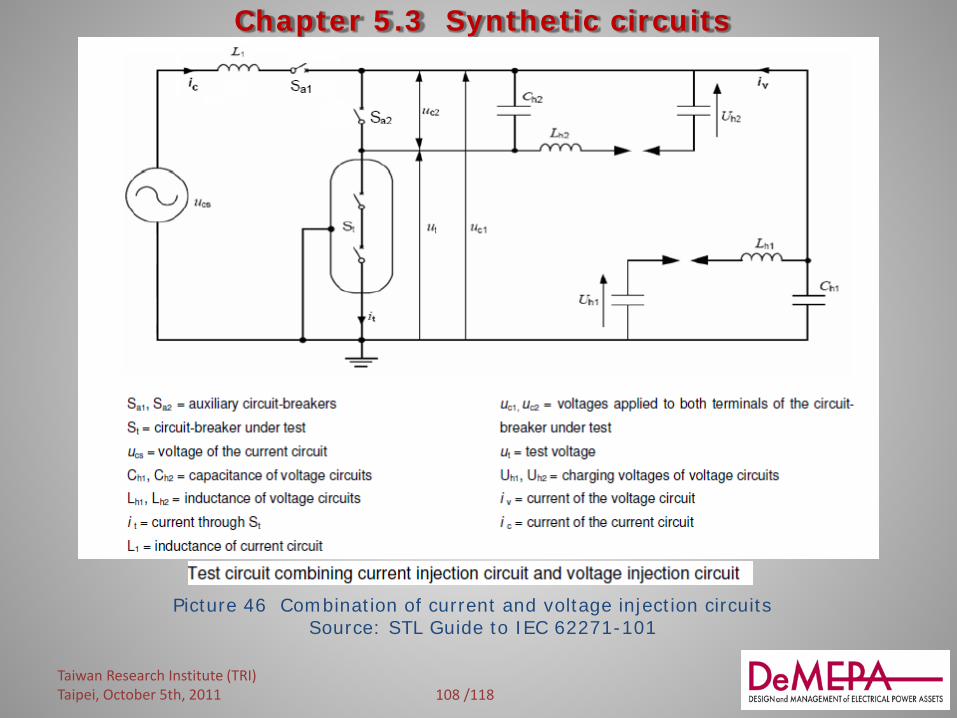
Chapter 5.3 Synthetic circuits
Picture 46 Combination of current and voltage injection circuits Source: STL Guide to IEC 62271-101
Taiwan Research Institute (TRI) Taipei, October 5th, 2011

109 /118
Chapter 5.4 Re-engineering of HP laboratories
100-120 M€ is the investment related to a new laboratory for direct and synthetic testing of the main of T&D system equipment at the maximum V and I levels (e.g.1200kV 150kA, 50/60 Hz). Approx. 30% of this investment is covered by the short-circuit generators only. It is clear that this figure is not suitable, neither at present
nor in the (near) future!
As a consequence, to stay in the testing market, i.e. the European and North America markets, the most feasible solution for HP laboratories is:
re-engineering
Taiwan Research Institute (TRI) Taipei, October 5th, 2011
110 /118 Taiwan Research Institute (TRI) Taipei, October 5th, 2011
Chapter 5.4 Re-engineering of HP laboratories
Re-engineering is much more consistent with the current situation as
costs are significantly reduced improved business results are often expected
This is why, in the considered areas, due to the presence of commercial and manufacturer laboratories, re-engineering is the most widespread adopted solution.
111 /118
Chapter 5.4 Re-engineering of HP laboratories
Case 1 Starting status: MV lab able to test directly up to 36 kV – 25 kA CB, fed
by network (or short-circuit generator) Final status: MV/HV lab able to test synthetically up to full pole 245 kV – 50 kA CB
Main investments Voltage circuit HV test bay Auxiliary circuit-breaker Re-ignition circuits
Taiwan Research Institute (TRI) Taipei, October 5th, 2011

112 /118
Chapter 5.4 Re-engineering of HP laboratories
Case 2 Starting status: MV/HV lab able to test up to 500 kV – 63 kA CB, fed by one short-circuit generator Final status: MV/HV lab able to test MV and HV CBs up to 1200 kV – 100 kA
Main investments: 2° generator 2° voltage circuit New test bay
Taiwan Research Institute (TRI) Taipei, October 5th, 2011

113 /118
Chapter 6. A way to verify quality & performances of electromechanical equipment
Contents
1. Framework 2. Possible solutions 3. Tests performed in the
Manufacturer premises 4. Test facilities not
adequate for the requested tests (i.e.: limited power). Taiwan Research Institute (TRI)
Taipei, October 5th, 2011
114 /118
Chapter 6.1 Framework
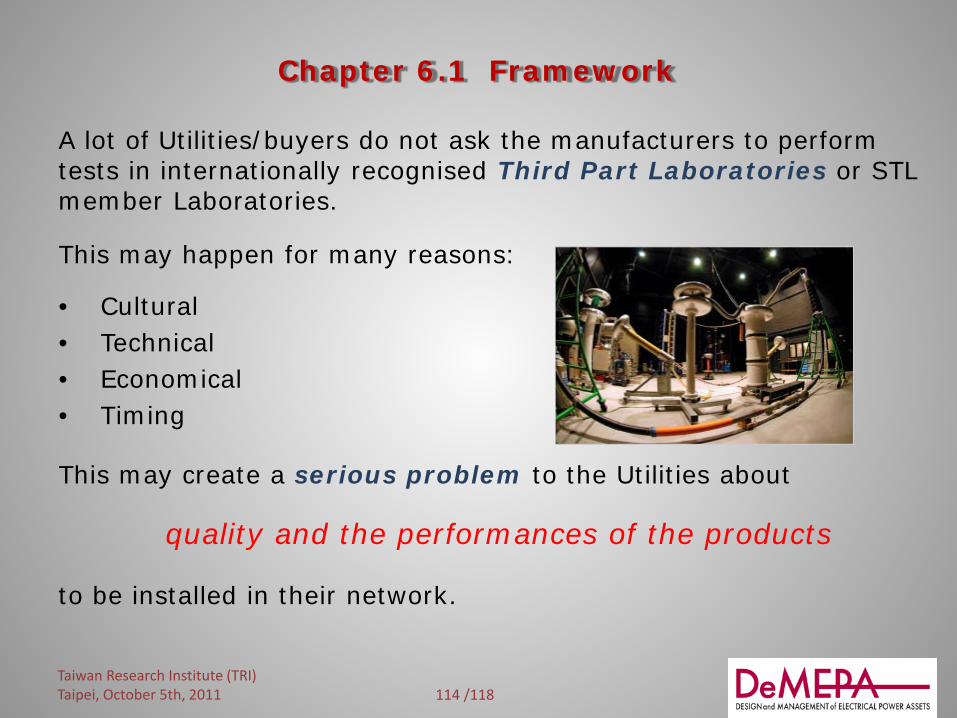
A lot of Utilities/buyers do not ask the manufacturers to perform tests in internationally recognised Third Part Laboratories or STL member Laboratories.
This may happen for many reasons:
• Cultural • Technical • Economical • Timing
This may create a serious problem to the Utilities about
quality and the performances of the products
to be installed in their network.
Taiwan Research Institute (TRI) Taipei, October 5th, 2011
115 /118
Chapter 6.2 Possible solutions
... therefore it can happen that
tests are performed within the Manufacturer premises test facilities are not adequate for the requested tests (i.e.:
limited power) As a consequence, it is reasonable to expect that,
in the above cases, the Utilities will greatly benefit from the technical support of
Consulting & Engineering Companies experienced in testing activities, international standard (IEC, ANSI, STL) and Power Systems.
Taiwan Research Institute (TRI) Taipei, October 5th, 2011

116 /118
Chapter 6.3 Tests performed in the Manufacturer premises
Consulting & Engineering Company experts are present during the tests
act as “third party”
guarantee the Utility on the correctness of the test results (standard requirements)
support the utility in case of “critical events” during tests
The Expert may propose alternative solutions to the laboratory (repetition of tests, changes in the procedure, etc.) and, if need be, he can suggest feasible modifications to the design of the apparatus.
Taiwan Research Institute (TRI) Taipei, October 5th, 2011

117 /118
Chapter 6.4 Test facilities not adequate for the requested tests
Typical inadequacies are mainly related to: tests on components requiring ratings higher than those of the
existing Laboratories in terms of High Voltage and/or High Power (e.g. 1000 kV GIS and Circuit Breaker)
tests on components hard to transport (e.g. Power Transformers)
In all the cases similar to those above, an “ad hoc procedure” for the quality assessment of the equipment to be purchased may be adopted. This procedure is firstly based on advanced models of the equipment, in terms of:
mathematical model digital model
physical model geometrically reduced & scaled model A reduced physical model will therefore be able to be tested within the existing test facilities
Taiwan Research Institute (TRI) Taipei, October 5th, 2011

118 /118
Chapter 6.4 Test facilities not adequate for the requested tests
Working with physical and/or digital models of the equipment allows the simulation of a mix of experimental activities.
An accurate modeling approach can lead to very good results in terms of quality and accuracy, which are fully comparable with those achievable by means of tests on the full scale equipment.
This approach requires a deep skill about the physics of the phenomena, the availability of appropriate software, the compared utilisation of the results coming from all the models, etc. In some cases, it can be the only way to reach the goal.
Taiwan Research Institute (TRI) Taipei, October 5th, 2011