cements as porous materials - semantic scholar€¦ · ... cements as porous materials ... and the...
TRANSCRIPT

CHAPTER 6.11: CEMENTS AS POROUS MATERIALS
H.M. Jennings*#, J.J. Thomas#, D. Rothstein#, and J.J. Chen*
Northwestern UniversityDepartment of Materials Science and Engineering*
Department of Civil Engineering#
Evanston, IL 60208USA
6.11.1 Introduction
Concrete, found in roads, bridges, skyscrapers, and a myriad of other structures, is easily
one of the most ubiquitous materials in modern civilization. Quite surprisingly, however,
concrete is also a relatively difficult material to classify. It can easily be mistaken for a rock,
possibly some form of artificial rock, or perhaps thought of as a composite. Adopting any one of
these categories would not reveal the fundamental nature of concrete, namely that it is porous. In
fact, the binding matrix phase of concrete, called hardened cement paste, possesses between 25
and 50% porosity. This relatively large porosity is striking in itself; however, the variation in
pore size is equally impressive, ranging from nanometer-sized gel pores, to micrometer-sized
capillary pores, to millimeter-sized air voids.
The complexity of concrete is compounded by its interactions with water. Hardened
cement paste, formed from the reaction of the various minerals in concrete with water, will
continue to react with its aqueous phase for several years, leading to progressive refinement and
maturation of its porous structure. Much of this porous structure resides in the calcium silicate
hydrate gel, causing the hydrate to have a surface area of several hundreds of square meters per
gram. These colloidal dimensions result in an intimate association between the solid gel phase
and the aqueous phase that resides in the gel pores. This coupling has important repercussions on

the properties of hardened cement paste, especially in phenomena such as drying shrinkage and
creep.
Rather than attempting to cover all the peculiarities of cement science, this review
concentrates on the pore structure of hardened cement paste and concrete. In Section 6.11.2, the
structure of hardened cement paste is described after a brief overview of the hydration of
Portland cement. Section 6.11.3 outlines pertinent issues concerning the characterization of the
porous structure of hardened cement paste. Section 6.11.4 presents interpretations of the pore
structure of hardened cement paste and, particularly, that of the calcium silicate hydrate product.
Section 6.11.5 describes selected macroscopic properties of concrete such as strength, volume
stability, and permeability, with emphasis on the influences of porosity and water on these
properties. The concluding Section 6.11.6 concerns the durability of concrete and briefly reviews
the debilitating effects of several important interactions between concrete and its environment.
After a summary in Section 6.11.7, a glossary of terms that are relevant to cement science is
given in Section 6.11.8.
6.11.2 Hardened Cement Paste
The character of concrete is largely determined by the porous structure of its primary
component, hardened cement paste. As will become evident, any meaningful discussion of this
porous structure requires a rudimentary knowledge of the chemical and physical reactions
associated with its formation.
6.11.2.1 Portland Cement
Cement is a generic term for a material that is used to bind particulate matter together.
The chemical constitution and the ultimate use of a cement are not strictly defined. Historically,

however, cement has been equated with readily available materials that could bind stones and
brick together, plaster walls and ceilings, and waterproof buildings and conduits. Conceivably,
the earliest cementing material was mud mixed with straw, as was typical in early civilizations
[1]. The Egyptians later employed impure gypsum cement mortars to build the remarkably well
preserved great pyramids along the Nile [2]. The Greeks and Romans made extensive use of lime
cement mortars throughout their respective empires, the latter taking advantage of the
availability of reactive volcanic rock to create hydraulic mortars, which possessed the novel
ability to harden under water. Today, cements can take on an entirely different character. In the
medical field, for example, organic based acrylic cements [3] have found commercial success in
binding artificial implants to human bone, and the more recently developed calcium phosphate
cements [4, 5] aid in bone repair and regeneration.
With the overwhelming success of the concrete industry during the modern era, the term
cement has become nearly synonymous with Portland cement, the proportioned mixture of
predominantly calcium silicate and calcium aluminate minerals that chemically react with water,
a process known as hydration, to form a dramatically different product called hardened cement
paste. Due to its inherent brittleness, hardened cement paste is usually combined with fine
aggregate (sand) to form mortars, or with a combination of fine aggregate and coarse aggregate
(gravel or crushed stone) to form concrete. While the properties of mortar and concrete are
naturally influenced by the characteristics of the aggregate phase (particularly with regard to
volume stability), they are predominately controlled by the character of the hardened cement
paste.
The primary raw materials of Portland cement are a lime-rich substance (such as
limestone, chalk or shells) and a clay-rich substance (such as shale, slate, or clay itself), both of

which are readily available natural resources. Before being heated in a rotary kiln, the raw
materials are carefully proportioned to supply the desired amounts of lime, silica, aluminum
oxide, and iron oxide. During the heat treatment at temperatures approaching 1450ºC, partial
fusion (or clinkerization) of the oxides produces walnut-sized particles called clinker, a
chemically different substance having an unusually high reactivity with water. Clinkers are then
cooled, mixed with a 3 to 4 % addition of gypsum (to control the initial rate of hydration), and
finally ground to a fine powder (usually with a size distribution ranging from 1µm to 100µm,
with a mean of ~15µm to 20µm). The resulting powder is called Portland cement.
6.11.2.2 Hydration of Portland Cement
Any discussion of the structure of hardened cement paste requires a basic understanding
of the chemical and physical changes that occur during hydration. The sequence of events is as
follows.
When Portland cement is combined with about half of its weight in water, the result is a
viscous but still fluid mixture called cement paste. Normally the wet paste remains in a state of
relatively constant fluidity from 2 to 4 hours, after which time the mix starts to stiffen at a
dramatically faster rate. The time at which paste loses its fluidity is denoted as initial set.
Substantial increases in strength and hardening of the paste do not occur until several hours after
the initial set, a time denoted as final set. Strength increases rapidly during the first two days and
continues to increase at a decreasing rate for several years.
The above description of events during the hydration of cement is purposefully crude,
giving little indication of the chemical complexity of the reactions taking place. Without any
knowledge of cement chemistry, it would not be illogical to conclude that the hardening of
cement is a result of a rewetting/drying process similar to what occurs in simpler systems such as

gypsum plaster. This theory, however, is completely incorrect and is a commonly held
misconception. What is often overlooked is that Portland cement can harden under water, and in
fact, the quality of the hardened cement paste cured under water is superior to that cured in air.
The reason for the hardening of cement, thus, cannot be attributed to drying. Instead, the
hardening process, as discovered by John Smeaton in the 1750s, is a result of chemical reactions
between water and the calcium silicate phases of Portland cement.
6.11.2.2.1 Chemistry of Cement Hydration
The hydration of Portland cement has been exhaustively examined, interpreted, and
reinterpreted over the last century. While the overall course of the reaction has been established,
many of the details are still under debate. For the purposes of this review, only the essential
features of cement hydration that are relevant to later discussions on structure will be presented;
consequently, the discussion will focus primarily on the calcium silicate hydrate product. For
completeness, the other hydration products will be mentioned but the reader should consult
Taylor’s excellent book [6] for further information.
The primary hydration reactions involve four oxide phases formed during the
clinkerization process: tricalcium silicate, 3CaO•SiO2 (C3S), dicalcium silicate 2CaO•SiO2
(C2S), tricalcium aluminate 3CaO•Al2O3 (C3A), and tetracalcium aluminoferrite
4CaO•Al2O3•Fe2O3 (C4AF). (The abbreviations used here and throughout this review follow the
conventions of standard cement chemistry notation: C=CaO, H=H2O, S=SiO2, F=Fe2O3,
A=Al2O3, S = SO3.) It is important to note that all of these chemical formulas are approximations
since each of the phases contains appreciable quantities of impurities. In addition to the four
primary oxide phases, gypsum (CS H2) is also present. A typical average composition of a Type
I normal Portland cement (used for standard applications) is approximately (in weight-%): 50%

C3S, 25% C2S, 12% C3A, 8% C4AF, 3.5% CS H2, with the balance consisting of small amounts
of compounds of magnesium, sodium, potassium and sulfur.
When Portland cement is mixed with water, the primary chemical reactions can be
approximately represented as follows:
C3S + (1.3 + x)H → C1.7SHx + 1.3CH (1)
C2S + (0.3 + x)H → C1.7SHx + 0.3CH (2)
C3A + 3CS H2 +26H → C3A•3CS H32 (3)
2C3A + C6AS 32H32 + 4H → 3C4AS H12 (4)
C3A + 6H → C3AH6 (5)
C4AF + 13H → C4(A2F)H13 (6)
where the variable x in Eqs. (1,2) represents the chemically bound water content (that is
discussed below) in the calcium silicate hydrate product.
Since C3S and C2S constitute approximately 75% of the Portland cement, the calcium
silicate hydrate (C1.7-S-Hx) and calcium hydroxide (CH) phases [see Eqs. (1,2)] dominate the
hydration products of Portland cement, each comprising approximately 50 to 60% and 20 to 25%
of the total product volume respectively. The calcium hydroxide phase is significant since it
buffers the aqueous pore solution (which contains an appreciable level of dissolved salts) to a pH
of about 12.5. However, the far more important hydration product is the calcium silicate hydrate.
From a practical standpoint, calcium silicate hydrate is essential for concrete since it is the phase
that binds to steel reinforcing bars, aggregates, sand, and other hydration products.
On the colloidal scale, the calcium silicate hydrate phase is an amorphous gel that
contains pores (appropriately called gel pores) of approximately a few nanometers in diameter.
The fineness of the porosity creates a significant surface area between the calcium silicate

hydrate and its pores, reaching a magnitude of a few hundred m2g-1; this value is essentially
equal to the surface area of the hardened cement paste since the contribution made by the other
hydration products is comparatively negligible. As a result, calcium silicate hydrate is
responsible for almost all of the important properties of hardened cement paste such as strength,
volume stability and permeability. Another important consequence of its fine porosity and high
surface area is the intimate association between calcium silicate hydrate and the aqueous phase
that resides in its gel pores. This intimacy is revealed by the fact that a line segment which
originates in a gel pore and traverses a calcium silicate hydrate particle perpendicular to its
surface will emerge into another gel pore at a distance no greater than tens of nanometers. Since
this type of significant intermixing between solid and porous phases is one of the defining
characteristics of a colloidal gel [7], calcium silicate hydrate will often be described as a
colloidal gel in this review. An immediate consequence of the finely divided colloidal structure
is the fostering of significant intermolecular interactions between the calcium silicate hydrate and
water (which resides in the pores). As will be discussed in Section 6.11.5.2, these interactions
play major roles in properties of hardened cement paste such as drying shrinkage and creep.
In addition to the water in the fine gel pores, there is the chemically bound water of
calcium silicate hydrate that is represented in the formula, C1.7SHx. The subscript x on the water
component indicates that the chemically bound water content in calcium silicate hydrate is not
fixed. A typical formula for a water saturated calcium silicate hydrate is C1.7SH4.0 [6]; the water
content in calcium silicate hydrate for sub-saturated conditions will be correspondingly less.
Also note that the molar ratio of CaO to SiO2 (C/S) in calcium silicate hydrate found in hardened
cement pastes can slightly diverge from its average value of 1.7 represented in Eqs. (1,2). For
example, an analytical electron microanalysis study [8] showed that a 26-year old C3S paste

possess a C/S range of approximately 1.60 to 1.85, with a modal value of 1.78. To minimize any
ambiguities in chemical composition, it is preferable to use the terms “C-S-H” or “C-S-H gel” to
describe any poorly crystalline calcium silicate hydrate with an arbitrary water content or C/S
ratio [6]. These terms will be used throughout the remainder of the review. (Note that without
the dashes the term “CSH” refers to a very particular composition, CaO•SiO2•H2O.)
6.11.2.2.2 Kinetics of Hydration
That Portland cement and water constitute a highly dynamic system is readily seen from
the hydration kinetics. Figure 2 shows a characteristic rate of heat evolution during hydration of
C3S. (Portland cement shows a very similar plot but with additional peaks associated with the
aluminate phase.) A dramatic series of events occurs during the first 24 hours. Upon mixing,
there is an intense but brief production of heat, lasting only a few minutes (stage 1 in Figure 1).
Most of this initial activity for C3S is from wetting effects, but in the case of Portland cement, the
early heat release is also due to reaction of the aluminate phases. The heat output then stabilizes
to a relatively constant rate during the induction (or dormant) period (stage 2), in which the paste
remains in a relatively plastic, fluid state for approximately 2 hours. The causes of the induction
period and of its termination have been debated considerably, and the relevant hypotheses differ
mainly as to whether protective membranes form around cement particles or nucleation of C-S-H
or CH is inhibited [9]. Regardless of the specific mechanism, the end of the induction period is
marked by a dramatic increase in the rate of heat evolution caused primarily by the formation of
C-S-H gel and CH. This acceleratory period (stage 3) ends in a maximum in heat output (at about
10 to 12 hours). Thereafter, the heat evolution decelerates (stage 4) to a steady state level (stage
5) during which hydration continues for a period of several months to a few years. As a result of

this extended period of reaction, the structure, and more importantly, the pore structure of
hardened cement paste will continuously evolve with time.
6.11.2.2.3 Morphology of Hydration Products
Hydrated cement paste is a cohesive, albeit porous, entanglement of hydration products
that differ in chemical composition and morphology. Since the solid phases ultimately bound,
and thus create, the porous space in hardened cement paste, a basic knowledge of the solid phase
morphology should give a greater understanding of the porous structure to be described in later
sections.
As noted in Section 6.11.2.2.1, the colloidal C-S-H gel product dominates the structure of
hardened cement paste. Despite being crystallographically amorphous, there are distinct
morphologies of C-S-H that can be identified by techniques such as scanning electron
microscopy (SEM); four morphologies of C-S-H gel have been observed [10] (see Table 1). The
relative abundance and importance of each morphology are unknown, but it has been shown that
the various types can be associated with specific stages of hydration [11].
The morphologies listed in Table 1 are those obtained after thorough drying of the C-S-H
gel, which is a required procedure for conventional electron microscopy techniques that operate
at high vacuum. The loss of evaporable water from C-S-H gel associated with the drying
procedure inevitably produces irreversible changes in the microstructure, and thus, one is left to
observe only relics of the actual structure. This critical issue must be kept in mind in evaluating
any electron microscopy investigation of C-S-H.
Even though the amorphous, colloidal C-S-H gel dominates the structure of hardened
cement paste, there are important crystalline phases embedded in the C-S-H gel network (Table
1). If there is enough space available, calcium hydroxide (CH), the most abundant crystalline

phase, can form massive hexagonal-prism crystals of approximately 100 µm across. The calcium
sulfoaluminate phases of ettringite (C3A•3CS H32) and monosulfoaluminate (3C4AS H12) [(see
Eqs. (3,4)] are other distinct crystalline phases that adopt prismatic needlelike and hexagonal
plate morphologies, respectively.
6.11.2.3 Physical Structure of Hardened Cement Paste
While the chemical and morphological nature of the hydration products certainly
influence properties, many phenomena associated with the hardened cement paste are the result
of purely physical features of the structure such as porosity and colloidal dimensions of the solid
and porous phases. Powers and coworkers at the Portland Cement Association in the USA during
the 1940s to early 1960s were the first to systematically investigate these factors. Despite
limitations in experimental techniques, their seminal review [12] of hardened cement paste still
forms the basis of much of our current interpretation of its structure and properties.
On mixing cement with water, the cement particles are dispersed and essentially
discontinuous (or only connected by van der Waals type forces). Water-filled space separates the
cement grains by a distance roughly equal to the of size of the grains, which ranges from 1 to 100
µm in diameter but averages between 15 to 20 µm. Reactions take place at the surface of the
original cement grains where products can either form directly on the surface of the grain (as is
done by C-S-H), or precipitate in the water-filled space (as in done by both calcium hydroxide
and C-S-H). As hydration continues, the cement particles become progressively smaller and the
original water-filled space becomes increasingly filled with hydration product, most of which is
the porous C-S-H gel. If insufficient water-filled space is available for the hydration products to
deposit, the reaction can terminate before all unhydrated cement particles have reacted.
Alternatively, if the original water to cement ratio was exceedingly high, hydration product will

only partially fill the original water-filled space, leaving behind an excess of unfilled space
called capillary pores. As will be described in later sections, capillary pores can be significantly
larger than the gel pores of C-S-H described in Section 6.11.2.2.1.
According to the above description, hardened cement paste can be thought of as
consisting of unreacted cement, C-S-H gel (including its gel pores), calcium hydroxide, and
capillary pores (see Figure 2). This representation is an obvious oversimplification, because we
have neither taken into consideration the hydration products of the aluminate phases, nor have
we admitted the evidence that the morphologies of the C-S-H gel formed in the space originally
occupied by cement particles is different from those formed in the space originally filled with
water. Nevertheless, numerous (but certainly not all) experimental observations can be explained
on the basis of such a simplified, idealized microstructure. Among the observations easily
understood by this model are the following. Increasing the initial water to cement weight ratio
(w/c) results in a more porous hardened cement paste; decreasing the w/c results in a denser one.
Porosity is seen to decrease with reaction time; consequently, strength, being a direct function of
porosity, is seen to increase with time. Permeability, and hence susceptibility to ingress of
aggressive species, is directly related to the extent of discontinuity of the capillary porosity [13,
14].
This simple model system consisting of unhydrated cement, C-S-H gel, calcium
hydroxide and capillary pores forms the basis of the sophisticated three-dimensional
computational simulations of cement hydration developed at the National Institute of Standards
and Technology [15]. Coupled with theoretical concepts of percolation and composite theory,
many of the properties of hardened cement just cited can be computed, and agreement with
experimental results are often very good.

6.11.2.4 Pore Structure of Hardened Cement Paste
Any discussion of the structure of hardened cement paste will inevitably lead to a
discussion of its complex porous structure. The following sections will outline the various
classes of pores in hardened cement paste. These classes will be distinguished by their
characteristic pore sizes, and more importantly, by the interactions between the C-S-H gel and
the aqueous phase that is held within their associated pores.
6.11.2.4.1 Pore Size Distribution
A typical pore size distribution for hardened cement encompasses a large range,
extending from about 10 µm to as small as 0.5 nm or less in diameter (Table 2). The larger pores,
ranging from 10 µm to 10 nm, are the residual unfilled spaces between cement grains, earlier
defined as capillary pores. The finest pores, ranging from approximately 10 nm to 0.5nm, are
called gel pores since it is believed that they constitute the internal porosity of the C-S-H gel
phase. Pores having dimensions of 0.5nm or smaller are formed by the interlayer spaces of C-S-
H gel, where chemically bound water resides (see Section 6.11.2.2.1). It is important to note that
since the range of pore sizes is a continuous one, the suggested dimensional boundaries between
capillary and gel pores, and between gel pores and interlayer spaces are simply approximations
to inherently blurred boundaries.
Voids greater than 10 µm often exist in concrete [16], either from the unintentional
entrapment of air during the mixing procedure, or from intentional air-entrainment, which
purposefully disperses air voids of approximately 50 µm in diameter throughout the paste to
relieve pressures induced from the freezing of water in pores (discussed in Section 6.11.6.2.1).

Air voids can be considered essentially outside the characteristic hardened cement paste pore
system, and thus, will not be discussed in ensuing sections.
6.11.2.4.2 Non-Evaporable Water: Interlayer Spaces
As noted in Section 6.11.2.2.1, C-S-H gel has a variable amount of chemically bound
water in its interlayer spaces that is, at equilibrium, a function of the external saturation
conditions (i.e. RH). Determination of the precise amount of chemically combined water,
however, is not a trivial matter. As noted in Section 6.11.2.4.3, a distinct physical boundary
between interlayer spaces (which contain the chemically bound water) and the smallest gel pores
does not exist. This situation inevitably blurs the line between chemically bound and physically
bound water. Facilitating a means of distinguishing between the two requires the definition of
specific terms.
Non-evaporable water is strictly defined as water that is not removed from a specimen
under a standard drying condition; evaporable water is the water removed under the same drying
condition. The most well defined (but arbitrary) standard drying condition is vacuum drying at
the equilibrium vapor pressure of water (~ 6.7 x 10⁻² Pa) obtained at the temperature of dry ice (T
= 194 K), a process known as D-drying [17]. D-drying is often approximated by the more
convenient oven drying at 105°C, or vacuum drying at ambient conditions; these latter methods,
however, should not be used for precise measurements of non-evaporable water since a fixed
equilibrium water vapor pressure is not involved, as is the case for D-drying.
The non-evaporable water retained in the specimen after D-drying (or roughly equivalent
processes) is approximately equal to the amount of water chemically combined with the cement.
Taylor [6] warns, however, that the non-evaporable water measured on D-drying should not be
precisely equated with the amount of chemically combined water since an unknown amount of

chemically combined water will inevitably be lost upon D-drying. Nevertheless, the non-
evaporable water content is a very useful empirical measure of the extent of the hydration. Since
a fully reacted Portland cement contains approximately 0.24 g of non-evaporable water per gram
of cement, one can obtain the approximate degree of reaction by dividing the measured non-
evaporable water content of a specimen by a factor of 0.24.
6.11.2.4.3 Evaporable Water: Capillary vs. Gel Water
The evaporable water content of hardened cement paste is often divided into two classes,
capillary and gel water. The obvious distinction between the two is the difference in size of the
pores the water is residing in: gel pores are roughly 10 nm or smaller while capillary pores can
reach up to 10 µm (see Table 2). As mentioned, the physical demarcation between capillary and
gel pores is ultimately arbitrary since the spectrum of pore sizes is continuous. The original
distinction between gel and capillary pores, delineated by Powers and Brownyard [12, part 3],
arose from water adsorption studies that indicated a minimum porosity when hydration products
filled all available water-filled space (i.e., no capillary pores). The remaining porosity at this
unique condition was thus concluded to be entirely present in the porous C-S-H gel phase, and
hence, the associated pores were denoted as gel pores. When the hydration products could not fill
all available space (i.e., when excess water is present), additional pores of considerably larger
scale were introduced in the paste. These capillary pores were not dependent on the amount of C-
S-H gel formed, but could be present in any amount depending on the original water content of
the paste.
The characteristic sizes of capillary and gel pores have important influences on the
behavior of liquid water that resides in these pores. The constrained dimensions of smallest gel
pores (less than about 4 or 5 nm), for example, will promote important intermolecular

interactions between the C-S-H gel surface and the water molecules of the gel water. These
interactions (which are present in virtually all colloidal systems [7, 18, 19]) lead to an aligning,
or structuring, of the polar water molecules in the vicinity of the C-S-H gel surface. Since gel
water in small pores will always be near a solid surface, the structuring of water molecules is a
significant, and perhaps dominant, phenomenon in gel water. As a result, physical properties of
gel water such as density, viscosity, dielectric constant and conductivity often differ from those
of bulk water [19]. The density of gel water in C-S-H, for example, is seen to be slightly higher
(~ 1.1 g cm-3) than that of bulk water [20]. Also, the mobility of gel water in the vicinity of a
surface is significantly decreased from its bulk value [7]. This reduced mobility has been
postulated to play important roles in mechanisms of creep and of drying shrinkage at low
humidity. Moreover, the reduced mobility of gel water is exploited in the use of nuclear
magnetic resonance (NMR) [7] (see Section 6.11.3.5) to measure the surface area of hardened
cement paste.
As we have seen, capillary water resides in significantly larger pores than does gel water.
The important consequence of this is that capillary water does not undergo the strong
intermolecular interactions with the C-S-H surface that are dominant in small gel pores.
Capillary water will, in essence, behave like bulk water. However, since capillary water must
possess a high surface to volume ratio (due to the physical confinement of capillary water in
capillary pores), the properties of capillary water will be strongly influenced by the properties of
its interfaces. These interfaces between liquid water and solid C-S-H gel or between liquid water
and air are characterized by excess surface energies, or surface tensions, which arise due to the
presence of unsatisfied bonds at the interface. As will be discussed further in Sections 6.11.5.2.2
to 6.11.5.2.4, surface tension is significant during the drying of C-S-H gels since its presence at

curved liquid-vapor interfaces (i.e., menisci) creates pressure differentials across these interfaces
(a phenomenon embodied in the Laplace equation). Due to the negative curvature of the menisci,
the evaporating capillary water will experience a negative capillary pressure, or equivalently, a
tension that depends on the curvature [7, 21]. To relax this internal tension in the liquid phase,
the adjacent C-S-H solid phase goes into compression. This induced compressive force causes
the C-S-H gel to shrink.
6.11.2.5 Volume Relationships; Water to Cement Ratio; Self-Desiccation
Considering all of the above, one might conclude that the water to cement ratio (w/c)
probably has the dominant effect on the porosity, and hence the properties, of hardened cement
paste. It was stated earlier that increasing the water to cement ratio increases the initial water-
filled space between unhydrated grains, which ultimately leads to a greater proportion of
capillary pores in the hardened cement paste after hydration is completed. The explanation as to
why this is so lies in the combined experimental observations that: (i) the hydration reaction
takes place at essentially constant volume, and (ii) the hydration products at complete reaction
require a finite amount of additional space over the original volume of cement from which they
form. Concerning the latter point, Powers [20] estimated that 2.2 cm3 of space is required to fully
hydrate 1 cm3 of Portland cement. Thus, if the original w/c ratio is high enough to create an
excess of 2.2cm3 of water-filled space for every 1cm3 of cement, remnants of the water-filled
space will be present even after complete reaction since the hydration products can only occupy,
at most, 2.2 cm3 for every 1cm3 of cement.
An equally valid conclusion to be drawn from the two experimental observations
mentioned above is that there is a unique w/c ratio below which hydration cannot be completed
due to insufficient space for the hydration product to form; Powers and Brownyard [12] estimate

this w/c to be ~ 0.38. A schematic of the effect of w/c on the volumetric proportions of
hydration product, unhydrated cement and capillary pores is shown in Figure 3.
It is important to note that Figure 3 assumes that a sufficient supply of excess water is
available throughout hydration. It has been observed experimentally that a fully hydrated sample
will take up approximately 0.06 g of additional water per gram of cement when hydration takes
place under water [6, pg. 232]; this amount corresponds to the amount of water required to fill
the gel pores with water. If a cement paste is sealed during hydration, water flows from the
capillary pores to the gel pores until the latter are saturated. This action would effectively empty
the capillary pores and reduce the amount of water available for reaction with the original
cement; hydration can thus be halted from a lack of available water before space limitations
come into effect. The net result of this phenomenon, called self-desiccation, is that a sealed
cement specimen requires a higher initial w/c for complete reaction, estimated to be 0.44.
6.11.3 Characterizing the Pore Structure and Surface Area of Cement Paste
All of the engineering properties of cement and concrete are related in some way to the
porosity, and characterization of the pore system is often a better predictor of performance than
characterization of the solid phases. However, characterizing the porosity of hydrated cement
paste is difficult. Because of the large range of pore sizes (from a few nanometers to tens of
micrometers), no single technique can adequately characterize all of the important components
of the pore system. Most standard techniques require that the pore fluid be removed, but such a
drying pretreatment can sometimes significantly alter a porous structure. Therefore,
measurements performed on dry paste may give an inaccurate picture of the porosity of cement
paste under the conditions of its actual use.

There are three general parameters of interest in the pore system: the total porosity, the
pore size distribution, and the specific surface area of the pores. Experimental techniques for
characterizing the pore system can be divided into two categories: those that involve the
intrusion of a fluid into the pore system (pyknometry, mercury intrusion, gas sorption,), and
those that use particles or fields to probe the material (small-angle scattering, NMR). The latter
category has a significant advantage, in that the cement does not need to be dried. However,
these "modern" techniques require highly specialized equipment, and the data are more difficult
to interpret.
Measurement of the specific surface area is by far the most commonly performed
analysis of cement paste pore systems. Values reported for surface area in the literature vary over
two orders of magnitude, depending on the technique used and the interpretation of the results.
Despite this variability, surface area measurements are still performed. This fact attests to the
utility of having a single parameter such as surface area that describes the overall fineness of the
microstructure on a nanometer scale, and that correlates closely to important properties such as
durability and drying shrinkage. Thomas et al. [22] have reviewed the application of different
techniques to measuring cement paste surface area.
The variability of the specific surface area is related to a number of factors, some of
which are listed below in approximate descending order of importance:
1) Difficulties with data analysis. Modern techniques, namely small angle scattering and NMR,
provide important insights into the microstructure and pore system of cement-based
materials. However, obtaining quantitative surface area values from these techniques is
difficult due to the many models and assumptions needed to convert the raw data. The first
reported surface area values for small-angle X-ray scattering and for NMR were both

extremely high (several hundred m2g-1). Refinements of the data analysis and improved
experimental calibration methods may bring the values more into line with gas sorption
values.
2) Specimen preparation. As noted above, gas sorption requires that the paste be dried, and
this affects the pore system. The difference in values for the surface area obtained (1) by
nitrogen sorption (SN2) after severe drying (such as oven drying) and (2) after solvent
exchange, which preserves the pore structure, can approach an order of magnitude.
3) Normalization of the surface area value. Gas sorption results are reported as surface area
per weight of dried paste, the unit for small-angle scattering is area per sample volume, and
NMR results are generally reported as area per weight of starting cement powder. Results
from any technique are occasionally reported as area per weight of ignited paste. This can
generate numerical differences of up to a factor of two, making comparisons difficult. It is
possible to make an approximate conversion from one type of units to another using
hydration models and known properties of cement paste. Results reported here are converted
to area per grams of D-dried paste where needed, following the approach of Thomas et al.
[22].
4) Analytical sensitivity. Some techniques may probe features of the internal C-S-H structure
not associated with the surface area, while others do not measure the full surface. It is
difficult to deconvolute these effects from issues associated with data analysis (factor 1
above).
When the above factors are taken into account, surface area measurements are a useful
way to characterize cement. The specific surface area varies with the age of the paste, the
water/cement ratio, the cement composition, and other processing variables, which determine the

amount of finely divided hydration product in the material. Due to the above issues, these effects
are best observed using a single measurement technique and method of sample preparation.
Another, more philosophical difficulty associated with surface area measurements of
cement paste is defining what exactly is meant by the cement surface. The C-S-H phase has an
extremely high specific surface area, and the total surface area of cement paste is essentially
equal to that of its C-S-H component. In addition to the liquid water within the internal gel pores,
the C-S-H in cement also contains strongly adsorbed and chemically bound water as part of its
internal structure. This creates a basic uncertainty in defining the boundary between solid and
pores. A satisfactory measurement of surface area for cement paste would include the gel pores,
which contribute to the transport of reactive species through cement paste, and would exclude
any features of the internal solid C-S-H structure that do not contribute to ionic transport. It is not
clear, however, that there is a distinct structural separation between these types of features.
6.11.3.1 Pyknometry
Pyknometry measures the porosity of a specimen by simply measuring the volume of
fluid that can intrude into the material. For cement paste, the total porosity is most easily
obtained by measuring the loss of mass when the evaporable water is removed, normally by
heating to 105°C. A true pyknometric measurement, obtained by resaturating a dried specimen in
water, gives the same result. It is an interesting feature of cement paste that the intrusion of other
fluids, such as helium or methanol, into well-dried specimens results in a smaller measured
porosity. The reason for this is that the most tightly bound evaporable water is associated with
the C-S-H gel phase in such a way that its equivalent volume is only measured by resaturation
with water [6]. This is verified by the fact that when pyknometry is performed after partial
drying, water, helium, and alcohols all give the same result [23]. If a water-saturated paste is

solvent-exchanged with alcohol and then fully dried, resaturation with alcohol measures a larger
pore volume similar to that measured by water [24]. It thus appears that the physical changes
associated with removal of all the evaporable water can be avoided by prior solvent exchange.
This is in agreement with specific surface area measurements performed with gas sorption,
which are highest when drying follows solvent exchange.
Equilibration of cement paste to 11% relative humidity (RH) is an accepted method of
removing all the pore water while leaving more tightly bound water in place. The pore volume
thus obtained (after the ingress of any suitable fluid) is called the free water porosity [6]. As
would be expected, the total and free water porosities both decrease with the age of the paste and
increase with the w/c ratio. Table 3 lists reported values for total and free water porosities for
mature cement pastes having different w/c. In the cement literature, the difference between the
total porosity and the free water porosity is often referred to as the "interlayer porosity" or "gel
porosity". These terms, which arise from structural models of the C-S-H phase, are sometimes
used interchangeably and sometimes have very different meanings, which should be taken in
context.
6.11.3.2 Mercury intrusion porosimetry
Mercury intrusion porosimetry (MIP) is one of two methods commonly used to measure
a pore size distribution in cement paste, the other being gas sorption. After the specimen is
dried, mercury is forced into the pore system under increasing isostatic pressure, and the intruded
volume is recorded. Because mercury does not wet the solid, it enters pores only under pressure,
and the smaller the pore the greater the pressure required.
MIP is complimentary to gas sorption in the sense that it measures more of the capillary
porosity while gas sorption measures the finest pores more accurately. The two techniques do not

agree within their region of overlap, however. As summarized by Taylor [6], there are serious
problems with the application of MIP to cements:
1) The method measures the size of the pore entrances, not the pore itself. When a large pore
can only be accessed through a small opening, the entire volume accessed is registered as
small porosity. This has been shown to generate serious errors for cement paste [25].
2) Data analysis assumes cylindrical pores and a constant contact angle; these assumptions
are not strictly correct for cement paste.
3) The drying treatment changes the pore structure. This is also true for other techniques,
notably gas sorption. As with gas sorption, exchange with alcohol prior to drying preserves
the structure to some extent.
4) The fine structure is damaged by the large stresses needed to intrude the mercury.
5) The coarsest part of the porosity (the largest capillary pores) is not fully registered.
Because of these issues, the pore-size distribution measured by MIP is very different
from the true value for a saturated pore system, particularly at the coarsest and finest ends of the
distribution. MIP does provide self-consistent results, however, registering useful differences for
pastes of different ages and w/c ratios. The total intruded volume decreases with age and the
distribution shifts sharply to smaller pore sizes during the first 7 days of hydration. MIP has also
been used to measure differences in the pore systems of cement and concrete arising from a more
porous interfacial transition zone (see Section 6.11.5.3.2) surrounding individual aggregate
particles [26].

6.11.3.3 Gas sorption
Gas sorption is the oldest and most widely used technique for measuring the surface area
of cement paste, and it is by far the technique with the most published results. Gas sorption can
also provide a pore size distribution of the finer pores (<30 nm). Issues associated with drying of
cement paste are particularly important for gas sorption, and methods of drying cement paste are
discussed in this section as well. The physics and applications of gas sorption techniques are
covered in a book by Gregg and Sing [27]. Rarick et al. [28] reviewed the application of the gas
sorption method to cement paste.
The gas sorption isotherm for cement paste can be classified as type IV in the BDDT
scheme [29]. This category is associated with mesoporous materials such as silica gel, porous
glass, and certain naturally occurring minerals such as montmorillonite [27]. A key feature of
type IV isotherms is a hysteresis loop, caused by the irreversibility of the capillary condensation
process in mesopores (2 - 50 nm). The hysteresis loop for cement paste is large, reflecting the
significant mesoporosity in the C-S-H gel. The specific surface area is obtained from the
multilayer adsorption region of the isotherm, using the well-known BET method. The desorption
isotherm can be used to calculate a pore size distribution in the mesopore region using a method
developed by Barrett, Joyner, and Hallenda [30].
Most published gas sorption measurements of the surface area of cement paste have used
either water vapor or nitrogen as the sorptive gas. Because equilibrium is approached very
slowly when water vapor is used, the procedure requires a variation of the gravimetric method.
This involves exposing the specimen to a series of closed vessels containing salt solutions with
different water vapor pressures. Surface area results from nitrogen sorption are obtained using
the volumetric method; an automated process provides faster results with less labor.

6.11.3.3.1 Drying Cement Paste for Gas Sorption
As mentioned above, one of the drawbacks of the gas sorption technique for application
to cement paste is the requirement that the specimen be dried. There are two general problems
associated with the drying pretreatment. First, any gel pores that remain filled with water due to
incomplete drying will not be accessed by the adsorbate molecules and will not be included in
the surface area measurement. The smallest pores are the most difficult to dry, but they also have
the highest relative surface area. The second, and more serious, problem is that the drying
process changes the C-S-H structure. Different drying techniques cause different changes to the
C-S-H, and surface area results from gas sorption vary rather widely depending on the drying
treatment. Also, if the dried paste is stored for a long period of time before measurement,
exposure to even small amounts of CO2 leads to carbonation of the C-S-H gel and significant
decreases in the measured surface area.
For cement paste, the simplest techniques for removing the water in preparation for a gas
sorption measurement are oven drying at 105°C or vacuum drying using a rotary pump.
Although these techniques effectively remove all of the evaporable water, they also damage the
specimen. To minimize this damage gentler drying techniques have been developed. The most
common of these is D-drying, which involves equilibrating the specimen to the pressure of water
vapor at the temperature of dry ice (see Section 6.11.2.4.2). This is the standard preparation
procedure for gas sorption.
Another method sometimes used during preparation of cement paste specimens for gas
sorption is solvent exchange. Before drying, the specimen is placed in a bath of a solvent having
a high vapor pressure, such as methanol, thus allowing the pore water to exchange with the
solvent. The solvent is then removed using a standard method such as D-drying. Preparation by

this method results in significantly higher surface area values than otherwise. Another factor
affecting the nitrogen surface area is the rate of drying. Faster drying, particularly in the relative
humidity range of 30-70% where capillary tension forces are greatest, results in a higher
measured surface area. All the evidence from different drying methods points to an effect of
capillary tension on the C-S-H phase, with harsher drying rearranging the pore structure so as to
exclude adsorbate molecules from entering the finest pores.
6.11.3.3.2 Gas Sorption Results
The surface areas of cement paste measured by sorption of nitrogen and of water vapor
are usually quite different, with water vapor giving higher values. For well hydrated cement
dried rapidly and completely to a D-dried state, water vapor gives about 200 m2 g-1, while
nitrogen gives 50-140 m2 g-1, depending primarily on the w/c ratio.
The difference between nitrogen and water vapor surface areas was the subject of a
vigorous debate in the literature in the 1960s and early 1970s. One point of view was that only
the smaller water molecule could fully penetrate the smallest pores and thus measure the full
surface area [31, 32]. Proponents of this theory hypothesized that the C-S-H gel contained many
"ink-bottle" pores with entrances of a size that allowed water molecules to enter while excluding
nitrogen. Others argued that water vapor was chemically or structurally re-incorporated into the
C-S-H gel phase during the measurement, causing the water vapor results to be too high [33]. C-
S-H structural models are discussed in Section 6.11.4.
There are a few significant observations supporting the view that nitrogen sorption
provides the more useful results. Nitrogen sorption is used with good success to characterize
many other colloidal and microporous materials that have pore systems comparable to that of
cement [27], suggesting that the difference between the results from nitrogen and water in

cements is due to chemical interactions rather than pore inaccessibility. When cement surface
areas are measured with sorptive gases having different molecular sizes, water vapor does not
match the trend observed with other molecules. As shown in Table 4, the surface area measured
with water is much higher than would be expected. Finally, the surface area obtained with water
vapor does not vary with the starting water/cement ratio of the cement (see Table 5), as is
observed with other sorptive gases (and with small-angle scattering). The increase in the relative
amount of fine pore structure with w/c (and with other variables such as chemical and mineral
admixtures) is an important aspect of cement paste, and the insensitivity of water vapor to these
variables certainly limits its usefulness regardless of which method measures the "full" surface
area.
The surface area measured with nitrogen (SN2) increases with hydration time until it
plateaus at a maximum value. The maximum surface area as well as the time to reach this plateau
increases with the water/cement ratio. Figure 4 shows typical results for the variation in SN2 with
age for cement pastes with different w/c. The lower w/c specimen reaches a maximum surface
area value by 28 days, while the higher w/c specimen continues to increase in surface area out to
180 days. The increase in surface area of mature pastes with w/c is shown in Table 5. A logical
interpretation of these results is that the amount of hydration (and the amount of surface area) is
controlled by the space available for new product to form. However, hydration (defined as
continued binding of free water) can continue long after the maximum surface area has been
reached. In addition, all pastes, even mature pastes with low w/c, have some capillary porosity.
This and other related observations have led to the proposition that two structures of C-S-H form
in cements, only one of which has a high surface area. This is discussed in more detail in Section
6.11.4.2.

6.11.3.4 Small Angle Scattering
Small-angle scattering is a powerful tool for characterizing complex microstructures. It is
a particularly attractive technique for characterizing cement paste because it is sensitive to
features on the order of a nanometer in size and larger, and because specimens can be analyzed
with water-filled pores, thus avoiding the problems associated with drying discussed in the
previous section. Small angle neutron scattering (SANS) and small angle X-ray scattering
(SAXS) operate on the same physical principle (diffraction), and they are discussed together in
this section. The primary difference between SAXS and SANS is that neutrons are scattered by
interactions with atomic nuclei, while X-rays are scattered by interactions with outer shell
electrons. However, in both cases the scattering occurs at interfaces between two phases. In
cement, the scattering of both X-rays and neutrons is mostly at the interface between solid C-S-H
and the pore system, although information about coarser microstructural features can also be
obtained.
Scattering techniques and their application to porous materials are discussed in detail
elsewhere in this volume so only a brief overview focussing on issues relevant to cements is
given here. The energy source consists of an intense, monochromatic (single wavelength) beam
of either neutrons or X-rays. The thickness of the specimen is chosen so that majority of the
incident intensity, generally 70% or more, passes through the specimen without interaction. (If
the transmission is too low, multiple scattering effects limit the utility of the data. For cement
paste, the maximum thickness is about 1 mm for SANS and perhaps half that for SAXS. In both
cases the volume of paste that is sampled is large enough to be statistically representative of the
microstructure.) Most of the remaining intensity is scattered through random, elastic collisions
with atoms in the specimen, creating large incoherent background signals. Thus only a small

fraction of the incoming intensity (on the order of 1%) is scattered by diffraction through a small
angle via interactions with microstructural features within the bulk of the material. These data
must be separated from the incoherent background and calibrated as part of the analysis. The
interpretation of SANS scattering data from highly disordered materials such as cement paste
was discussed by Allen et al. [37]. Thomas et al. [22] have reviewed the application of SANS
and SAXS to cement paste.
For purposes of analysis, the scattering angle, Φ, is normally replaced with a scattering
vector, Q, defined as:
=
2sin
ð4 ÖQ
λ (7)
where λ is the wavelength of incident neutrons or X-rays. This substitution simplifies the
mathematics.
For cement and similar porous materials, the small-angle scattering profile, which is the
flux of neutrons or X-rays as a function of scattering vector, is effectively a form of Fourier
transform of the solid/pore microstructure. As the scattering vector increases, the size of the
microstructural features that contribute to the signal decreases, so different aspects of the
microstructure can be probed by focusing on the appropriate range of data. The intensity of the
small angle scattering is a strong function of scattering vector, falling off sharply as the
scattering vector increases. The smallest values of Q that can be resolved (and thus the largest
microstructural features) are determined by the experimental setup. The effective maximum
scattering angles, and associated minimum dimensions studied, are determined by the signal-to-
noise ratio as the small-angle scattering becomes small compared to the incoherent background
signal. This is an important issue for surface area determination.

The surface area of a specimen is determined from the small angle scattering response at
the largest scattering vectors, called Porod scattering. In the Porod region the intensity of the
scattering, I, falls off as Q4, and the surface area is given by
2||ð2 Äñ
CS P
V =(8)
where SV is the surface area per unit sample volume, ∆ρ is the difference in the scattering length
density of the two materials forming the interface associated with the scattering, and CP, the
Porod constant, is the intercept of a linear fit to Porod data plotted as IQ4 vs. Q4. The term |∆ρ|2
is called the scattering contrast, and it represents the relative strength of the scattering interaction
created by the interface between the two materials that define the surface. For cement, this
contrast is between C-S-H and H2O in a saturated paste, or between C-S-H and air if the paste is
dried.
Once the Porod constant has been measured, there are two ways that the surface area can
be determined from Eq. 8. The first, and preferred, method is to determine the scattering contrast.
If the formula and density for the two phases creating the interface are known, the contrast can
be calculated directly. Unfortunately, this is not the case for cement because the amount of water
that should be included in the solid C-S-H phase for the purpose of this calculation is not known
a priori. In the case of SANS, the contrast can be calculated experimentally by taking advantage
of the difference in contrast when specimens are exchanged with D2O (heavy water) [38-40].
The second method for determining the surface area is the "scattering invariant" method.
The scattering invariant, Iinv, is given by:
vinv dQIQI φρ 22
0
2 ð2 ∆== ∫∞
(9)

where φv is the volume fraction of the scattering phase, which is C-S-H in the case of cement.
This method has two advantages: the data need not be absolutely calibrated, and the scattering
contrast does not need to be known explicitly. However, these are more than offset by the
difficulties associated with taking the integral in Eq. 9. The integration must be over all values of
Q, which requires extrapolation of the experimental data. Uncertainties in the scattering profile
or in the incoherent scattering subtraction create the potential for large errors, particularly at high
Q [22]. Another problem is that the volume fraction of C-S-H, φv, is not easy to determine
accurately.
Most SANS surface area values have been calculated using the contrast method, while
SAXS studies have generally used the scattering invariant method.
An important contribution of small angle scattering to the study of cement is the
discovery that the C-S-H phase has a disordered fractal structure [39, 41, 42], the non-solid
spaces of which actually comprise the so-called "gel porosity" and, perhaps, part of the capillary
porosity as well. In this context a fractal region can be defined as a heterogeneous microstructure
that remains consistent over various length scales, and such a microstructure is readily identified
by the presence of a linear region on a log-log small-angle scattering plot of I vs. Q. Figure 5
shows a typical SANS plot of this type for a mature cement paste and the various Q-ranges of
interest. SAXS plots are essentially similar.
At larger Q values where smaller features are probed, a mass or volume fractal structure
is observed with both SANS [38, 39] and SAXS [42-44] with a fractal scaling exponent, DV, of
2.5-2.8. Monte Carlo simulations performed on SANS data by Allen et al. [39] indicate that this
structure is generated by the random aggregation of 5 nm diameter particles of C-S-H. At Q
values just above the volume fractal region (the Guinier region, see Figure 5), a discrete

population of scatterers of this size can be identified [45]. These results are consistent with a C-
S-H outer product structure consisting of colloidal-sized particles that are aggregated into larger
clusters [39]. No evidence for an interlayer structure is observed at these length scales.
At lower Q values, a surface fractal structure can be observed, with calculated scaling
exponents, DS, ranging from about 2.5 to 3.0 [39]. This region can be associated with the
development of surface roughness on the original cement grains as they hydrate [41]. The
transition from surface fractal to volume fractal regions occurs at a Q-value of about 0.2 -1nm. It
is interesting to note, in view of the large differences in the reported surface area values, that
SANS and SAXS studies of cement are in good agreement regarding the fractal nature of the
microstructure.
For saturated cement paste with w/c values in the range of 0.3 - 0.6, reported SANS
surface area values range from 70-147 m2 g-1 [35, 37, 39, 46] while reported SAXS values range
from 210-618 m2 g-1 [44, 47-49]. These values have been renormalized to a basis of grams of dry
paste (see [22]). The SANS values are in reasonable agreement with reported nitrogen gas
sorption values, and show a similar trend with w/c (see Table 4). The SAXS values are 2-6 times
higher than the SANS values, and there is significant variation from study to study. This suggests
that different assumptions were made in the calculation of the scattering invariant, as discussed
earlier. There is also the possibility that SAXS studies probe more of the C-S-H fine structure
than SANS. SAXS studies use a shorter wavelength than SANS studies, and this in principle
allows SAXS to reach higher scattering vectors where scattering from features smaller than (and
within) the 5 nm globules would be seen. The SAXS surface area is observed to decrease
significantly on drying [47-49], which may favor this hypothesis. Determining the appropriate

SAXS scattering contrast for cement (so as to avoid the need to estimate the scattering invariant)
is perhaps the best way to resolve these issues.
One of the major advantages of small-angle scattering is that the same specimen can be
measured repeatedly as it hydrates, allowing the development of the microstructure and surface
area to be monitored during the critical first few days after mixing. Figure 6 shows the surface
area development of a cement paste as measured by SANS [35]. The surface area tracks closely
with the heat evolution until about 18 hours, and then levels off. This indicates that the fine-pore
structure associated with a high surface area develops primarily during the rapid hydration period
(Stage 3 in Figure 1), and that after the paste sets the microstructure is more static, although
hydration continues.
6.11.3.5 NMR relaxation
Nuclear magnetic resonance (NMR) is another advanced technique that is used to study a
wide variety of atomic-scale interactions in materials. The technique is based on the fact that
most atomic nuclei have a non-zero spin state. The rate at which the spins align themselves with
a static magnetic field (spin-lattice NMR), or the response of the material to an oscillating
magnetic field (spin-spin NMR), provides information about atomic interactions with adjacent
nuclei and with the surrounding medium. For materials with a water-filled pore system such as
cement, NMR utilizes the fact that nuclear spin interactions between water and the solid pore
walls are much stronger than interactions in the bulk fluid. The NMR relaxation response of
mobile hydrogen is thus sensitive to the surface to volume ratio of the pore system, and this
allows a surface area value to be inferred. The application of NMR relaxation techniques to
porous media was reviewed by Halperin et al. [50].

The first surface area measurement of cement paste using NMR, done using spin-lattice
relaxation, reported values as high as 900 m2 g-1 for mature cement paste [51]. However, the
approach used to calculate the surface area (based on the BET approach for multilayer
adsorption) was later shown to be inaccurate [52]. Halperin et al. [52, 53] developed a different
approach, deriving an expression for the total surface area accessed by mobile water in a
specimen:
i
S
T
VTS
2
2
λ=
(10)
where λ is the thickness of the layer of mobile surface water, V is the volume of mobile water in
the pore system (the evaporable water content, determined after the experiment), T2S is the
characteristic spin-spin relaxation time for mobile surface water, and T2i is the experimentally
measured spin-spin relaxation time for mobile water in the saturated paste. The parameter T2s is
determined by measuring the change in T2i as the paste is progressively dried.
Using this approach, Halperin et al. [53] observed the development of the surface area
during the hydration of a white cement paste (a low-iron cement quite similar to OPC with w/c =
0.42, using spin-spin relaxation. They found that the surface area increased rapidly between 6
hours and about 48 hours, and that there was essentially no surface area increase between 100
and 1000 hours. This behavior is quite similar to the SANS results shown in Fig. 6. The
maximum surface area was ~280 m2 g-1 of dry paste, a value which falls between the values
reported for SANS and for SAXS.
6.11.3.6 Other techniques
Scanning electron microscopy (SEM) and optical microscopy can be used to identify
pores larger than about 500 nm. SEM provides higher magnifications and the potential to see

smaller pores, but requires drying the specimen and thus altering the fine microstructure. Digital
image analysis can be used to separate porosity from solid phases quantitatively, and
backscattered SEM images have been used [54] to measure total coarse porosity values that,
although lower, correlate well with the capillary porosity. Although microscopy is one of the
most widely used and valuable techniques for studying cement microstructure and morphology,
the inability to characterize the gel pores limits its use as a probe of the pore system.
Another method of studying the coarse porosity is low-temperature calorimetry, which
takes advantage of the depression of the freezing point of water confined in a pore. As the
temperature is lowered below 0°C, ice forms in progressively smaller pores (the higher the
surface to volume ratio the lower the freezing point), and the resulting change in heat capacity
makes it possible to obtain a sort of pore size distribution [55]. Recently, quasi-elastic neutron
scattering (QENS) has also been used to monitor the same effect [56]. QENS measures the
relative amounts of bound and free water in a paste, allowing the fraction of frozen water to be
monitored as a function of temperature.
Impedance spectroscopy (IS) measures the AC electrical response of a material as a
function of frequency. Because the cement pore solution is much more of a conductor than the
solid phases, IS is quite sensitive to the connectivity of the pore system, which is directly related
to the permeability. This, combined with the relative experimental simplicity of IS, makes the
technique potentially of great use both for fundamental studies and as a diagnostic technique.
Christensen et al. [57] reviewed the application of IS to cement paste. The complexity of the IS
data analysis invites analogy to small-angle scattering, but the latter technique has the benefit of
having been widely used on related systems such as clays, and enjoys a more sound theoretical
underpinning. The impedance response of a porous material is affected by a wide variety of

microstructural variables, and some features of the data obtained from cements are not well
understood [6]. Reported IS results, particularly those attempting to produce quantitative values,
have met some resistance in the cement research community due to a perceived lack of
theoretical grounding.
6.11.4 Models of C-S-H
Historically, structural models of C-S-H have been developed in parallel with available
experimental observations, and improvements in analytical techniques have often led to new
models. Early work, beginning with Le Chatelier in 1887 [58], relied exclusively on direct
observation and optical microscopy. These studies noted the gelatinous character of the
hydration product and provided some information about the distribution of unhydrated cement
clinker grains, crystals of calcium hydroxide and other compounds, but no details of the pore
network. Early electron microscopy and X-ray diffraction studies provided little additional
information.
Studies of the pore network were begun in earnest in 1936 by a group led by T.C. Powers
at the Portland Cement Association in the United States. At that time, researchers considered the
cement hydration products as a single, continuous “cement gel” phase that included C-S-H,
calcium hydroxide, and other reaction products. They reasoned that an understanding of the
physical properties of this gel would provide insight into the physical properties of cement paste.
A general principle that has governed the development of most models for the structure of C-S-H
is that macroscopic properties such as volume, strength, hardness, and permeability, and
particularly changes in these properties with relative humidity, depend less on chemical
composition than on the incorporation of water into the porosity.

6.11.4.1 Early Models for the Structure of C-S-H
Several early models for the structure of C-S-H are discussed below; a summary of
prominent aspects of these models are listed in Table 6.
From measurements of the water content and dimensional changes as a function of
relative humidity, Powers and Brownyard [12] modeled the cement gel as a colloid with a
characteristic particle radius of about 5 nm. An important feature of this early model is that the
cement gel contains 28% internal porosity by volume, referred to as gel porosity. This porosity is
the minimum that can be contained in fully reacted cement paste, and any additional porosity is
defined as capillary porosity. For purposes of comparison to later models, it is useful to
recalculate the values obtained by Powers and Brownyard by assigning all of the surface area
and gel porosity to the C-S-H phase alone. Using average conversion factors described elsewhere
[59] for fully reacted pastes, the characteristic radius of the particles is 3.3 nm, and the gel
porosity occupies 42% of the C-S-H volume. These values should be compared to values listed
in Table 7.
In an X-ray diffraction (XRD) pattern from cement paste the only features that can be
attributed to C-S-H gel are a diffuse peak between 0.27 and 0.31 nm and another peak at 1.82
nm, thus underlining the lack of long-range crystallographic order in C-S-H gel. The observed
peaks suggest a structure on the sub-nanometer scale that is related to the lattice spacings in
calcium hydroxide [61]. Using XRD and chemical analysis, Taylor [61] classified C-S-H gels
into two structural types: C-S-H (I), which precipitates from aqueous solutions of soluble salts
such as CaCl2 and NaSiO, and C-S-H (II), which forms from the hydration of C2S and C3S. The
XRD patterns from C-S-H (I) and C-S-H (II) are similar to those of 1.4 nm tobermorite

(~ C5S6H9) and jennite (C9S6H11), respectively, which are naturally occurring calcium silicate
hydrate minerals. The reasons for the differences between C-S-H (I) and (II) are not well
understood. Taylor [62] proposed that C-S-H gel in cement paste has a disordered layer structure,
with individual layers resembling 1.4-nm tobermorite with many imperfections, primarily
missing silicate tetrahedra.
The Taylor model proved useful for explaining the lack of order in the structure of the C-
S-H formed by cement hydration. It also strongly influenced later models of the C-S-H pore
network, which generally incorporated a layered structure. The model became so well accepted
that the literature of the 1950s often referred to C-S-H as the "tobermorite gel". Relatively
recently, based on composition, thermogravimetric, and sorption data, Taylor modified the C-S-
H gel model to incorporate a mixture of imperfect jennite and tobermorite layers [62]. This is
consistent with sub-micrometer variations in the molar ratio of CaO to SiO2 observed by SEM
and TEM [8].
Brunauer [32] used water sorption data to argue that the C-S-H gel consists of sheets two
or three layers thick that, on drying, roll into fibers. This is similar to the "Type I" morphology
observed in the SEM (see Table 1). The concept that a C-S-H gel morphology consisting of
intertwined fibers gives cement paste its high compressive strength and low tensile strength has
been widely explored. Brunauer also advanced the idea that water is removed from C-S-H
interlayers on drying and cannot re-enter these spaces when the paste is resaturated (because of
irreversible collapse), thus providing a explanation for irreversible shrinkage. A controversial
consequence of this theory is that, because of its small molecular size, water vapor, unlike other
larger gas molecules, can enter the smallest pores and thus measures the surface area of cement
paste more accurately than larger gases such as nitrogen.

Feldman and Sereda [33] proposed a different layered structure for C-S-H gel consisting
of highly irregular sheets, sometimes crumpled and sometimes folded. On the basis of changes in
length, weight, and modulus as a function of drying and rewetting, as well as hysteresis in gas
sorption isotherms, they concluded that water could in fact re-enter the C-S-H interlayer space.
Consequently they argued that gas sorption using water vapor gives an incorrectly high surface
area value, and that a different molecule such as nitrogen should be used to characterize cement
paste. An important property of their proposed layered structure is that water can leave and re-
enter the interlayer spaces causing the material to shrink and swell. These issues are also
discussed in Section 6.11.5.2.
Another colloid model was proposed by Wittmann [63]. His basic structure is that of a
xerogel, and dimensional changes on drying are rationalized in terms of water adsorbed on the
surface of the particles. Of greatest importance are the forces between the particles, which are
generally reduced as water adsorbs and moves between touching particles.
6.11.4.2 Quantitative Colloidal Model of C-S-H
One of the authors of this Chapter (HMJ) recently proposed another colloid model [59].
Although similar in many ways to some of the models described above, this new model is more
quantitative than previous models and is designed to be consistent with a wide variety of
experimental measurements. As with the early Powers and Brownyard model [12], this model
proposes roughly equiaxed colloidal particles, but in this case they are packed into one of two
fractal structures that have densities and surface areas that apparently increase as the
measurement technique increases in sensitivity to fine structure. The more open structure is
called "low-density" (LD) C-S-H, and the more tightly packed structure is called "high-density"
(HD) C-S-H. Both the surface and volume fractal dimensions (see Section 6.11.3.4) of the

overall structure are computed to be 2.7; the transition between these two fractal regions occurs
at a length scale of about 20 nm. If the smallest model units are assumed to pack together as
spheres (they may have a layered structure and be more like cubes) for computational purposes,
then the density and specific surface area are related by (for either spheres or cubes):
S = 1ρ r
(11)
where S is the surface area per gram of D-dried C-S-H, ρ is density of D-dried C-S-H and r is
the radius of the smallest units being considered.
The idealized sphere version of LD C-S-H is shown in Figure 7. From this structure the
surface area and porosity that would be measured experimentally can be calculated based on the
smallest unit or grouping of units that can be resolved. As water is added to the structure, pores
in the densest regions that contain the smallest pores are assumed to fill first. This allows the
water content at a given relative humidity to be determined based on the volume of porosity
filled, from which the density can be calculated. Measured and computed values from this
model structure are listed in Table 7.
As shown in Figure 7, the smallest particles, called the basic units, pack into "globules"
that are approximately 5 nm in diameter. These globules then pack into either the LD or HD
morphology, depending in part on when they form during the hydration process. The LD C-S-H
has more of the larger interglobular pores, which can be resolved by techniques such as neutron
scattering and nitrogen sorption. This structure also has some pores that are missed by nitrogen
sorption. The HD C-S-H contains only smaller interglobular pores, down to the smallest, which
can be resolved only by the highest resolution techniques. In an experimental sense, the
interglobular spaces correlate to gel porosity and the intraglobular spaces correlate to interlayer
porosity that can be reversibly re-entered.
Separating the C-S-H gel into two morphologies with different densities is a more
complex proposition than simply allowing the globules (or the basic units) to pack more or less
efficiently depending on age and other local conditions, and accordingly this aspect of the model
is controversial [64, 65]. The simpler scenario of a single kind of C-S-H, with varying packing
density, was explored intensively during the development of the model having two
morphologies; it was found that important experimental observations defied explanation when
the simpler model was used. For example, if the total porosity is taken as that measured by water,
it can be shown that increasing the w/c ratio leads to an increase in nitrogen surface area as well
as an increase in volume of fine porosity that is inaccessible to nitrogen [60, 65]. This counter-
intuitive result is best explained by invoking two types of C-S-H with different densities.
Support for the new colloidal model comes from its ability to explain a wide variety of
experimental data as shown in Table 7. For example, the model is consistent with the wide range
in specific surface area values measured by various techniques (see Section 6.11.3), and with the
kinetics of surface area development as measured by SANS (see Figure 5). It is in agreement
with the fundamental 5 nm particle size measured by SANS and with the volume and surface
fractal regions in cement paste determined by small-angle scattering techniques. It also correctly
predicts the water content and density of the C-S-H gel as a function of relative humidity (see
Table 7).
One of the implications of this model, and of volume fractal structures in general, is that
the measured surface area and porosity depend on the technique used for the measurement. The
concept of surface area as an intrinsic material parameter thus becomes somewhat misleading.
For example, it does not follow that the highest measured surface area is the correct one. It may
be more important to measure the functional relationship between the measured surface area and
the resolution of the applied technique. Important properties of cement paste such as shrinkage
appear to be governed by the structure at the length scale of the globules rather than the smaller
basic units that constitute the globules.
6.11.5 Macroscopic Properties of Concrete
When considering the complexities of the porous structure of hardened cement paste, one
can easily lose sight of the primary function of hardened cement paste, namely to bind sand,
stone and other materials together to form concrete. Since concrete is primarily used as a
structural material, it must satisfy very specific engineering property requirements. For example,
concrete must posses an adequate compressive strength (~ 30 to 40 MPa), a controlled volume
stability under drying conditions and external load, and adequate resistance to aggressive
environmental agents. This section will address the influences of porosity and water on these
properties. In addition, a section on aging phenomena in cement paste will borrow analogies
from colloid and sol-gel science to help explain some of the peculiarities in concrete behavior.
6.11.5.1 Strength of Concrete
Strength is the most basic property of concrete. Simply put, if a concrete structure does
not attain a sufficient compressive strength, the structure can fail when externally loaded. This,
however, rarely occurs in practice, and failure is more closely related to the effects of volume
instability (Section 6.11.5.2), impermeability (Section 6.11.5.3) and physicochemical
deterioration (Section 6.11.6) than to compressive strength. Nevertheless, strength should not be
overlooked since adequate levels of strength can only be obtained by a deliberate control of the
porosity of the hardened cement paste.

6.11.5.1.1 Effect of Porosity on Strength
Porosity is the single most important parameter influencing the strength of a porous body.
Intuitively, one would expect that an increase in the porosity of a material will decrease its
strength due to the fact that pores, filled with air or fluid, cannot sustain load. Hardened cement
paste, being a porous material, behaves according to this expectation. Figure 8 shows the
relationship between capillary porosity and compressive strength for cement pastes; also
contributing to the curve are cement pastes cured by autoclaving (which produces a distinctly
different crystalline hydration product), and a variety of porous aggregates. The fact that all three
classes of materials fall on the same curve reinforces the correlation between porosity and
strength. As also indicated on Figure 8, the capillary porosity range for normal hardened cement
pastes is approximately 25 to 50%; this range roughly correlates to compressive strengths
between 7 to 60 MPa.
6.11.5.1.2 Gel-Space Ratio
The most important variable influencing the porosity of concrete is the original water to
cement ratio (w/c). In Section 6.11.2.5, it was seen that the w/c ratio defines the finite amount of
space available for the hydration products; a low w/c ratio (< ~ 0.38) restricts complete
hydration due to insufficient space for hydration products, whereas a high w/c ratio (> ~0.38)
results in permanent residual spaces called capillary pores. Powers and Brownyard [12, part 6]
utilized this physical space-filling description of cement hydration to formulate their classic
interpretation of strength. According to their theory, strength is directly related to the gel/space
ratio, X, which is the ratio of the volume of the hydration products to the space available for the
hydration products. Numerically, the gel-space ratio is defined as,

X = cw /32.0
68.0
+αα
(12)
where α is the extent of reaction and w/c is the original w/c ratio. Compressive strength, σC, is
related to the gel- space ratio by,
σc = A Xn (13)
where A is a constant (estimated to be ~ 234 MPa for ordinary Portland cement [12, part 6])
representing the intrinsic strength of a hardened cement paste (i.e., the strength at X = 1), and n is
a constant in the range of 2.6 to 3.0 that depends on the characteristics of the cement. According
to this formulation, an increase in the gel-space ratio will increase the strength of the paste, and
therefore that of the concrete.
An important implication of the gel/space theory is that two cement pastes of different
w/c ratios can be at similar extents of reaction (i.e., equal α’s) but with considerably different
compressive strengths. A paste with a w/c ratio of 0.4, for example, requires only 60% hydration
to equal the strength expected from a w/c ratio of 0.6 at 90% hydration.
6.11.5.2 Shrinkage and Creep
Concrete undergoes small, but significant, dimensional changes when exposed to stimuli
such as applied stress and changes in relative humidity or temperature. The deformation response
of the concrete to these various stimuli is complex, often exhibiting reversible, irreversible and
time dependent deformations. The following section discusses two types of deformations,
shrinkage and creep. The former relates to changes in volume associated with the loss of water,
while the latter refers to the time dependent deformation that occurs under an externally applied
constant load.

Shrinkage and creep are clearly interrelated as evidenced by the comparable magnitudes
of deformation, and the similar dependencies on certain variables. Their most important
similarity, however, is the fact that both are dependent on the water content in concrete:
shrinkage cannot occur without loss of water, whereas creep is essentially non-existent without
the presence of water. These simple observations suggest that the two phenomena result from the
same characteristic of the hardened cement paste, namely its porosity.
6.11.5.2.1 Definitions of Shrinkage
The term shrinkage is a general term used to describe the changes in volume
accompanying the loss of water from concrete. Since water can be lost in different ways, there
are different types of shrinkage. Unless stated otherwise, shrinkage is generally taken to mean
drying shrinkage, the deformations associated with the loss of moisture from hardened concrete
by evaporation. Shrinkage that occurs from the loss of water from fresh (or unhardened) concrete
is called plastic shrinkage. Autogenous or chemical shrinkage is a special case in which the
removal of moisture occurs internally from chemical combination of water during hydration in a
sealed curing environment, a process defined as self-desiccation in Section 6.11.2.5. Carbonation
shrinkage is another special case that refers to the reduction in volume accompanying the
chemical reaction between hydrated cement and atmospheric carbon dioxide.
6.11.5.2.2 Drying Shrinkage
Drying shrinkage is generally considered the most important of the shrinkage phenomena
since its debilitating effects can readily occur throughout the lifetime of a concrete structure. If
the dimensional changes associated with drying shrinkage are neglected in design and

construction considerations, significant shrinkage cracking of structural elements can occur,
ultimately leading to a reduction in the functional life of the structure. An understanding of the
causes of drying shrinkage is thus an essential criterion for ensuring concrete durability.
As introduced in Section 6.11.2.4.3, drying shrinkage is a direct manifestation of the
intimate association between C-S-H gel and water that is caused by the colloidal structure of C-
S-H. This association is so significant that the deformation of hardened cement paste (which
dictates that of concrete) depends on the response of both the liquid and solid phases, and
especially the interaction between them. A change in the one phase necessarily induces a change
in the other. As we shall see, in drying shrinkage, for example, a change in the external relative
humidity will induce a response in the liquid phase, which in turn will prompt a counterbalancing
effect in the solid phase to regain equilibrium.
It should be noted that several researchers have shown that the extent of drying shrinkage
in hardened cement pastes can usually be directly related to surface area and porosity as
measured by nitrogen. Although there are some exceptions (most notably, in the cement mixes
containing chemical additions called admixtures), hardened cement pastes with higher nitrogen
surface areas will experience greater shrinkage strains.
6.11.5.2.3 Effect of Relative Humidity on Drying Shrinkage
When the relative humidity is lowered from 100% (saturation), water evaporates from the
pores of hardened cement paste, and the body will shrink (Figure 9). Shrinkage is measured as a
linear deformation, ∆L/L, where ∆L is the change in length from the initial length, L.
Increasingly stringent drying conditions are also noted on Figure 9, beginning at the top with the

saturated state (100% RH), continuing through the range of relative humidities, and ending with
D-drying (defined in Section 6.11.2.4.2) and high temperature heating.
The presence of several distinct linear regions in Figure 9 suggests that several different
mechanisms of drying shrinkage may operate over different ranges in RH. Regions (1) and (2),
which extend from 100% RH to approximately 45% to 50% RH, represent the loss of water from
the capillary pores. Region (3), extending from 45% to approximately 11% RH, is generally
attributed to the loss of adsorbed water on the surface of the C-S-H gel particles. Further drying
results in a loss in interlayer water in region (4). Heating to high temperatures ultimately leads to
the decomposition of C-S-H gel in region (5). Although regions (4) and (5) might represent what
happens when concrete is exposed to fire, they do not reflect normal conditions. Hence, only the
mechanisms involved in regions (1), (2), and (3) will be considered further.
6.11.5.2.4 Mechanisms of Drying Shrinkage
Four mechanisms are generally associated with drying shrinkage: capillary pressure (as
introduced in Section 6.11.2.4.3), disjoining pressure, surface tension, and removal of interlayer
water. A brief review of these phenomena is presented here; details on these particular
mechanisms [1, 68, 69]and related issues concerning the drying of gels (see Chapters 7 and 8 in
Ref. [7], [21]) can be found elsewhere.
A. Capillary Pressure. As predicted from the Kelvin equation, increasingly negative capillary
pressures (i.e., increasing tension) develop in the liquid phase of hardened cement paste when the
relative humidity of the external environment is lowered. To relax the tension in the liquid phase,
the neighboring solid phase, which is essentially the C-S-H gel, goes into compression. This
counterbalancing compressive force causes the C-S-H gel to shrink; depending on the size of the
pores from which evaporation is occurring, capillary pressures can be on the order of tens of

MPa [70]. At this magnitude, the formation of cracks can readily occur in the hardened cement
paste. It is important to note that theoretically capillary pressures cannot exist below about 40 to
45% RH, since below that point, the fracture strength of liquid water (~ 120 MPa [20]) is
exceeded, and liquid/vapor menisci are unstable.
B. Disjoining Pressures. C-S-H gel particles are separated by strongly adsorbed thin films of
water that adopt a repulsive swelling pressure to counteract the attractive van der Waals
interactions between the solid surfaces[71, 72]. During drying, the thickness of adsorbed films
decreases due to a migration of the adsorbed water to neighboring capillary pores, which thus
creates a net shrinkage in the C-S-H gel [71].
C. Surface Tension. A solid C-S-H gel particle, being no more than a micrometer in dimension,
is under compression due to the large curvature of its surface and to its surface tension (a
phenomenon described by the Laplace equation). When water is adsorbed on the surface of such
a particle, the surface tension is relaxed (i.e., decreases) causing a dilatation of the particle that is
directly proportional to the change in surface tension (a relationship described by the Bangham
equation). Alternatively, during drying, the surface tension is intensified and the particle will
contract. These effects of surface tension on dimensional changes become appreciable only for
RH less than ~ 30% [69].
D. Interlayer water. If drying is conducted below 11% RH (the RH at which a monolayer of
water is believed to be stable), interlayer water in the C-S-H gel is lost, creating a concomitant
shrinkage and a potentially irreversible collapse of the structure.
6.11.5.2.5 Irreversible Shrinkage
With the possible exception of shrinkage from loss of interlayer water, the above
mechanisms imply that drying shrinkage is a reversible process (i.e., if rewet, the sample should

return to its original dimensions). Experimental observations, however, show that the total
shrinkage occurring on first drying is largely irreversible. Helmuth and Turk [73] further showed
that irreversibility occurs on first drying only, and that subsequent deformation induced by
additional wetting and drying cycles is reversible. In the same study, it was also shown that it is
only the irreversible part of the total shrinkage that increases with original porosity; the
reversible shrinkage is independent of the original porosity. Together, these findings concerning
irreversible shrinkage suggest that permanent microstructural changes are induced in the
hardened cement paste as a result of first drying, evidence is found in several studies [74-76].
Another peculiarity unique to cement paste is that irreversible shrinkage is strongly
influenced by its drying history. The ultimate total shrinkage will, for example, decrease if the
paste is conditioned at progressively lower RH’s before reaching the lowest RH (i.e., the total
shrinkage of a cement paste dried directly from saturation to 50% RH will be greater than that of
a paste dried in stages from saturation, to 85% RH, to 50% RH). Moreover, it has also been
noted that extended exposure to a constant low RH will tend to progressively increase the
irreversible shrinkage in a cement paste [73].
At present, the exact causes of irreversible shrinkage in hardened cement pastes have not
been determined. As discussed in Section 6.11.5.4, there is evidence [77] that irreversibility
could be due to the formation of additional silicate bonds when the surfaces of C-S-H are
brought closer together by capillary pressures. Irreversible behavior has also been postulated to
be a result of the formation of new interlayer spaces in C-S-H during shrinkage and creep [78].
Recently, technique based on image analysis has revealed large microscopic deformations in the
C-S-H phase during drying from 100% to 40% RH [79]. It was suggested [59, 79] that the
collapse of the C-S-H gel from the associated capillary pressures was analogous to what happens

during the “constant rate period”. (The “constant rate period” denotes the initial stage of drying
where the shrinkage of a gel is equal to the volume of evaporated liquid [21]; the shrinkage can
account for over an order of magnitude reduction in volume in colloidal gels [7].)
6.11.5.2.6 Definitions of Creep
Creep refers to the time dependent deformation of concrete that occurs under an
externally applied constant load. The phenomenon of creep is present in other classes of
materials such as metals and ceramics; however, the process of creep in concrete is unique in the
sense that it readily occurs at ambient temperature, and is considerably affected by the presence
of water. Creep is significant since the strains under a constant stress can be several times larger
than the initial elastic strains on loading, and, if not taken into consideration can lead to
excessive deflection and other serviceability problems. However, creep can be beneficial, and is
in fact essential in relieving stress in anchored concrete structures[16] which are unable to relax
internal stress by shrinkage because of their fixed dimensions.
As with shrinkage, there are several types of creep. Basic creep refers to the creep strains
occurring in a closed environment, where no loss or gain of moisture can take place. If concrete
is allowed to dry and creep simultaneously, the total deformation is not equal to the expected
sum of the drying shrinkage strains (εsh) and the basic creep strains (εbc), but is, in fact, greater
by an amount denoted as drying creep (a phenomenon also called the Pickett effect [80]). Total
creep strain (εc) is the sum of the basic creep strains (εbc) and the drying creep strains (εdc). It
should also be noted that all creep strains are taken as the excess strain above the initial elastic
strain (εi), which is often significantly smaller than the creep strains. A summary of the
relationships between the strains defined above is represented in Figure 10 and summarized as,

εc = εbc + εdc = εtot - εsh - εi (14)
where εtot represents the total time-dependent strain.
Also, as with drying shrinkage, creep is a mostly an irreversible process. When a concrete
specimen is unloaded, there is an instantaneous recovery of the small initial elastic strain
followed by a gradual, but very incomplete, recovery of the creep strain.
6.11.5.2.7 Effect of Water Content on Creep
Creep is directly related to the water content in the pores of hardened cement paste. When
there is no evaporable water prior to creep testing, little, if any, creep is observed (Figure 11)
[82, 83]. The relative humidity is also a significant factor since, as mentioned earlier, the effects
of drying shrinkage and creep symbiotically produce additional drying creep strains, which can
be quite significant (Figure 12).
6.11.5.2.8 Other Effects on Creep
In addition to the dramatic effects of moisture content on creep, there are numerous other
variables that are also significant [1, 16, 85]. The following is a short list:
A. Applied Stress. Creep increases approximately linearly with the applied stress up to a
stress/strength ratio between 0.4 and 0.6. For comparative purposes, specific creep (creep strain
per unit stress) is a useful unit for tests in this range.
B. Strength/Age. Generally the lower the w/c ratio and the older the concrete specimen, the lower
the creep strains.
C. Temperature. Concrete creep increases linearly with temperature up to at least 80ºC; beyond
that, there is uncertainty as to whether creep strains peak at a maximum or the linear relation
persists [1].

D. Aggregate. Since aggregates are dimensionally stable (i.e., they do not creep or shrink by
appreciable amounts), aggregates in concrete act as restraining phases to the hardened cement
paste, which has been shown to be highly susceptible to the dimensional changes of creep and
shrinkage. Hence, a greater volume of aggregates will reduce the ultimate creep and shrinkage.
Moreover, at a fixed volume fraction of aggregates, concrete will exhibit lower creep with
aggregates of higher elastic moduli.
6.11.5.3 Permeability
Permeability is a highly significant property of concrete since most of the chemical and
physical processes that are responsible for the degradation of the material (to be described in
Section 6.11.6) are dependent on the ingress of external sources of water or ionic species or both.
Naturally, the intrinsic pores of hardened cement paste, namely capillary pores and gel pores,
control the permeability of concrete. Additional pores of concrete such as the interfacial
transition zone (ITZ) that separates the aggregate and hardened cement paste phases, and cracks
or microcracks that result from chemical of physical stresses also contribute to the permeability
of concrete.
The following sections briefly review the effects of the above-mentioned pores on the
permeability of concrete. Also, a summary of the relevant transport processes of matter through
these porous networks will be given.
6.11.5.3.1 Effect of Capillary and Gel Pores on Permeability
The capillary pores predominantly control the permeability of hardened cement paste.
Immediately after mixing Portland cement with water, the capillary pores (which initially
constitute the space between cement grains) form a continuous (or percolating) network of pores,

which corresponds to a high permeability in the hardened cement paste. As hydration products
(mostly porous C-S-H gel) fill space, the capillary pores become increasingly smaller until
eventually they are segmented (or made discontinuous) by the intrusion of hydration products.
During this process, the permeability decreases by several orders of magnitude; in one study [86]
the permeability of a hardened cement paste decreased by 6 orders of magnitude after 28 days of
hydration. The above description accounts for the converse observation that the permeability of
cement paste increases exponentially with capillary porosity and depends primarily on the water
to cement ratio and age [12].
Even when the capillary pores become discontinuous, or are perhaps eliminated by being
completely filled with hydration products, there is a considerable amount of remaining porosity
in hardened cement paste, which is typically around 30%. Most of this porosity consists of gel
pores in the colloidal C-S-H. These small gel pores (of approximately 10nm or less in
dimension), residing in the finely divided colloidal structure of C-S-H are responsible for the
especially low permeability of mature hardened cement paste compared to other materials with
similar porosity. In fact, the flow of liquid in gel pores is so restricted that the permeability of a
30% porous mature hardened cement paste (typically in the range of 10-13 to 10-11 cm s-1 [31]) is
comparable to that of many natural rocks, which possess porosities in the range of 0.5 to 2% [31,
86, 87].
6.11.5.3.2 Effect of Other Types of Pores on Permeability
Measuring the contributions of capillary and gel pores to the permeability of concrete is
difficult since they are obscured by the influences of other pores in concrete such as interfacial
transition zones and cracks, which are described below.

A. The Interfacial Transition Zone (ITZ). The presence of aggregates in concrete introduces
significant changes in the pore structure of hardened cement paste. The most important change is
the formation of additional porous regions of hardened cement paste around aggregates. These
porous zones, designated as interfacial transition zones (ITZs), are characterized by
fundamentally different microstructures than is are found in the bulk hardened cement paste [6,
88-90]. The primary characteristics of the 25-50 µm wide ITZ include a higher porosity than
observed in bulk hardened cement paste and also the presence of coarse grains of CH and
ettringite. In detail, the ITZ displays both mineralogic and textural zoning [88, 91, 92]. De Rooij
[92, 93] critically reviewed several models that offer explanations for the characteristics of ITZ,
and suggested that syneresis effects could, together with the wall effect (i.e., the inability of
hydration products to pack densely near an aggregate surface), account for the width of the ITZ.
Since the ITZ can contribute a significant additional porosity to hardened cement paste, it has an
important influence on properties such as strength and permeability. Concerning the latter,
computer simulation has shown [94] that, at sufficiently high aggregate concentrations, the ITZs
in concrete can form a continuous network of ITZ porosity (i.e., a percolation path). As with
capillary pores in hardened cement paste, this percolation path can dramatically increase the
permeability of concrete.
B. Cracks and Microcracks. Cracks or microcracks result from a multitude of different physical
and chemical processes, such as mechanical loading, shrinkage, creep, thermal variations, and
expansive chemical reactions. To some extent, almost all cementitious materials are affected by
each of these processes to varying extents at different points in time, and consequently, cracks
are endemic to the material. As with the ITZ, cracks constitute important features in the
microstructure of since they introduce additional porosity in the hardened cement paste phase.

When these cracks coalesce they can form interconnected porous channels that dramatically
increase the permeability of concrete, which, however, is seen only when the width of the
microcracks exceeds approximately 200 µm [95, 96]; when the widths are below approximately
50 µm [95], there is little gain in permeability.
6.11.5.3.3 Transport Processes
The transport processes relevant to hardened cement paste and concrete are summarized
in Table 8 and discussed briefly below; for more information, one should consult the review by
Kropp [100]. Permeation, defined by Darcy’s Law (see Table 8), involves the flow of liquids or
gases under a gradient in pressure. Diffusion, defined by Fick’s Laws (see Table 8), is
characterized by the random motion of ions or molecules from areas of high concentration
toward areas of low concentration. Capillary suction involves transport due to the surface tension
of the water in the capillary pores and can be expressed by a modification of Darcy’s Law for
unsaturated flow. Adsorption and desorption of vapor are important for the transport of gaseous
species such as atmospheric carbon dioxide and water vapor. Migration refers to the movement
of ions driven by an electrical field.
6.11.5.4 Aging Processes in Cement Paste
Aging of a gel can be defined as the changes in the structure and properties that occur under
ambient or hydrothermal conditions. For cements, aging should be further defined as changes over time
that are unrelated to the hydration reactions. Aging of cement primarily involves chemical changes in
the C-S-H gel, and these changes also affect the pore size distribution, so aging affects all the properties
of cement paste to some extent. This section is predicated on the assumption that cement paste behaves
in many important ways as if it were a colloid gel.

Recognition of the colloidal and gel-like properties of cement paste dates back to at least the
1950s. However, during the intervening half-century of research the colloidal properties of the C-S-H
gel were often ignored in favor of alternate structural interpretations based on layered calcium silicate
minerals (see Section 6.11.4). Since the 1980s there has been significant growth in the field of
processing inorganic sol-gel, and this has led to an increased understanding of the fundamental
properties of inorganic gels and colloids [7]. At the same time, experimental observations from
techniques such as small-angle scattering have provided new evidence for a colloidal structure in cement
paste (see Section 6.11.3.3). Consequently, there is at present renewed interest in the colloidal nature of
cement paste.
As a background for a discussion of aging in cement paste, a brief review of the silica sol-gel
process is useful (see ref. [7] for more details). A solution of colloidal silica particles (the sol) is
transformed into a gel via the bonding of individual particles into clusters. The basic reaction driving
this process is called condensation, which for silicates can be written as
-Si-OH + HO-Si- → -Si-O-Si- + H2O (15)
If the condensation process is irreversible, as it is here, the clusters will grow into diffuse fractal
structures that occupy more and more of the sol until they link together and fill the space completely,
thereby reaching the "gel point" with the liquid phase completely trapped within the solid phase. The
setting of cement paste, which is caused by individual cement grains growing together, is analogous (but
not identical) to the gelling of a sol [70]. If the reaction conditions are such that condensation is highly
reversible (i.e. only a fraction of collisions permanently stick), the polymeric clusters will restructure
and reorganize themselves as they grow, creating dense particles rather than a space-filling colloidal
solid.

Intermediate between these cases are those involving moderately reversible reactions that can
lead to highly cross-linked clusters that grow in size and density until they settle out of the suspension.
These precipitates are gel-like in nature, in that their internal structure contains colloidal-sized regions of
liquid and solid, but they are too dense to fill the entire space and so the overall system does not become
a true gel. According to Scherer [70], the C-S-H gel phase of cements can be classified as a colloidal
precipitate of this nature. The presence of capillary porosity in cement pastes is good evidence of this, as
it represents the volume fraction of sol that was not filled by the precipitated clusters.
For the silica sol-gel process, the condensation reaction that drives the sol-gel transition can
continue long after gelation, causing a continued increase in the polymerization of the silicate network.
This is the root cause of the multiple effects known collectively as aging. The most significant result of
aging is generally an increase in the strength and stiffness of the gel. Condensation, and thus aging, is
accelerated at higher temperatures. Aging can be considered to be a continued interaction between the
solid phase and the pore liquid, and aging processes generally do not occur when the pore liquid is
removed.
In a fractal space-filling gel, condensation reactions can bind together adjacent branches of the
silicate network after the gel point, thereby bringing them closer together. As a result, the solid network
shrinks uniformly and expels the pore fluid, a process known as syneresis. Under certain conditions
syneresis can cause the volume of a gel to decrease by more than half, without changing its original
shape. More commonly, inorganic gels shrink by 5-10% over the course of a few months [7].
Because cement paste contains significant amounts of non-gel phases, it might be expected that
the solid network as a whole would not contract and syneresis would not be observed. In fact, syneresis
has recently been observed in thin sections of paste [92], but only during the first few hours of hydration
when the paste is plastic. After set, macroscopic shrinkage of cement paste via syneresis does not occur.

However, it is possible that syneresis is related to "bleeding" of higher w/c cement pastes (separation of
some water at the surface shortly after mixing) and to the formation of a porous interfacial transition
zone between paste and aggregate in concrete [92]. These issues deserve further research.
Aging in cement paste can be quantified in a chemical sense by measuring the degree of
polymerization of the silicates. Results (see Taylor [6] for a fuller summary) have shown that there is a
progressive increase in polymerization with hydration time, and that this process is accelerated by an
increase in temperature. Under ambient conditions the silicate dimer dominates at early times, but is
slowly replaced with polymeric species such as pentamer in a process that continues for decades -- long
after hydration of the cement minerals has stopped. However, at higher hydration temperatures the
increase in polymerization is much more rapid, and polymeric species with more then 100 silicate ions
can form. Aging processes in cement are thus most easily monitored by comparing pastes hydrated at
different temperatures. It should be noted that heating a hardened cement paste for a short period of time
after hydrating at normal temperatures increases the amount of silicate polymerization and causes many
of the macroscopic effects associated with high temperature curing (e.g. Refs. [101-103]). This
underlines the fact that aging phenomena in cements occur independently of the hydration reaction.
Hydration of cement at higher temperatures is known to coarsen the pore structure. While the
total amount of porosity is unaffected, paste hydrated at 65°C was found to have a larger capillary pore
volume and correspondingly smaller volumes of mesopores (3-30 nm) and micropores (<3 nm) than
paste hydrated at 25°C to the same degree of reaction [104]. The surface area is correspondingly
lowered by high temperature curing [103, 105]. SEM studies have shown that the hydration product is
denser after high temperature curing [106], and that the paste-aggregate interface in concrete is more
porous [107]. All these physical changes can be related to aging: the density of the C-S-H gel phase is

increased at higher temperatures due to an increased rate of condensation within the precipitated
particles.
Because diffusion of reactants through this denser C-S-H product layer is more difficult, the
ultimate degree of hydration is usually lower at higher temperatures. This, along with the increase in the
capillary porosity of the hardened cement paste, causes the permeability of the paste to be higher. For
this reason, concrete placed and cured in hot weather often exhibits subsequent durability problems
[107]. The increased capillary porosity associated with a higher hydration temperature also causes the
ultimate strength of concrete to be lower, even though the early strength develops more rapidly due to
accelerated hydration. In this case, the analogy between cement paste and pure gels breaks down: while
the strength of a pure gel is determined by the degree of crosslinking of the solid network, hardened
cement paste behaves like a brittle ceramic material with the strength controlled primarily by the size of
the largest pores, namely the capillary pores. However, since the C-S-H phase alone does not contain
large capillary pores, C-S-H is expected to behave more like a gel and experience an increase in strength
with heat treatment. Thus hardened cement paste has properties that come from both the gel properties
of C-S-H and the large pores (as well as other restraining phases).
Another important result of aging is a reduction in drying shrinkage. Aging causes the C-S-H
phase (and the paste itself) to become stiffer, thus reducing the amount of shrinkage that occurs for a
given degree of capillary tension. Thus it is observed that older pastes and pastes hydrated at higher
temperatures shrink less on drying [1].
As discussed in Section 6.11.5.2.5, the phenomenon of irreversible shrinkage is puzzling from a
purely physical point of view because all of the mechanisms of drying shrinkage are intrinsically
reversible. We can look to the known behavior of inorganic gels for an answer [7]. As a gel dries and
shrinks, the solid phase is compressed. This brings adjacent areas of the silicate network into closer

contact, giving them the opportunity to bond together via condensation. This reaction is not reversible,
so on resaturation the gel does not return to its original dimensions. There is significant evidence that
this is also the cause of irreversible shrinkage in cement paste. Younger cement pastes exhibit more
irreversible shrinkage than do older pastes, and pastes hydrated at higher temperatures also have less
irreversible shrinkage [1]. Clearly, if a paste has a high degree of silicate polymerization before drying
then little or no further bonding is likely to occur during drying. For younger pastes, the degree of
polymerization of the silicate is observed to increase significantly after drying and rewetting [77], so
there is a direct relationship between aging and irreversible shrinkage. It can thus be concluded that the
drying process itself causes aging of cement paste. This also provides a good explanation for the
otherwise puzzling observation that pastes that are dried and resaturated twice develop much less
irreversible shrinkage during the second cycle.
6.11.6 Durability of Concrete
As attested by the survival of ancient concrete structures such as the Roman Pantheon
and Coliseum, concrete can be a remarkably durable material. However, it is certainly not
invulnerable. Under certain conditions or exposures to certain chemical species, concrete will
degrade, thereby leading to a premature termination of its functional life. As mentioned in
Section 6.11.5.3, most of the chemical and physical processes that degrade concrete (see reviews
[6, 108-113]) occur because water or other chemical agents have permeated the porous network
of concrete. The debilitating changes in the microstructure of concrete that result from the
interactions between these chemical species and the internal constituents of concrete (particularly
hardened cement paste) will be discussed in the following sections.
The most important kinds of deterioration of concrete are freeze-thaw damage, leaching,
alkali-aggregate reaction, sulfate attack, carbonation, chloride penetration, and acid attack. As

will be discussed in ensuing sections, the interactions between concrete and the aggressive agents
can be distinguished by the accompanying volume changes of solids that generally increase the
porosity. Some interactions, for example, will involve the precipitation of additional products in
the pore space of concrete. If conditions allow for significant formation of these products,
expansive pressures can develop in the pores of hardened cement paste, leading to cracks and
associated increases in porosity and permeability. On the other hand, interactions between
aggressive agents and concrete can lead to the dissolution of cementitious phases such as CH and
C-S-H. This leaves behind additional porosity in the hardened cement paste, which leads to
increases in permeability and reductions in strength of concrete.
6.11.6.1 Freeze-Thaw Damage
The freezing and thawing of water in the pores of concrete is one of the principle
degradation mechanisms in cold climates [114-118]. While there are several ways freeze-thaw
damage can occur, the most damaging mechanism is believed to be the generation of hydraulic
pressures in the liquid phase. Hydraulic pressures originate from the approximate 9% increase in
volume associated with the transformation of water into ice; this expansive transformation causes
water to be pushed away from a growing ice crystal, thereby causing a pressure gradient in the
pore liquid. This hydraulic pressure can only be relieved if the displaced water can escape to
empty pores or spaces within concrete. If the distance traveled by the displaced water before
reaching an empty pore is large, hydraulic pressures in the liquid phase can reach sufficient
magnitude to cause fracture of the hardened cement paste. To counter this, a sufficient
concentration of air-voids (mentioned in Section 6.11.2.4.1) is intentionally introduced in
concrete mixes to minimize the distance that displaced water must travel before reaching an
empty space into which it can escape. Laboratory and field studies show a dramatic improvement

in the resistance to freeze-thaw damage when the spacing between air-voids is below a critical
threshold value, which is generally found to be as approximately 200 to 250 µm [117].
6.11.6.2 Leaching
Leaching of concrete occurs when soft waters (i.e., sources of water such as rainwater
that have low concentrations of dissolved salts) continuously percolate through or flow around
concrete structures such as dams or pipes. Leaching is also of particular concern for concrete
structures designed for the long-term storage of nuclear waste. The basic mechanism involves the
removal of alkali hydroxide from the pore solution of concrete and the loss of calcium from
hydration products of hardened cement paste. The leaching of calcium from these hydration
products is achieved by sequential dissolution of CH, monosulfate, and ettringite, followed by
progressive dissolution of C-S-H [119]. Further damage results from the increases in porosity
and permeability associated with the dissolution [120].
6.11.6.3 Alkali-Aggregate Reaction
Alkali-aggregate reaction (AAR) [6, 110, 111] refers to a set of chemical reactions
between reactive components in the rock aggregates used to manufacture concrete and alkali
hydroxides that are usually derived from the minor oxide components of Portland cement, but
may come from external sources as well. The reaction produces a highly mobile gel of indefinite
chemical composition, which generates expansive pressures when it imbibes water and migrates
through the pore network. AAR increases porosity and permeability via the production of cracks,
which originate from the migration of the gel through the pore network. Mitigation of AAR
requires elimination of reactive aggregates and control of the alkali content and permeability of
the concrete.

6.11.6.4 Sulfate Attack
Sulfate attack, the reaction of sulfate ions with cementitious phases, is perhaps the most
widespread and common form of chemical attack on concrete [1]. It can involve the infiltration
of sulfate-bearing aqueous solutions (external sulfate attack) or reaction with sulfates derived
from the original components of the cement or aggregates constituting the concrete (internal
sulfate attack and delayed ettringite formation (DEF) [6, 109]). The alteration of the pore
network includes an increase in crack porosity associated with the expansive reactions that
produce ettringite and gypsum. Further alterations include an increased porosity and loss of
cohesion via leaching of calcium from CH and C-S-H and leaching of silica from C-S-H [6,
109]. Strategies for mitigating external sulfate attack include physically reducing the
permeability of concrete (by installing protective membranes or barriers) and limiting the
concentration of aluminate phases in Portland cement (which are necessary for the formation
additional ettringite and gypsum when sulfate is introduced to concrete). Mitigation of DEF
requires sound understanding of the interrelationships between cement chemistry, aggregate
chemistry, and curing and manufacturing practices.
6.11.6.5 Carbonation
Carbonation occurs on the surfaces of all Portland cement-based materials that are
exposed to the atmosphere. The process involves the reaction of CO2 with CH to produce
calcium carbonate. The most significant result of this reaction is the consumption of CH and
subsequent lowering of the pH of pore solution from its equilibrium value of 12 or 12.5.
Reductions of the pore solution pH below 11.0 destroys the passive iron oxide layer that
surrounds steel reinforcements, facilitating corrosion. The corrosion products are expansive gels
that imbibe water, swell, and create fracture porosity. However, the precipitation of calcium

carbonate can also decrease porosity and enhance the performance of the material, provided
corrosion does not occur [6, 121]. Mitigation of damage relating to carbonation requires the use
of low-permeability concrete and thick cover zones (i.e., the outer layer of concrete between the
exterior surface and the steel reinforcement).
6.11.6.6 Chloride
The most detrimental consequence of chloride penetration into concrete involves the
corrosion of reinforcing steel. It is one of the most significant durability problems throughout the
world, ranging from marine environments in the tropics to parking garages in colder climates
[108]. The presence of chloride ions destroys the passive oxide layer that surrounds steel,
facilitating corrosion and the formation of the expansive corrosion products. Sources of chloride
include contamination in the aggregates, calcium chloride added as a hydration accelerator,
saline waters and soils in arid regions, and de-icing salts. Mitigation of corrosion relating to
chloride penetration requires the use of low-permeability concrete and thick cover zones.
6.11.6.7 Acid Attack
Concrete is not durable when exposed to acidic solutions and decomposes rapidly when
exposed to solutions with pH of less than 4.0 [109]. The general reactions are similar to those
involved in leaching by water except they proceed much more rapidly. CH dissolves congruently
while C-S-H and hydrated aluminates dissolve incongruently to produce Ca2+ ions and silica and
alumina gels. Mitigation requires the installation of protective membranes or barriers on the
surface of concrete structures.

6.11.7 Summary
Although concrete is one of the most essential materials of modern civilization, it is
arguably the most under-appreciated and misunderstood man-made material in existence. This
review has described the complexities of hardened cement paste, from its intricate porous
network, to its colloidal nature, and to its debilitating interactions with the environment.
Characterization of the pore structure is particularly challenging since C-S-H gel, the dominant
phase in hardened cement paste, is a constantly evolving phase that is quite susceptible to
changes in relative humidity, stress, temperature and other variables. Not surprisingly, this
inherent difficulty in analyzing C-S-H has lead to several different models of its pore structure.
However, a current assessment of data from pyknometry, water vapor and nitrogen sorption, and
neutron and X-ray scattering leads to the conclusion that C-S-H is best described as a colloidal
precipitate. This is supported by numerous similarities between the properties of C-S-H and other
colloidal gels. With a renewed interest in the colloidal nature of C-S-H, cement science has been
returned to its early roots incorporated in the works of Powers [12]. It is hoped that a further
understanding of the colloidal nature of C-S-H can assist in resolving the fundamental questions
that still persist in cement science.

6.11.8 Appendix: Glossary of Terms Relevant to Cement Science.
Aggregate: granular material usually derived from natural rock, crushed stone, or sand.Hardened cement paste binds fine aggregate (sand) to form mortar and coarse (rock and crushedstone) aggregate to form concrete.
Aqueous phase: the aqueous solution found in the pores of hardened cement paste that issaturated with various ions and has a pH of at least 12.5. All evaporable water (i.e., capillaryand gel water) in hardened cement paste can be referred to as an aqueous phase. The aqueousphase of hardened cement paste is equivalent to its pore solution.
Calcium hydroxide (CH): the most abundant crystalline phase in hardened cement paste; thepresence of CH buffers the pore solution to a pH of at least 12.5.
Capillary pores: in fresh cement paste, the space occupied by the water that separates cementgrains; in hardened cement paste, the residual space between cement grains that is not filled withhydration product.
Capillary water: the aqueous phase in capillary pores.
Cement: a generic term for a material that is used to bind particulate matter together; usuallysynonymous with Portland cement.
Chemically bound water: water in the interlayer spaces of C-S-H that is bound by molecularbonds.
Colloid: a system in which a dispersed phase, with characteristic dimensions betweenapproximately 1 to 1000 nm, is immersed in another phase. The small size of the dispersed phasecreates a significant interfacial surface area between the two phases. Consequently, interfacialeffects (i.e., surface tension) significantly influence the properties of a colloidal system. C-S-Hcan be considered a colloid since its solid gel phase, which is believed to be composed ofparticles of approximately 5 nm, is dispersed in an aqueous phase.
Concrete: a composite of fine aggregate (sand), coarse aggregate (rock, crushed stone), andusually steel reinforcement, that is held together by a matrix of hardened cement paste.
C-S-H (or C-S-H gel): a nearly amorphous calcium silicate hydrate that is the main hydrationproduct of Portland cement. An average chemical formula for water-saturated C-S-H inhardened cement paste is 1.7 CaO•SiO2•4.0 H2O. (Note that the dashes in the term “C-S-H”reflect the fact that the composition can slightly diverge from its average value.) At themolecular scale, C-S-H has a disordered layer structure. At the colloidal scale, C-S-H is a porousgel that is characterized by its high specific surface area (approximately several hundreds ofsquare meters per gram) and its intimate interactions with water. Compared with other hydrationproducts, C-S-H has the dominant influence on the properties of concrete such as strength,dimension stability, and permeability.

Curing: process for promoting the hydration of Portland cement. Portland cement systems arenormally cured at ambient conditions, and, ideally, under water. For concrete structures in thefield, curing is a deliberate process of maintaining moist surface conditions during the firstseveral days of hydration.
D-Dry method: standard drying condition that involves vacuum drying at the equilibrium vaporpressure of water (~6.7 x 10⁻² Pa) at the temperature of dry ice (T = 194K). This procedure isoften approximated by oven drying at 105°C.
Drying shrinkage: the deformations associated with the loss of water from hardened cementpaste by evaporation. The deformations can lead to cracking and other deleterious effects onconcrete.
Evaporable water: aqueous phase that is removed by a standard drying condition, which isusually D-Drying or oven drying at 105°C.
Fresh cement paste: fluid mixture of Portland cement and water before hardening occurs.
Gel pores: the pores that constitute the internal porosity of C-S-H.
Gel water: the aqueous phase in gel pores.
Hardened cement paste (or cement paste or hcp): the porous solid that is produced from thehydration of Portland cement and is typically used to bind aggregates in concrete and mortar.Hardened cement paste (HCP) is composed of hydration products, unhydrated cement, andpores.
Hydration: the complex set of chemical and physical changes that occurs when Portland cementis mixed with water.
Hydration products: the reaction products produced from the hydration of Portland cement.Hydration products include C-S-H, CH, and calcium sulfoaluminate phases such as ettringite andmonosulfate.
Interfacial transition zone (ITZ): the 25 to 50 µm wide porous regions of hardened cementpaste surrounding an aggregate in concrete or mortar.
Interlayer spaces: the molecular sized spaces in the layered structure of C-S-H where chemicallybound water resides.
Mortar: composite of fine aggregate (sand) in a matrix of hardened cement paste.
Non-evaporable water: water that is not removed from a standard drying condition, which isusually D-Drying or oven drying at 105°C. The amount of non-evaporable water in a hardenedcement paste is a useful empirical measure of the extent of hydration.
Ordinary Portland cement (OPC): the most common variety of Portland cement that is used ingeneral building applications; equivalent to the ASTM Type I Portland cement that is specifiedin American standards or the CEM Type I 42.5 Portland cement that is specified in Europeanstandards.
Oven drying: drying at 105°C at atmospheric pressure; a convenient approximation to the D-drying procedure.
Pore solution: the aqueous solution found in the pores of hardened cement paste that is saturatedwith various ions and has a pH of at least 12.5. The pore solution of hardened cement paste isequivalent to its aqueous phase.
Portland cement: a powder with definite proportions of various minerals (predominantly,calcium silicates and calcium aluminates) that react with water to produce hardened cementpaste.
Unhydrated cement: unreacted Portland cement in hardened cement paste.
Water to cement ratio (w/c): the ratio of the mass of mixing water to the mass of Portlandcement.
6.11.9 References
1. S. Mindess and J.F. Young, Concrete, Prentice-Hall, Englewood Cliffs, NJ, 1981, 671 pp.2. R.H. Bogue, The Chemistry of Portland Cement, Reinhold Publishing Corporation, New
York, 1947, 572 pp.3. G. Lewis, J. Biomed. Mater. Res., 1997, 38, 155-182.4. E.P. Frankenburg, S.A. Goldstein, T.W. Bauer, S.A. Harris, and R.D. Poser, J. Bone.
Joint. Surg. Am., 1998, 80A, 1112-1124.5. J.P. Schmitz, J.O. Hollinger, and S.B. Milam, J. Oral. Maxil. Surg., 1999, 57, 1122-1126.6. H.F.W. Taylor, Cement Chemistry, 2nd ed., Thomas Telford, London, 1997, 459 pp.7. C.J. Brinker and G.W. Scherer, Sol-Gel Science, Academic Press, NY, 1990, 908 pp.8. I.G. Richardson and G.W. Groves, J. Mater. Sci., 1993, 28, 265-277.9. H.W.F. Taylor, P. Barret, P.W. Brown, D.D. Double, G. Frohnsdorff, F.L. Johansen, D.
Menetrier, I. Odler, L.J. Parrott, J.M. Pommersheim, M. Regourd, and J.F. Young, Mater.Constr., 1984, 17, 457-469.
10. S. Diamond, in Hydraulic Cement Pastes: Their Structure and Properties, Cement PasteMicrostructure - An Overview at Several Levels, Cement and Concrete Association, UK,1976, p. 2-30.
11. H.M. Jennings, B.J. Dangleish, and P.L. Pratt, J. Am. Ceram. Soc., 1981, 64, 567-572.12. T.C. Powers and T.L. Brownyard, Proc. Am. Concrete Inst., 1947, 41, part 1: 101-132,
part 2: 249-336, part 3: 469-504, part 4: 549-602, part 5: 669-712, part 6: 845-880, part 7:933-992; reprinted as PCA Bulletin, 1948, 22, with original pagination.

13. T.C. Powers, L.E. Copeland, and H.M. Mann, PCA Bulletin, 1959, 110, 2-12.
14. D.P. Bentz and E.J. Garboczi, Cem. Concr. Res., 1991, 21, 325-344.15. E. Garboczi, An Electronic Monograph: Modeling and Measuring the Structure and
Properties of Cement-Based Materials, http://ciks.cbt.nist.gov/garboczi/, NationalInstitute of Standards and Technology, 2000.
16. A.M. Neville, Properties of Concrete, 4th ed., Wiley & Sons, New York, 1996, 844 pp.17. L.E. Copeland and J.C. Hayes, ASTM Bull., 1953, 194, 70-74.18. J.N. Israelachvili, Chem. Scr., 1985, 25, 7-14.19. D. Myers, Surface, Interfaces, and Colloids, 2nd ed., Wiley-VCH, New York, 1999, 501
pp.20. T.C. Powers, in Fourth International Symposium on the Chemistry of Cement, 1960,
Washington, D. C., National Bureau of Standards, Physical Properties of Cement Paste,p. 577-609.
21. G.W. Scherer, J. Am. Ceram. Soc., 1990, 73, 3-14.22. J.J. Thomas, H.M. Jennings, and A.J. Allen, Concrete Science and Engineering, 1999, 1,
45-64.23. R.F. Feldman, Cem. Concr. Res., 1972, 2, 123-136.24. R.L. Day and B.K. March, Cem. Concr. Res., 1988, 18, 63-73.25. E.J. Garboczi and D.P. Bentz, in Advances in Cementitious Materials - Ceramic
Transactions, S. Mindess, Ed., Digitized Simulation of Mercury Intrusion Porosimetry,16, American Ceramic Society, Westerville, OH, 1991, p. 365-380.
26. D.N. Winslow and D. Lui, Cem. Concr. Res., 1990, 20, 227-235.27. S.J. Gregg and K.S.W. Sing, Adsorption, Surface Area and Porosity (2nd Ed.), Academic
Press, New York, 1982, 303 pp.28. R. Rarick, J. Bhatty, and H.M. Jennings, in Materials Science of Concrete Iv, J. Skalny
and S. Mindess, Eds., Surface Area Measurement Using Gas Sorption: Applications toCement Paste, The American Ceramic Society, Westerville, OH, 1995, p. 1-39.
29. S. Brunauer, L.S. Deming, W.S. Deming, and E. Teller, J. Am. Chem. Soc., 1940, 62,723.
30. E.P. Barrett, L.G. Joyner, and P.H. Hallenda, J. Am. Chem. Soc., 1951, 73, 373-380.31. T.C. Powers, PCA Bulletin, 1958, 90, 1-26.32. S. Brunauer, Am. Sci., 1962, 50, 210-229.33. R.F. Feldman and P.J. Sereda, Eng. J. Can., 1970, 53, 53-59.34. R.S. Mikhail and S.A. Selim, in Symposium of Structure of Portland Cement and
Concrete, Adsorption of Organic Vapors in Relation to Pore Structure of HardenedPortland Cement Paste, Highway Research Board Special Report 98,1966, p. 123-134.
35. J.J. Thomas, H.M. Jennings, and A.J. Allen, Cem. Concr. Res., 1998, 28, 897-905.36. C.M. Hunt, in Symposium on Structure of Portland Cement Paste and Concrete, 1966,
Washington, D.C., Nitrogen Sorption Measurements and Surface Areas of HardenedCement Pastes, p. 113-122.
37. A.J. Allen, J. Appl. Cryst., 1991, 25, 624-634.38. A.J. Allen, A.H. Baston, and C.R. Wilding, Mat. Res. Soc. Symp. Proc, 1989, 137, 119-
125.

39. A.J. Allen, R.C. Oberthur, D. Pearson, P. Schofield, and C.R. Wilding, Phil. Mag. B,1987, 56, 263-268.
40. J.J. Thomas, H.M. Jennings, and A.J. Allen, Advn. Cem. Based. Mat, 1998, 7, 119-122.41. A.J. Allen and R.A. Livingston, Advn. Cem. Based. Mat, 1998, 8, 118-131.
42. D.N. Winslow, Cem. Concr. Res., 1985, 15, 817-824.43. M. Kriechbaum, G. Degovies, J. Tritthart, and P. Laggner, Prog. Colloid Polym. Sci,
1989, 101-105.44. D.N. Winslow, J.M. Bukowski, and J.F. Young, Cem. Concr. Res., 1994, 24, 1025-1032.45. D. Pearson and A.J. Allen, J. Mater. Sci., 1985, 20, 303-315.46. A.J. Allen, unpublished data.47. R.E. Beddoe and K. Lang, Cem. Concr. Res., 1994, 24, 605-612.48. J.J. Volkl, R.E. Beddoe, and M.J. Setzer, Cem. Concr. Res., 1987, 17, 81-87.49. D.N. Winslow and S. Diamond, J. Am. Ceram. Soc., 1974, 57, 193-197.50. W.P. Halperin, F. D'Orazio, S. Bhattacharja, and J.C. Tarczon, in Molecular Dynamics in
Restricted Geometries, J. Klafter and J.M. Drake, Eds., Magnetic Resonance RelaxationAnalysis of Porous Media, John Wiley and Sons, New York, 1989.
51. L. Barbaric, I. Kocuvan, R. Blinc, G. Lahajnar, P. Merljak, and I. Zupancic, J. Am.Ceram. Soc., 1982, 65, 25-31.
52. J.Y. Jehng, Microstructure of Wet Cement Pastes, Ph.D., Northwestern University,Evanston, IL, 1995.
53. W.P. Halperin, J.Y. Jehng, and Y.Q. Song, Magn. Reson. Imaging, 1994, 12, 169-173.54. K.L. Scrivener, H.H. Patel, P.L. Pratt, and L.J. Parrott, in Materials Research Society
Symposium Proceedings, L. Struble and P.W. Brown, Eds., Analysis of Phases in CementPaste Using Backscattered Electron Images, 85,,1987, p. 67-76.
55. D.H. Bager and E.J. Sellevold, Cem. Concr. Res., 1986, 16, 709-720.56. D.L. Gress, T. El-Korchi, R.A. Livingston, D.A. Neumann, and J.J. Rush, in Proc. Int.
Conf. on Concrete Under Severe Conditions, 1995, Saporo, Japan, Using Quasi-ElasticNeutron Scattering Techniques for Assessing Frost Resistance in Portland Cement Paste,p. 187-197.
57. B.J. Christensen, R.T. Coverdale, R.A. Olson, S.J. Ford, E.J. Garboczi, H.M. Jennings,and T.O. Mason, J. Am. Ceram. Soc., 1994, 77, 2789-2804.
58. H. Le Chatelier, Ann. Mines, 1887, 11, 345-365.59. H.M. Jennings, Cem. Concr. Res., 2000, 30, 101-116.60. P.D. Tennis and H.M. Jennings, Cem. Concr. Res., 2000, 30, 855-863.61. H.F.W. Taylor, J. Chem. Soc., 1950, 3682-3690.62. H.F.W. Taylor, J. Am. Ceram. Soc., 1986, 69, 464-467.63. F.H. Wittmann, in Hydraulic Cement Pastes: Their Structure and Properties, The
Structure of Hardened Cement Paste - a Basis for a Better Understanding of theMaterials Properties, Cement and Concrete Association, Slough, United Kingdom, 1976,p. 96-117.
64. I. Odler, Cem. Concr. Res., 2000, 30, 1337-1338.65. H.M. Jennings, Cem. Concr. Res., 2000, 30, 1339-1341.66. G.J. Verbeck and R.H. Helmuth, in 5th International Congress on Cement Chemistry,
1969, Tokyo, Japan, Structures and Physical Properties of Cement Paste, p. 1-44.

67. H. Roper, in Symposium on Structure of Portland Cement Paste and Concrete, 1966,Washington, D.C., Dimensional Change and Water Sorption Studies of Cement Paste, p.74-83.
68. J.F. Young, in Mathematical Modeling of Creep and Shrinkage of Concrete, Z.P. Bazant,Ed., Physical Mechanisms and Their Mathematical Description, Chapter 1, John WIleyand Sons, new York, 1988, p. 44-77.
69. Y. Xi and H.M. Jennings, in Materials Science of Concrete III, J. Skalny, Ed.,Relationship between Microstructure and Creep and Shrinkage of Cement Paste,American Ceramic Society, Westerville, OH, 1992, p. 37-69.
70. G.W. Scherer, Cem. Concr. Res., 1999, 29, 1149-1157.71. T.C. Powers, in Proc. Int. Symp. Struct. Concr., Mechanisms of Shrinkage and Reversible
Creep of Hardened Cement Paste, Cement and Concrete Association, London, 1965, p.319-344.
72. F.H. Wittmann, J. Am. Ceram. Soc., 1973, 56, 409-415.73. R.A. Helmuth and D. Turk, J. PCA Res. Dev. Labs, 1967, 9, 8-21.74. A. Bentur, N.B. Milestone, and J.F. Young, Cem. Concr. Res., 1978, 8, 721-732.75. R.F. Feldman, Cem. Concr. Res., 1972, 2, 521-540.76. C.M. Hunt, L.A. Tomes, and R.L. Blaine, J. Res. Natl. Bur. Stds, 1960, 64A, 163-169.77. A. Bentur, R.L. Berger, F.V. Lawrence, N.B. Milestone, M. S., and J.F. Young, Cem.
Concr. Res., 1979, 9, 83-96.78. R.F. Feldman and P.J. Sereda, Mater. Struct., 1968, 1, 509-520.79. C.M. Neubauer and H.M. Jennings, J. Mater. Sci., 2000, 35, 5751-5765.80. G. Pickett, J. Am. Concr. Inst., 1942, 38, 335-355.81. W. Ruetz, in Proc. Int. Conf. On the Structure of Concrete, A Hypothesis for the Creep of
Hardened Cement Paste and the Influence of Simultaneous Shrinkage, Cement andConcrete Association, London, 1968, p. 365-387.
82. J. Glucklich and O. Ishai, ACI J., 1962, 59, 923-948.83. W.G. Mullen and W.L. Dolch, Proc. ASTM, 1964, 64, 1146-70.84. G.E. Troxell, J.M. Rapheal, and R.E. Davis, Proc. ASTM, 1958, 58, 1101-1120.85. A.M. Neville, W.H. Dilger, and J.J. Brooks, Creep of Plain and Structural Concrete,
Construction Press, New York, 1983, 361 pp.86. T.C. Powers, L.E. Copland, J.C. Hayes, and H.M. Mann, J. Am. Concr. Inst., 1954, 51,
285-298.87. J.F. Young, in Permeability of Concrete, D. Whiting, Ed., A Review of the Pore
Structure of Cement Paste and Concrete and Its Influence on Permeability, SP-108,American Concrete Institute, Detroit, 1988, p. 1-18.
88. R. Zimbelmann, Cem. Concr. Res., 1985, 15, 801-808.89. S. Diamond, in 8th International Congress on the Chemistry of Cement, 1986, Rio de
Janeiro, The Microstructure of Cement Paste in Concrete, p. 433-437.90. D. Zampini, S.P. Shah, and H.M. Jennings, J. Mater. Res., 1998, 85, 21-31.91. B.D. Barnes, S. Diamond, and W.L. Dolch, Cem. Concr. Res., 1978, 8, 233-244.92. M.R. de Rooij, Syneresis in Cement Paste Systems, Ph.D., Delft Technical University,
The Netherlands, 2000.

93. J.M. Bijen and M. de Rooij,, R.K. Dhir, Ed., Why Are Aggregate/Matrix Interfaces ThatThick?, E & FN Spon, 2000, p. 17-25.
94. D.N. Winslow, M.D. Cohen, D.P. Bentz, K.A. Snyder, and E.J. Garboczi, Cem. Concr.Res., 1994, 24, 25-37.
95. K. Wang, D. Jansen, S.P. Shah, and A. Karr, Cem. Concr. Res., 1997, 27, 381-393.
96. C. Aldea, S.P. Shah, and A. Karr, Mater. Struct., 2000, 32, 370-376.97. I. Ujike and S. Nagataki, Proceedings of the Japanese Society of Civil Engineers, 1988,
9, 79-87.98. USBR, Concrete Manual, 8th ed., John Wiley and Sons, New York, 1981, 627 pp.
99. J.P. Ollivier, M. Massat, and L. Parrott, in Performance Criteria for Concrete Durability,J. Kropp and H.K. Hilsdorf, Eds., Parameters Influencing Transport Characteristics,Rilem Report 12, E & FN Spon, London, 1995, p. 33-96.
100. J. Kropp and H.K. Hilsdorf, Performance Criteria for Concrete Durability, Rilem Report12, E & FN Spon, London, 1995, 327 pp.
101. L.J. Parrott, Cem. Concr. Res., 1977, 7, 597-603.102. L.J. Parrott, Cem. Concr. Res., 1981, 11, 651-658.103. A. Bentur, R.L. Berger, J.H. Kung, N.B. Milestone, and J.F. Young, J. Am. Ceram. Soc.,
1979, 62, 362-366.104. A. Bentur, J. Coll. Interf. Sci., 1979, 74, 549-560.105. J. Skalny and I. Odler, J. Coll. Interface Sci., 1972, 40, 199-205.106. K.O. Kjellsen, R.J. Detwiler, and O.E. Gjorv, Cem. Concr. Res., 1990, 20, 308-311.107. M. Mouret, A. Bascoul, and G. Escadeillas, Cem. Concr. Res., 1999, 29, 369-375.108. F.M. Lea, The Chemistry of Cement and Concrete, 3rd ed., Chemical Publishing Co.,
New York, 1971, 727 pp.109. M. Eglinton, in Lea's Chemistry of Cement and Concrete, P.C. Hewlett, Ed., Resistance
of Concrete to Destructive Agencies, 4th Edition, Arnold Publishers, London, 1998, p.299-342.
110. G.M. Idorn, Durability of Concrete Structures in Denmark: A Study of Field Behaviorand Microscopic Features, Technical University of Denmark, Copenhagen, 1967, 208pp.
111. V. Johansen, N. Thaulow, and J. Skalny, in 74th Annual Meeting of the TransportationResearch Board, 1995, Washington, D.C., Chemical Degradation of Concrete.
112. P.K. Mehta, Concr. Int., 1997, 19, 27-33.113. H.F.W. Taylor and R.S. Gollop, in Mechanisms of Chemical Degradation of Cement-
Based Systems, K.L. Scrivener and J.F. Young, Eds., Some Chemical andMicrostructural Aspects of Concrete Durability, E & FN Spon, London, 1997, p. 177-184.
114. T.C. Powers, Proceedings of the Highway Research Board, 1949, 29, 184-211.115. T.C. Powers and R.A. Helmuth, Proceedings of the Highway Research Board, 1953, 32,
285-297.116. T.C. Powers, in Durability of Concrete, Freezing Effects in Concrete, SP-47, American
Concrete Institute, Detroit, MI, 1975, p. 1-11.

117. J. Marchand, R. Pleau, and R. Gagne, in Materials Science of Concrete Iv, J. Skalny, Ed.,Deterioration of Concrete Due to Freezing and Thawing, American Ceramic Society,Westerville, OH, 1995, p. 283-354.
118. G.W. Scherer, Cem. Concr. Res., 1999, 29, 1347-1358.119. R. Adenot and C. Richet, in Mechanisms of Chemical Degradation in Cement-Based
Systems, Modeling of the Chemical Degradation of a Cement Paste, K.L. Scrivener andJ.F. Young, Eds., E & FN Spon, London, 1996, p. 341-349.
120. C. Carde and R. Francois, Cem. Concr. Res., 1999, 21, 181-188.
121. G.J. Osborne, Cem. Concr. Compos., 1999, 21, 11-21.

6.11.10 Figure Captions
Figure 1. Heat evolution of C3S paste during hydration; the initial (1), induction (2), acceleratory(3), deceleratory (4) and continued (5) stages of hydration are noted.
Figure 2. Backscattered electron image of polished section of a 28-day-old C3S paste. Indescending order of brightness are, unhydrated cement grains (white), C-S-H gel (dark gray), CH(light gray) and capillary pores (black).
Figure 3. Effect of w/c ratio on the volumetric proportions of C-S-H gel (including gel pores),unhydrated cement, and capillary pores under saturated curing conditions.
Figure 4. Surface area development with time as measured by nitrogen gas sorption, after Hunt[36].
Figure 5. Typical small-angle scattering plot for a hydrated cement paste.
Figure 6. Surface area as measured by SANS (left axis) and the heat evolved (right axis) duringearly hydration of cement paste, from [35].
Figure 7. A two-dimensional representation of LD C-S-H.
Figure 8. Dependence of strength on porosity for normally cured cement pastes, autoclavedpastes, and a variety of aggregates; the 25 to 50% capillary porosity range indicated on the graphrepresents the normal range for a normally cured cement paste (after [66]).
Figure 9. Shrinkage-weight loss curve with corresponding drying conditions noted at right.Mechanisms associated with drying regions 1 through 5 are described in the text (from [1], afterdata from [67]).
Figure 10. Creep of concrete under simultaneous loading and drying; εtot = total strain, εc = totalcreep strain, εdc = drying creep strain, εbc = basic creep strain, εsh = shrinkage strain.
Figure 11. Effect of evaporable water content on creep of concrete at w/c ratios of 0.30 and 0.60(based on [81]).
Figure 12. Creep of concrete during drying from saturation to 50% and 70% RH (RH changecommenced at the time of initial load); basic creep at 100% RH is shown for comparison (after[84]).

Table 1: Morphological summary of the main hydration products of Portland cement.
Product Morphology
C-S-H gel Can vary considerably, at least 4 types observed (after [9]).Type I. Characterized by spines or fibers (1 µm in length, 0.1µ across)radiating from cement grains into water filled space. Type II. Interlocking structure with a honeycomb resemblance in which thegel encapsulates unhydrated cement grains and other products; only foundin Portland cement pastes, and only in C3S pastes with impurities.Type III. Small irregularly flattened particles, usually no greater that 0.3µm across.
Am
orph
ous
Type IV. A noticeably denser structure associated with the C-S-H gelproduct formed within the volume of the original cement grain.
CH Non-porous, striated, crystal typically having a typical hexagonal-prismmorphology (10µm to 100µm across); morphology is affected by availablespace, temperature, and impurities.
Ettringite Acicular needles (10µm in length, 0.5µm across).
Cry
stal
line
Monosulfo-aluminate
Thin (~0.1 µm) hexagonal plates (1µm by 1µm).
Table 2: Classification of pores in concrete (with data taken from [1]).
Type ofPore
Description Size Water Technique Properties
Large10 µm – 50
nmEvaporable
Bulk waterSEMa, OMb Permeability,
strengthCapillary
PoresMedium 50 – 10 nm
EvaporableModeratemenisci
SEMPermeability,strength, shrinkage(high RHe)
Small 10-2.5 nmEvaporable
Strong menisci Adsorption/MIPc
/ISd
Shrinkage (to 50%RH)
Gel Pores
Micropores 2.5-0.5 nm
Non-evaporable-No menisci-Intermolecularinteractions
Adsorption/MIP/IS
Shrinkage, creep(35-11% RH)

InterlayerSpaces Structural < 0.5 nm
Non-evaporable -Ionic/covalentbond
Adsorption/Thermal
Shrinkage, creep(< 11% RH)
ITZf 20-50 µm Bulk Water SEM/OM Permeability,strength
OtherPores
Microcracks 50 - > 200 µm Bulk Water SEM/OM Permeability,strength
a SEM: scanning electron microscopy; b OM: optical microscopy; c MIP: mercury intrusionporosimetry; d IS: impedance spectroscopy.e RH: relative humidity.f ITZ: interfacial transition zone.

Table 3: Measured total and free water porosities for mature OPC pastes [23].
w/c ratio Free Water Porosity / % Total Porosity /%
0.40 23.3 37.8
0.50 34.5 44.8
0.60 42.1 51.0
0.80 53.4 58.7
Table 4: Effect of the molecular size of the sorptive gas on the BET surface area of a matureOPC paste with w/c=0.4, after Mikhail and Selim [34].
SorptiveGas
Cross-sectional area /nm2
Surface Area / m2 g-1 of drypaste
H2O 0.114 202.6
N2 0.162 79.4
CH3OH 0.181 62.5
C3H7OH 0.277 45.0
C6H12 0.390 44.5
Table 5: Effect of w/c on the surface area of cement paste, as measured by BET gas sorptionwith nitrogen and water on mature paste [34] and by small-angle neutron scattering (SANS) on28 d old paste [35].
w/cratio
H2O BET / m2
g-1N2 BET / m2
g-1w/c
ratioSANS / m2 g-
1
0.35 208.0 56.7 0.35 99
0.40 202.6 79.4 0.40 100
0.50 194.6 97.3 0.45 106
0.57 193.8 132.2 0.50 123
0.70 199.6 139.6 0.55 132
0.60 147

Table 6: Summary of models for the structure of C-S-H.
Name of Model PrimaryExperimental Basis
Type of Model Selected Characteristics of Model
Powers Water sorption Colloid All products are gelVolume ofpores
Particle radius, 5 nm
Gel pore volume, 28%
Taylor X-ray Imperfect Atomic structure of C-S-HTGA Tobomerite
Jennite
Brunauer
Water Sorption 2-3 layers Structure changes upon drying
Feldman-Sereda Nitrogensorption
Layers Crumpled and folded layers with
Length vs. RH interlayer water reversiblyModulus vs.RH
removed upon drying
Weight vs. RH
Wittmann
Modulus vs.RH
Colloid Structure not defined
Jennings
Density vs. RH Colloid Fractal: density and surface area
Composition vs. RH depend on length scaleSurface area


Table 7: Water content and density of C-S-H as predicted by the quantitative colloidal model of C-S-H.
Computeddensityb
(kg m-3)Name of unit instructure
Radiusa
of unit (nm) Pores
emptyPoresFull
Surface area (m2 / g of C-S-H)
Modelporosityc
(%)
Relativehumiditycondition
Measured compositionMeasureddensity (kg m-3)
Porositybased on
compositiond
(%)
Basic Building Block 1.1 2800 2800 1000f - Dry 1.7 CaO•SiO2•1.4 H2O 2800 0
Globules 2.8 2300 2480 460g 18 11% 1.7 CaO•SiO2•2.1 H2O 2450 16
LD 8.3 1440e 1930 250e 49 Saturated 1.7 CaO•SiO2•4.0 H2O 2000 42
HD >100 1750e 2130 0 38 Saturated 1.7 CaO•SiO2•4.0 H2O 2000 42
a Assuming spherical particles; using relation, r = 3/ (SSA * ρ) where r = radius, SSA= specific surface area, and ρ = density.b Based on volume fraction of solid and pores.c Calculated as (1 - ρunit / ρbasic building block) * 100.d Computed from the molar volume of dry C-S-H and the molar volume of water. The molar volume of dry C-S-H (1.7CaO•SiO2•1.4H2O) wascomputed by dividing the molecular weight by the measured density to obtain a value of 6.45 x 10⁻⁵ m3/mol. The molar volume of water wastaken to be 1.80 x 10⁻⁵ m3/mol.e Values were optimized [60] by maximizing the statistical fit between reported values of nitrogen surface areas, pore volumes and capillaryporosity with predicted values of the model.f Based on SAXS [44, 49] data.g Based on SANS data, assuming that only the LD C-S-H structure contributes to the surface area.

T
S
80
able 8: Summary of re
Relevant Equa
Per
mea
tion
Gas Permation:
1g p
p
a
l
t
QK
−=
Darcy’s Law:
∆=
1
A
l
t
QKw
Dif
fusi
on
Fick’s First Law:
dx
dc-DF =
Fick’s Second Law
∂∂
∂∂
=∂∂
Dxt
c
Cap
illa
ryS
ucti
on
Modified Darcy’s
[pdx
dk-F w
p
η+=
Mig
rati
on
N rnst-Planck equ
DCRT
ZF
dx
dcDJ +=
ymbols:Kg,w = coefficient of pew = water)η = viscosity (Ns/m2)Q = volume of gas or lil = thickness of penetraA = penetrated area (m2
p = pressure at which v(N/m2)p1 = pressure at entry (Np2 = pressure at exit (Npw = pore water pressurt = time∆h = pressure head (m)x = distance
levant transport processes
tionTypical Va
Concre
2p
h
Kg = 10-8 to 1[97]
Kw = 10-8 – 10-1
x
c
10-11- 1012 (chlorid
Law:
]gh(x)ρ ~ 10-10 ml m
ation:
eCVdx
dE+
10-10 - 10-12
(chlorid
rmeability (m2; g = gas;
quid flow (m3)ted section (m))olume Q is measured
/m2)/m2)e (N/m2)
.
lues inte
Factors af
0-13 m s-1
3 m s-1 [98]
1. Sample size2. Conditionin3. Boundary c4. Driving pre5. Chemical re6. Initial wa7. Type of g
m2 s-1 e)
1. Sample t2. Tempera3. Concentr4. Reaction
-2 [99]
1. Initial wa2. Condition3. Reactiontest/carbona
m2 s-1
e)
1. Sample s2. Voltage/J3. Boundary
Symbols:F ,J = mass flux (g/mD = diffusion coefficC, c = concentration Kp = coefficient of m(kg/m)ρ = density (kg/m3)h(x) = heightZ = electrical chargeF = Faraday constantR = gas constant (J/mT = absolute temperaE = electrical potentiVe = velocity of solut
fecting measurements
.g/drying.onditions/leakage.ssure.actions during test.ter content.as.
hickness.ture.ation.s during test.
ter content.ing/drying.
s duringtion.
e
ize/duration of test.oule effects. conditions/leakage.2s)ient (m2/s)(g/m3)oisture permeability
(J/V⋅mol)ol⋅K0ture (K)al (V)ion (m/s)

81
Figure 1: Heat evolution of C3S paste during hydration; the initial (1), induction (2),acceleratory (3), deceleratory (4) and continued (5) stages of hydration are noted.
Figure 2: Backscattered electron image of polished section of a 28 day old C3S paste. Indescending order of brightness are, unhydrated cement grains (white), C-S-H gel (dark gray), CH(light gray) and capillary pores (black).
Time / hours
0 4 8 12 16 20 24 28 32
Ra
te o
f h
ea
t e
volu
tion
/ m
W g
-1
0
1
2
3
4
3 4 52
1

82
Figure 3: Effect of w/c ratio on the volumetric proportions of C-S-H gel (including gel pores),unhydrated cement, and capillary pores under saturated curing conditions.
Figure 4: Surface area development with time as measured by nitrogen gas sorption, after Hunt[36].
w/c ratio
0.0 0.2 0.4 0.6 0.8 1.0
Vo
lum
e fr
act
ion o
f past
e / %
0.0
0.2
0.4
0.6
0.8
1.0
C-S-H gel
Capillary
pores
Unhydrated
cement
w/c = 0.38
20
40
60
80
100
120
0 30 60 90 120 150 180 210
Sur
face
Are
a (m
2/g
)
Hydration time (days)
w/c=0.33
w/c=0.50
Surf
ace
Are
a / m
2 g-1
Hydration Time / days
w/c = 0.50
w/c = 0.33
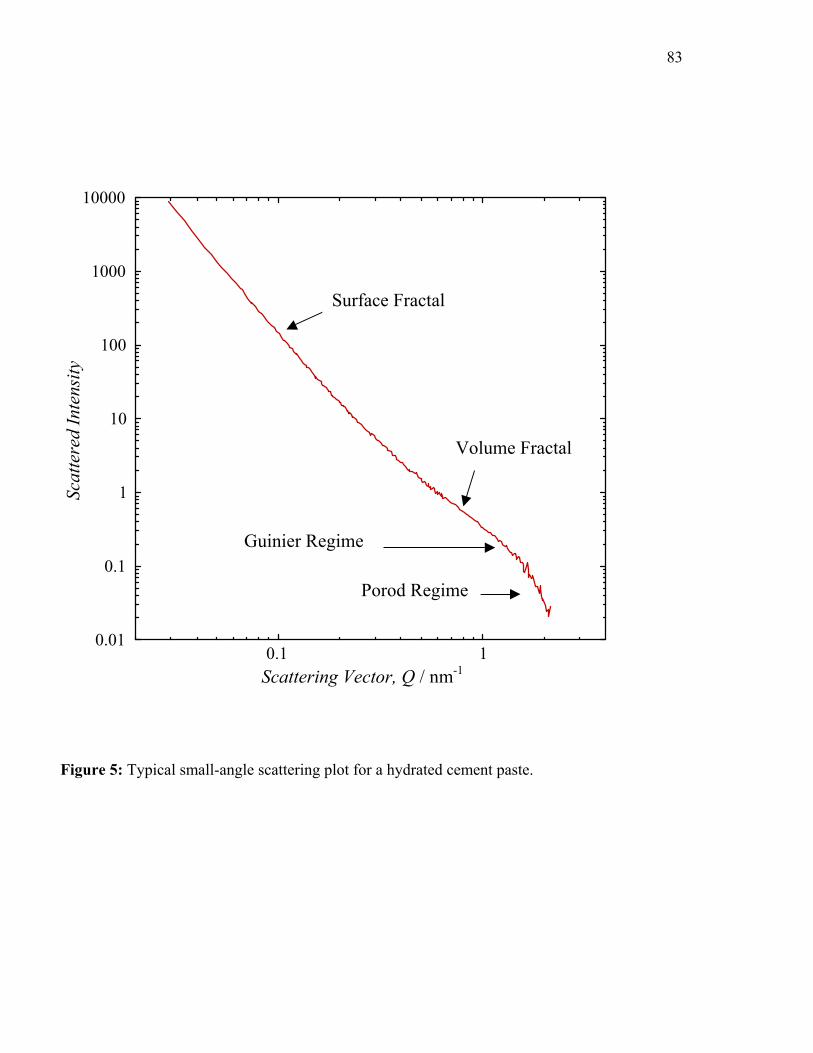
83
Figure 5: Typical small-angle scattering plot for a hydrated cement paste.
0.01
0.1
1
10
100
1000
10000
0.1 1
Sca
tter
ed I
nten
sity
Scattering Vector, Q (nm -1)
Surface Fractal
Volume Fractal
Guinier Regime
Porod Regime
Scattering Vector, Q / nm-1
Scat
tere
d In
tens
ity

84
Figure 6: Surface area as measured by SANS (left axis) and the heat evolved (right axis) duringearly hydration of cement paste, from [35].
0
40
80
120
160
0
50
100
150
200
250
300
350
0 10 20 30 40 50 60 70
Sur
face
Are
a (m
2/c
m3) H
eat evolved (Joules)
Time (hours)Time / hours
Surf
ace
Are
a / m
2 cm
-3 Heat evolved / Joules
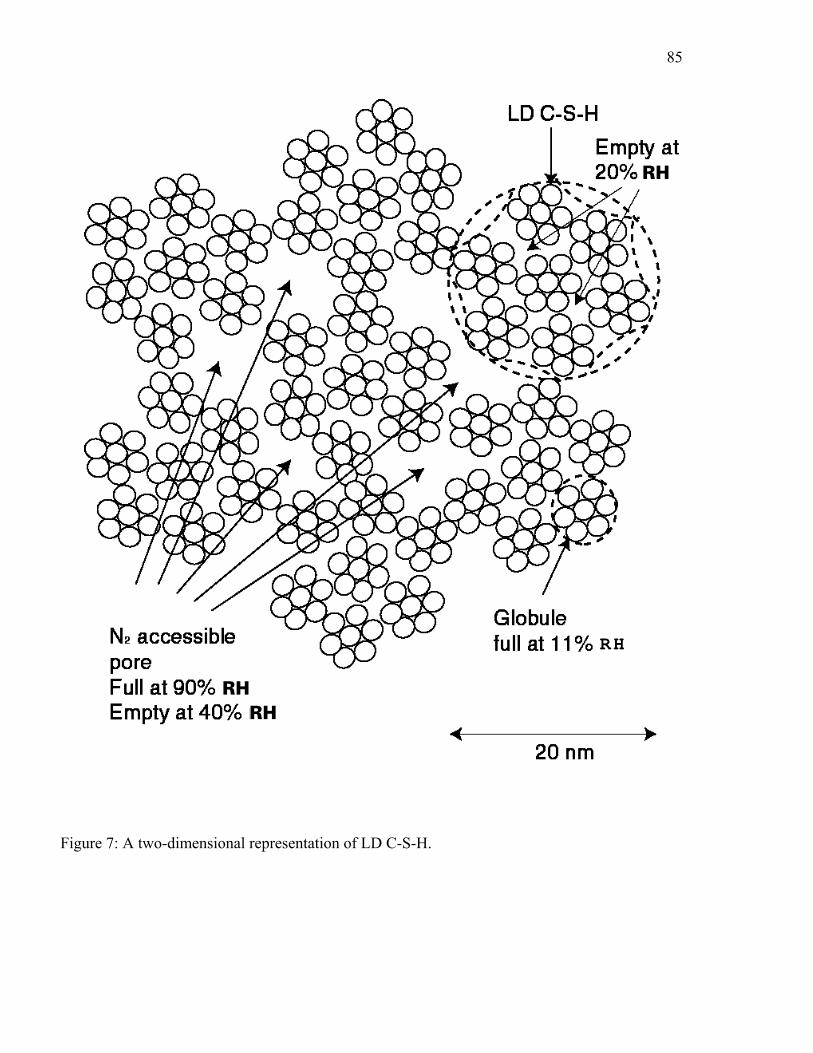
85
Figure 7: A two-dimensional representation of LD C-S-H.
RH
RHRH
RH

86
Figure 8: Dependence of strength on porosity for normally cured cement pastes, autoclavedpastes, and a variety of aggregates; the 25 to 50% capillary porosity range indicated on the graphrepresents the normal range for a normally cured cement paste (after [66]).
Capillary porosity / %
0102030405060708090100
Com
pre
ssiv
e st
rengt
h /
MP
a
0
20
40
60
80
100
120
140
160
180
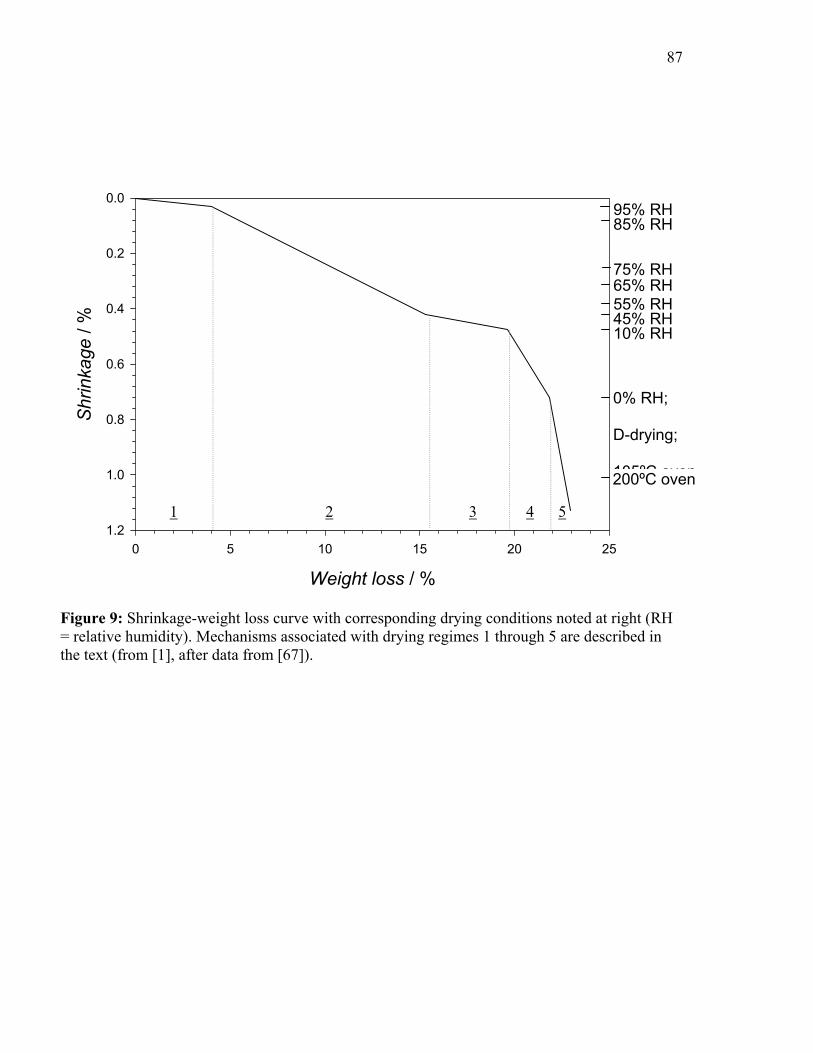
87
Figure 9: Shrinkage-weight loss curve with corresponding drying conditions noted at right (RH= relative humidity). Mechanisms associated with drying regimes 1 through 5 are described inthe text (from [1], after data from [67]).
Weight loss / %
0 5 10 15 20 25
Shrinka
ge /
%
0.0
0.2
0.4
0.6
0.8
1.0
1.2
95% RH85% RH
75% RH65% RH55% RH45% RH10% RH
0% RH;
D-drying;
105ºC oven200ºC oven
1 2 3 4 5

88
Figure 10: Creep of concrete under simultaneous loading and drying; εtot = total strain, εc = totalcreep strain, εdc = drying creep strain, εbc = basic creep strain, εsh = shrinkage strain.
Time
Mic
rost
rain
εsh
εbc
εdc
εc
εtot

89
Figure 11: Effect of evaporable water content on creep of concrete at w/c ratios of 0.30 and 0.60(based on [81]).
Fraction of total evaporable water present
0.0 0.2 0.4 0.6 0.8 1.0
Re
lativ
e c
ree
p
0.0
0.2
0.4
0.6
0.8
1.0
1.2
w/c ratio =0.30
w/c ratio =0.65

90
Figure 5.5. Creep of concrete during drying from saturation to 50% and 70% relative humidity(RH); RH change commenced at the time of initial load. Basic creep at 100% RH is shown forcomparison (after [84]).
Time after initial loading / days
10 100 1000 10000
Cre
ep
/ m
icro
stra
in
0
200
400
600
800
1000
1200
100% RH
70% RH
50% RH