cement fatigue and hpht well integrity with application to ... · cement fatigue and hpht well...
TRANSCRIPT
Cement Fatigue and HPHT Well Integrity with Application to Life of Well Prediction
by
Catalin Teodoriu, Jerome Schubert, and Ignatius Ugwu Petroleum Engineering Department, Texas A&M University
College Station, Texas
Final Project Report Prepared for the Minerals Management Service
Under the MMS/OTRC Cooperative Research Agreement 1435-01-04-CA-35515
Task Order M07AC12464 MMS Project Number 602
December 2008
OTRC Library Number: 12/08A195
For more information contact:
“The views and conclusions contained in this document are those of the authors and should not be interpreted as representing the opinions or policies of the U.S. Government. Mention of trade names or commercial products does not constitute their endorsement by the U. S. Government”.
Offshore Technology Research Center
Texas A&M University 1200 Mariner Drive
College Station, Texas 77845-3400 (979) 845-6000
or
Offshore Technology Research Center The University of Texas at Austin
1 University Station C3700 Austin, Texas 78712-0318
(512) 471-6989
A National Science Foundation Graduated Engineering Research Center
i
EXECUTIVE SUMMARY
Problem Statement
For an oil/gas well to maintain its integrity and be produced effectively and
economically, it is pertinent that a complete zonal isolation is achieved during the life of
the well. This complete zonal isolation, however, can be compromised due to factors that
come into play during the operative life of the completed well. Such factors may come in
the form of thermal or pressure loads generally regarded as HTHP (High Temperature-
High Pressure) loads which can manifest themselves as a static/cyclic load or both
depending on how they are exerted. Cement structures experiencing cyclic loading
conditions can fail as a result of fatigue due to extensive degradation of the
microstructure of the cement material depending on stress levels and number of cycles.
There has been a lot of research and experimental investigations on the
mechanism of fatigue failure of structures like buildings, bridges etc. but the fatigue
behavior of well cement is still relatively unknown to engineers. Research in the area of
well cement design has led to improved cement designs and cementing practices but yet
many cement integrity problems persist and this further strengthens the need to
understand the mechanism of cement fatigue. Even though most structural failures are as
a result of fatigue rather than static loading, insights on the role of both static and fatigue
loading conditions on the failure of cement sheath would hopefully lead to
improvements in well design.
ii
Project Objective
The objective of this project is to develop a better understanding of the performance of
the casing–cement bond under HPHT well conditions, leading to a model to predict well
life. This would entail two major tasks:
to identify the factors that affect the casing–cement integrity under HPHT
conditions
to understand better the fatigue of well cement.
Based on the knowledge acquired from completing these tasks, it will be possible
to analyze the mechanics of casing–cement systems under HPHT conditions for the long
term integrity of the system.
Approach
The first approach taken in this project was a comprehensive literature review on the
fatigue of construction cement/concrete since no literature presently exists on the fatigue
of well cement and understanding of the differences between both kinds of cement. The
literature review was focused on:
the state of the art in the fatigue of cement,
casing cement interaction models currently being utilized by operators, and
casing–cement integrity under HPHT conditions.

iii
The findings here are discussed in chapters 1 and 2. The knowledge from the
literature review was then applied in modeling and understanding the mechanism of
fatigue in well cement.
Furthermore, an analytical model of wellbore stresses based on wellbore
parameters was developed and used in addition to finite element analysis to conduct
stress analysis on a casing–cement–formation model in order to study the integrity of the
cement sheath under different HPHT loading scenarios. This is presented in chapters 3
and 4 of this report. This model can be integrated in a simple-to-use computer software
package capable of recording the history of the well and predicting its fatigue life.
Finally, recommendations for future work are given in chapter 5.
iv
NOMENCLATURE
ID Internal diameter
HPHT High Pressure-High Temperature
S-N Diagram Stress-cycle diagram
LS Low Strength
HS High Strength
BWOC By Weight of Cement
BVOB By Volume of Blend
BWOW By Weight of Water
FEA Finite Element Analysis
SF Safety Factor
E Young’s modulus
ν Poisson’s ratio
α Coefficient of thermal expansion
ΔT Temperature change
pi Internal pressure
pf Formation pressure
σa Stress amplitude
σm Mean stress
v
TABLE OF CONTENTS
EXECUTIVE SUMMARY.................................................................................................i
NOMENCLATURE..........................................................................................................iv
TABLE OF CONTENTS ...................................................................................................v
LIST OF FIGURES..........................................................................................................vii
LIST OF TABLES .............................................................................................................x
1. INTRODUCTION.........................................................................................................1
1.1 Background .............................................................................................................2
1.1.1 HPHT Well Integrity ........................................................................................2
1.1.2 Fatigue in Cement/Concrete.............................................................................3
2. OILFIELD CEMENTING ............................................................................................8
2.1 Well Cement............................................................................................................8
2.1.1 New Cements vs. Conventional Well Cements .............................................12
2.2 Cement Additives..................................................................................................17
2.3 Well Cementing Design Process ...........................................................................19
2.4 Cement Integrity Issues Due to Temperature and Pressure ..................................21
2.4.1 Effect of High Temperature ...........................................................................22
2.4.2 Combined Effect of Temperature and Pressure .............................................23
2.4.3 Casing–Cement–Formation Interactions........................................................25
3. CEMENT FAILURE DUE TO STATIC LOADING.................................................29
3.1 Analytical Model of Wellbore Stresses.................................................................29

vi
3.1.1 Background ....................................................................................................29
3.1.2 Assumptions ...................................................................................................31
3.1.3 Failure Criteria ...............................................................................................31
3.1.4 Analytical Model............................................................................................34
3.2 Analytical and Finite Element Studies ..................................................................42
3.3 Fatigue Studies ......................................................................................................46
4. RESULTS AND DISCUSSION ................................................................................54
4.1 Static Studies .........................................................................................................54
4.2 Fatigue Loading.....................................................................................................70
4.3 Experimental Studies.............................................................................................86
5. CONCLUSIONS AND RECOMMENDATIONS......................................................94
5.1 Conclusions ...........................................................................................................94
5.2 Recommendations for Future Work ......................................................................95
REFERENCES.................................................................................................................97

vii
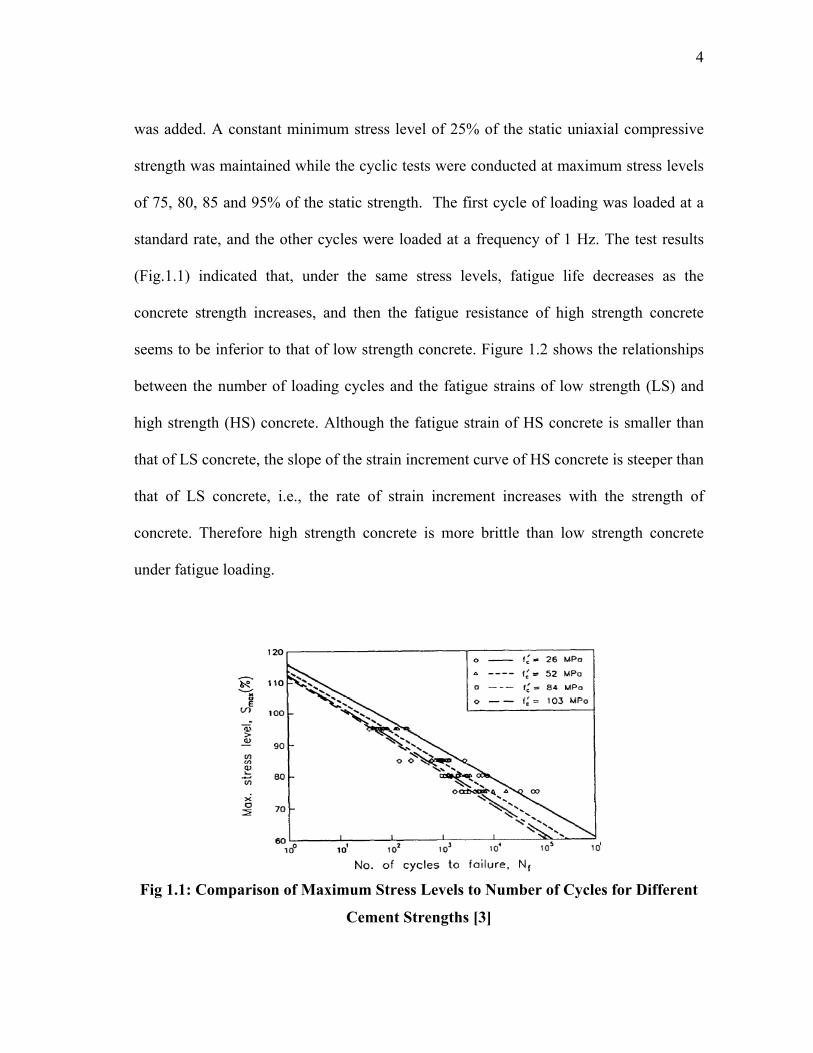
LIST OF FIGURES Fig 1.1: Comparison of Maximum Stress Levels to Number of Cycles for
Different Cement Strengths [3] ...........................................................................4
Fig 1.2: Comparison of Fatigue Strain for High and Low Strength Cements [3] ............5
Fig 1.3: Damage Development Depending on Different Cyclic Load Levels [6]............7
Fig 2.1: Stresses That Act on a Pre-Stressed Cement System [12] ................................14
Fig 2.2: Three-step Process for Cement Design [14]......................................................21
Fig 2.3: Tangential Stress for Hard and Soft Cement Systems [17]...............................27
Fig 3.1: Radial and Hoop Stress Profile Due to Loading Conditions [26] .....................30
Fig 3.2: Stresses Acting on a Cement Sheath [12] .........................................................30
Fig 3.3: Concrete Failure Criterion under Triaxial Compressive Stresses [24] .............33
Fig 3.4: Failure Envelope for Triaxial Compression and Tensile Stress State [24] .......34
Fig 3.5: Contact Pressure on Casing–Cement Interface .................................................35
Fig 3.6: Operative Stresses on Cement–Formation Interface .........................................38
Fig 3.7: Contact Stresses on Cement Sheath ..................................................................40
Fig 3.8: Equivalent Stress for Casing–Cement–Formation Model with Meshing..........45
Fig 3.9: Equivalent Stress Comparison For Analytical and FEA Models ......................46
Fig 3.10: S-N Curve for Fatigue Analysis in ANSYS ...................................................48
Fig 3.11: Cyclic Loading Conditions for the Cement Sheath ........................................49
Fig 3.12: Goodman Diagram for Brittle and Ductile Materials [26] .............................50
Fig 3.13: Zero Based Loading, Goodman’s Diagram and Fatigue Options...................51
Fig 3.14: Fully Reversed Loading, Goodman’s Diagram and Fatigue Options.............52
Fig 4.1: Equivalent Stress with Formation Ef = 3 x 10⁶ psi and νf = 0.42 for Scenario 1..........................................................................................................55
Fig 4.2: Equivalent Stress with Formation Ef = 1 x 10⁶ psi and νf = 0.3 for Scenario 1..........................................................................................................56
Fig 4.3: Equivalent Stress in Three Cement Systems with pi = 15,000 psi and pf = 1,000 psi.....................................................................................................57
Fig 4.4: Tangential Stress in Three Cement Systems with pi = 15,000 psi and pf =1,000 psi ......................................................................................................57

viii
Fig 4.5: Radial Stress in Three Cement Systems with pi = 15,000 psi and pf = 1,000 psi .....................................................................................................58
Fig 4.6: Von Mises Stress with Formation Ef = 1 x 10⁶ psi and νf = 0.3 for Scenario 2..........................................................................................................59
Fig 4.7: Equivalent Stress in Three Cement Systems with pi = 15,000 psi and pf = 0 psi ............................................................................................................60
Fig 4.8: Tangential Stress in Three Cement Systems with pi = 15,000 psi and pf = 0 psi............................................................................................................60
Fig 4.9: Radial Stress in Three Cement Systems with pi = 15,000 psi and pf = 0 psi .....61
Fig 4.10: Equivalent Stress in Three Cement Systems with pi = 4,000 psi and pf = 10,000 psi ................................................................................................62
Fig 4.11: Tangential Stress in Three Cement Systems with pi = 4,000 psi and pf = 10,000 psi ................................................................................................62
Fig 4.12: Radial Stress in Three Cement Systems with pi = 4,000 psi and pf = 10,000 psi ................................................................................................63
Fig 4.13: Equivalent Stress with pi = 15,000 psi, pf = 1,000 psi and ΔT = 150°F .........64
Fig 4.14: Tangential Stress with pi = 15,000 psi, pf = 1,000 psi and ΔT = 150°F..........64
Fig 4.15: Radial Stress with pi = 15,000 psi, pf = 1,000 psi and ΔT = 150°F .................65
Fig 4.16: Equivalent Stress with pi = 15,000 psi, pf = 0 psi and ΔT = 150°F ................66
Fig 4.17: Tangential Stress with pi = 15,000 psi, pf = 0 psi and ΔT = 150°F.................67
Fig 4.18: Radial Stress with pi = 15,000 psi, pf = 0 psi and ΔT = 150°F .......................67
Fig 4.19: Equivalent Stress with pi = 4,000 psi, pf = 10,000 psi and ΔT = 150°F .........68
Fig 4.20: Tangential Stress with pi = 4,000 psi, pf = 10,000 psi and ΔT = 150°F .........69
Fig 4.21: Radial Stress with pi = 4,000 psi, pf = 10,000 psi and ΔT = 150°F ................69
Fig 4.22: Equivalent Stress for Static Loading with Formation Ef = 1 x 10⁶ psi and νf = 0.42 ...................................................................................................71
Fig 4.23: Equivalent Alternating Stress for Zero Based Loading ..................................72
Fig 4.24: Life Cycle for Zero Based Loading ................................................................73
Fig 4.25: Fatigue Sensitivity to Life Plot for Zero Based Loading................................73
Fig 4.26: Fatigue Sensitivity to Safety Factor Plot for Zero Based Loading .................74
Fig 4.27: Fatigue Sensitivity to Damage Plot for Zero Based Loading .........................74
Fig 4.28: Equivalent Stress for Static Loading with Formation Property: Ef = 1 x 10⁶ psi, νf = 0.3.................................................................................. 75
ix
Fig 4.29: Alternating Stress for Zero Based Loading with Formation Property: Ef = 1 x 10⁶ psi, νf = 0.3..................................................................................76
Fig 4.30: Alternating Stress for Fully Reversed Loading with Formation Property: Ef = 3 x 10⁶ psi, νf = 0.3..................................................................77
Fig 4.31: Life Cycle for Fully Reversed Loading with Formation Property: Ef = 3 x 10⁶ psi, νf = 0.3..................................................................................78
Fig 4.32: Equivalent Stress for Cement System 2 under Static Loading .......................79
Fig 4.33: Alternating Stress for Cement System 2 under a Zero Based Cyclic Loading...........................................................................................................79
Fig 4.34: Life Cycle for Cement System 2 under a Zero Based Cyclic Loading...........80
Fig 4.35: Fatigue Sensitivity to Life for a Zero Based Cyclic Loading with Cement 2 ........................................................................................................80
Fig 4.36: Fatigue Sensitivity to Damage Plot for a Zero Based Cyclic Loading with Cement ...................................................................................................81
Fig 4.37: Fatigue Sensitivity to Safety Factor Plot for a Zero Based Cyclic Loading with Cement 2 ..................................................................................81
Fig 4.38: Equivalent Stress for Cement System 1 under Static Loading .......................82
Fig 4.39: Alternating Stress for Cement System 1 under Zero Based Cyclic Loading...........................................................................................................83
Fig 4.40: Life Cycle for Cement System 1 under Zero Based Cyclic Loading .............83
Fig 4.41: Fatigue Sensitivity to Life for Zero Based Cyclic Loading with Cement 1 ...84
Fig 4.42: Fatigue Sensitivity to Safety Factor for Zero Based Cyclic Loading with Cement 1 ................................................................................................85
Fig 4.43: Fatigue Sensitivity to Damage for Zero Based Cyclic Loading with Cement 1 ........................................................................................................85
Fig 4.44: Cubes Cured Under Water at Atmospheric Pressure......................................87
Fig 4.45: Shrinkage in Cured Cement............................................................................87
Fig 4.46: Cemented Pipe under Compression................................................................88
Fig 4.47: Cracks in 4-½" ID Pipe with 16 lb/gal Slurry after 12 Cycles .......................89
Fig 4.48: Cracks in 4-½" ID Pipe with 16 lb/gal Slurry after 30 Cycles .......................90
Fig 4.49: Cracks in 3-½" ID Pipe with 16 lb/gal Slurry after 12 Cycles .......................91
Fig 4.50: Cracks in 3-½" ID Pipe with 16 lb/gal Slurry after 30 Cycles .......................92
Fig 4.51: 4-½" ID Pipe with 16 lb/gal Slurry after De-bonding at 2,500 lb Force ........93
x
LIST OF TABLES Table 2.1: ASTM Cement Classifications [11] ..............................................................11
Table 2.2: API Cement Classifications [9].....................................................................12
Table 3.1: Stress-Life Data for Cement System 1 (Strength: 26 MPa/ 3,771 psi) .........47
Table 3.2: Stress-Life Data for Cement System 2 (Strength: 84 MPa /12,183 psi) .......47
1
1. INTRODUCTION For a well, whether oil or gas, to maintain its integrity and produce effectively and
economically, it is pertinent that a complete zonal isolation is achieved during the life of
the well. This complete zonal isolation, however, can be compromised due to factors that
come into play during the operative life of the completed well. Such factors may come in
the form of thermal or pressure loads generally regarded as HPHT (high temperature-
high pressure) loads which can manifest themselves as a static/cyclic load or both,
depending on how they are exerted. Depending on the magnitude of loading (stress
level), the number of cycles and even the mechanical properties of the well cement,
cyclic loading could result in failure by extensive breakdown of the microstructure of the
cement.
There have been a lot of experimental investigations on the mechanism of fatigue
failure of structures like buildings and bridges but the fatigue behavior of well cement is
still relatively unknown to engineers. Research has led to improved cement designs and
cementing practices, yet many cement integrity problems persist and this further
strengthens the need to understand the mechanism of cement fatigue. Even though most
structural failures are a result of fatigue rather than static loading, insights on the role of
both static and fatigue loading conditions on the failure of cement sheath would
hopefully lead to improvements in well design.
2
1.1 Background
1.1.1 HPHT Well Integrity
A well can be said to have maintained its integrity if it effectively achieves zonal
isolation over its life. However, maintaining integrity is not always the case in real life
oilfield practice as case histories abound where the integrity of the well was
compromised due to failure of the cement sheath, leading to loss of money and
production.
In order to keep up with the world’s energy demands, oil and gas producing
companies have taken the initiative to explore offshore reserves or drill deeper into
previously existing wells. The consequence of this, however, is that they have to deal
with the high temperatures and pressures encountered at increasing depths. The industry
acknowledges the threshold for high temperature and high pressure conditions as 300°F
and 10,000 psi respectively 1. For temperatures and pressures above these values, only a
rigorous design would ensure the integrity of the well. High pressure / high temperature
(HPHT) scenarios can be seen in the case of the Tuscaloosa trend in Louisiana drilled to
a depth of 23,000 ft and with bottom hole temperature of 400°F and pressures between
17,000 to 20,000 psi, or even in case of the Shearwater field 2 in the East Central Graben
area of the North Sea with a depth of 16,000 ft, temperature of 360°F and pressure of
15,200 psi, to mention but a few.
These actual HPHT industrial experiences highlight the inadequacy of
conventional cementing procedures to provide adequate zonal isolation. High
temperatures and pressures or even post-cementing stresses imposed on the cement
3
sheath as a result of casing pressure testing and formation integrity tests set in motion
events which could compromise the long term integrity of the cement sheath due to
fatigue. Knowledge of the mechanism of fatigue in cement and factors that affect it such
as the magnitude of the load, strength and composition of the cement, mechanical
properties of the cement and pattern of load cycles are important to achieve a realistic
design of a cement system that will be subjected to fatigue loading. Such a design will
go a long way to ensure the long term integrity of a well operating under HPHT
conditions.
1.1.2 Fatigue in Cement/Concrete
The nature of fatigue in well cement is generally unknown and only a few studies exist
on the fatigue of construction cement. The differences between oil well cement and
cement used in the construction industry will be discussed in the next chapter. The
fatigue strength of cement/concrete can be affected by factors such as the composition
and mechanical properties of the cement, environmental and loading conditions, and
water-cement ratio of concrete. A number of studies have been conducted on the fatigue
of construction cement and it was found that due to the heterogeneous nature of cement,
experimental results show a large scattering in the concrete behavior due to the cyclic
loading and few data sets may not be sufficient to give an adequate description of
cement behavior under fatigue loading.
Studies were conducted by Kim and Kim3 on the fatigue behavior of high
strength concrete using a type I Portland cement to which Elkem micro silica (powder)
4
was added. A constant minimum stress level of 25% of the static uniaxial compressive
strength was maintained while the cyclic tests were conducted at maximum stress levels
of 75, 80, 85 and 95% of the static strength. The first cycle of loading was loaded at a
standard rate, and the other cycles were loaded at a frequency of 1 Hz. The test results
(Fig.1.1) indicated that, under the same stress levels, fatigue life decreases as the
concrete strength increases, and then the fatigue resistance of high strength concrete
seems to be inferior to that of low strength concrete. Figure 1.2 shows the relationships
between the number of loading cycles and the fatigue strains of low strength (LS) and
high strength (HS) concrete. Although the fatigue strain of HS concrete is smaller than
that of LS concrete, the slope of the strain increment curve of HS concrete is steeper than
that of LS concrete, i.e., the rate of strain increment increases with the strength of
concrete. Therefore high strength concrete is more brittle than low strength concrete
under fatigue loading.
Fig 1.1: Comparison of Maximum Stress Levels to Number of Cycles for Different
Cement Strengths [3]

5
Fig 1.2: Comparison of Fatigue Strain for High and Low Strength Cements [3]
Antrim4 conducted fatigue studies on hardened ordinary Portland (type I) cement
paste using 2 specimens; one with a high water-cement ratio of 0.7 and another with a
low water-cement ratio of 0.45. A high stress level of 80% (percentage of the ultimate
static compressive strength of the cement) was used in conducting this investigation. It
was observed that the degree to which shrinkage stresses were present in the specimens
was proportional to the water content. This lead to the 0.7 mixture undergoing more
shrinkage due to a more extensive capillary pore system. It was also observed that at
equivalent percentages of the compressive strength, the 0.7 water-cement mixture was
capable of withstanding more cycles to failure than the 0.4 water-cement mixture. From
these results, the author suggested that shrinkage stresses play a greater role in fatigue
strength because they serve to restrain crack propagation4. Crack propagation was slower
in the open capillary structure cement (0.7 mixture) than in the dense structure cement
6
(0.4 mixture) because the high water-cement ratio paste is less brittle and can re-adjust
its structure, thus delaying the build up of stress concentrations.
Breitenbucher et al. 5 noticed in their investigations that cyclic loading could lead
to the reduction of stiffness of concrete and that fatigue strain plays a role in the
degradation of the mechanical properties of concrete. The level of damage due to fatigue
loading can be ascertained from the degradation of stiffness at a certain number of
cycles. It was also observed that as the longitudinal strain increases at 60% stress level,
the concrete properties (Young’s modulus, fracture energy) decrease faster up to the first
2.0 millions of cycles thereafter, whereas the compressive strength almost remained
constant. There was no observed failure due to fatigue for at least 25.5 million cycles.
Similar observations were made at 70% and 75% stress levels. This shows that the effect
of the number of load cycles appears to be negligible and therefore the damage is
governed only by the evolution of fatigue strain. These results were also corroborated by
the findings of Breitenbucher and Ibuk 6, who in addition noticed that small differences
in the upper load can largely affect the formation of micro-cracks.
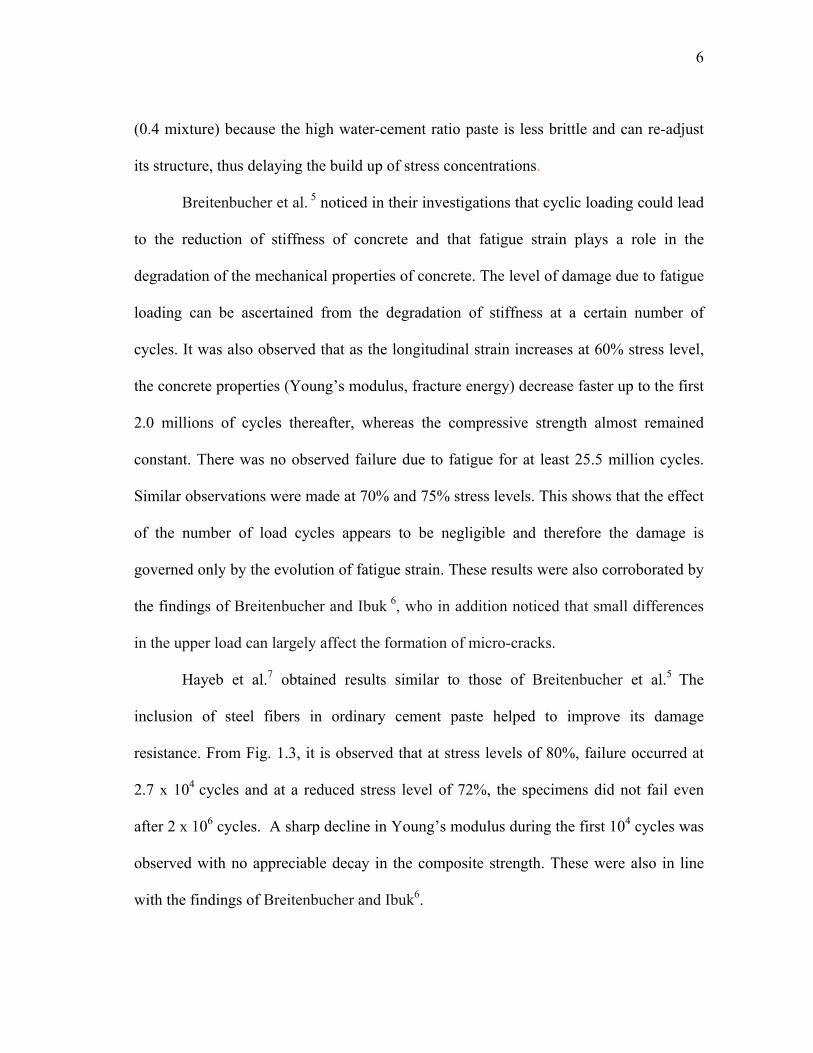
Hayeb et al.7 obtained results similar to those of Breitenbucher et al.5 The
inclusion of steel fibers in ordinary cement paste helped to improve its damage
resistance. From Fig. 1.3, it is observed that at stress levels of 80%, failure occurred at
2.7 x 10⁴ cycles and at a reduced stress level of 72%, the specimens did not fail even
after 2 x 10⁶ cycles. A sharp decline in Young’s modulus during the first 104 cycles was
observed with no appreciable decay in the composite strength. These were also in line
with the findings of Breitenbucher and Ibuk6.
7
Fig 1.3: Damage Development Depending on Different Cyclic Load Levels [6]
From the existing literatures reviewed, it can be observed that the fatigue of cement can
be affected by the following:
compressive strength of cement 3
water-cement ratio of cement mixture 4
stress levels at which cyclic loading occurs 5,6
elasticity of the cement 6
use of solid particles, which may increase the fatigue resistance 6,7.
It should be noted that these studies were conducted using construction cement/concrete
but they should be indicative of the fatigue of well cement as both contain the same base
material.
8
2. OILFIELD CEMENTING
2.1 Well Cement
Well cements are specially formulated for the exploratory drilling of oil and gas wells.
Well cementing serves various purposes 8, which includes:
providing support and protection to the casing, and
enabling zonal isolation by preventing the movement of fluids through the
annular space outside the casing, stopping the movement of fluids into fractured
formation or simply by plugging off an abandoned portion of the well. This is the
primary goal of well cementing.
The choice of a particular cement for zonal isolation centers largely on downhole and
formation conditions. But in general, oil well cements should have some features 9 which
are necessary for a successful completion job and which would qualify them to be used
for well cementing purposes. Such features include the following:
the cement should be able to maintain its integrity in terms of durability and
being free from strength retrogression during the operational life of the well at
the prevailing downhole conditions;
there should be an optimal setting time for the cement; too reactive a slurry will
result in a short setting time and an insufficiently reactive slurry may take too
long to set;
the cement slurry should have low viscosity to make it pump-able;
the cement should be high sulphate resistant;
9
the cement should have a low permeability.
Well cement and construction cement have one thing in common - they are both
Portland cements. Their difference lies in the fact that well cement, in addition to its
Portland cement base, is mixed with additives in order to tailor it to a particular
application and is also manufactured to a higher level of consistency. Portland cement is
manufactured as a result of a chemical reaction between limestone and clay at
temperatures of about 2,600°F to 3,000°F. There are four principal compounds in
Portland cement, which are
tricalcium silicate, C3S,
dicalcium silicate, C2S,
tricalcium aluminate, C3A, and
tetracalcium aluminoferrite, C4AF.
Portland cement, when set, develops compressive strength due to hydration as a
result of reaction between water and these constituting components of the cement. The
rate of hydration depends on temperature, size of cement particle and the percentage of
each component present, with C3A hydrating most rapidly followed by C3S, then by
C4AF and finally by C2S. This hydration reaction results in reduction of volume which
makes Portland cement shrink when set. Expansive cement, which is a modified
Portland cement, is used to compensate for volume decrease due to shrinkage and to
induce a tensile stress in the reinforcement.
Pure Portland cement looses its compressive strength and increases its
permeability at temperatures above 230°F as a result of strength retrogression arising

10
from the breakdown of its crystalline structure at such temperatures. This would render
the Portland cement unusable for high temperature applications. The strength
retrogression could be explained as follows 10.
When Portland cement is mixed with water, tricalcium silicate (C3S) and
dicalcium silicate (C2S) hydrate to form calcium silicate hydrate (C-S-H) gel and
hydrated lime (Ca(OH)2)2. At temperatures higher than 230°F, C-S-H gel converts to α-
dicalcium silicate hydrate (α-C2SH). Conversion to the α-C2SH phase results in the loss
of compressive strength and an increase in permeability. Conversion of C-S-H gel to α-
C2SH at 230°F and higher can be prevented by adding crystalline silica.
The American Society for Testing and Materials (ASTM) Specification C-150
classifies eight types of Portland cement, with type I cement being the normal, general-
purpose cement used for construction purposes 11. More than 92% of Portland cement
produced in the United States is type I and II (or Type I/II). Type III accounts for about
3.5% of cement production. Type IV cement is only available on special request, and
type V may also be difficult to obtain (less than 0.5% of production).
The American Petroleum Institute on the other hand, has defined Specifications
for materials and testing for well cements (API Specification 10A) , which includes
requirements for eight classes of oil well cements (classes A through H) and three grades
(Grades O - ordinary, MSR - moderate sulphate resistant, and HSR - high sulphate
resistant). Each class is applicable for use at a certain range of well depths, temperatures,
pressures, and sulphate environments. Cement classes A, B, C, G, and H are primarily
used in the United States for well cementing. The petroleum industry also uses
11
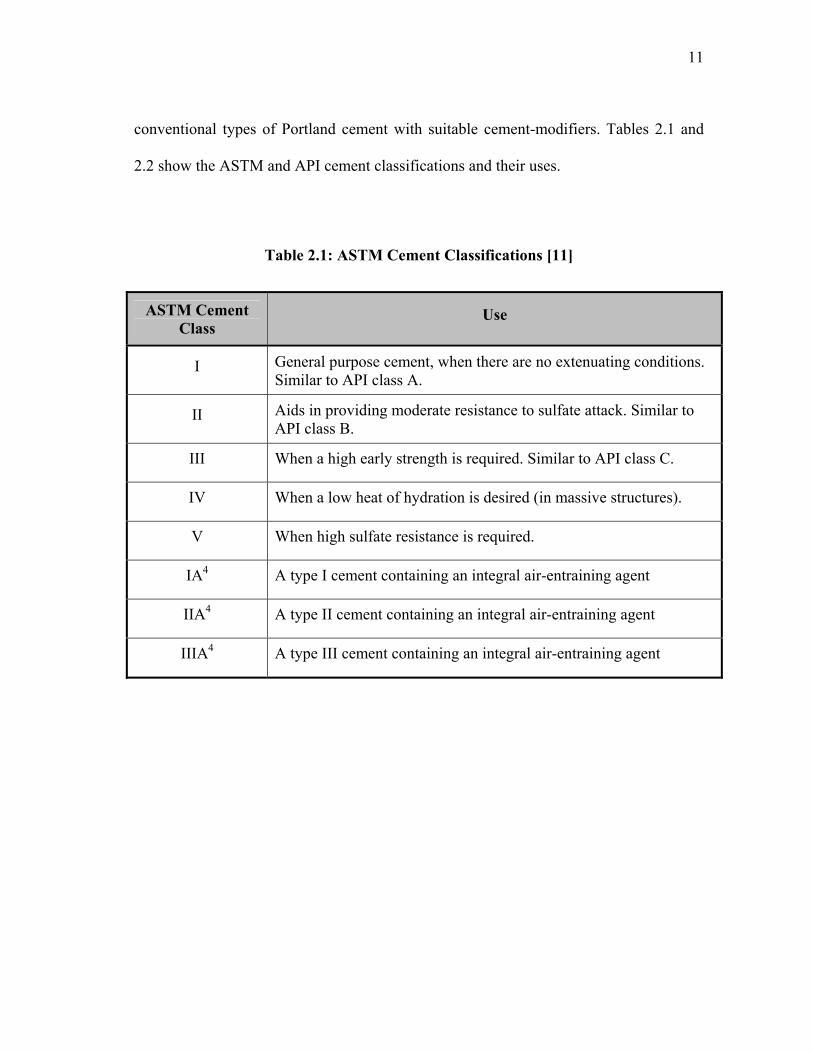
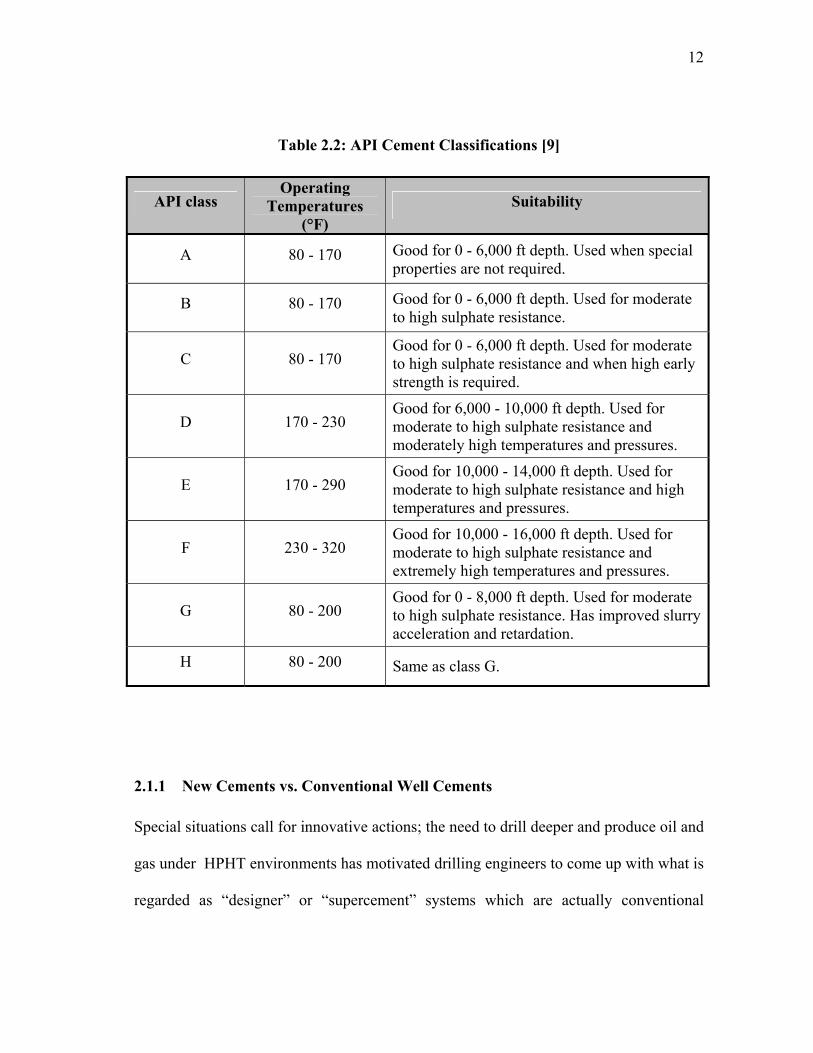
conventional types of Portland cement with suitable cement-modifiers. Tables 2.1 and
2.2 show the ASTM and API cement classifications and their uses.
Table 2.1: ASTM Cement Classifications [11]
ASTM Cement Class
Use
I General purpose cement, when there are no extenuating conditions. Similar to API class A.
II Aids in providing moderate resistance to sulfate attack. Similar to API class B.
III When a high early strength is required. Similar to API class C.
IV When a low heat of hydration is desired (in massive structures).
V When high sulfate resistance is required.
IA4 A type I cement containing an integral air-entraining agent
IIA4 A type II cement containing an integral air-entraining agent
IIIA4 A type III cement containing an integral air-entraining agent
12
Table 2.2: API Cement Classifications [9]
API class Operating
Temperatures (°F)
Suitability
A 80 - 170 Good for 0 - 6,000 ft depth. Used when special properties are not required.
B 80 - 170 Good for 0 - 6,000 ft depth. Used for moderate to high sulphate resistance.
C 80 - 170 Good for 0 - 6,000 ft depth. Used for moderate to high sulphate resistance and when high early strength is required.
D 170 - 230 Good for 6,000 - 10,000 ft depth. Used for moderate to high sulphate resistance and moderately high temperatures and pressures.
E 170 - 290 Good for 10,000 - 14,000 ft depth. Used for moderate to high sulphate resistance and high temperatures and pressures.
F 230 - 320 Good for 10,000 - 16,000 ft depth. Used for moderate to high sulphate resistance and extremely high temperatures and pressures.
G 80 - 200 Good for 0 - 8,000 ft depth. Used for moderate to high sulphate resistance. Has improved slurry acceleration and retardation.
H 80 - 200 Same as class G.
2.1.1 New Cements vs. Conventional Well Cements
Special situations call for innovative actions; the need to drill deeper and produce oil and
gas under HPHT environments has motivated drilling engineers to come up with what is
regarded as “designer” or “supercement” systems which are actually conventional

13
cements that are modified so as to improve long term sealing integrity in HPHT wells. In
some cases, these designer cements are non-Portland based. The non-Portland based
cements may include Pozzolanic cements, Epoxy Resin12, geo-polymers, graphite and
fibers (glass, steel) which polymerize at suitable temperatures and/or time to produce a
flexible and mechanically improved cement system. Pozzolanic cements are not actually
cements but react at ordinary temperature with calcium hydroxide in the presence of
moisture to form compounds with cementitious properties.
The modified conventional cement systems include:
expansive cements (e.g. super cement bond log ),
non-shrinking cement systems,
foamed cement,
thixotropic cement, and
POZMIX cement (Pozzolan and Portland cement mix).
Each of these “designer” cements is chosen based on the prevailing well
conditions as the cement for the design of one well may not be appropriate for the design
of another. Investigations12 have been conducted on the effectiveness of these new
cement systems in securing long term integrity for HPHT wells. These have been
conducted using new cement systems which include a Portland based expansive cement
system and a non-Portland based (Epoxy Resin) cement system. According to
experimental results, the expansive cement exhibited good qualities, which makes it a
good candidate for a HPHT scenario. When set, it generates an internal compressive
strength which enables it to counter tensile stresses as opposed to conventional cement
14
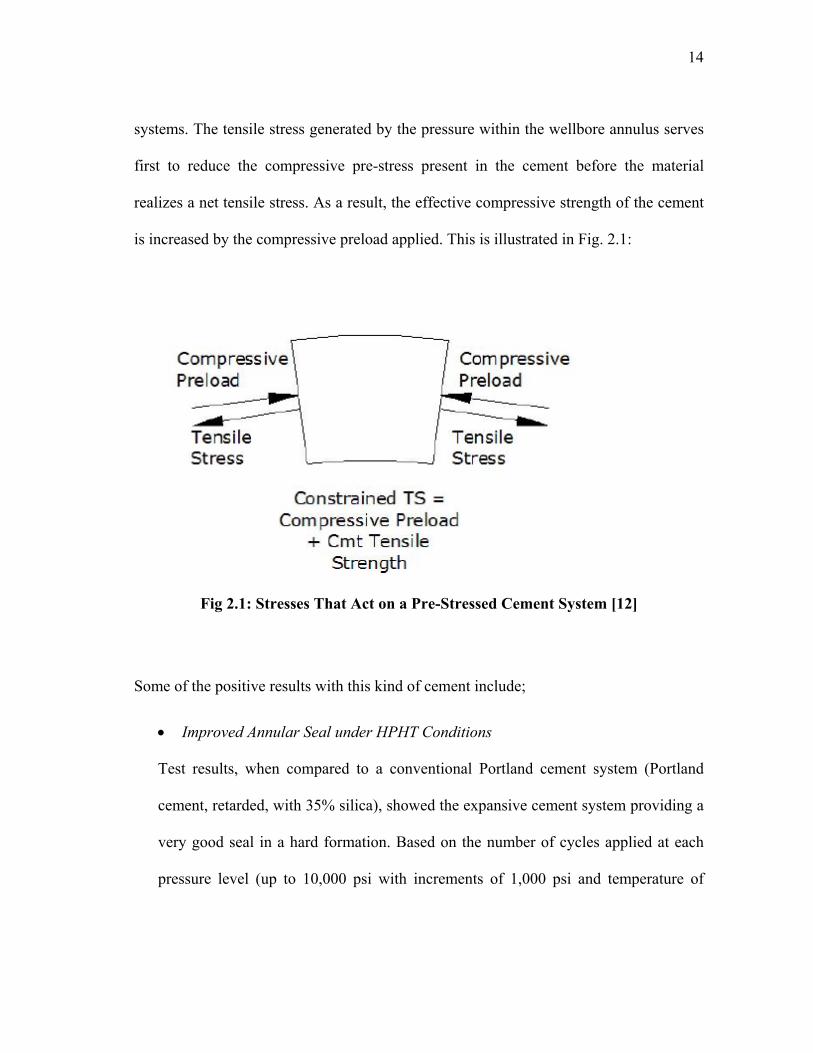
systems. The tensile stress generated by the pressure within the wellbore annulus serves
first to reduce the compressive pre-stress present in the cement before the material
realizes a net tensile stress. As a result, the effective compressive strength of the cement
is increased by the compressive preload applied. This is illustrated in Fig. 2.1:
Fig 2.1: Stresses That Act on a Pre-Stressed Cement System [12]
Some of the positive results with this kind of cement include;
Improved Annular Seal under HPHT Conditions
Test results, when compared to a conventional Portland cement system (Portland
cement, retarded, with 35% silica), showed the expansive cement system providing a
very good seal in a hard formation. Based on the number of cycles applied at each
pressure level (up to 10,000 psi with increments of 1,000 psi and temperature of
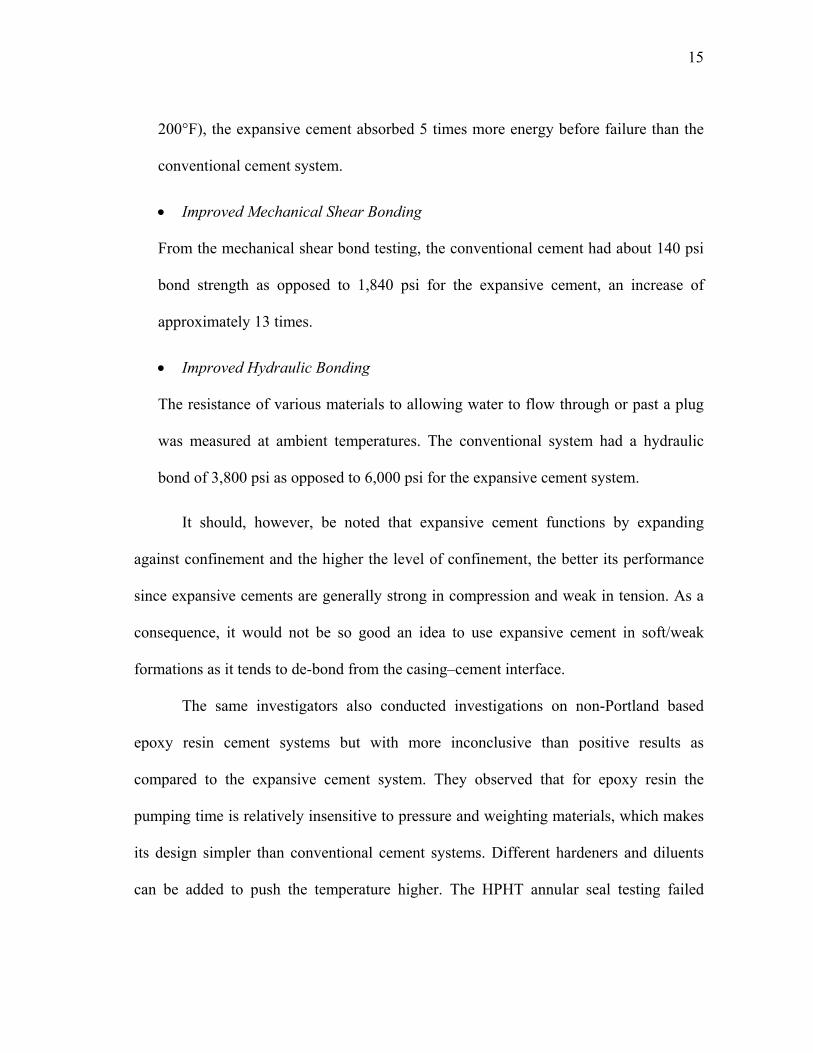
15
200°F), the expansive cement absorbed 5 times more energy before failure than the
conventional cement system.
Improved Mechanical Shear Bonding
From the mechanical shear bond testing, the conventional cement had about 140 psi
bond strength as opposed to 1,840 psi for the expansive cement, an increase of
approximately 13 times.
Improved Hydraulic Bonding
The resistance of various materials to allowing water to flow through or past a plug
was measured at ambient temperatures. The conventional system had a hydraulic
bond of 3,800 psi as opposed to 6,000 psi for the expansive cement system.
It should, however, be noted that expansive cement functions by expanding
against confinement and the higher the level of confinement, the better its performance
since expansive cements are generally strong in compression and weak in tension. As a
consequence, it would not be so good an idea to use expansive cement in soft/weak
formations as it tends to de-bond from the casing–cement interface.
The same investigators also conducted investigations on non-Portland based
epoxy resin cement systems but with more inconclusive than positive results as
compared to the expansive cement system. They observed that for epoxy resin the
pumping time is relatively insensitive to pressure and weighting materials, which makes
its design simpler than conventional cement systems. Different hardeners and diluents
can be added to push the temperature higher. The HPHT annular seal testing failed
16
laboratory investigations but was successful in field trials, and this led the investigators
to conclude that more tests and observation are necessary to understand the mechanism
of sealing using epoxy resin. The mechanical shear bond, however, was both high and
constant, and seems to be due to the material folding up and mechanically resisting the
imposed motion of the tubulars.
Foamed cement has also been employed to solve difficult HPHT well integrity
problems. This can be seen in the case of Shearwater field 1 13, 2. The presence of higher
than anticipated B annulus pressures in wells drilled at the Shearwater field in the East
Central Graben area of the North Sea resulted in serious concerns about the long term
integrity of the wells. The field is regarded as a HPHT well with initial reservoir
temperature and pressure of 360°F and 15,200 psi, respectively at 17,900 MD. The
unusually high B annulus pressures were more likely a result of:
the formation of micro annuli between the cement /formation interface, and
contamination of the cement by flowing hydrocarbons from tight crystalline
limestone within the surrounding formation.
The Shearwater field team proposed the use of a foamed cement system citing the
following advantages:
Improved Mud Displacement, Expansive Properties and Fluid Loss
Compared to conventional cement systems, foamed cement possesses superior mud
removal properties, has less overall fluid loss and compensates for shrinkage
common with conventional cement systems.

17
Improved Ductility
Compared to conventional systems, foamed cements are more flexible and possess
the ability to withstand both high temperature and high pressure cycling-induced
stresses.
High Tensile Strength
The high tensile strength of foamed cement would make it more resistant to tensile
cracking.
Economy and Safety
Under a HPHT scenario, foamed cement provides a cost effective life cycle design
even though the initial cost may be higher than that of conventional cement, and it
also reduces health safety and environmental risks.
The use of a foamed cement system proved very effective in dealing with the
Shearwater field problems. However, it was pointed out that a comprehensive analysis is
required to assess the risk of damage to the cement sheath due to downhole well events.
It was also suggested that cement systems should be pre-tested in a laboratory to ensure
that they meet the requirements determined by the analysis.
2.2 Cement Additives
Depending on downhole conditions, certain qualities may be required of the cement used
in completing the well. Additives when added to the Portland cement base could be used
to achieve the desired qualities. They could also be used to extend the properties of the
18
base cement. For instance, with additives, Portland cement may be modified to sustain
very high temperatures up to 700°F and large pressures up to 30,000 psi.
Some of the most commonly used additives in oil field cementing include:
Accelerators
These are cement additives that generally tend to reduce the thickening time of
cement slurry and increase the rate of development of compressive strength. Since
the hydration process, which results in the setting of cement, occurs at a faster rate at
higher temperatures, the setting of cement might be a problem while cementing wells
drilled in areas of low temperatures and also result in long waiting times. To counter
such, accelerators like CaCl2, NaCl, sodium silicate, sea water, etc are used to speed
up the thickening time.
Retarders
Retarders are the opposite of accelerators as the name suggests. They act to increase
the thickening time of cement slurry. They are mostly lignosulfonates, which are
polymers derived from wood pulp. Examples include calcium, sodium and
chemically modified lignosulfonates.
Weighting Agents
These are added to cement to increase the density of the final cement mix. They are
very important when designing wells with high temperature and high pressure
conditions in order to give the base cement more strength to sustain high pressures
19
and also to prevent strength retrogression at high temperatures. Examples include
ilmenite (FeTiO3), hematite (Fe2O3) and barite (BaSO4).
Fluid Loss Control Agents
This set of additives prevents phase separation under downhole temperature and
pressure conditions. Such a separation would result in fluid being lost to the
formation. They are usually synthetic polymers.
Extenders
This set of additives helps to lower the density of the cement mix. Examples include
bentonite, pozzolans, microspheres, sodium silicates, etc.
Other additives include dispersants and lost circulation control agents.
2.3 Well Cementing Design Process
The drilling and completion of a well is a capital project that runs into millions of
dollars. Hence it is necessary to have a comprehensive design of the cement used for
completion of a particular well and also to avoid remedial cement work which would
add extra cost to the project. Cement design is usually streamlined to a particular well
according to prevailing downhole conditions, which is ensured by testing in the lab to
determine if the design would be satisfactory.
Ravi and Xenakis 14 discussed a three-step approach to cement design. Step one
involves a detailed engineering analysis. It requires identifying the nature of the
formation - is it a hard or a loose formation? It requires identifying all forces that would
come into play as the well is being produced - are there high temperatures, high
20
pressures or both? Is it normally or abnormally pressured? Step one also includes static
and fatigue loading analysis to determine if the cement sheath would sustain the series of
cyclic loads it would encounter during its lifetime. The answers to step one questions
lead to step two. which involves designing the cement slurry based on factors identified
in step one. Here properties of the cement like tensile strength, Young’s modulus,
Poisson’s ratio, plasticity parameters, shrinkage/expansion during hydration, and post-
cement slurry hydration are chosen so as to effectively match the effects of downhole
conditions. Thereafter, laboratory investigations are conducted on the designed slurry.
The data from the laboratory tests and the analysis of step one are then analyzed
together to evaluate performance. Step three involves adhering to best drilling and
cementing practices, such as centering the casing and effectively cleaning out the hole of
all mud so as not to undermine the performance of the designed slurry. It also involves
monitoring during the life of the well. Fig.2.2 below summarizes the design process.

21
Step 1 Engineering Analysis
- Effect of well operations on cement sheath integrity
- Evaluate properties of cement sheath to reduce the risk of failure
Step 2 Cement Slurry Design & Testing
- Lab tests—thickening time, mechanical properties
- Other tests—wettability, hole cleaning and slurry placement
- People, equipment, quality process, HSE - Cement sheath evaluation, monitoring,
learning, improvement
Step 3 Deployment and Monitoring
Fig 2.2: Three-step Process for Cement Design [14]
2.4 Cement Integrity Issues Due to Temperature and Pressure
Knowledge of the stress and deformation fields in the vicinity of a HPHT well is very
critical in evaluating its structural capability. A combination of large temperature ranges
and high pressure variations exerts excessive load between the protection casing strings
and ultimately on the cement sheath. Studies have been conducted on the effects of high
temperature or high pressure or both on well integrity. Some studies describing such
efforts are presented below.
22
2.4.1 Effect of High Temperature
Case Study 1
Very high temperatures change the crystalline structure of cement. Stiles 15 conducted
studies to investigate the effect of ultra-high temperatures on the mechanical properties
of cement. Five different cement formulations were exposed to a high temperature of
645°F and the variations of the Young’s modulus, tensile strength and Poisson’s ratio of
these cement systems at this temperature (and pressure of 2,133 psi) were observed over
a 2-year period. The cement systems used are described below:
System 1 – Conventional (Class G) cement system with 40% BWOC silica flour,
4.3% BWOC gypsum, fluid loss control additive and CaCl2 accelerator.
It was mixed at 15.4 lb/gal.
System 2 – A low density thixotropic cement system with 92% Class A cement
with 40% BWOC silica flour, 8% gypsum, fluid loss control additive
and CaCl2 accelerator and mixed at 14.5 lb/gal.
System 3 – A foamed cement system of density 11.65 lb/gal with Class G cement
(with 40% BWOC silica flour) as base slurry, a surfactant additive with
26% gas production by volume. It was mixed at 15.8 lb/gal.
System 4 – High strength low density cement of density 11.65 lb/gal, containing
hollow ceramic microspheres designed with maximized solid volume
fraction technique with silica content in excess of 40% BWOC and with
added fluid loss control additive and CaCl2 accelerator.
23
System 5 – A flexible and expanding low density cement system of density 12.5
lb/gal containing flexible solid particles and an MgO base expanding
agent designed with maximized solid volume fraction technique similar
to system 4. The flexible particles were added at 50% BVOB.
From the analysis of the experimental data, it was observed that the conventional
and foamed cement systems exhibited brittleness after curing at 645°F while other
systems possessed mechanical parameters (low Young’s modulus and high tensile
strength) that are as good as or better than the flexible blends. From this study it can also
be deduced that the ratio of tensile strength to Young’s modulus gives an indication of
resistance to failure under tension. The thixotropic cement and the flexible cement had
the highest tensile strength to Young’s modulus ratio.
2.4.2 Combined Effect of Temperature and Pressure
The combined presence of high temperatures downhole with high pressure loads leads to
excessive pressure loading in annuli of the casing strings. The pressure load may be a
result of an increase in pressure around the wellbore region due to pressure integrity
tests, increase of mud weight, casing perforation, stimulation, gas production, etc and
these effects can result in considerable damage to the mechanical properties of the
cement sheath. Godwin and Crook16 observed that failure in the cement sheath due to
excessive pressure would normally occur in the bottom one-half to three-quarters of the
casing string, while failure due to excessive temperature would normally occur in the
upper one-fourth to two-thirds of the casing string.

24
Case Study 2
Godwin and Crook16 investigated the effects of high temperatures and excessive annulus
pressure using laboratory experiments and field trials. They circulated hot oil at a
temperature of 350°F through the annulus of the test specimen while gradually
increasing the pressure up to 10,000 psi with 2,000 psi increments using the following
cement systems:
System 1 – Cement/siliceous material mixture system with 30% BWOW latex,
1.25% fluid loss control additive and 0.5% gelling agent. It was mixed
at 12.1 lbm/gal with 10.81 gal mix water/sack. The yield was 2.49
ft3/sack. Compressive strength, Young’s modulus and Poisson’s ratio
was 1,000 psi, 0.69 x 10⁶ psi and 0.42, respectively.
System 2 – Cement/Pozzolan mixture system with 30% BWOW latex, 2 gal/sack
fluid loss control additive, 10 lbm silica additive and 0.25% gelling
agent. It was mixed at 13.1 lbm/gal with 6.48 gal mix water/sack. The
yield was 1.76 ft3/sack. Compressive strength, Young’s modulus and
Poisson’s ratio was 2,500 psi, 0.8 x 10⁶ psi and 0.32, respectively.
System 3 – is the same as system 2 but without the latex and it was mixed at 13.1
lbm/gal. Compressive strength, Young’s modulus and Poisson’s ratio
was 2,000 psi, 0.9 x 10⁶ psi and 0.3, respectively.

25
System 4 – Class H cement system with 35% BWOC silica flour mixed at 18
lbm/gal. Compressive strength, Young’s modulus and Poisson’s ratio
was 9,600 psi, 2.4 x 10⁶ psi and 0.11, respectively.
The results indicated a collapse in the crystalline structure of system 1 at
pressures of 8,000 psi and no appreciable change in the permeability of systems 2
through 4 with increasing casing pressures. All the cement systems withstood pressures
of 2,000 psi and fractures were observed at pressures of 4,000 psi with catastrophic
effects after 6,000 psi stress cycles. A microanulus occurred in cement 2 with internal
pressures up to 6,000 psi. System 1 exhibited elastic properties and provided full casing
support until its failure at 6,000 psi. Field trials were also conducted with systems 2, 3
and 4. After being subjected to a 12,150 psi internal casing pressure (casing pressure
plus casing fluid hydrostatic pressure), system 4 failed while system 3 remained intact.
No evaluation logs were run for system 2.
2.4.3 Casing–Cement–Formation Interactions
As the awareness of the need to analyze the structural behavior of the cement is
currently increasing, so does the need for guidelines and quantitative results. This has led
to the use of simple models or the more complex finite element models to analyze the
casing–cement–formation system and the selection of the cement based on the results of
this analysis. Fleckenstein et al.17 propose finite element analysis as the best way to
analyze the casing–cement–formation properties during the design phase. This proposal
has been corroborated by others 18, 19, 20, 21.

26
Finite element methods offer a means of effectively modeling pressure and
temperature effects. Utilizing computer programs, analysis of the stress situation
downhole can be achieved in multiple dimensions by partially discretizing the system
and solving the problem using FEA. With FEA, stress variations at different points along
the cement sheath radius can be effectively modeled. Several studies 18, 19, 20, 21 show how
finite element analysis was effectively used to model HPHT wells in order to understand
and overcome cement sheath failure problems. Ravi et al 22 caution that cement which
may be suitable under one set of conditions may not be suitable under a different set of
conditions. Thus, a rigorous design procedure using finite element analysis should be
used to select the cement system that will satisfy each specification.
Case Study 3 - Casing–Cement Interactions
Fleckenstein et al.17 used finite element analysis to investigate the role that mechanical
properties of the cement plays in withstanding the internal casing pressure. They
modeled a cemented wellbore with two cement systems - a soft and hard cement. The
soft (ductile) cement had a high Poisson’s ratio and low modulus of elasticity and the
hard (brittle) cement had a low Poisson’s ratio and relatively high modulus of elasticity.
The hard cement was Class H cement mixed with 35% silica flour at 18 ppg,
with the following mechanical properties: 9,500 psi compressive strength, 2,400,000 psi
Young’s modulus and 0.11 Poisson’s Ratio. The soft cement system was a
cement/siliceous material mixed with 30% latex at 12.1 ppg with 1,000 psi compressive
strength, 690,000 psi Young’s modulus and 0.42 Poisson’s Ratio. These cement systems

27
were also studied by Godwin and Crook16. The results indicated that there is little
difference in the constraining effect of the different cement slurries. However, a
confining stress outside the cement sheath would increase the burst resistance of the
casing.
Fig 2.3: Tangential Stress for Hard and Soft Cement Systems [17]
Case Study 4 - Casing–Cement–Formation Interactions
The confining stress on the cement sheath may come from the formation and its effect on
the cement sheath was also modeled. It was run with a 10,000 psi internal burst pressure
acting upon the inner surface of the 5-½” casing and a 3,000 psi confining stress from
the formation.
The results show reductions in von Mises stress from 6,099 psi to 4,292 psi and
in tangential stress from 894 psi (tension) at the casing outer diameter to -283 psi
28
(compression) at the borehole wall. The investigators noticed a difference in the von
Mises stress that is generated by the hard and soft cement systems. At 1,000 psi, hard
cement generate twice the von Mises stress when compared with the soft cement but this
reduces as the confining stress increases with a reduction of less than 20% at 5,000 psi
confining stress.
From these investigations the authors deduced that radial cracking is less likely to
occur with soft cement systems because hard cement systems are likely to generate
significant tangential stresses (Fig. 2.3), which increases the likelihood of forming radial
cracks in the presence of high internal burst pressures.
It should also be noted 23 that with the use of flexible and expanding cement
systems the stiffness of the formation plays an important role. If the stiffness of the
formation is low (low Young’s modulus) compared to the cement system, de-bonding
and formation of microannulus at the cement casing interface may occur.
29
3. CEMENT FAILURE DUE TO STATIC LOADING
3.1 Analytical Model of Wellbore Stresses
3.1.1 Background
As a result of production operations, a cemented casing is usually subjected to a variety
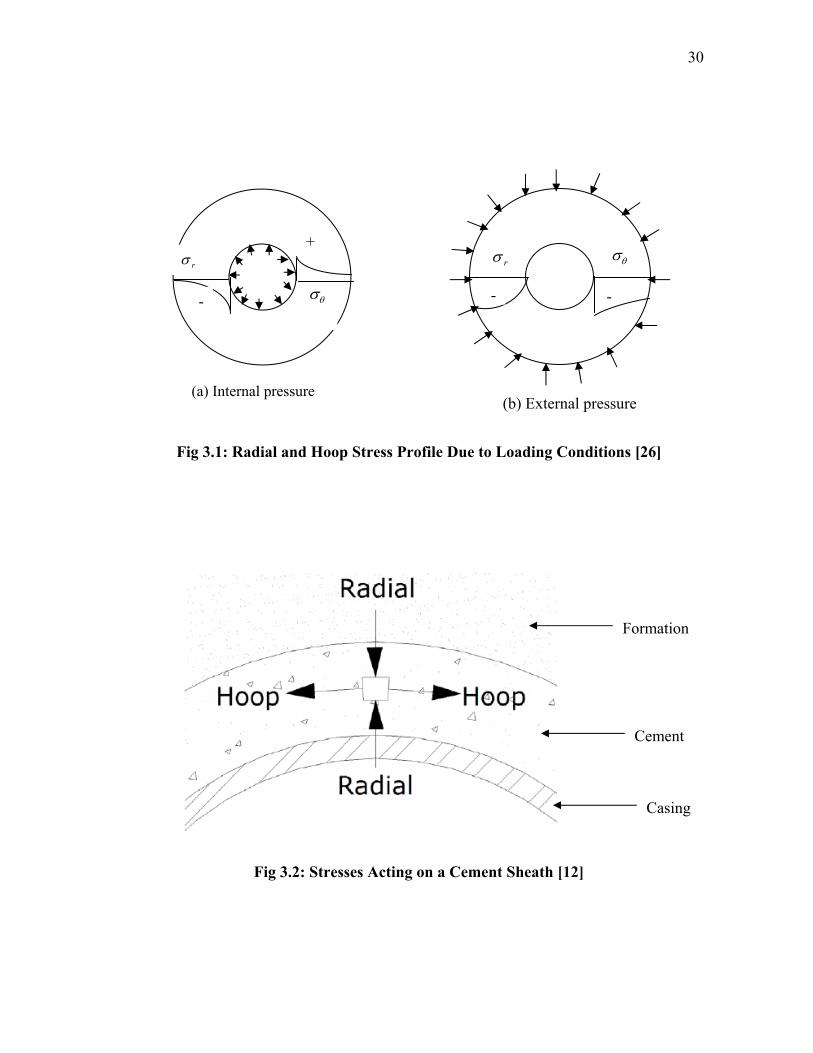
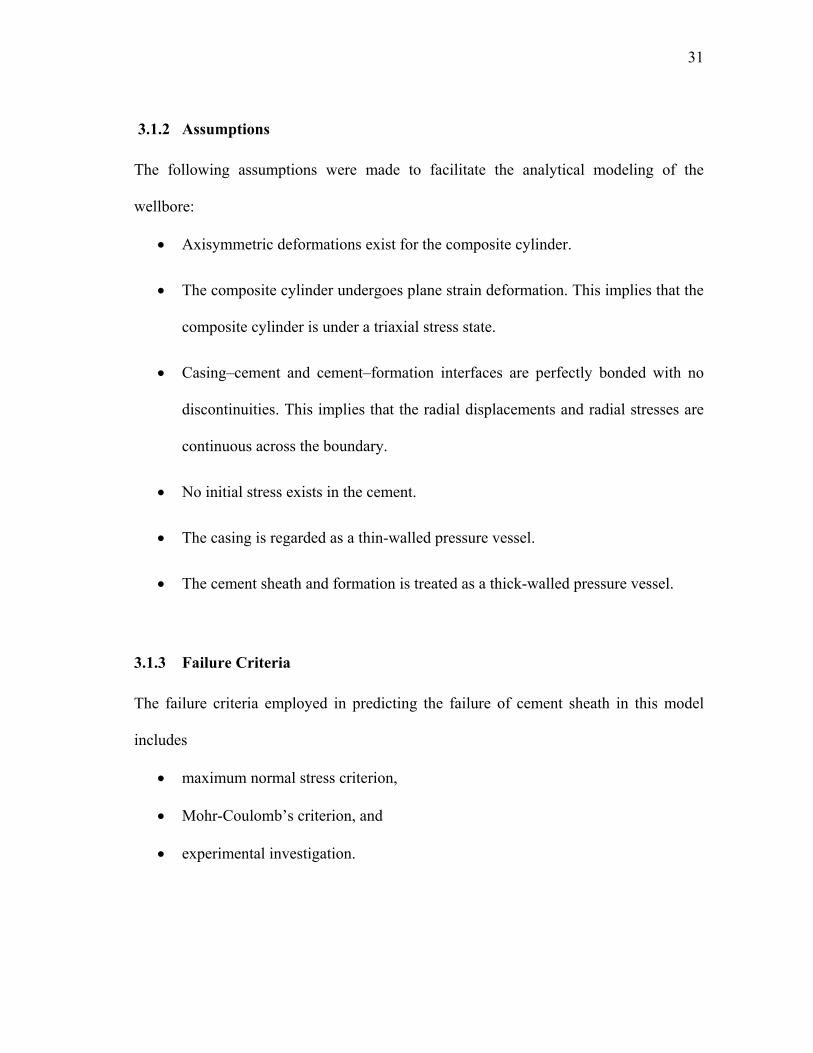
of stresses in the form of cyclic pressure and temperature variations. Figure 3.1 shows
the nature and profile of tangential and radial stresses under different loading conditions.
Considering an infinitesimal element within the cement sheath, these stresses act in a
three-dimensional fashion and the cement sheath can therefore be regarded as being
under a triaxial stress state, as shown in Figure 3.2. The third component (not shown in
the diagram) is the axial stress component which is perpendicular to the two stresses
shown in Figure 3.2. The radial stress is always compressive in nature while the
tangential stress could be tensile or compressive depending on the loading conditions.
The casing–cement–formation set up can be analyzed as a pressurized composite
cylinder with three concentric cylinders. Perfect bonding is assumed to exist between the
cement and casing and between the cement and formation. The pressure and/or
temperature changes induce stress concentrations near the casing–cement and the
cement–formation boundaries.
30
Fig 3.1: Radial and Hoop Stress Profile Due to Loading Conditions [26]
Fig 3.2: Stresses Acting on a Cement Sheath [12]
-
+
(a) Internal pressure (b) External pressure
r
-
r
-
Formation
Cement
Casing
31
3.1.2 Assumptions
The following assumptions were made to facilitate the analytical modeling of the
wellbore:
Axisymmetric deformations exist for the composite cylinder.
The composite cylinder undergoes plane strain deformation. This implies that the
composite cylinder is under a triaxial stress state.
Casing–cement and cement–formation interfaces are perfectly bonded with no
discontinuities. This implies that the radial displacements and radial stresses are
continuous across the boundary.
No initial stress exists in the cement.
The casing is regarded as a thin-walled pressure vessel.
The cement sheath and formation is treated as a thick-walled pressure vessel.
3.1.3 Failure Criteria
The failure criteria employed in predicting the failure of cement sheath in this model
includes
maximum normal stress criterion,
Mohr-Coulomb’s criterion, and
experimental investigation.
32
The maximum normal stress criterion predicts that an isotropic material will fail when
the largest principal stress reaches a limiting value. This implies that failure would occur
when
1 1f
(3.1)
where 1 is the maximum principal stress and f is the limiting stress. If 1 is tensile,
then f is the limiting tensile stress and the other two smaller principal stresses 2 and
3 play no role (with 1 2 3 ). If applied to a compressive stress state, this
criterion becomes
3 1f
(3.2)
where 3 is the magnitude of the minimum principal stress. It is should be noted that
this criterion would be inaccurate if all three principal stresses are compressive.
With Mohr-Coulomb’s criterion, 2 does not play any role and failure is
predicted to occur when
1 3 1tensile compressive
(3.3)
where and are the tensile and compressive strengths, respectively. tensile compressive
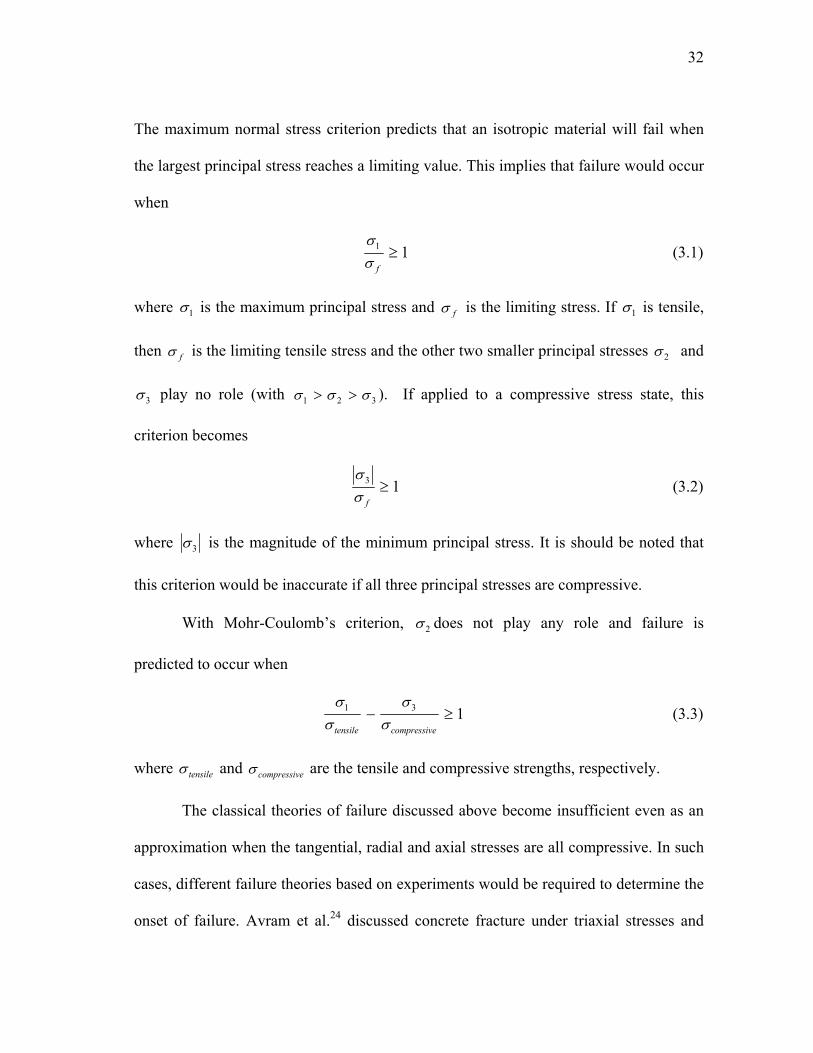
The classical theories of failure discussed above become insufficient even as an
approximation when the tangential, radial and axial stresses are all compressive. In such
cases, different failure theories based on experiments would be required to determine the
onset of failure. Avram et al.24 discussed concrete fracture under triaxial stresses and

33
proposed a new failure criterion given by Eq. (3.4) below which complies with Mohr-
Coulomb’s criterion.
0.86
1 1 3.7c cf
3
f (3.4)
where is the compressive strength of the cement, cf 1 is the major principal
compressive stress at failure and 3 is the minor principal compressive stress with
1 2 3 . Fig 3.3 and Fig 3.4 show the experimental results and failure envelope,
respectively, for concrete under a triaxial compressive state.
Fig 3.3: Concrete Failure Criterion under Triaxial Compressive Stresses [24]
34
Fig 3.4: Failure Envelope for Triaxial Compression and Tensile Stress State [24]
It should be noted that this experimental failure criterion was proposed for plain concrete
and may only give an approximation of failure for well cement.
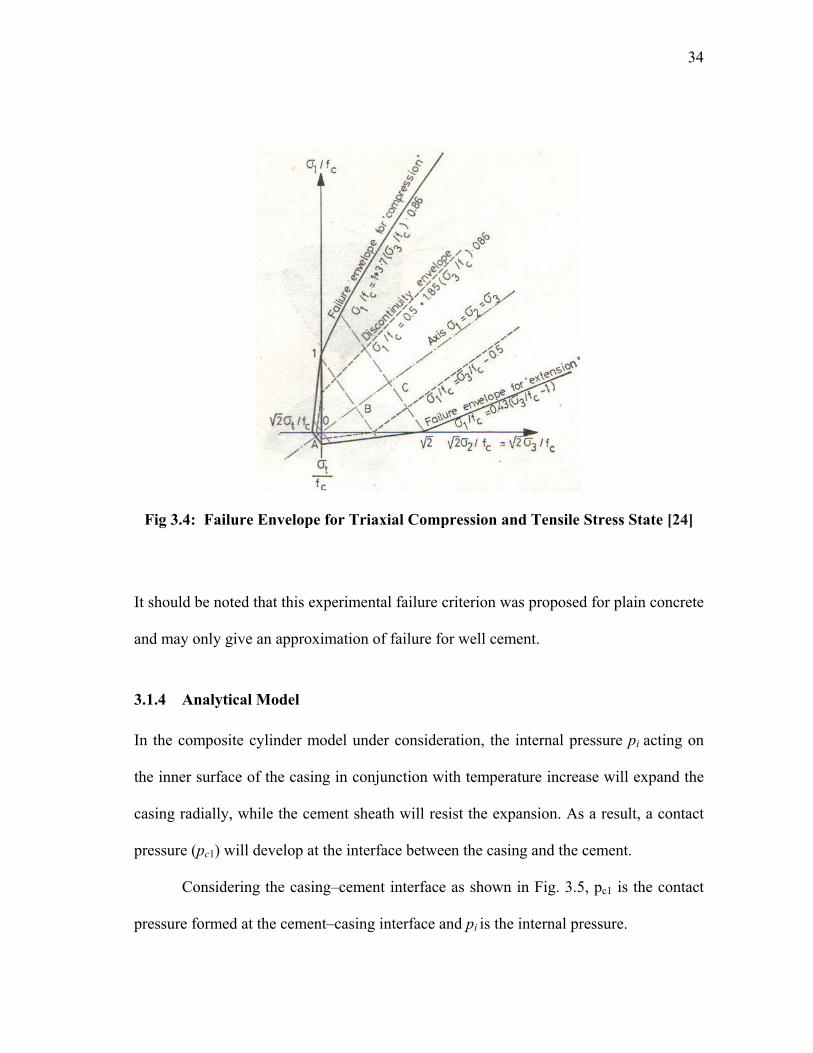
3.1.4 Analytical Model
In the composite cylinder model under consideration, the internal pressure pi acting on
the inner surface of the casing in conjunction with temperature increase will expand the
casing radially, while the cement sheath will resist the expansion. As a result, a contact
pressure (pc1) will develop at the interface between the casing and the cement.
Considering the casing–cement interface as shown in Fig. 3.5, pc1 is the contact
pressure formed at the cement–casing interface and pi is the internal pressure.
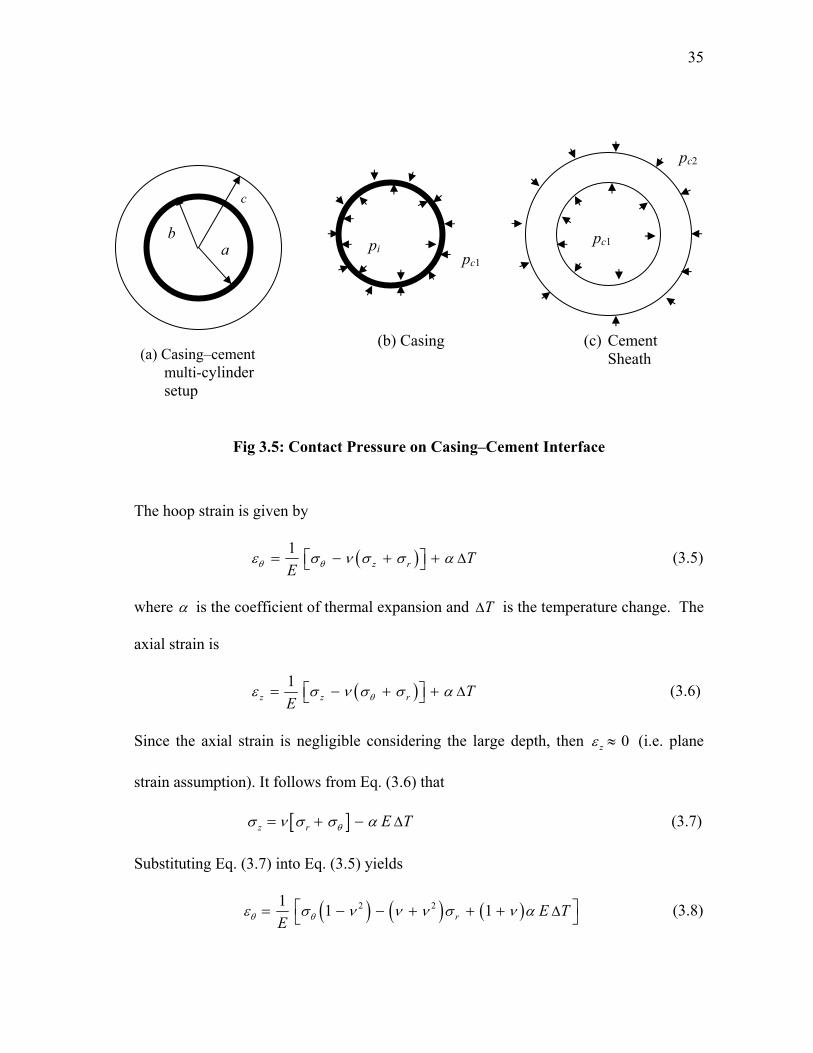
35
Fig 3.5: Contact Pressure on Casing–Cement Interface
The hoop strain is given by
1z r T
E (3.5)
where is the coefficient of thermal expansion and T is the temperature change. The
axial strain is
1z z r T
E (3.6)
Since the axial strain is negligible considering the large depth, then (i.e. plane
strain assumption). It follows from Eq. (3.6) that
0z
z r E T (3.7)
Substituting Eq. (3.7) into Eq. (3.5) yields
2 211 1r E T
E (3.8)
(a) Casing–cmulti-cylindersetup
ement
(b) Casing (c) Cement Sheath
pc1 pi
pc1
pc2
c
b a
36
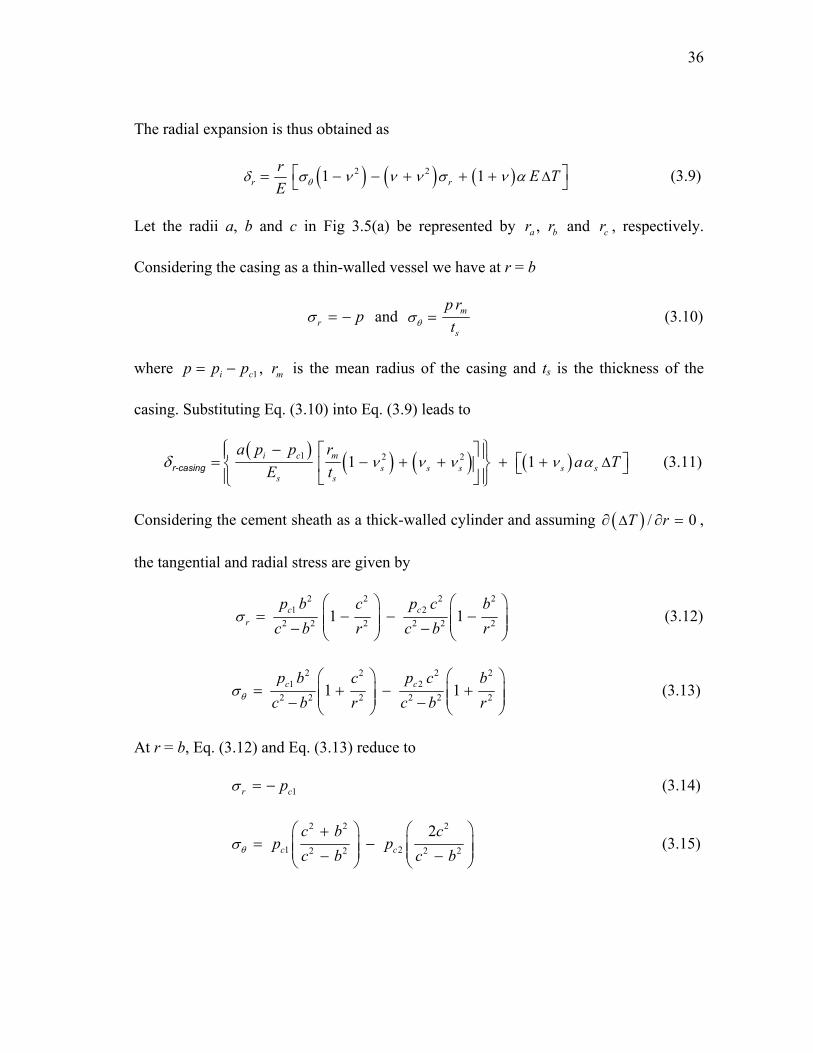
The radial expansion is thus obtained as
2 21 1r r
rE T
E (3.9)
Let the radii a, b and c in Fig 3.5(a) be represented by and , respectively.
Considering the casing as a thin-walled vessel we have at r = b
,ar rb cr
r p and m
s
p r
t (3.10)
where , is the mean radius of the casing and ts is the thickness of the
casing. Substituting Eq. (3.10) into Eq. (3.9) leads to
1ci ppp mr
1 2 21 1i c m
s s s s ss s
a p p ra T
E t
r-casing (3.11)
Considering the cement sheath as a thick-walled cylinder and assuming ,
the tangential and radial stress are given by
/ 0T r
2 2 2
1 2
2 2 2 2 2 21c cr
2
1p b c p c b
c b r c b r
(3.12)
2 2 21 2
2 2 2 2 2 21c c2
1p b c p c b
c b r c b r
c
(3.13)
At r = b, Eq. (3.12) and Eq. (3.13) reduce to
1r p (3.14)
2 2 2
1 22 2 2 2
2c c
c b cp p
c b c b
(3.15)

37
When Eq. (3.14) and Eq. (3.15) are substituted into Eq. (3.9), this gives the radial
expansion in the cement sheath at r = b as
2 2 22 2
1 2 12 2 2 2
21
1
r cement c c c c c cc
c c
b b c cp p p
E c b c b
b T
(3.16)
Since both radial expansions are equal, it follows from Eq. (3.11) & Eq. (3.16) that
2 22 2 2
1 2 2
22 2 2
2 2 2
1 1
21 1
1 1
mc c c c s s s
c s s
i mc c s s s
c s s
s s c c
rb b c ap
E c b E t
a p rb cp
E c b E t
a T b T
2
(3.17)
Eq. (3.17) can be put in the form
1 2c cA p B p C (3.18)
where
2 2
2 2 22 2
1 1mc c c s s
c s s
v v v v vrb b c a
A vE c b E t
2s
(3.19)
2
22 2
21 c
c
vb c
BE c b
(3.20)
2 21 1 1i ms s s s s c c
s s
p a rC v v v a T b
E t T
(3.21)

38
Similarly, considering the cement–formation interface as shown in Fig.3.6, pc2 is the
contact pressure formed at the cement–formation boundary as a result of the confining
pressure from the formation pressure, pf.
pf
Fig 3.6: Operative Stresses on Cement–Formation Interface
Considering the cement sheath and assuming /T r 0 , at r = c,
2r cp (3.22)
2 2
1 22 2 2 2
2c c
b cp p
c b c b
2b
(3.23)
This gives the radial expansion in the cement sheath at r = c when Eq. (3.22) and Eq.
(3.23) are substituted into Eq. (3.9) as
pc2
(c) Formation
pc2
c
b pc1
d
(a) Cement-formation multi-cylinder setup
(b) Cement
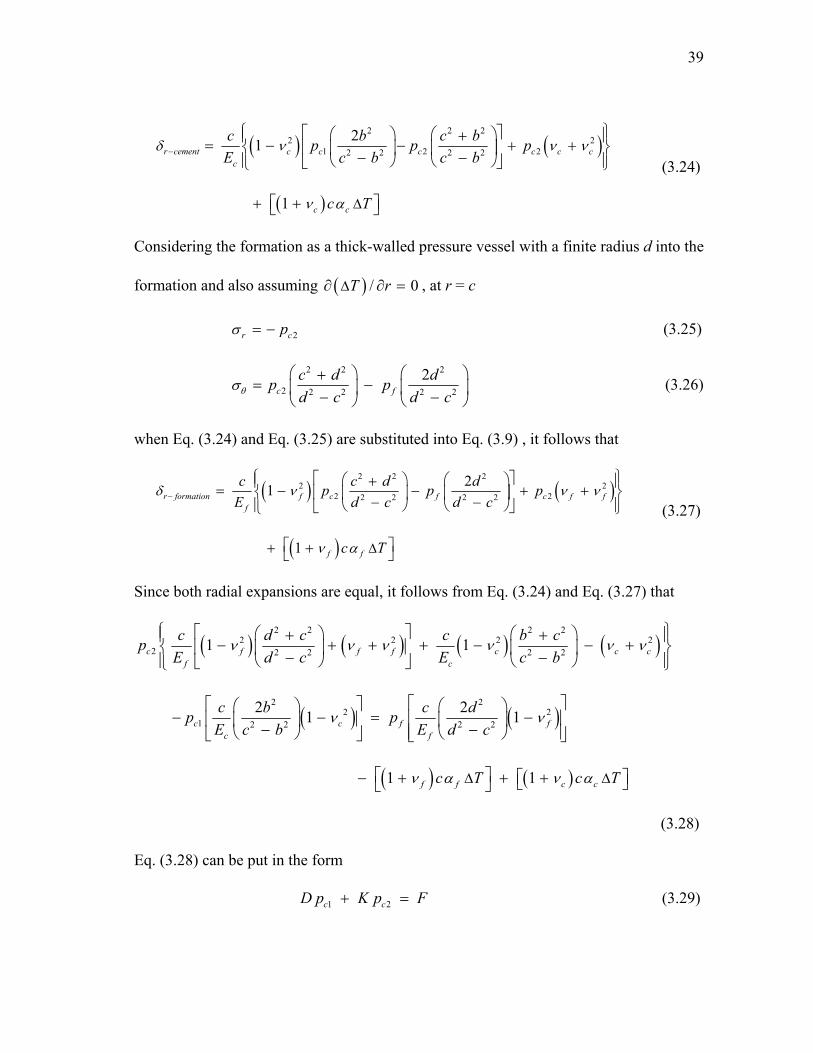
39
2 2 22 2
1 2 22 2 2 2
21
1
r cement c c c c c cc
c c
c b c bp p p
E c b c b
c T
(3.24)
Considering the formation as a thick-walled pressure vessel with a finite radius d into the
formation and also assuming /T r 0
c
, at r = c
2r p (3.25)
2 2 2
2 2 2 2 2
2c f
c d dp p
d c d c
(3.26)
when Eq. (3.24) and Eq. (3.25) are substituted into Eq. (3.9) , it follows that
2 2 22 2
2 22 2 2 2
21
1
r formation f c f c f ff
f f
c c d dp p p
E d c d c
c T
(3.27)
Since both radial expansions are equal, it follows from Eq. (3.24) and Eq. (3.27) that
2 2 2 22 2 2
2 2 2 2 2
2 22 2
1 2 2 2 2
1 1
2 21 1
1 1
c f f f c cf c
c c f fc f
f f c c
c d c c b cp
E d c E c b
c b c dp p
E c b E d c
c T c T
2c
(3.28)
Eq. (3.28) can be put in the form
1 2c cD p K p F (3.29)
40
where
2
22 2
21 c
c
vc b
DE c b
(3.30)
2 2 2 2
2 2 22 2 2 2
1 1f f f c cf c
v v v v vc d c c b c
KE d c E c b
2
cv (3.31)
2
22 2
21 1 1f
f f f cf
vp c d
F c TE d c
cc T (3.32)
From a simultaneous solution of Eq.(3.18) and Eq. (3.29), the contact pressures pc1 and
pc2 are given as
1c
FB KCp
DB AK
(3.33)
2c
FB KCC A
DB AKp
B
(3.34)
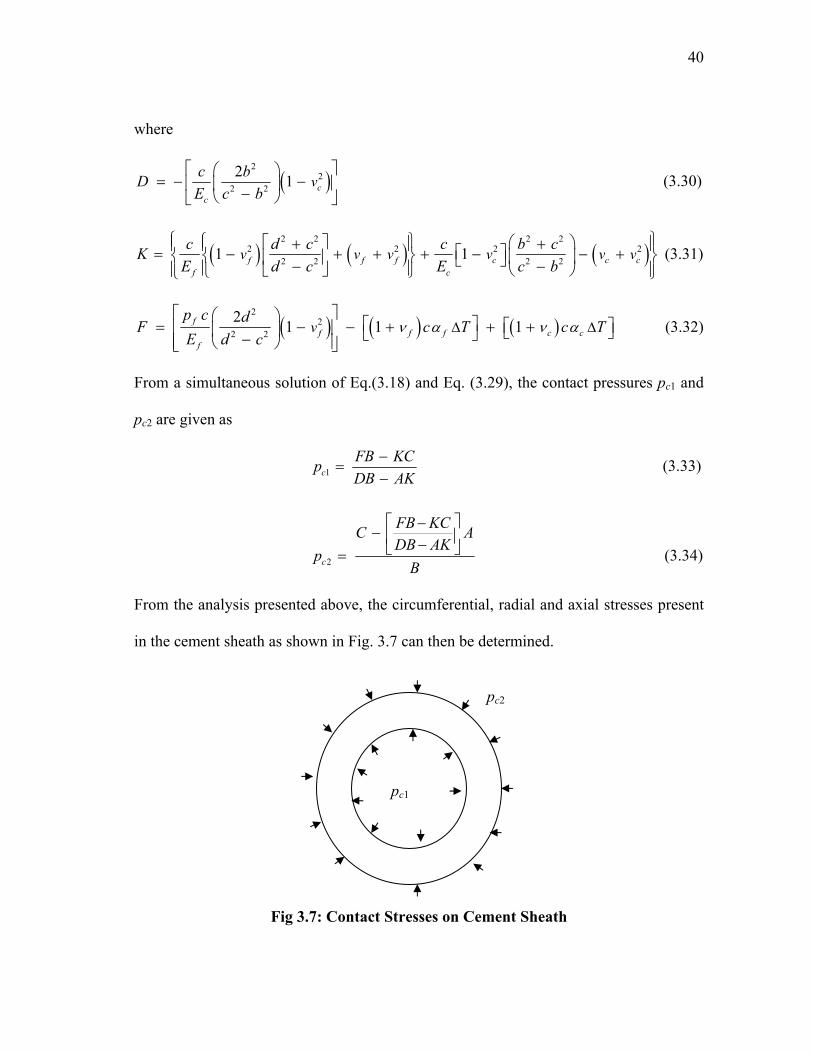
From the analysis presented above, the circumferential, radial and axial stresses present
in the cement sheath as shown in Fig. 3.7 can then be determined.
Fig 3.7: Contact Stresses on Cement Sheath
pc1
pc2
41
The radial, tangential and axial stresses in the cement sheath are then calculated using
the following formulas
2 2 2
1 22 2 2 2 2 21r cement c c
b c cp p
c b r c b r
2
1b
(3.35)
2 2 2
1 22 2 2 2 2 21cement c c
b c cp p
c b r c b r
2
1b
(3.36)
z cement c r E T (3.37)
The maximum shear stress, max , is given by the expression
2 21 2
max 2 2 2
c cp p b c
c b r
(3.38)
At r = b
21 2
max 2 2
c cp p c
c b
(3.39)
At r = c
21 2
max 2 2
c cp p b
c b
(3.40)
The effective stress e in the cement sheath is given by
2 21
2e z r z 2
r (3.41)
42
3.2 Analytical and Finite Element Studies
The analytical model developed above, which gives an insight into the magnitude of the
stress imposed on the cement sheath, is a very powerful and flexible tool which can
enable cement designers to optimize their design and also be able to design effectively
for HTHP conditions. This is possible because it puts into consideration all the
parameters that come into play downhole as the well is produced. A Microsoft Excel
spreadsheet was created using the developed equations above and it was further used in
the analytical and finite element studies presented in below.
The contact pressure at the cement–casing interface pc1 and the contact pressure
at the cement–formation interface pc2 were calculated from equations (3.33) and (3.34)
and equations (3.35) to (3.37) gave the radial, tangential and axial stresses in the cement,
respectively.
The model was also extended to calculate the radial, tangential and axial stresses
in the casing and formation with the following equations:
2 2 2
12 2 2 2 2 21r-casing i c
a b bp p
b a r b a r
2
1a
(3.42)
2 2 2
12 2 2 2 2 21θ-casing i c
a b bp p
b a r b a r
2
1a
(3.43)
z-casing s r E T (3.44)
And for the formation we have
2 2 2
2 2 2 2 2 2 21 1r formation c f
c d dp p
d c r d c r
2c
(3.45)
43
2 2 2
2 2 2 2 2 2 21formation c f
c d dp p
d c r d c r
2
1c
(3.46)
z-formation f r E T (3.47)
Using this model, the response of the cement sheath to different static and fatigue
loading conditions was studied for three cement systems:
Cement System 1 – Ductile cement system with compressive strength of 3,000 psi,
tensile strength of 1,000 psi, a Young’s modulus of 0.69 x 10⁶
psi and a Poisson’s ratio of 0.4;
Cement System 2 – Brittle cement system with compressive strength of 9,500 psi,
tensile strength of 3,000 psi, a Young’s modulus of 2.4 x 10⁶ psi
and a Poisson’s ratio of 0.1;
Cement System 3 – A low Young’s modulus and a low Poisson’s ratio cement system
with compressive strength of 2,500 psi, tensile strength of 1,000
psi, a Young’s modulus of 1 x 10⁶ psi and a Poisson’s ratio of
0.25.
These cement systems will be studied for the following cases:
Scenario 1 – well pressure: 15,000 psi, formation pressure: 1,000 psi;
Scenario 2 – well pressure: 15,000 psi, formation pressure: 0 psi;
Scenario 3 – well pressure: 4,000 psi, formation pressure: 10,000 psi.
Other parameters used as inputs to the model include:
Temperature change, ΔT: 150°F
Casing Young’s modulus, Es, and Poisson’s ratio, νs : 2.9 x 10⁷ psi and 0.3
44
Shear bond strength of cement: 1,000 psi
Casing outer diameter, b: 9.625 in
Casing wall thickness, ts: 0.545 in
Casing inner diameter, a: 8.535 in
Cement wall thickness: 2.125 in
Formation outer diameter, d: 20 in
Formation Young’s modulus, Ef, and Poisson ratio, νf : 3 x 10⁶ psi and 0.42
Density of cement mix: 14 lb/gal
Cement expansion coefficient, αc: 0.000006 in/ °F
The finite element analysis was done with ANSYS workbench 11.0 and since the
casing–cement–formation is axisymetric a single quadrant was used for the 2D
modeling.
To validate the analytical model, the analytical results and finite element
simulations were compared. For the finite element analysis, an internal pressure of
15,000 psi was applied inside the casing with no formation pressure. The meshing was
done with 6,648 elements and 20,607 node density. Plane strain state was assumed. The
boundary conditions applied include
displacement U = 0, τxy = 0 on X = 0;
displacement V = 0, τyx = 0 on Y= 0 ;
r ip on r = a;
r fp on r = d.

45
The casing–cement–formation model was also assumed fully bonded with no separation
at the boundaries.
Figure 3.8 shows the distribution of equivalent von Mises stress under the
loading condition described above and Figure 3.9 below compares the analytical values
for von Mises equivalent stress with those from the finite element analysis. The
analytical and finite element values were close with an error of about 1%.
Fig 3.8: Equivalent Stress for Casing–Cement–Formation Model with Meshing

46
5000
5500
6000
6500
7000
7500
8000
8500
9000
4.5 4.7 4.9 5.1 5.3 5.5 5.7 5.9
Radius(inches)
Eq
uiv
alen
t st
ress
FEA
Analytical
Fig 3.9: Equivalent Stress Comparison For Analytical and FEA Models
3.3 Fatigue Studies
To study the fatigue of the cement sheath, finite element analysis was utilized. The
fatigue properties of concrete were used for this analysis. Such properties include S-N
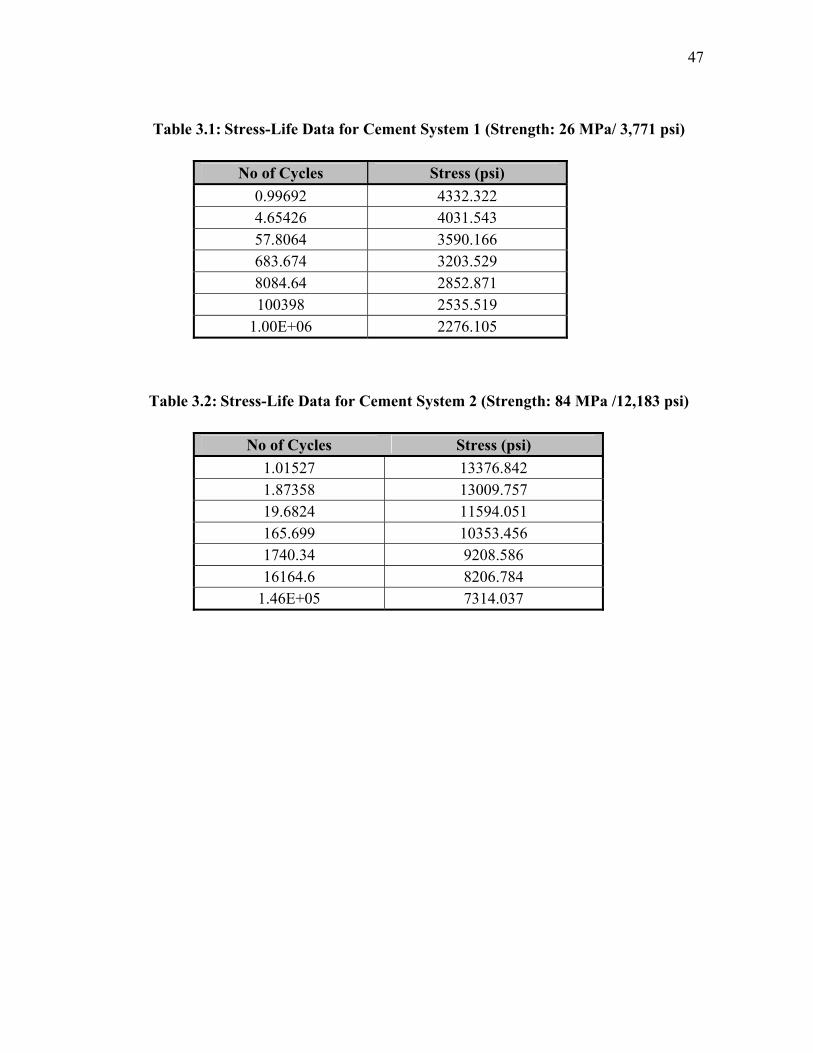
curves, strain-life curves and stress-strain curve. Tables 3.1 and 3.2 give the fatigue
material data used in the finite element modeling for cement systems 1 and 2 based on
data extracted from Fig.1.3. The fatigue life for the cement systems will be predicted
from these curves using ANSYS. The S-N curve is shown in Fig.3.10.
47
Table 3.1: Stress-Life Data for Cement System 1 (Strength: 26 MPa/ 3,771 psi)
No of Cycles Stress (psi)
0.99692 4332.322 4.65426 4031.543 57.8064 3590.166 683.674 3203.529 8084.64 2852.871 100398 2535.519
1.00E+06 2276.105
Table 3.2: Stress-Life Data for Cement System 2 (Strength: 84 MPa /12,183 psi)
No of Cycles Stress (psi)
1.01527 13376.842 1.87358 13009.757 19.6824 11594.051 165.699 10353.456 1740.34 9208.586 16164.6 8206.784
1.46E+05 7314.037

48
Fig 3.10: S-N Curve for Fatigue Analysis in ANSYS
Newman and Choo 25 gave a relationship between the number of cycles to failure
and the load ratio derived through experimental studies for concrete with densities
greater than 12.5 lb/gal as
.max101 0.0685(1 ) logc
c
fR N
f (3.48)
where is the maximum compressive stress of the cyclic loading, max.cf
is the compressive strength of the concrete, cf
R is the stress ratio .max
.min
c
c
ff , and
N is the number of cycles to failure.

49
The fatigue properties of the cement sheath were also studied under two loading
conditions:
cyclic loading at the casing coupling, and
cyclic loading within the casing annulus.
These loading conditions, shown in Fig. 3.11 below, represent a cyclic loading condition
due to shear at the coupling and that due to the internal and formation pressure on areas
where there are no couplings.
pi po
Casing
Casing Coupling
Cement
a) Cement sheath under shear at coupling
b) Cement sheath under pi and po
Fig 3.11: Cyclic Loading Conditions for the Cement Sheath

50
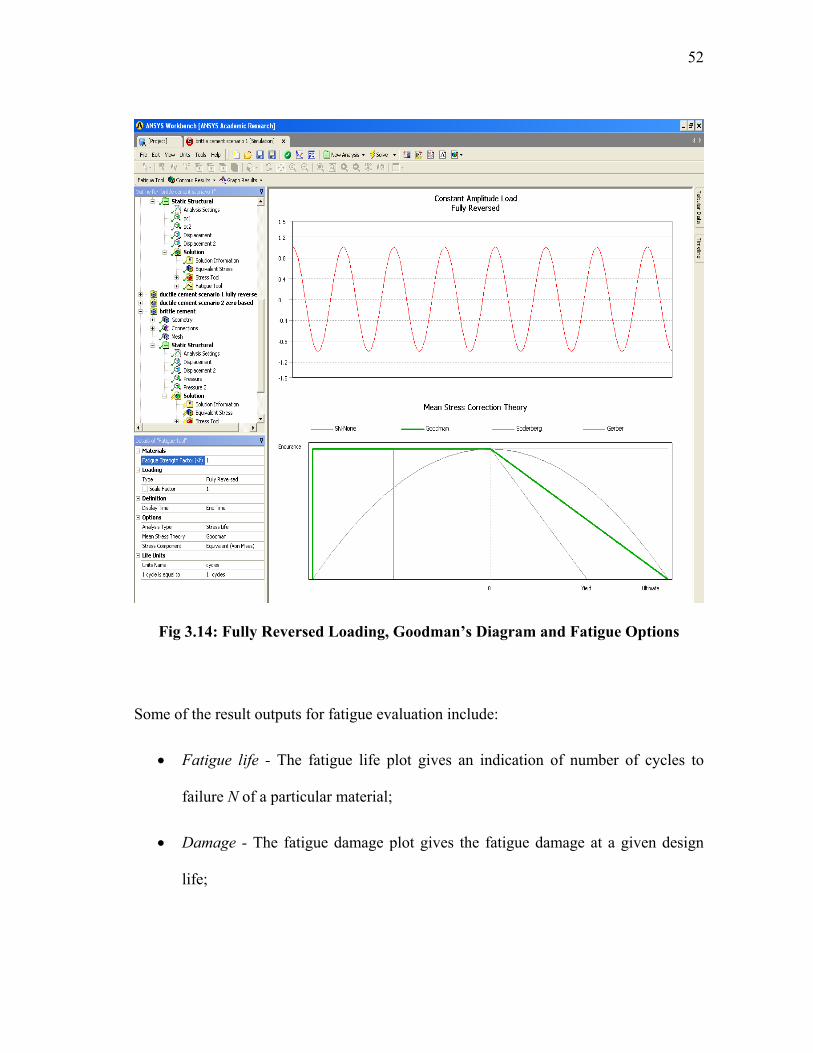
For both cases a constant amplitude loading condition is assumed. A fully
reversed loading is also assumed while modeling the fatigue behavior of the cement
under shear cyclic loading while a zero based (compression) loading is assumed for the
internal and external pressures. The Goodman diagram for fatigue analysis was chosen
as it gives a good description of the fatigue behavior of brittle materials. Figure 3.12
shows the Goodman diagram. Figures 3.13 and 3.14 present the different loading
conditions and options available with ANSYS.
Fig 3.12: Goodman Diagram for Brittle and Ductile Materials [26]
According to the Goodman diagram, for brittle materials;
1a m
fs u S F
(3.49)

51
where SF is the safety factor and
max min
2m
(3.50)
max min
2a
(3.51)
Fig 3.13: Zero Based Loading, Goodman’s Diagram and Fatigue Options
52
Fig 3.14: Fully Reversed Loading, Goodman’s Diagram and Fatigue Options
Some of the result outputs for fatigue evaluation include:
Fatigue life - The fatigue life plot gives an indication of number of cycles to
failure N of a particular material;
Damage - The fatigue damage plot gives the fatigue damage at a given design
life;
53
Factor of safety – This gives the factor of safety SF with respect to fatigue failure
at a given design life;
Fatigue sensitivity – This plot gives an indication of how loading conditions
affect the fatigue performance of the material.
The Excel spreadsheet shows how fatigue equations can be linked to the analytical
model to predict the fatigue life of the cement sheath under cyclic loading. Equations
(3.41) to (3.44) were linked to the results from the analytical model but the idea was
abandoned when the values from the proposed fatigue model did not match the finite
element results. It should be noted that equations (3.48) to (3.51) were developed for
structural concrete (from literature reviewed) which necessitates such equations to be
developed for well cement.
54
4. RESULTS AND DISCUSSION
4.1 Static Studies
Case Scenarios without the Effect of Temperature Change
To understand the effect of static loading on the integrity of cement sheath, the analytical
model and finite element analysis were used to examine the responses of different
cement systems subjected to different magnitudes of internal pressure and formation
pressure as described in the previous chapter. The temperature change was neglected and
the analytical model was used to show the trends in the von Mises equivalent, tangential
and axial stresses in the cement sheath for the three cement systems.
1. High Inner Pressure and Low Formation Pressure
With an inner pressure of 15,000 psi and a formation pressure of 1,000 psi, the finite
element model gives us an idea of the amount of stress generated within the steel casing
and the actual amount transferred to the cement sheath through the casing–cement
interface. The same can also be said of the transfer of stresses from the formation to the
cement sheath through the cement–formation interface. Figures 4.1 and 4.2 show the
trend for von Mises stress using cement system 2, for separate cases that have the same
mechanical properties for the steel casing but different formation properties. From the
diagrams, it is evident the amount of support the steel casing provides the cement sheath.
In Fig. 4.1, the equivalent stress within the casing decreases non-linearly from 84,178 psi
to 66,784 psi. At the casing–cement interface, there is a large decrease from 66,784 to
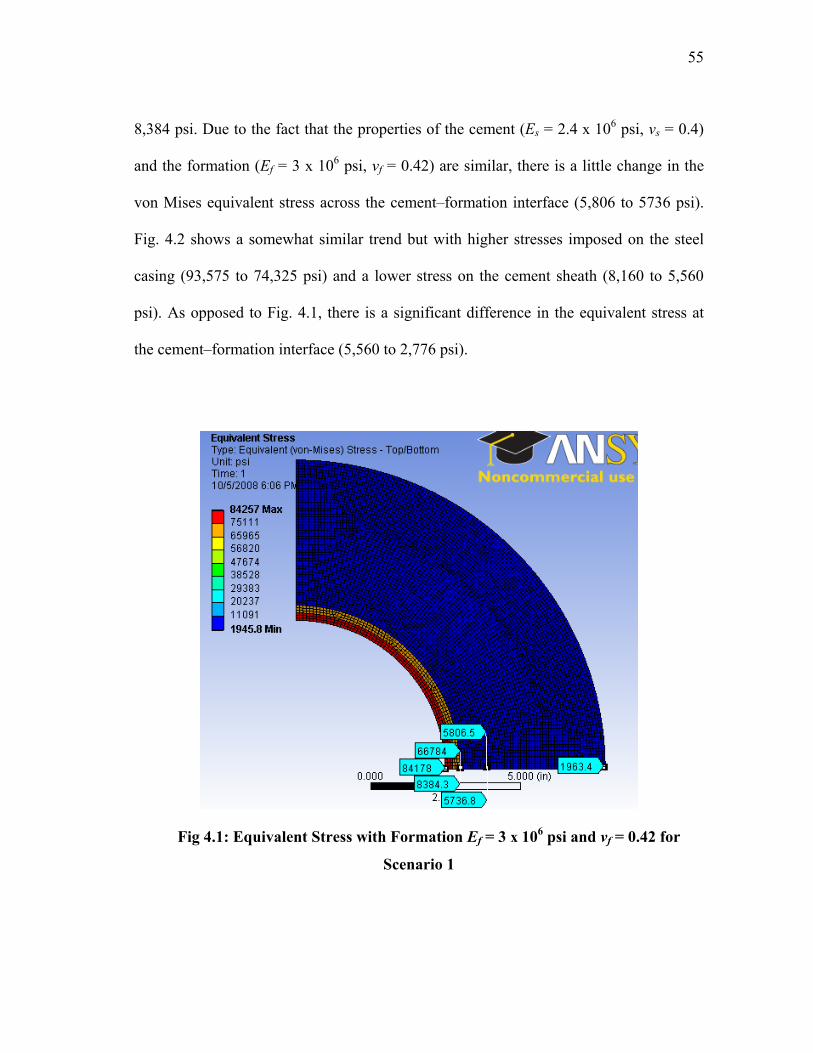
55
8,384 psi. Due to the fact that the properties of the cement (Es = 2.4 x 10⁶ psi, νs = 0.4)
and the formation (Ef = 3 x 10⁶ psi, νf = 0.42) are similar, there is a little change in the
von Mises equivalent stress across the cement–formation interface (5,806 to 5736 psi).
Fig. 4.2 shows a somewhat similar trend but with higher stresses imposed on the steel
casing (93,575 to 74,325 psi) and a lower stress on the cement sheath (8,160 to 5,560
psi). As opposed to Fig. 4.1, there is a significant difference in the equivalent stress at
the cement–formation interface (5,560 to 2,776 psi).
Fig 4.1: Equivalent Stress with Formation Ef = 3 x 10⁶ psi and νf = 0.42 for
Scenario 1
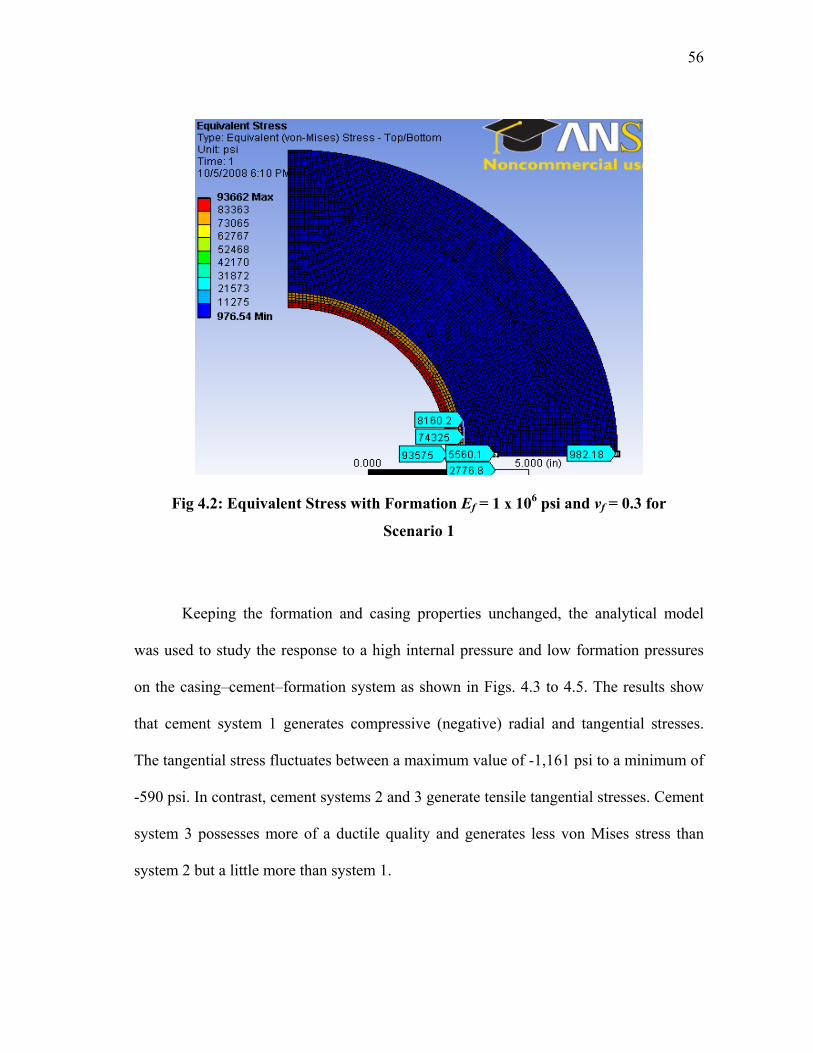
56
Fig 4.2: Equivalent Stress with Formation Ef = 1 x 10⁶ psi and νf = 0.3 for
Scenario 1
Keeping the formation and casing properties unchanged, the analytical model
was used to study the response to a high internal pressure and low formation pressures
on the casing–cement–formation system as shown in Figs. 4.3 to 4.5. The results show
that cement system 1 generates compressive (negative) radial and tangential stresses.
The tangential stress fluctuates between a maximum value of -1,161 psi to a minimum of
-590 psi. In contrast, cement systems 2 and 3 generate tensile tangential stresses. Cement
system 3 possesses more of a ductile quality and generates less von Mises stress than
system 2 but a little more than system 1.
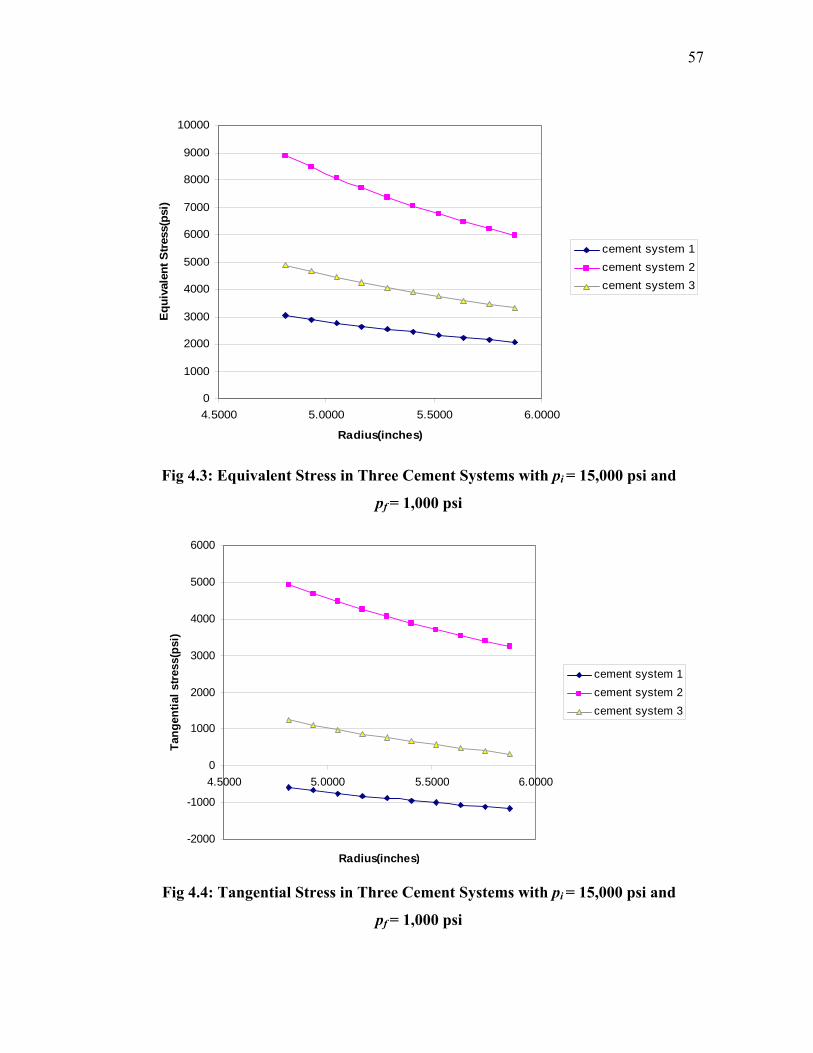
57
0
1000
2000
3000
4000
5000
6000
7000
8000
9000
10000
4.5000 5.0000 5.5000 6.0000
Radius(inches)
Eq
uiv
alen
t S
tres
s(p
si)
cement system 1
cement system 2
cement system 3
Fig 4.3: Equivalent Stress in Three Cement Systems with pi = 15,000 psi and
pf = 1,000 psi
-2000
-1000
0
1000
2000
3000
4000
5000
6000
4.5000 5.0000 5.5000 6.0000
Radius(inches)
Tan
gen
tial
str
ess(
psi
)
cement system 1
cement system 2
cement system 3
Fig 4.4: Tangential Stress in Three Cement Systems with pi = 15,000 psi and
pf = 1,000 psi
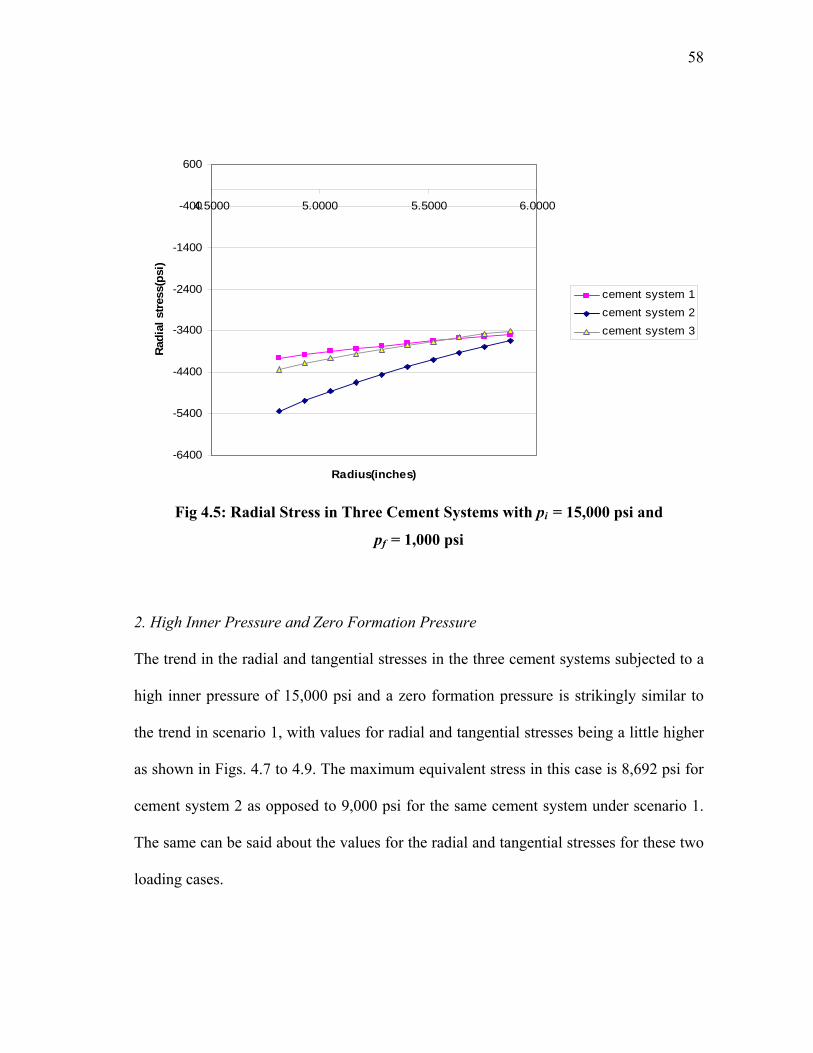
58
-6400
-5400
-4400
-3400
-2400
-1400
-400
600
4.5000 5.0000 5.5000 6.0000
Radius(inches)
Rad
ial
stre
ss(p
si)
cement system 1
cement system 2
cement system 3
Fig 4.5: Radial Stress in Three Cement Systems with pi = 15,000 psi and
pf = 1,000 psi
2. High Inner Pressure and Zero Formation Pressure
The trend in the radial and tangential stresses in the three cement systems subjected to a
high inner pressure of 15,000 psi and a zero formation pressure is strikingly similar to
the trend in scenario 1, with values for radial and tangential stresses being a little higher
as shown in Figs. 4.7 to 4.9. The maximum equivalent stress in this case is 8,692 psi for
cement system 2 as opposed to 9,000 psi for the same cement system under scenario 1.
The same can be said about the values for the radial and tangential stresses for these two
loading cases.

59
Fig 4.6: Von Mises Stress with Formation Ef = 1 x 10⁶ psi and νf = 0.3 for Scenario 2
The finite element modeling of scenario 2 with cement system 2 (Fig. 4.6) shows
a higher amount of equivalent stress on the casing (91,151 to 73,398 psi) in comparison
with scenario 1 with the same formation properties (84,178 to 66,784 psi). The
transitions at the boundary show a different trend from that of scenario 1. At the casing–
cement interface, the pressure reduces from 73,398 psi in the casing to 8,210 psi in the
cement. The trend is the opposite at the cement–formation boundary with 5,586 psi at
the cement side of the boundary and 6,150 psi on the formation side.

60
0
1000
2000
3000
4000
5000
6000
7000
8000
9000
10000
4.5000 5.0000 5.5000 6.0000
Radius(inches)
Eq
uiv
alen
t S
tres
s(p
si)
cement system 1
cement system 2
cement system 3
Fig 4.7: Equivalent Stress in Three Cement Systems with pi = 15,000 psi and
pf = 0 psi
-1000
0
1000
2000
3000
4000
5000
6000
4.5000 5.0000 5.5000 6.0000
Radius(inches)
Tan
gen
tial
str
ess(
psi
)
cement system 1
cement system 2
cement system 3
Fig 4.8: Tangential Stress in Three Cement Systems with pi = 15,000 psi and
pf = 0 psi
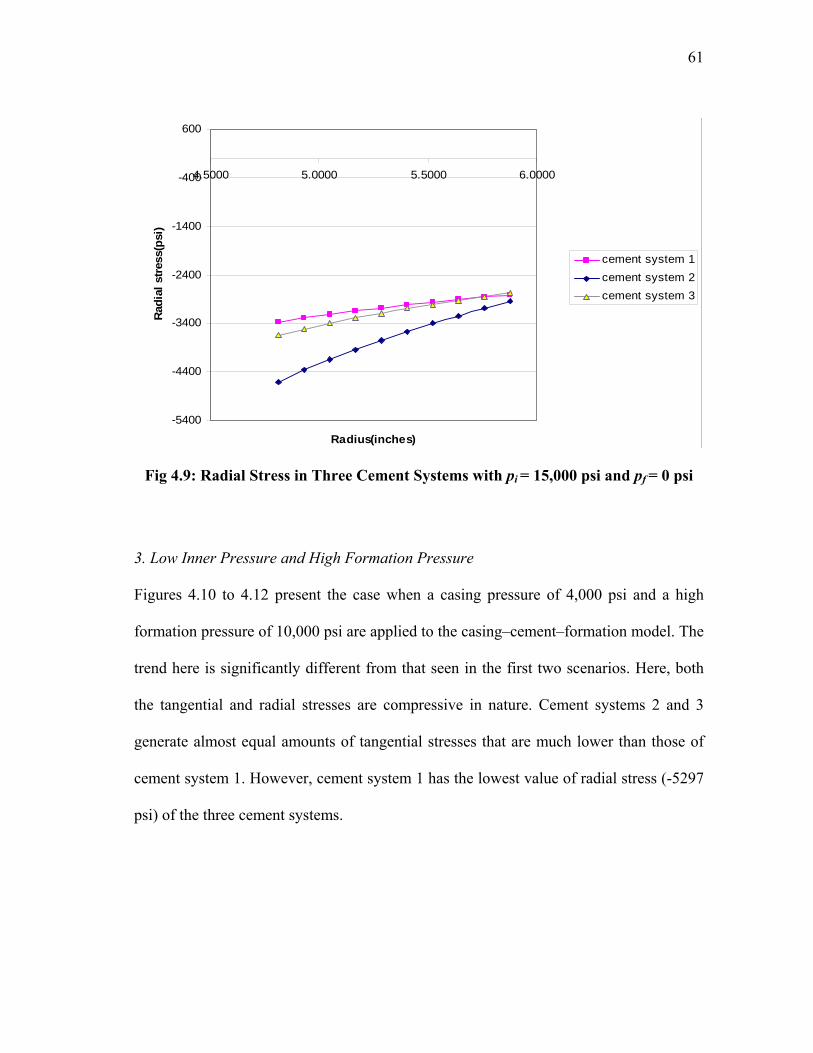
61
-5400
-4400
-3400
-2400
-1400
-400
600
4.5000 5.0000 5.5000 6.0000
Radius(inches)
Rad
ial
stre
ss(p
si)
cement system 1
cement system 2
cement system 3
Fig 4.9: Radial Stress in Three Cement Systems with pi = 15,000 psi and pf = 0 psi
3. Low Inner Pressure and High Formation Pressure
Figures 4.10 to 4.12 present the case when a casing pressure of 4,000 psi and a high
formation pressure of 10,000 psi are applied to the casing–cement–formation model. The
trend here is significantly different from that seen in the first two scenarios. Here, both
the tangential and radial stresses are compressive in nature. Cement systems 2 and 3
generate almost equal amounts of tangential stresses that are much lower than those of
cement system 1. However, cement system 1 has the lowest value of radial stress (-5297
psi) of the three cement systems.
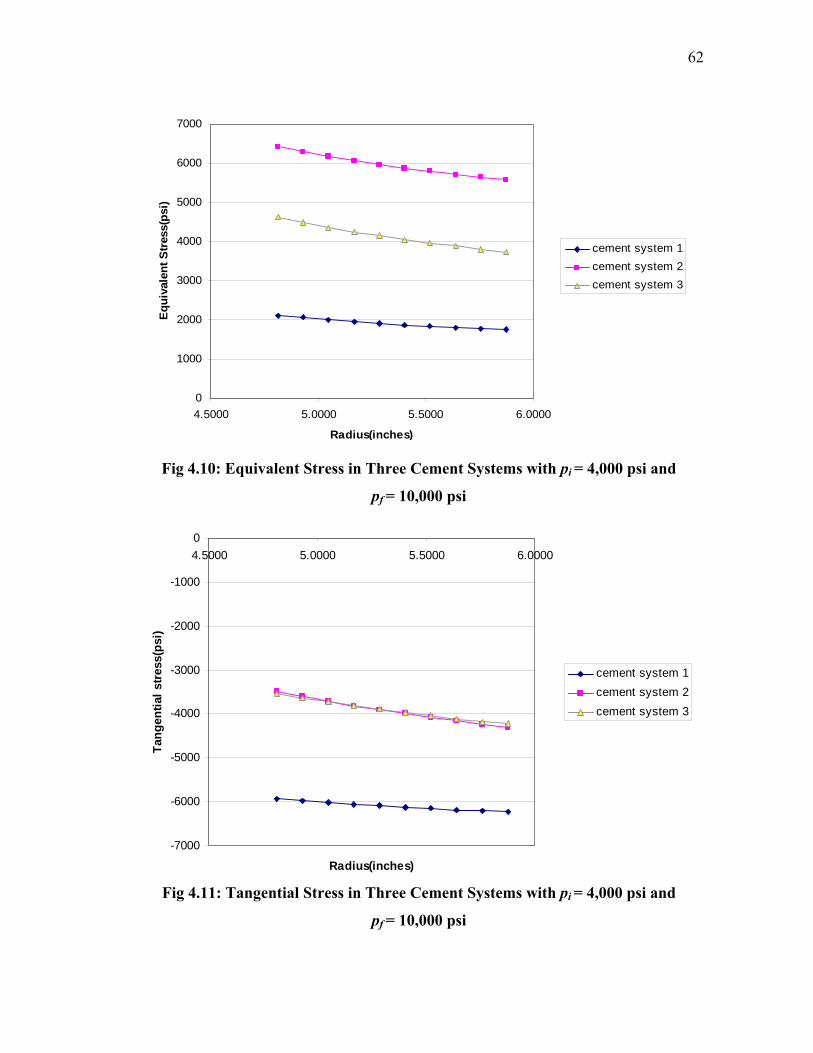
62
0
1000
2000
3000
4000
5000
6000
7000
4.5000 5.0000 5.5000 6.0000
Radius(inches)
Eq
uiv
alen
t S
tres
s(p
si)
cement system 1
cement system 2
cement system 3
Fig 4.10: Equivalent Stress in Three Cement Systems with pi = 4,000 psi and
pf = 10,000 psi
-7000
-6000
-5000
-4000
-3000
-2000
-1000
0
4.5000 5.0000 5.5000 6.0000
Radius(inches)
Tan
gen
tial
str
ess(
psi
)
cement system 1
cement system 2
cement system 3
Fig 4.11: Tangential Stress in Three Cement Systems with pi = 4,000 psi and
pf = 10,000 psi
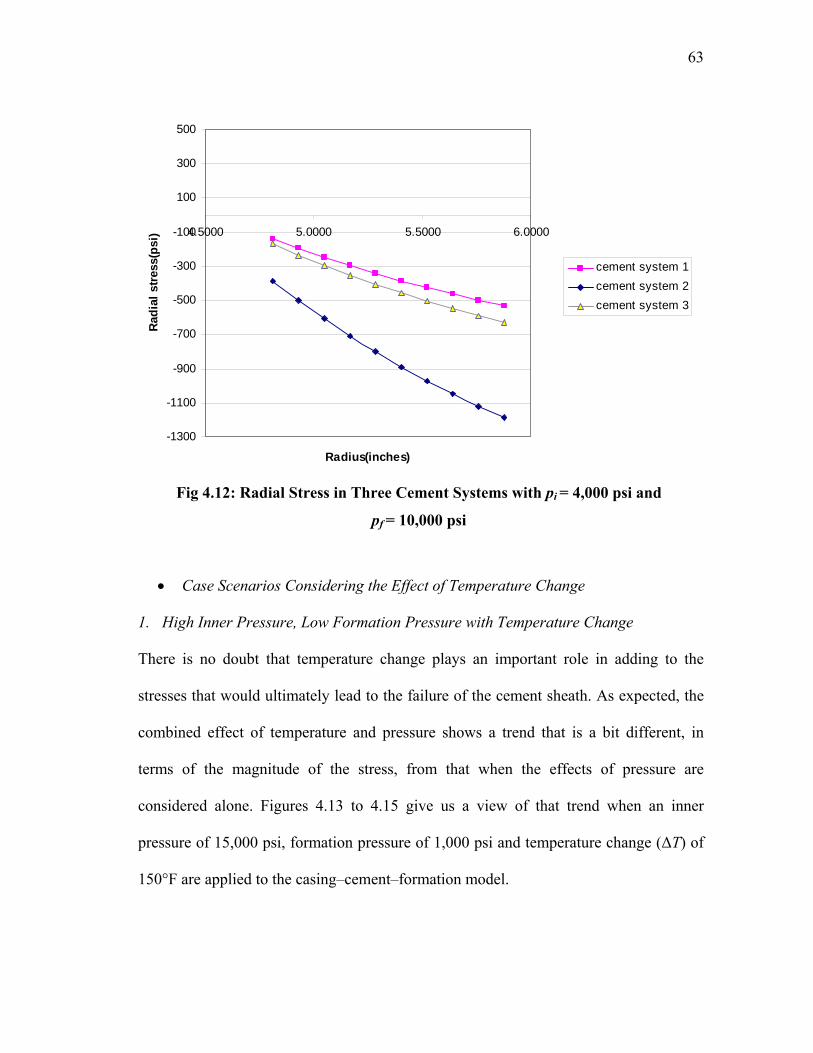
63
-1300
-1100
-900
-700
-500
-300
-100
100
300
500
4.5000 5.0000 5.5000 6.0000
Radius(inches)
Rad
ial
stre
ss(p
si)
cement system 1
cement system 2
cement system 3
Fig 4.12: Radial Stress in Three Cement Systems with pi = 4,000 psi and
pf = 10,000 psi
Case Scenarios Considering the Effect of Temperature Change
1. High Inner Pressure, Low Formation Pressure with Temperature Change
There is no doubt that temperature change plays an important role in adding to the
stresses that would ultimately lead to the failure of the cement sheath. As expected, the
combined effect of temperature and pressure shows a trend that is a bit different, in
terms of the magnitude of the stress, from that when the effects of pressure are
considered alone. Figures 4.13 to 4.15 give us a view of that trend when an inner
pressure of 15,000 psi, formation pressure of 1,000 psi and temperature change (ΔT) of
150°F are applied to the casing–cement–formation model.

64
0
2000
4000
6000
8000
10000
12000
4.5000 5.0000 5.5000 6.0000
Radius(inches)
Eq
uiv
alen
t S
tres
s(p
si)
cement system 1
cement system 2
cement system 3
Fig 4.13: Equivalent Stress with pi = 15,000 psi, pf = 1,000 psi and ΔT = 150°F
-2000
-1000
0
1000
2000
3000
4000
5000
6000
4.5000 5.0000 5.5000 6.0000
Radius(inches)
Tan
gen
tial
str
ess(
psi
)
cement system 1
cement system 2
cement system 3
Fig 4.14: Tangential Stress with pi = 15,000 psi, pf = 1,000 psi and ΔT = 150°F
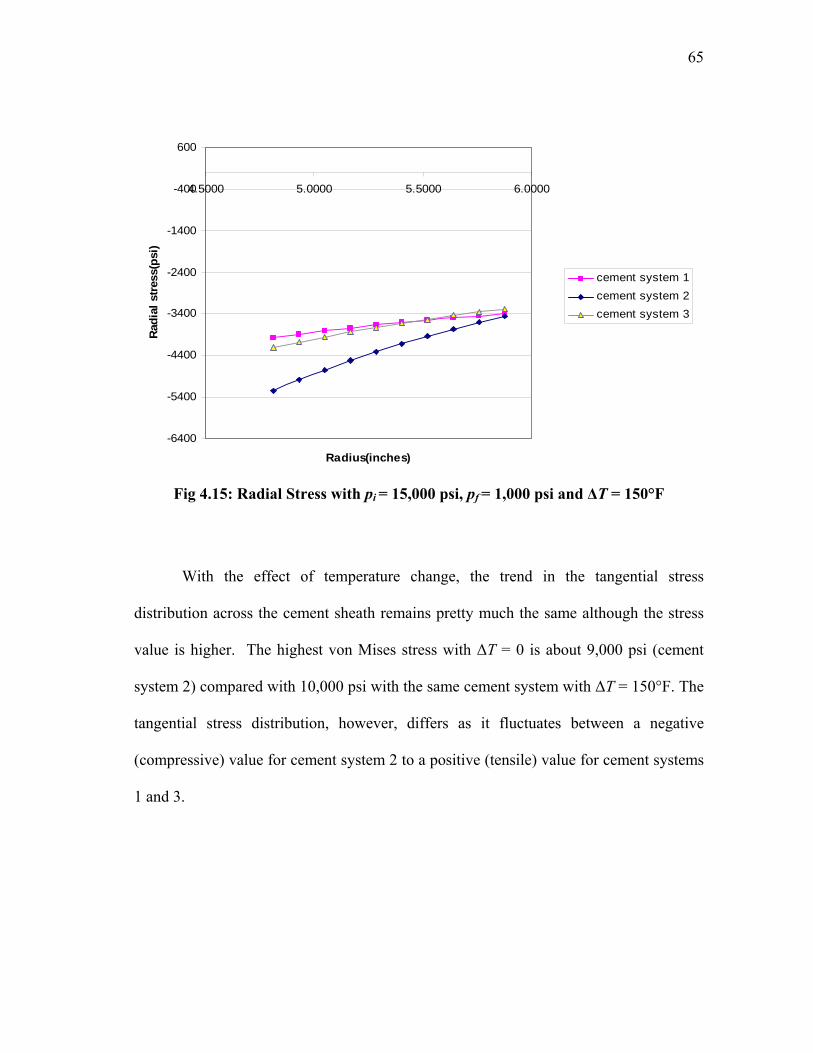
65
-6400
-5400
-4400
-3400
-2400
-1400
-400
600
4.5000 5.0000 5.5000 6.0000
Radius(inches)
Rad
ial
stre
ss(p
si)
cement system 1
cement system 2
cement system 3
Fig 4.15: Radial Stress with pi = 15,000 psi, pf = 1,000 psi and ΔT = 150°F
With the effect of temperature change, the trend in the tangential stress
distribution across the cement sheath remains pretty much the same although the stress
value is higher. The highest von Mises stress with ΔT = 0 is about 9,000 psi (cement
system 2) compared with 10,000 psi with the same cement system with ΔT = 150°F. The
tangential stress distribution, however, differs as it fluctuates between a negative
(compressive) value for cement system 2 to a positive (tensile) value for cement systems
1 and 3.

66
2. High Inner Pressure, Zero Formation Pressure with Temperature Change
In this case, the radial stress distribution profile is similar to that of Fig. 4.9 with almost
the same magnitude of stress but the tangential stress profile is different. While the
tangential stress profile in Fig. 4.8 was all negative (compressive) stress for cement
system 1, it fluctuates from 85 psi (tensile) to -468 psi (compressive) when the effect of
temperature change is considered. The equivalent stresses decreases non-linearly from
the inner surface of the cement (2,928 psi for cement 1, 9,652 psi for cement 2 and 4,687
psi for cement 3) to 1,977 psi for cement 1, 6,802 psi for cement 2 and 3,164 psi for
cement 3 at the outer surface. These results are shown by figures 4.16 to 4.18 below.
0
2000
4000
6000
8000
10000
12000
4.5000 5.0000 5.5000 6.0000
Radius(inches)
Eq
uiv
alen
t S
tres
s(p
si)
cement system 1
cement system 2
cement system 3
Fig 4.16: Equivalent Stress with pi = 15,000 psi, pf = 0 psi and ΔT = 150°F
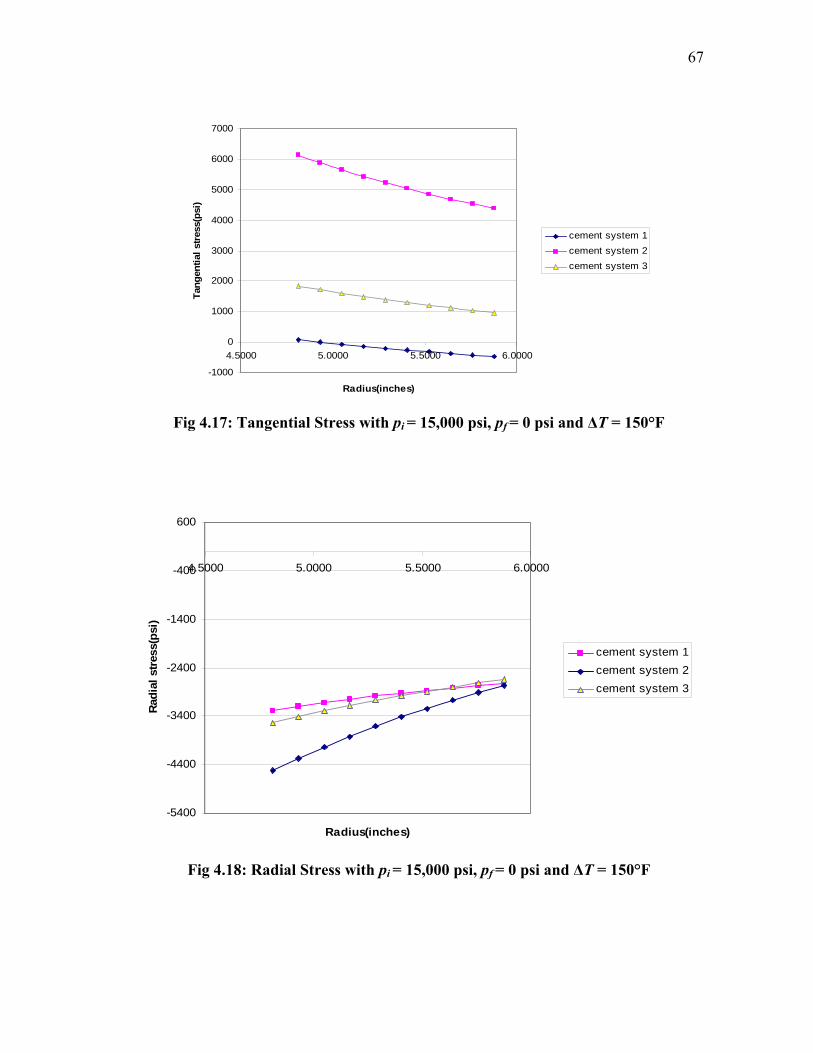
67
-1000
0
1000
2000
3000
4000
5000
6000
7000
4.5000 5.0000 5.5000 6.0000
Radius(inches)
Tan
gen
tial
str
ess(
psi
)
cement system 1
cement system 2
cement system 3
Fig 4.17: Tangential Stress with pi = 15,000 psi, pf = 0 psi and ΔT = 150°F
-5400
-4400
-3400
-2400
-1400
-400
600
4.5000 5.0000 5.5000 6.0000
Radius(inches)
Rad
ial
stre
ss(p
si)
cement system 1
cement system 2
cement system 3
Fig 4.18: Radial Stress with pi = 15,000 psi, pf = 0 psi and ΔT = 150°F

68
3. Low Inner Pressure, High Formation Pressure with Temperature Change
This case generates higher values for tangential and radial stresses in the three cement
systems as compared to the case without temperature change. The radial stress in the
three cement systems also increases non-linearly from the inner surface of the cement to
the outer surface where the opposite is the case without temperature change. The results
are as shown in Figs. 4.19 to 4.21.
0
1000
2000
3000
4000
5000
6000
4.5000 5.0000 5.5000 6.0000
Radius(inches)
Eq
uiv
alen
t S
tres
s(p
si)
cement system 1
cement system 2
cement system 3
Fig 4.19: Equivalent Stress with pi = 4,000 psi, pf = 10,000 psi and ΔT = 150°F
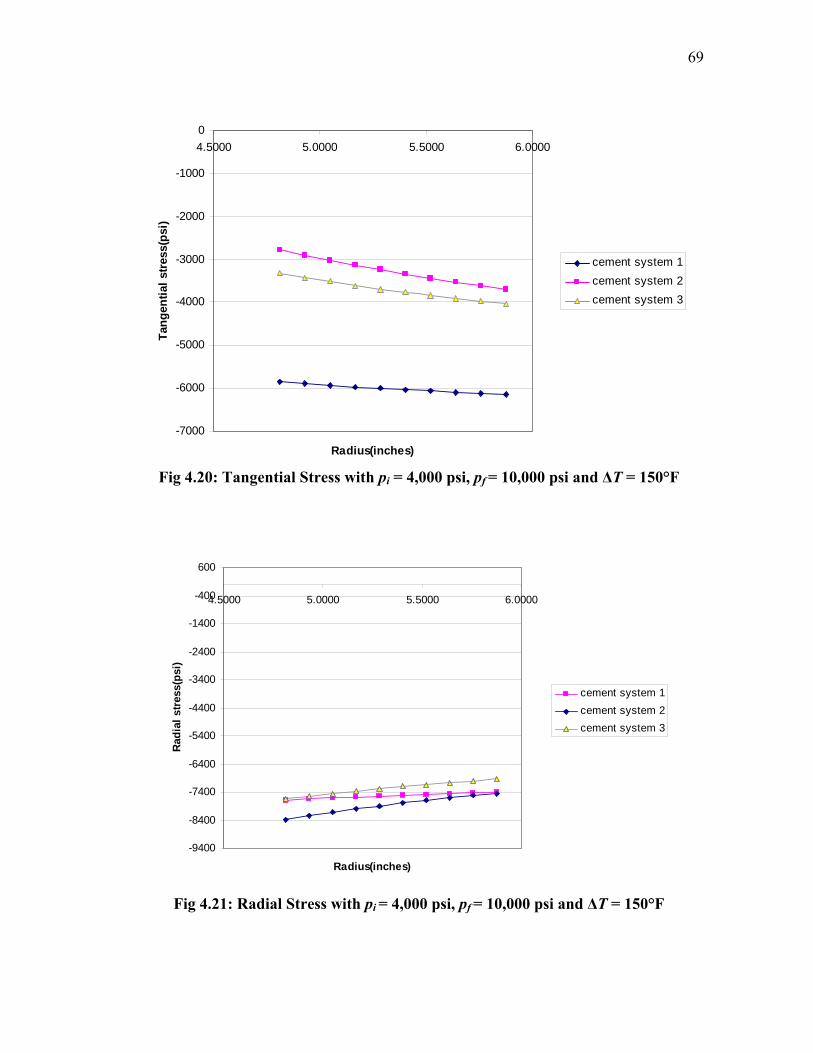
69
-7000
-6000
-5000
-4000
-3000
-2000
-1000
0
4.5000 5.0000 5.5000 6.0000
Radius(inches)
Tan
gen
tial
str
ess(
psi
)
cement system 1
cement system 2
cement system 3
Fig 4.20: Tangential Stress with pi = 4,000 psi, pf = 10,000 psi and ΔT = 150°F
-9400
-8400
-7400
-6400
-5400
-4400
-3400
-2400
-1400
-400
600
4.5000 5.0000 5.5000 6.0000
Radius(inches)
Rad
ial
stre
ss(p
si)
cement system 1
cement system 2
cement system 3
Fig 4.21: Radial Stress with pi = 4,000 psi, pf = 10,000 psi and ΔT = 150°F
70
4.2 Fatigue Loading
The aim of the fatigue study was to determine if a cement system capable of sustaining a
static load would be able to sustain a similar load under cyclic loading conditions. A
fatigue analysis together with a related static analysis was done with ANSYS on a
casing–cement–formation setup using cement system 2 with an inner pressure of 7,000
psi and formation pressure of 2,000 psi. As was done in the static study, the properties of
the casing remained the same while the fatigue behavior of cement was studied with two
different formation properties; Ef = 3 x 10⁶ psi, νf = 0.42 and Ef = 1 x 10⁶ psi, νf = 0.3.
Fully reversed and zero based loading conditions were used in the fatigue analysis.
With 7,000 psi internal pressure and 2,000 psi formation pressure, the finite
element model in Fig. 4.22 gives an indication that cement system 2 would withstand
such pressure loads under static loading conditions. The effective von Mises stress
changes from 22,760 psi at the cement–casing boundary on the casing side to 4,330 psi
on the cement sheath side and from 2,994 psi on the cement side of cement–formation
boundary to 1,842 psi on the formation side of the same boundary. The equivalent
alternating stresses for a zero based cyclic loading condition with the formation
properties Ef = 1 x 10⁶ psi, νf = 0.42, however, is a bit different as shown in Fig. 4.23.
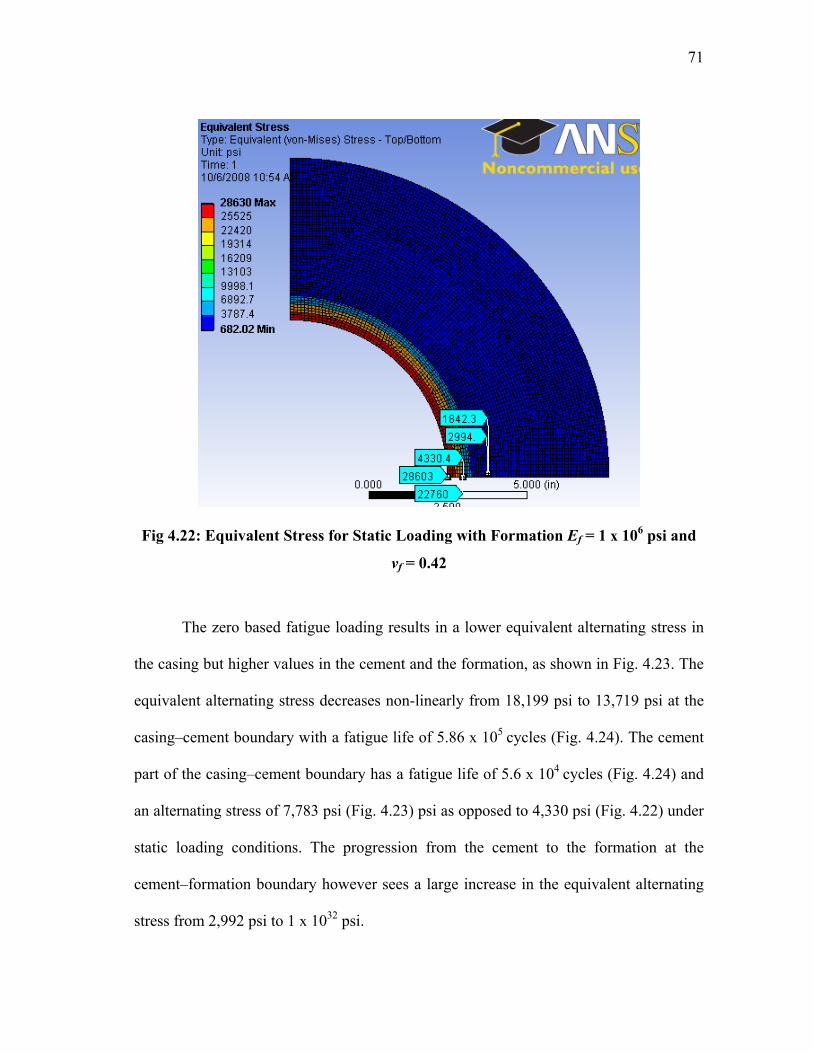
71
Fig 4.22: Equivalent Stress for Static Loading with Formation Ef = 1 x 10⁶ psi and
νf = 0.42
The zero based fatigue loading results in a lower equivalent alternating stress in
the casing but higher values in the cement and the formation, as shown in Fig. 4.23. The
equivalent alternating stress decreases non-linearly from 18,199 psi to 13,719 psi at the
casing–cement boundary with a fatigue life of 5.86 x 10⁵ cycles (Fig. 4.24). The cement
part of the casing–cement boundary has a fatigue life of 5.6 x 10⁴ cycles (Fig. 4.24) and
an alternating stress of 7,783 psi (Fig. 4.23) psi as opposed to 4,330 psi (Fig. 4.22) under
static loading conditions. The progression from the cement to the formation at the
cement–formation boundary however sees a large increase in the equivalent alternating
stress from 2,992 psi to 1 x 1032 psi.
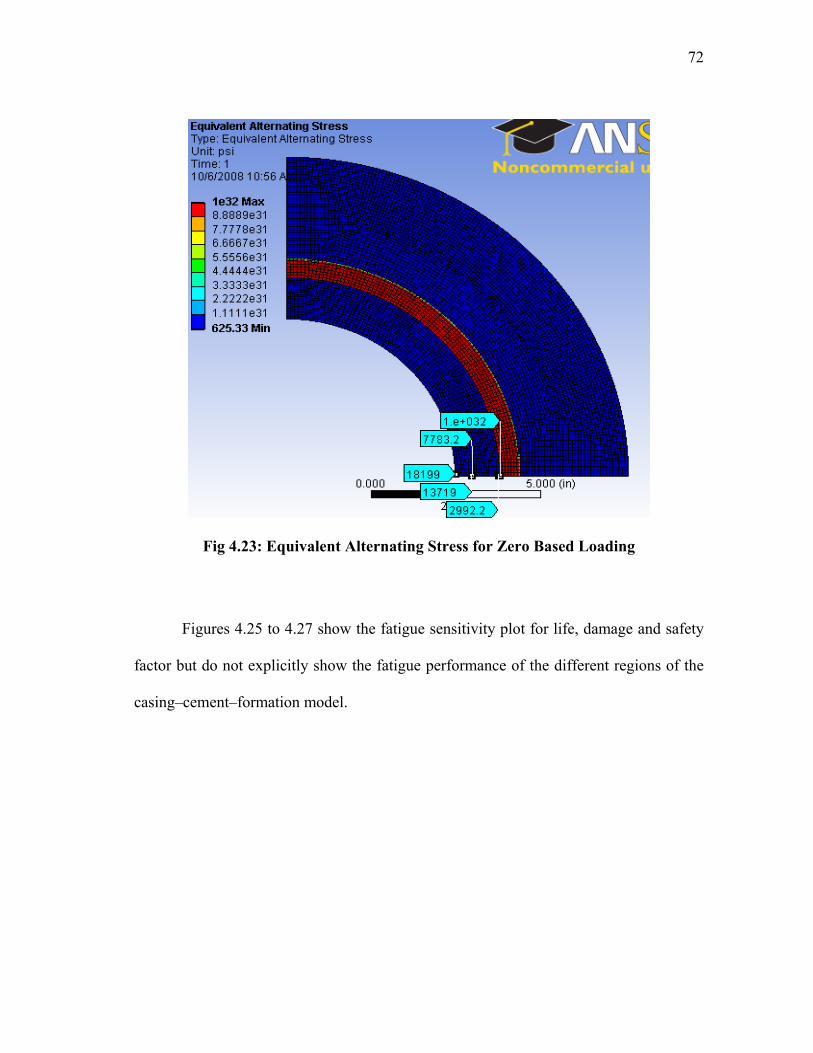
72
Fig 4.23: Equivalent Alternating Stress for Zero Based Loading
Figures 4.25 to 4.27 show the fatigue sensitivity plot for life, damage and safety
factor but do not explicitly show the fatigue performance of the different regions of the
casing–cement–formation model.
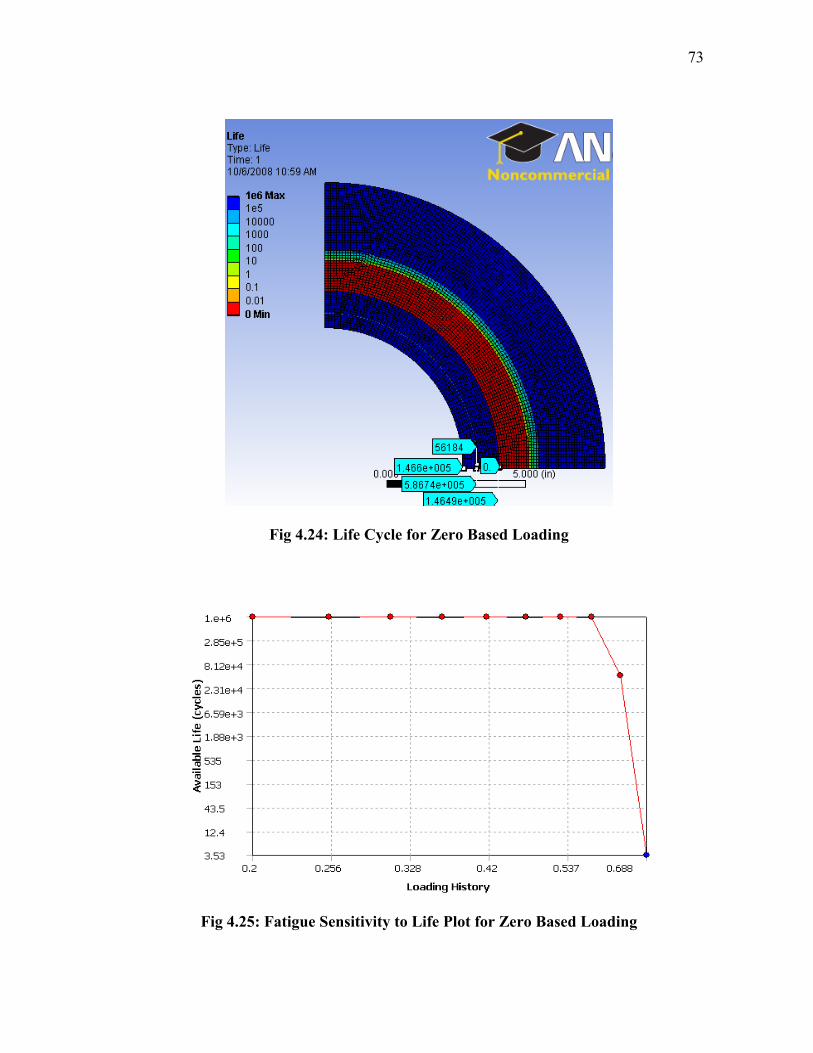
73
Fig 4.24: Life Cycle for Zero Based Loading
Fig 4.25: Fatigue Sensitivity to Life Plot for Zero Based Loading

74
Fig 4.26: Fatigue Sensitivity to Safety Factor Plot for Zero Based Loading
Fig 4.27: Fatigue Sensitivity to Damage Plot for Zero Based Loading

75
With the formation properties changed to Ef = 1 x 10⁶ psi and νf = 0.3, while the
casing and cement properties remain the same, an insight is gained on how mechanical
properties like Young’s modulus and Poisson’s ratio affect the stress distribution and the
ability to withstand fatigue loading. Figure 4.27 shows the response to fatigue with zero
based load and formation properties Ef = 1 x 10⁶ psi and νf = 0.3. Under the different
formation properties, both cases show similar trends in the static equivalent stresses and
alternating stresses but, as shown in Figs. 4.28 and 4.29, the formation with more ductile
properties (Ef = 1 x 10⁶ psi and νf = 0.3) has slightly higher stress values for the static
equivalent stresses and almost the same value of alternating stress.
Fig 4.28: Equivalent Stress for Static Loading with Formation Property:
Ef = 1 x 10⁶ psi, νf = 0.3
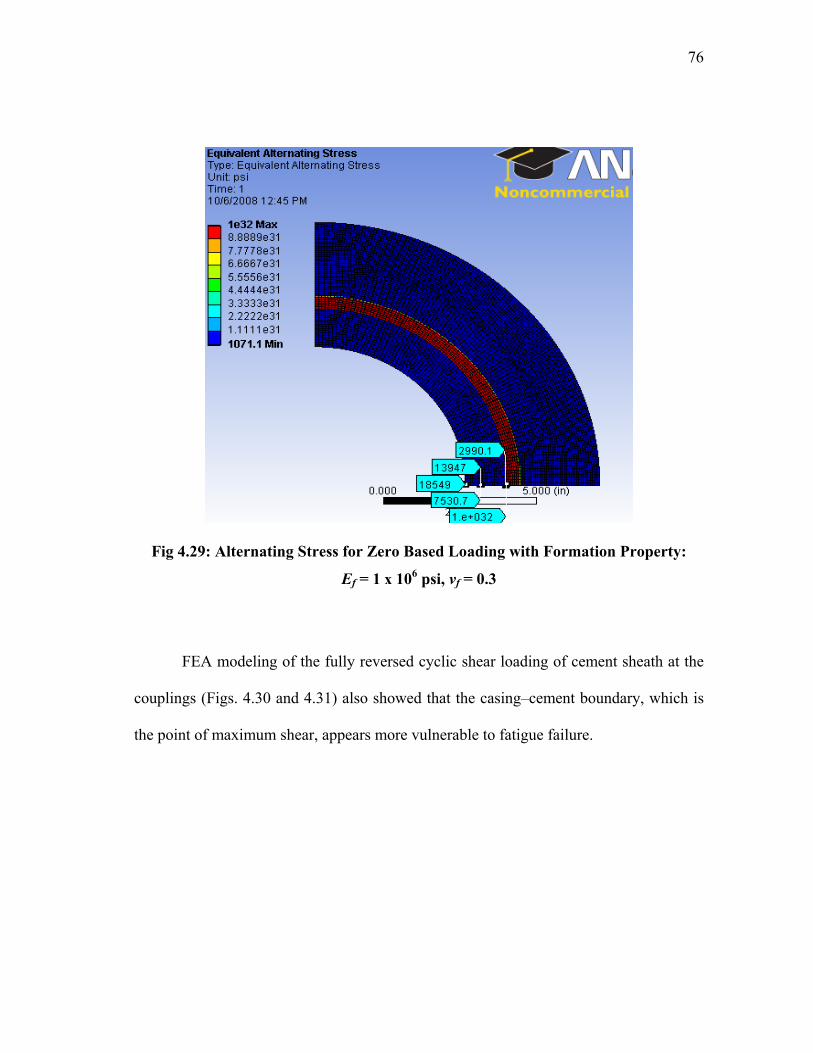
76
Fig 4.29: Alternating Stress for Zero Based Loading with Formation Property:
Ef = 1 x 10⁶ psi, νf = 0.3
EA modeling of the fully reversed cyclic shear loading of cement sheath at the
couplings (Figs. 4.30 and 4.31) also showed that the casing–cement boundary, which is
the point of maximum shear, appears more vulnerable to fatigue failure.
F
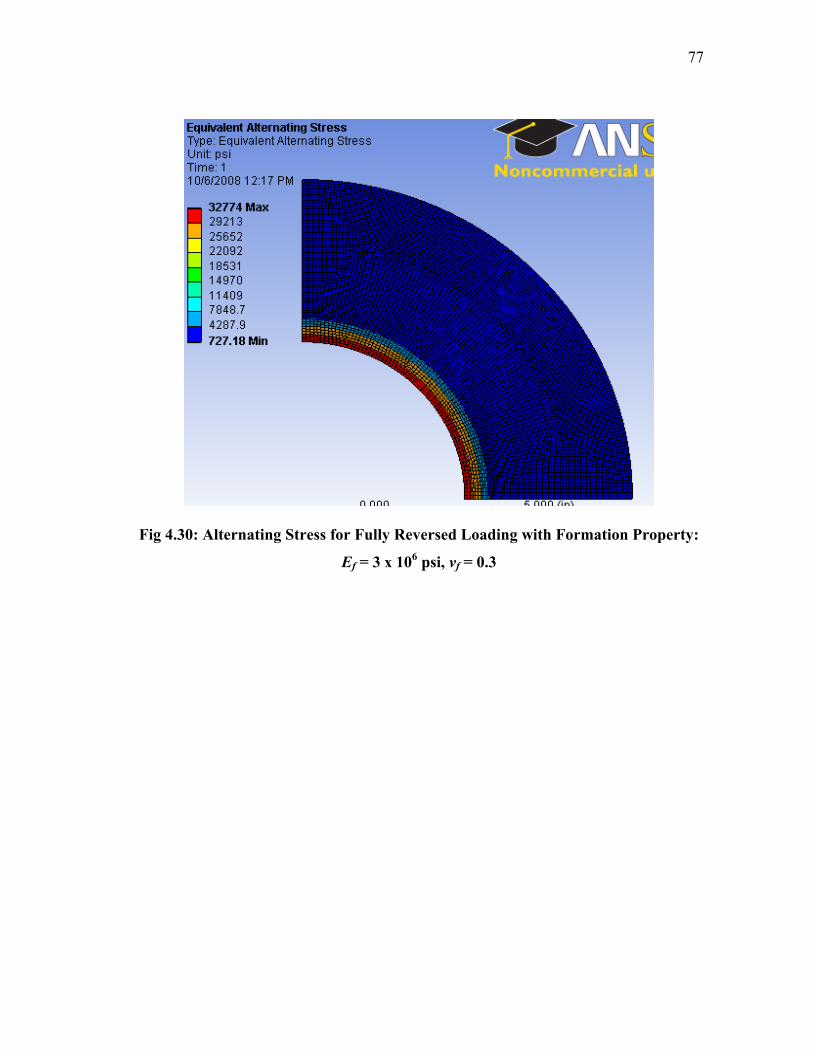
77
Fig 4.30: Alternating Stress for Fully Reversed Loading with Formation Property:
Ef = 3 x 10⁶ psi, νf = 0.3
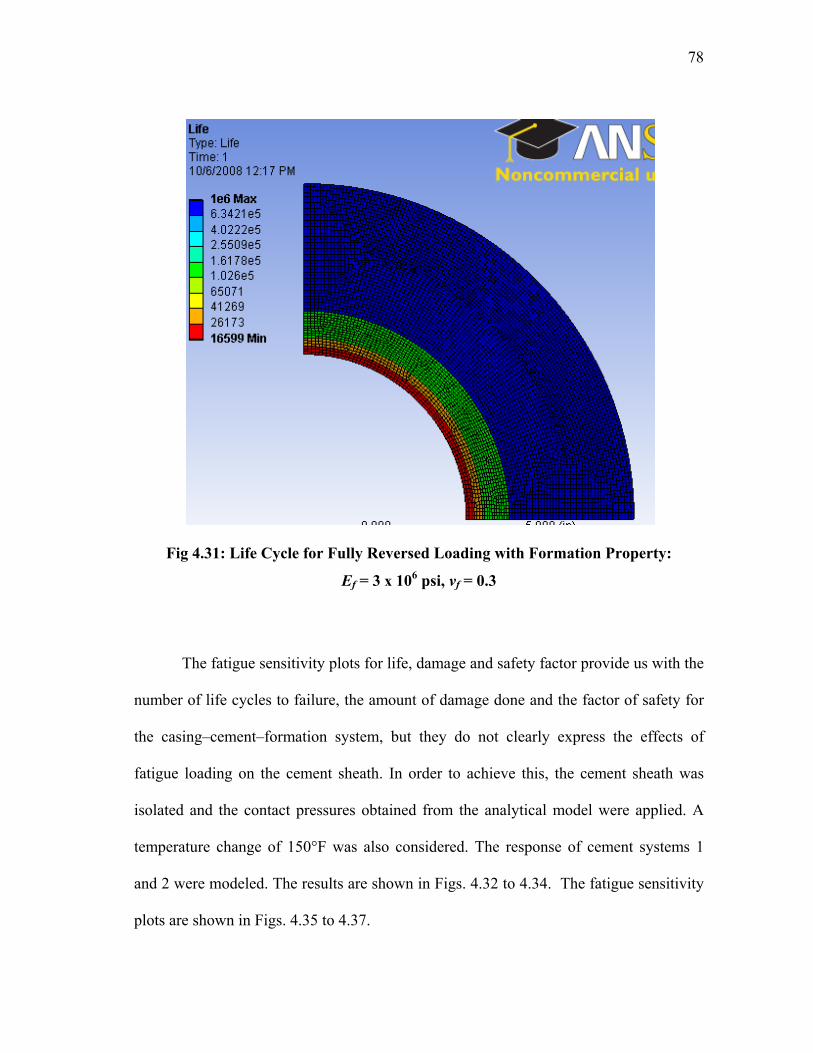
78
Fig 4.31: Life Cycle for Fully Reversed Loading with Formation Property:
Ef = 3 x 10⁶ psi, νf = 0.3
The fatigue sensitivity plots for life, damage and safety factor provide us with the
number of life cycles to failure, the amount of damage done and the factor of safety for
the casing–cement–formation system, but they do not clearly express the effects of
fatigue loading on the cement sheath. In order to achieve this, the cement sheath was
isolated and the contact pressures obtained from the analytical model were applied. A
temperature change of 150°F was also considered. The response of cement systems 1
and 2 were modeled. The results are shown in Figs. 4.32 to 4.34. The fatigue sensitivity
plots are shown in Figs. 4.35 to 4.37.
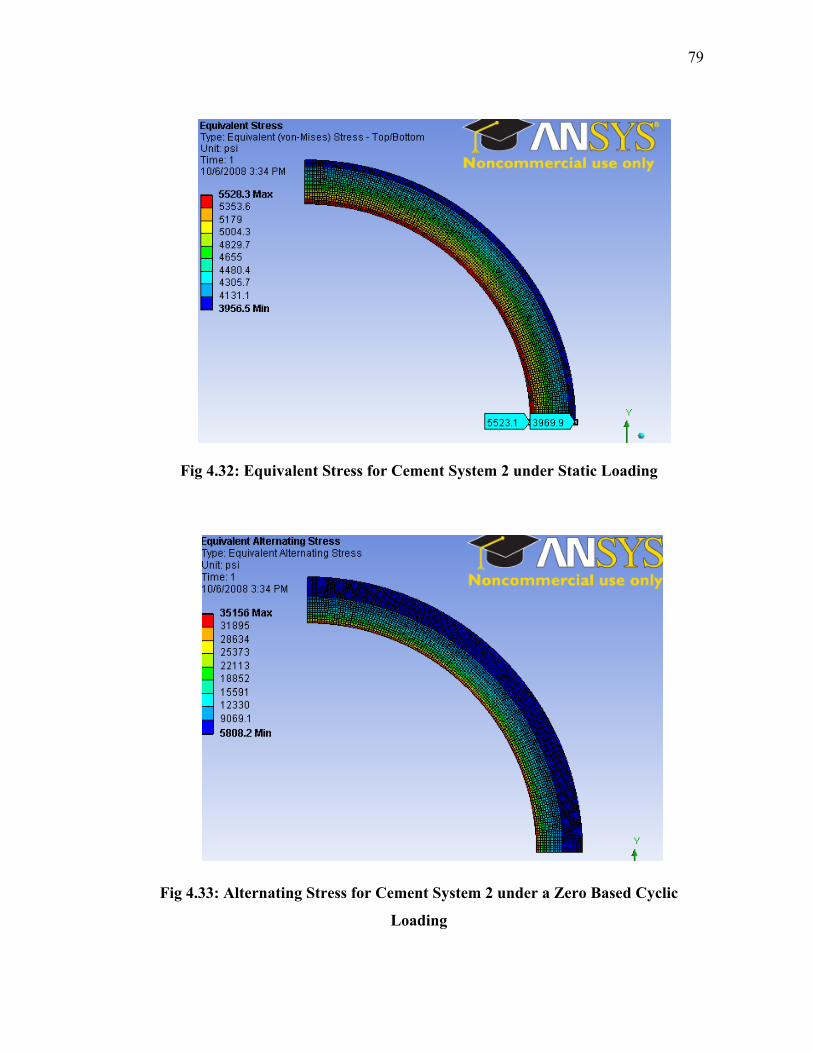
79
Fig 4.32: Equivalent Stress for Cement System 2 under Static Loading
Fig 4.33: Alternating Stress for Cement System 2 under a Zero Based Cyclic
Loading
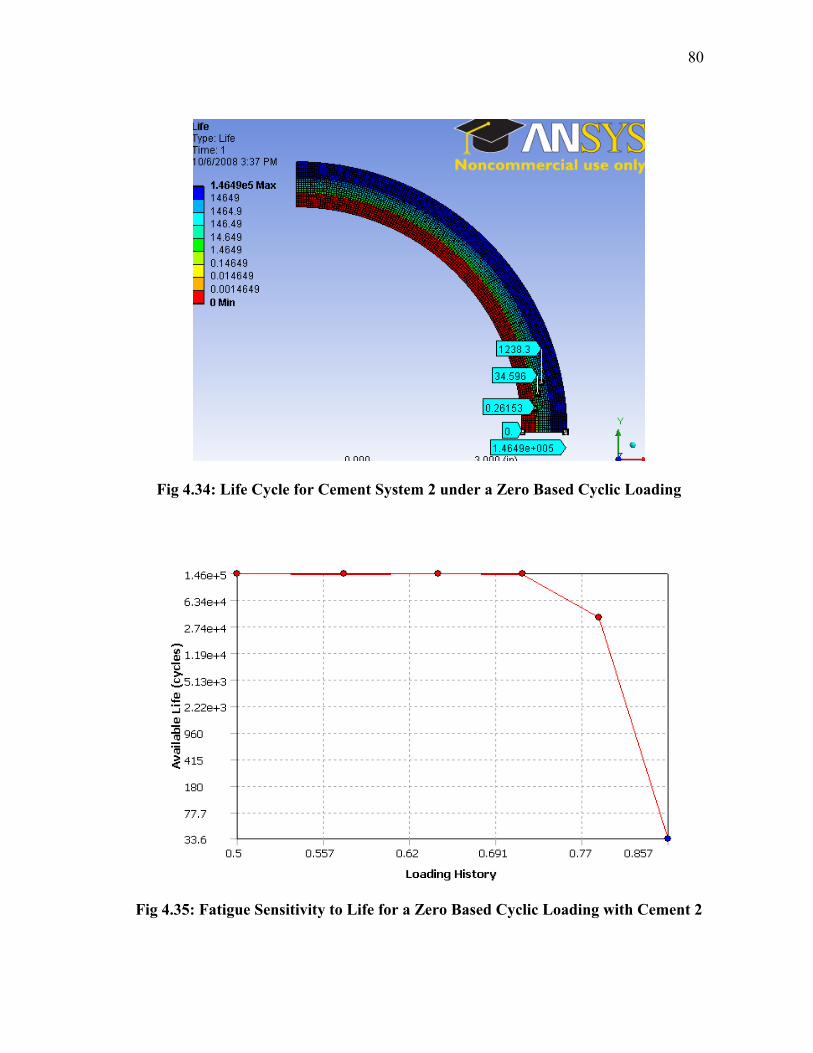
80
Fig 4.34: Life Cycle for Cement System 2 under a Zero Based Cyclic Loading
Fig 4.35: Fatigue Sensitivity to Life for a Zero Based Cyclic Loading with Cement 2

81
Fig 4.36: Fatigue Sensitivity to Damage Plot for a Zero Based Cyclic Loading with
Cement 2
Fig 4.37: Fatigue Sensitivity to Safety Factor Plot for a Zero Based Cyclic Loading
with Cement 2
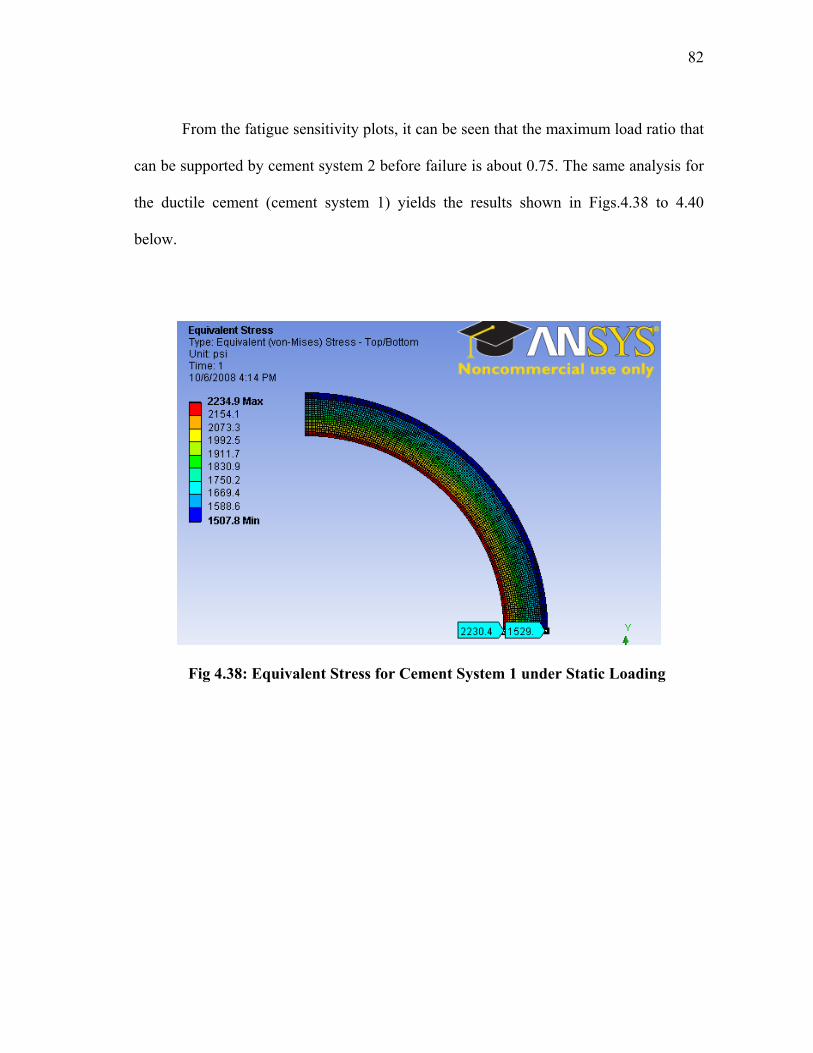
82
From the fatigue sensitivity plots, it can be seen that the maximum load ratio that
can be supported by cement system 2 before failure is about 0.75. The same analysis for
the ductile cement (cement system 1) yields the results shown in Figs.4.38 to 4.40
below.
Fig 4.38: Equivalent Stress for Cement System 1 under Static Loading
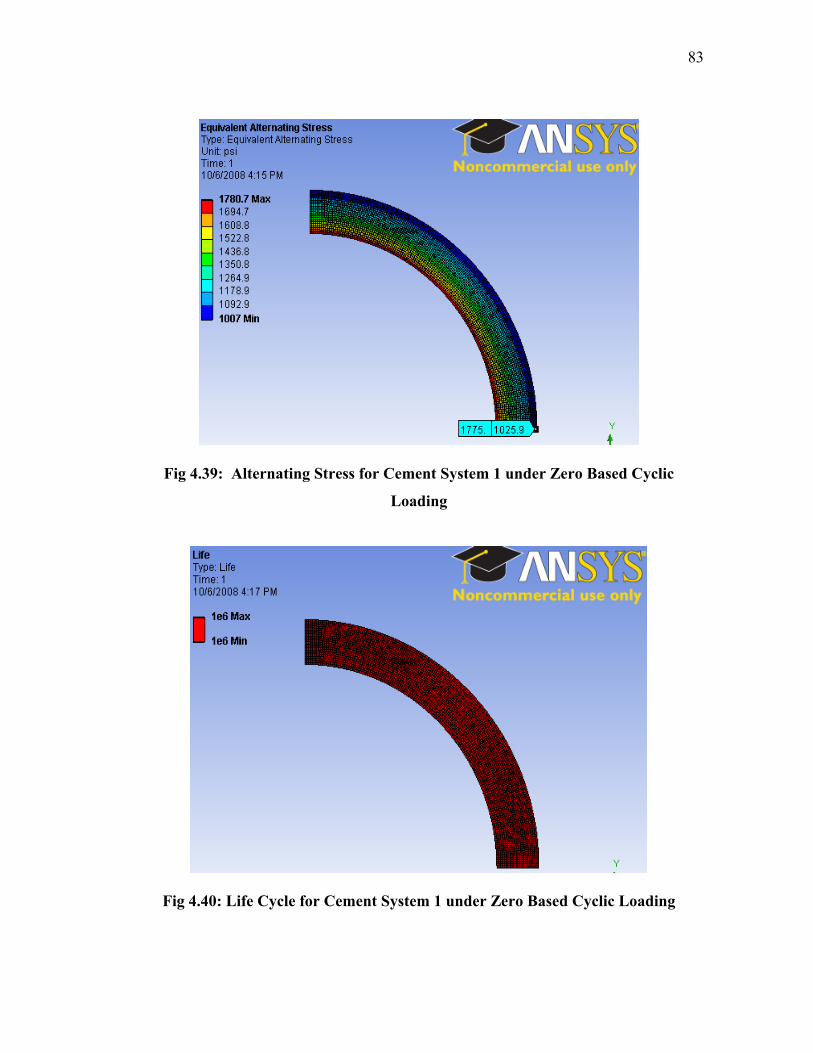
83
Fig 4.39: Alternating Stress for Cement System 1 under Zero Based Cyclic
Loading
Fig 4.40: Life Cycle for Cement System 1 under Zero Based Cyclic Loading

84
For cement system 1, the magnitude of the alternating stress appears to be
smaller than the equivalent stress under static loading (Figs. 4.38 and 4.39). This trend is
quite different from what was obtained with cement system 2 where the minimum
alternating stress under a zero based cyclic loading is greater than the maximum
equivalent stress under static loading (Figs. 4.32 and 4.33). The fatigue sensitivity plots
(Figs. 4.41 to 4.43) show that the maximum load ratio that can be supported by cement
system 1 before failure is about 1.1.
Fig 4.41: Fatigue Sensitivity to Life for Zero Based Cyclic Loading with Cement 1

85
Fig 4.42: Fatigue Sensitivity to Safety Factor for Zero Based Cyclic Loading with
Cement 1
Fig 4.43: Fatigue Sensitivity to Damage for Zero Based Cyclic Loading with
Cement 1
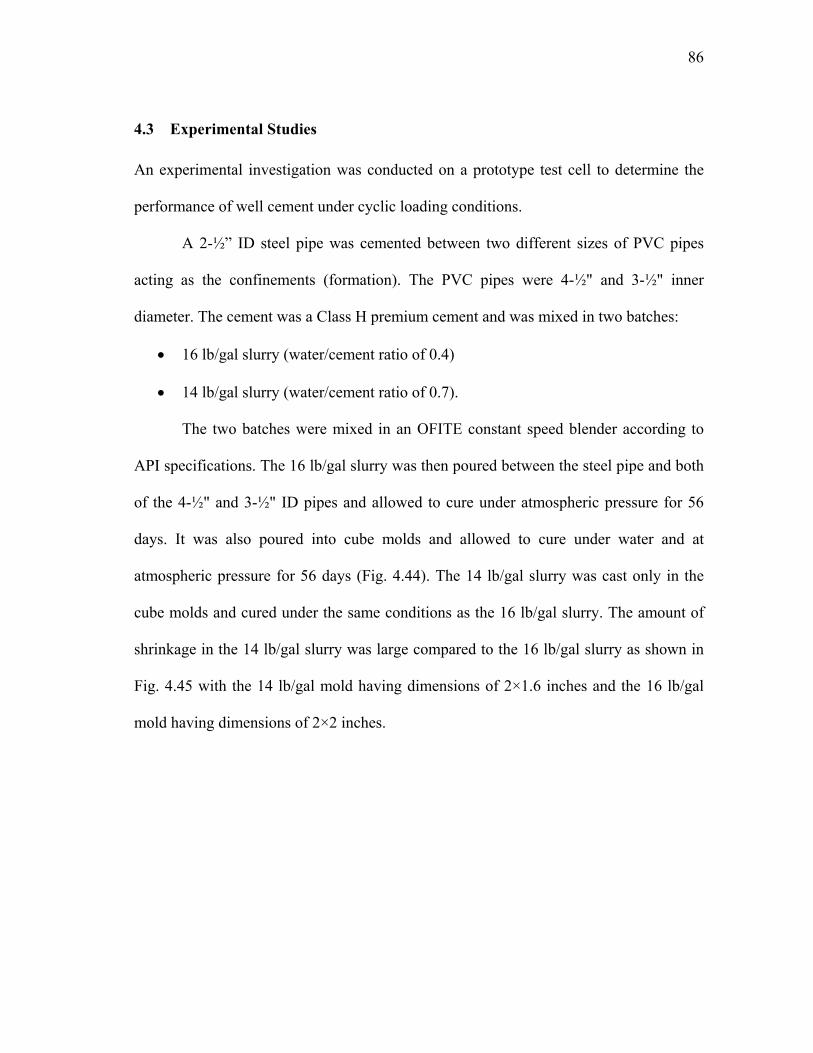
86
4.3 Experimental Studies
An experimental investigation was conducted on a prototype test cell to determine the
performance of well cement under cyclic loading conditions.
A 2-½” ID steel pipe was cemented between two different sizes of PVC pipes
acting as the confinements (formation). The PVC pipes were 4-½" and 3-½" inner
diameter. The cement was a Class H premium cement and was mixed in two batches:
16 lb/gal slurry (water/cement ratio of 0.4)
14 lb/gal slurry (water/cement ratio of 0.7).
The two batches were mixed in an OFITE constant speed blender according to
API specifications. The 16 lb/gal slurry was then poured between the steel pipe and both
of the 4-½" and 3-½" ID pipes and allowed to cure under atmospheric pressure for 56
days. It was also poured into cube molds and allowed to cure under water and at
atmospheric pressure for 56 days (Fig. 4.44). The 14 lb/gal slurry was cast only in the
cube molds and cured under the same conditions as the 16 lb/gal slurry. The amount of
shrinkage in the 14 lb/gal slurry was large compared to the 16 lb/gal slurry as shown in
Fig. 4.45 with the 14 lb/gal mold having dimensions of 2×1.6 inches and the 16 lb/gal
mold having dimensions of 2×2 inches.

87
Fig 4.44: Cubes Cured Under Water at Atmospheric Pressure
Fig 4.45: Shrinkage in Cured Cement

88
The cubes were tested for compressive strength after 56 days. The 14 lb/gal mold
had a compressive strength of 3,162 psi while the 16 lb/gal mold had a strength of 7,887
psi. Cyclic tests were carried out on the cemented pipe-PVC setup. A maximum axial
compressive force of 15,000 lbs was applied to the cement cyclically (from 0 lbs to
15,000 lbs and back to 0 lbs) using a compressive tester. This is shown in Fig 4.46.
15,000 lbs
Cement
PVC Pipe
Steel Pipe
Fig 4.46: Cemented Pipe under Compression,

89
Cracks were observed on both slurry specimens at about 12 cycles and the cracks
widened after 30 cycles. It should however be noted that tests were not conducted to see
if these cracks went all the way to the surface as the integrity may not have been fully
compromised at the presence of the cracks after 12 and 30 cycles. Another test was also
conducted to determine the amount of force required to de-bond the cement from the
casing. It was observed that this happened after a force of 2,500 lbs was applied to the 16
lb/gal slurry after 30 cycles of testing and at 4,000 lbs when no initial cycling force was
applied.
Fig 4.47: Cracks in 4-½” ID Pipe with 16 lb/gal Slurry after 12 Cycles
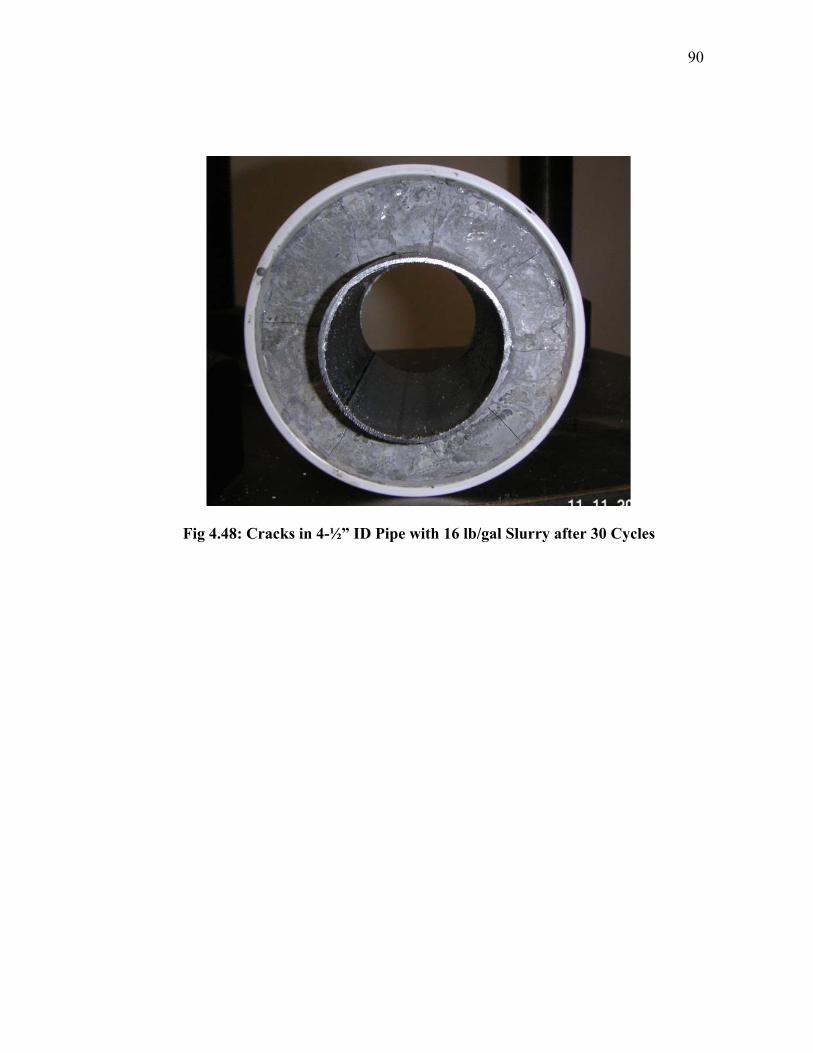
90
Fig 4.48: Cracks in 4-½” ID Pipe with 16 lb/gal Slurry after 30 Cycles
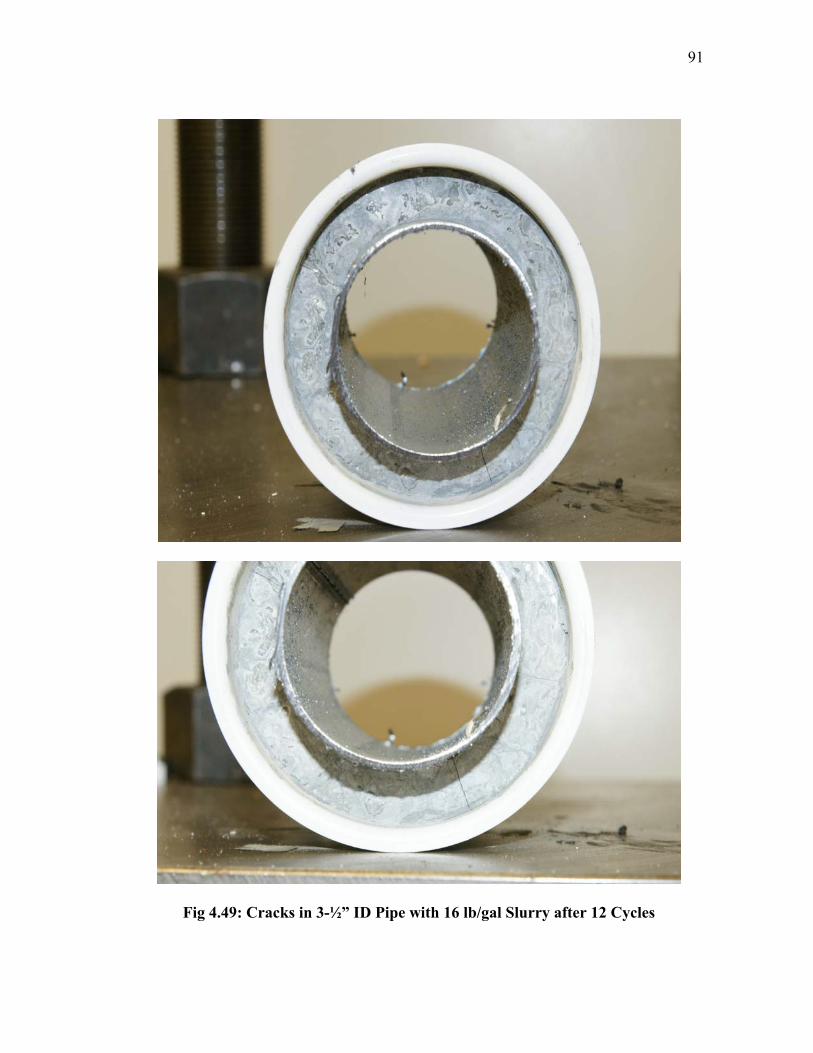
91
Fig 4.49: Cracks in 3-½” ID Pipe with 16 lb/gal Slurry after 12 Cycles
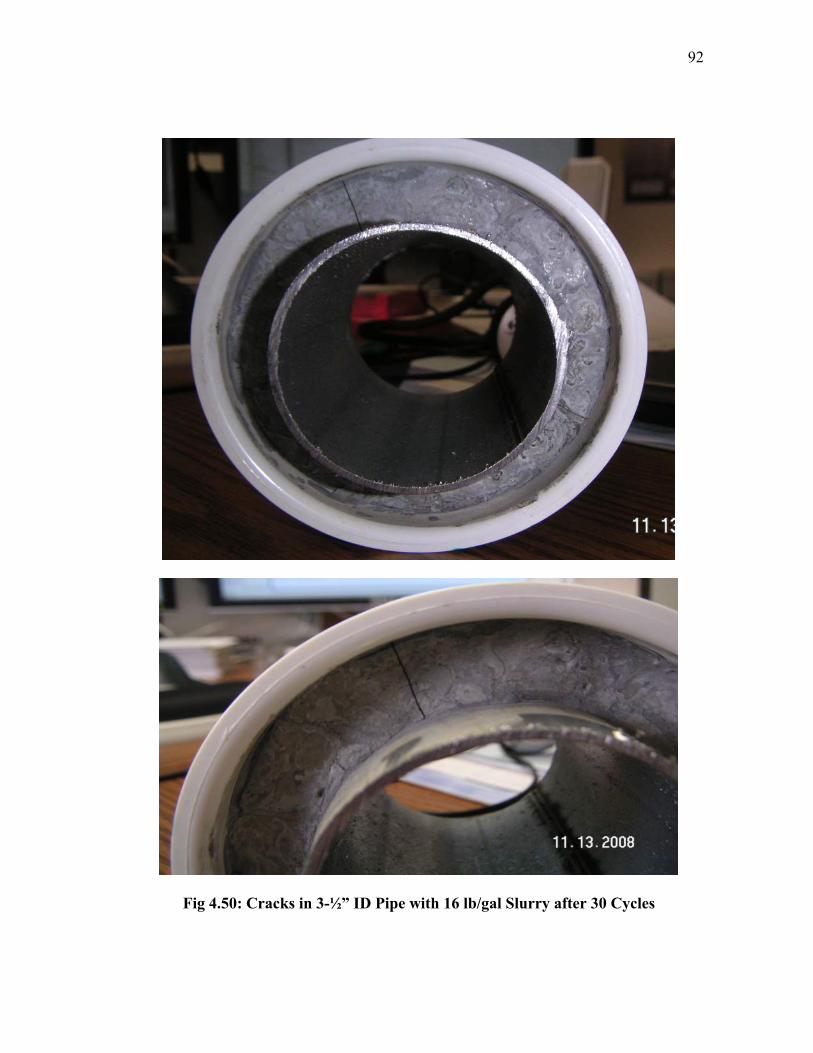
92
Fig 4.50: Cracks in 3-½” ID Pipe with 16 lb/gal Slurry after 30 Cycles

93
Fig 4.51: 4-½” ID Pipe with 16 lb/gal Slurry after De-bonding at 2,500 lb Force
94
5. CONCLUSIONS AND RECOMMENDATIONS
5.1 Conclusions
The drilling and completion of a well is a capital project that needs to be executed
properly. As a consequence, a detailed design is required, putting into consideration all
forces that may affect the integrity of a well throughout its life span.
An aid to such a detailed design is the analytical model which was developed in
this project that utilizes the wellbore parameters to evaluate stresses in the cement sheath
and has been developed into a software tool. It is a very flexible tool which enables
cement designers to optimize their design for HTHP conditions while at the same time
putting the design cost in perspective. Combined in synergy with finite element analysis,
it can be used to evaluate the fatigue and static loading behavior of the cement, thereby
helping to predict the life of the well. The analytical model can also be extended to
include fatigue properties of cement in the next phase of this project.
Experimental studies provided us with an insight into some fatigue and static
behavior of well cements. Fatigue failure in cement occurs when microscopic damage
within the microstructure of the cement, caused by initial cyclic loading, turns into
macroscopic cracks under gradually increasing loads. Cyclic loading impacts initial
damage and if loading is continued at load ratios above the critical ratio for a particular
cement mix, failure is imminent but may undergo many cycles when loaded below this
ratio. Loading conditions may affect the fatigue property of cement only when the
mechanical properties are such as to withstand static loading. Designs based solely on
95
static loading conditions may or may not be enough to ensure long term integrity
depending on prevailing downhole conditions, thus the need to take the analysis further
by also examining the effect of fatigue with additional experimental studies.
The mechanical properties of cement play a very important role in the static and
fatigue performance of cement. Ductile cement systems – cements with low Young’s
modulus and a high Poisson’s ratio – generally perform better under static and cyclic
loading conditions as compared to brittle cement systems, i.e. cement systems with a
high Young’s modulus and low Poisson’s ratio. Ductile cement systems generate
significantly lower values of tangential and radial stresses, while brittle cements are
more likely to generate higher tensile and radial stresses within their microstructure
under a particular loading condition.
The magnitude of confining stress and the mechanical properties of the formation
also play an important role in the static and fatigue behavior of both the cement and
casing. A large far field stress (formation pressure) acts to increase the performance of
the casing and counteracts high internal pressures, ensuring a minimal transfer to the
cement sheath. Also, the more brittle the formation (in terms of Young’s modulus and
Poisson’s ratio), the greater the stress transmitted to the casing and cement sheath.
5.2 Recommendations for Future Work
This study has focused on the effect of both static loading and fatigue behavior of well
cement based on analytical and finite element models. A significant amount of
experimental work is required in the following areas:

96
Developing equations specific to well cement. Equations (3.3), (3.4) and (3.26)
can be derived specifically for well cement from experimental data and linear
regression analysis. New failure mechanisms, crack initiation and propagation
and failure theories can also be developed from these data. This would help
expand the analytical model to include fatigue life prediction.
The findings reported in this work are centered mainly on the mechanical
properties of the cement and on loading conditions. The effect of other factors
like cement-water ratio etc should be investigated through experimental studies.
The effect of additives on the static and fatigue properties of well cement.
Performance of new cement systems with special properties like foam and
expansive cements should also be studied and data generated for them.

97
REFERENCES
1. Hahn, D.: “Why Do HP and HT Completions Require Rigorous Engineering
Design?”, paper SPE 101509, SPE Distinguished Lecture Series. 2. Ravi, K., Bosma, M., and Hunter, L.: “Optimizing the Cement Sheath Design in
HPHT Shearwater Field,” paper IADC/SPE 79905, IADC/SPE Drilling Conference, Amsterdam, Netherlands, February 2003.
3. Kim, J. and Kim, Y.: “Experimental Study of the Fatigue Behavior of High Strength
Concrete,” Cement and Concrete Research, Vol. 26, No. 10, 1996. 1513-1523. 4. Antrim, J.D.: “The Mechanism of Fatigue in Cement Paste and Plain Concrete”,
Highway Research Record, 210 no 6, 1965. 5. Breitenbucher, R., Alawieh, H., and Ibuk, H.: “Influence of Cyclic Loading on the
Degradation of Mechanical Concrete Properties,” Advances in Construction Materials, (August 2007) 317–324.
6. Breitenbucher, R. and Ibuk, H.: “Experimentally Based Investigations on the
Degradation-Process of Concrete under Cyclic Load,” Materials and Structures, (June 2006) 39,717–724.
7. Nayeb, H., Hashemi I., Cohen, M. D., and Erturk, T.: “Evaluation of Fatigue
Damage on the Mechanical Properties of Fiber Reinforced Cement Pastes,” Cement and Concrete Research, (May 1985)15, 879-888.
8. Bourgoyne, A.T., Millheim, K.K., Chenevert, M.E., and Young, F.S.: Applied
Drilling Engineering, SPE Textbook Series, Vol. 2, 1986. 9. Nelson, E.B.: “Well Cementing,” Development in Petroleum Science, Vol. 28, 1990. 10. Halliburton Energy Services: “Halliburton Cementing Technology Manual”, 2007. 11. US Department of Transport: “Portland Cement”,
www.fhwa.dot.gov/infrastructure/materialsgrp/cement.html , 2007. 12. Edgley, K., D., Sabins, F., L. and Watters, L., T.: “Supercement for Annular Seal
and Long Term Integrity in Deep, Hot Wells “ ‘Deep Trek’,” Phase II Annual Report, CSI Technologies, Houston. August 2005.
98
13. Pine, M., Hunter, L., Mutch, J., Adam, J., and Griffith, E.J.: “Selection of Foamed Cement for HPHT Gas Wells Proves Effective for Zonal Isolation-Case History,” paper IADC/SPE 79909, IADC/SPE Drilling Conference, Amsterdam, Netherlands, February 2003.
14. Ravi, K and Xenakis, H.: “Cementing Process Optimized to Achieve Zonal
Isolation”. Halliburton, January 2007. 15. Stiles, D.: “Effects of Long-Term Exposure to Ultrahigh Temperatures on
Mechanical Parameters of Cement,” paper SPE 98896, IADC/SPE Drilling Conference, Miami, Florida, February 2006.
16. Godwin, K.J., and Crook R.J.: “Cement Sheath Stress Failure,” SPE Drilling
Engineering, pp. 291-296, December 1992. 17. Fleckenstein, W.W., Eustes, A.W., and Miller, M. G.: “Burst Induced Stresses in
Cemented Well Bores,” paper SPE 62596, SPE/AAPG Western Regional Meeting, Long Beach, California, June 2000.
18. Gray, K.E., Podnos, E., and Becker, E.: “Finite Element Studies of Near-Wellbore
Region during Cementing Operations: Part 1,” Paper SPE 106998, SPE Production and Operations Symposium, Oklahoma City, Oklahoma, April 2007.
19. Heathman, J., and Beck, F.E.: “Finite Element Analysis Couples Casing and
Cement Design for HP/HT Wells in East Texas,” paper SPE 98896, IADC/SPE Drilling Conference, Miami, Florida, February 2006.
20. Rodriguez, W. J., Fleckenstein W.W., and Eustes A.W.: “Simulation of Collapsed
Load on Cemented Casing Using Finite Element Analysis,” paper SPE 84566, SPE Annual Technical Conference, Denver, Colorado, October 2003.
21. Schubert, J.J., Shahri, M.A., and Amani, M.: “Detecting and Modeling Cement
Failure in High Temperature/High Pressure (HP/HT) Wells Using Finite Element Methods,” paper IPTC 10961, IPTC Conference, Doha, Qatar, November 2005.
22. Ravi, K., Bosma, M., and Gastebled, O.: “Improve the Economics of Oil and Gas
Wells by Reducing the Risk of Cement Failure,” paper SPE 74497, IADC/SPE Drilling Conference, Dallas, Texas, February 2002.
23. Krusche, K., Johnson, C.R., Braud, N.Y., and Ghazi, H.B.: “Application of Cement
Engineered Solutions to Solve Long Term Cement Integrity Issues in Tunisia,” paper SPE 100390, SPE Annual Technical Conference, San Antonio, Texas, September 2006.

99
24. Avram, C., Facaoaru, I., Mirsu, O., Filimon, I., and Tertea, I.: “Concrete Strength and Strains,” Developments in Civil Engineering, Vol. 3, Elsevier Scientific Publishing Company, New York, 1981.
25. Newman, J., and Choo, B.S.: “Concrete Properties”, Advanced Concrete
Technology, Elsevier Butterworth-Heinemann, Boston, MA. 2003. 26. Cook, R.D. and Young, W.C.: Advanced Mechanics of Materials, 2nd ed. Prentice
Hall, Upper Saddle River, NJ. 1999.
Supplemental Sources Consulted
1. Magalhaes, A.G. et al. : “Mechanical Behavior of Cementitious Matrix Composite”, Cement and Concrete Composites, (1996)18 no 1, 9-22.
2. Bocca, P. and Crotti, M.: “Variations in the Mechanical Properties and Temperature
of Concrete Subjected to Cyclic Loads, Including High Loads,” Materials and Structures, (February 2003)36, 40-45.
3. Morris, A. D., and Garrett, G. G.: “A Comparative Study of the Static and Fatigue
Behavior of Plain and Steel Fiber Reinforced Mortar in Compression and Direct Tension,” The International Journal of Cement Composites and Lightweight Concrete, (May 1981) 3, no 2, 73-91.
4. Khandka R.K.: “Leakage behind Casing” M.S. Thesis, Norwegian University of
Science and Technology, Trondheim, 2007. 5. Alliche, A., and Francois, D.: “Fatigue Behavior of Hardened Cement Paste,”
Cement and Concrete Research, (January 1986)16, 199-206. 6. LeRoy-Delage, S., Baumgarte, C., Thiercelin M., and Vidick B.: “New Cement
Systems for Durable Zonal Isolation,” paper SPE 59132, IADC/SPE Drilling Conference, New Orleans, Louisiana, February 2000.
7. O’Brien, B.T.: “Case against Cementing Casing - Casing Annuli,” paper SPE 35106,
IADC/SPE Drilling Conference, New Orleans, Louisiana, March 1996. 8. Hancq, D.A.: “Fatigue Analysis using ANSYS”, ANSYS Inc.
http://www.caeai.com/papers/Fatigue_ANSYS.pdf, 2007. 9. Thiercelin, M.J., Dargaud, B., Baret, J.F., Rodriguez, W. J.: “Cement Design Based
on Cement Mechanical Response,” SPE Annual Technical Conference, San Antonio, Texas, 337–348, 1997.