cellulose from the green macroalgae ulva lactuca ... · sustainable development goals (griggs et...
TRANSCRIPT
ORIGINAL RESEARCH
Cellulose from the green macroalgae Ulva lactuca: isolation,characterization, optotracing, and production of cellulosenanofibrils
Niklas Wahlstrom . Ulrica Edlund . Henrik Pavia . Gunilla Toth .
Aleksander Jaworski . Andrew J. Pell . Ferdinand X. Choong . Hamid Shirani .
K. Peter R. Nilsson . Agneta Richter-Dahlfors
Received: 19 June 2019 / Accepted: 28 January 2020 / Published online: 8 February 2020
� The Author(s) 2020
Abstract We report (1) successful extraction and
characterization of cellulose from northern hemisphere
green macroalgae Ulva lactuca (Ulva fenestrata)
collected along the Swedish west coast and cultivated
indoors under controlled conditions, followed by (2) its
utilization in the production of lignin-free cellulose
nanofibrils (CNF). Cellulose was extracted by sequen-
tial treatment with ethanol, hydrogen peroxide, sodium
hydroxide, and hydrochloric acid, yielding a cellulose-
rich insoluble fraction. The extracted cellulose was
disintegrated into CNF using a mechanical homoge-
nization process without any further enzymatic pre-
treatments. In addition, regenerated cellulose was
prepared. XRD characterization of the CNF showed
characteristic peaks for the cellulose I allomorph and
confirmed that the nanofibrils were semicrystalline
with a crystallinity index of 48%. Regenerated cellu-
lose was mostly amorphous with an XRD pattern
indicating the presence of the cellulose II allomorph.
The cellulose fractions were essentially free from
inorganic substances and thermally stable up to around
260 �C. Structural mapping with CP-MAS 13C-NMR
sustains the cellulose content of CNF and regenerated
cellulose, respectively, yet ion chromatography iden-
tified the presence of 10–15% xylose in the fractions.
Optotracing was used as a novel and non-disruptive
tool to selectively assess the polysaccharide composi-
tion of the cellulose fractions and produced CNF
aiming to shed light on this hitherto non-resolved
origin of xylose in Ulva cell wall matter. Fluorescence
excitation and emission spectra of a panel of 4
oligothiophenes identified and verified the presence
of cellulose and sustain the conclusion that the isolated
fractions consist of cellulose intertwined with a small
amount of a xylose-containing glucan copolymer.
Electronic supplementary material The online version ofthis article (https://doi.org/10.1007/s10570-020-03029-5)contains supplementary material, which is available toauthorized users.
N. Wahlstrom � U. Edlund (&)
Fibre and Polymer Technology, KTH Royal Institute of
Technology, Teknikringen 56, 100 44 Stockholm,
Sweden
e-mail: [email protected]
H. Pavia � G. Toth
Department of Marine Sciences, Loven Centre for Marine
Sciences – Tjarno, University of Gothenburg,
452 96 Stromstad, Sweden
A. Jaworski � A. J. Pell
Department of Materials and Environmental Chemistry,
Arrhenius Laboratory, Stockholm University, Svante
Arrhenius vag 16C, 106 91 Stockholm, Sweden
F. X. Choong � A. Richter-Dahlfors
Swedish Medical Nanoscience Center, Department of
Neuroscience, Karolinska Institutet, Stockholm, Sweden
H. Shirani � K. P. R. Nilsson
Department of Chemistry, IFM, Linkoping University,
Linkoping, Sweden
123
Cellulose (2020) 27:3707–3725
https://doi.org/10.1007/s10570-020-03029-5(0123456789().,-volV)( 0123456789().,-volV)
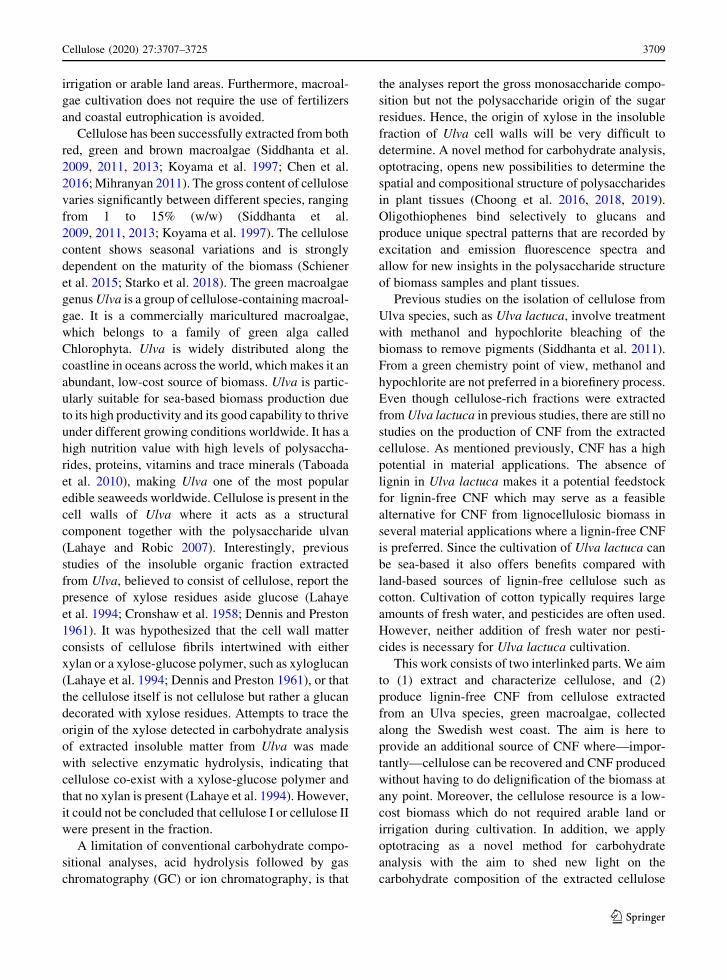
Graphic abstract
Keywords Nanocellulose � CNF � Extraction �Macroalgae � Ulva lactuca � Ulva fenestrata �Optotracing
Introduction
The use of cellulose-based materials has increased
rapidly during the past decades (Przybysz and Buzala
2014). Due to its low weight, low cost, non-toxicity,
high strength, and stiffness compared to many other
commercially used polymer materials, biodegradabil-
ity and recyclability, the market demand of cellulose-
based materials is steadily increasing. The increasing
use of cellulose-based materials is in line with the UN
Sustainable Development Goals (Griggs et al. 2013)
which endorses a transition from fossil-based materi-
als to materials from renewable resources. Hitherto,
the cellulose industry relies entirely on lignocellulosic
feedstock from terrestrial plants, especially wood and
cotton. The isolation of cellulose from wood requires
removal of the lignin, which involves harsh chemical
treatment of the biomass leading to partial degradation
of the cellulose (Ververis et al. 2004). Delignification
is energy consuming and the final cellulose fraction
may contain residual chemicals from the lignin-
removing process. In the native state, bio-synthesized
cellulose chains tend to self-assemble into microfibrils
which undergo further aggregation into larger assem-
blies, cellulose fibers, which build up terrestrial plant
cell walls. Cellulose nanofibrils (CNF) are produced
industrially by the disintegration of cellulose fibers
into particles with diameters in nanoscale. Typically,
CNF has a diameter of 5–50 nm and a length of a few
micrometers. The CNF production usually involves an
enzymatic or a chemical pre-treatment of cellulose
pulp followed by a mechanical homogenization pro-
cess. Cellulose fibers are exposed to high shear and
pressure during the homogenization process, which
will disintegrate cellulose fibers into the correspond-
ing nanofibrils. Due to its excellent mechanical
properties and environmental benefits, CNF can be
used in a wide variety of applications such as
composite materials, polymer films, foams, and in
biomedical applications (Lavoine et al. 2012; Kar-
garzadeh et al. 2018; Bettaieb et al. 2015; Naderi
2017; Siro and Plackett 2010; Tayeb et al. 2018;
Rocha et al. 2018; Shanmugam et al. 2017).
Aside from lignocellulosic biomass, cellulose is
found in the cell walls of marine biomass such as
macroalgae (Siddhanta et al. 2009, 2011, 2013;
Koyama et al. 1997; Chen et al. 2016; Mihranyan
2011). Cellulose from macroalgae has gained
increased attention recently since it offers several
benefits compared with cellulose from land-based
biomass. The absence of lignin in macroalgae leads to
purer cellulose fractions, potentially more suitable for
biomedical applications than lignocellulose (Halib
et al. 2017). Also, the absence of lignin opens up for
the possibility to extract the cellulose under milder
conditions leading to less degraded cellulose fractions.
Macroalgae is a low-cost source of biomass, which
grows quickly, and cultivation does not require
123
3708 Cellulose (2020) 27:3707–3725
irrigation or arable land areas. Furthermore, macroal-
gae cultivation does not require the use of fertilizers
and coastal eutrophication is avoided.
Cellulose has been successfully extracted from both
red, green and brown macroalgae (Siddhanta et al.
2009, 2011, 2013; Koyama et al. 1997; Chen et al.
2016; Mihranyan 2011). The gross content of cellulose
varies significantly between different species, ranging
from 1 to 15% (w/w) (Siddhanta et al.
2009, 2011, 2013; Koyama et al. 1997). The cellulose
content shows seasonal variations and is strongly
dependent on the maturity of the biomass (Schiener
et al. 2015; Starko et al. 2018). The green macroalgae
genus Ulva is a group of cellulose-containing macroal-
gae. It is a commercially maricultured macroalgae,
which belongs to a family of green alga called
Chlorophyta. Ulva is widely distributed along the
coastline in oceans across the world, which makes it an
abundant, low-cost source of biomass. Ulva is partic-
ularly suitable for sea-based biomass production due
to its high productivity and its good capability to thrive
under different growing conditions worldwide. It has a
high nutrition value with high levels of polysaccha-
rides, proteins, vitamins and trace minerals (Taboada
et al. 2010), making Ulva one of the most popular
edible seaweeds worldwide. Cellulose is present in the
cell walls of Ulva where it acts as a structural
component together with the polysaccharide ulvan
(Lahaye and Robic 2007). Interestingly, previous
studies of the insoluble organic fraction extracted
from Ulva, believed to consist of cellulose, report the
presence of xylose residues aside glucose (Lahaye
et al. 1994; Cronshaw et al. 1958; Dennis and Preston
1961). It was hypothesized that the cell wall matter
consists of cellulose fibrils intertwined with either
xylan or a xylose-glucose polymer, such as xyloglucan
(Lahaye et al. 1994; Dennis and Preston 1961), or that
the cellulose itself is not cellulose but rather a glucan
decorated with xylose residues. Attempts to trace the
origin of the xylose detected in carbohydrate analysis
of extracted insoluble matter from Ulva was made
with selective enzymatic hydrolysis, indicating that
cellulose co-exist with a xylose-glucose polymer and
that no xylan is present (Lahaye et al. 1994). However,
it could not be concluded that cellulose I or cellulose II
were present in the fraction.
A limitation of conventional carbohydrate compo-
sitional analyses, acid hydrolysis followed by gas
chromatography (GC) or ion chromatography, is that
the analyses report the gross monosaccharide compo-
sition but not the polysaccharide origin of the sugar
residues. Hence, the origin of xylose in the insoluble
fraction of Ulva cell walls will be very difficult to
determine. A novel method for carbohydrate analysis,
optotracing, opens new possibilities to determine the
spatial and compositional structure of polysaccharides
in plant tissues (Choong et al. 2016, 2018, 2019).
Oligothiophenes bind selectively to glucans and
produce unique spectral patterns that are recorded by
excitation and emission fluorescence spectra and
allow for new insights in the polysaccharide structure
of biomass samples and plant tissues.
Previous studies on the isolation of cellulose from
Ulva species, such as Ulva lactuca, involve treatment
with methanol and hypochlorite bleaching of the
biomass to remove pigments (Siddhanta et al. 2011).
From a green chemistry point of view, methanol and
hypochlorite are not preferred in a biorefinery process.
Even though cellulose-rich fractions were extracted
from Ulva lactuca in previous studies, there are still no
studies on the production of CNF from the extracted
cellulose. As mentioned previously, CNF has a high
potential in material applications. The absence of
lignin in Ulva lactuca makes it a potential feedstock
for lignin-free CNF which may serve as a feasible
alternative for CNF from lignocellulosic biomass in
several material applications where a lignin-free CNF
is preferred. Since the cultivation of Ulva lactuca can
be sea-based it also offers benefits compared with
land-based sources of lignin-free cellulose such as
cotton. Cultivation of cotton typically requires large
amounts of fresh water, and pesticides are often used.
However, neither addition of fresh water nor pesti-
cides is necessary for Ulva lactuca cultivation.
This work consists of two interlinked parts. We aim
to (1) extract and characterize cellulose, and (2)
produce lignin-free CNF from cellulose extracted
from an Ulva species, green macroalgae, collected
along the Swedish west coast. The aim is here to
provide an additional source of CNF where—impor-
tantly—cellulose can be recovered and CNF produced
without having to do delignification of the biomass at
any point. Moreover, the cellulose resource is a low-
cost biomass which do not required arable land or
irrigation during cultivation. In addition, we apply
optotracing as a novel method for carbohydrate
analysis with the aim to shed new light on the
carbohydrate composition of the extracted cellulose
123
Cellulose (2020) 27:3707–3725 3709
and the produced CNF. Even though Hughey et al.
(2019) suggested that the oldest available name for the
northern hemisphere ‘Ulva lactuca’ is Ulva fenestrata,
we will refer to the species used in our study as Ulva
lactuca for reasons of general understanding. In the
cellulose extraction process, we will try to replace
sodium hypochlorite and methanol with hydrogen
peroxide and ethanol in an attempt to apply greener
extraction conditions than those reported in previous
studies. Furthermore, the CNF will be produced
without any chemical or enzymatic defibrillating
pre-treatment prior to the mechanical homogenization
process. The extracted cellulose and the produced
CNF will be thoroughly characterized with respect to
crystallinity, microstructure, purity and chemical
composition, and carbohydrate composition.
Experimental
Materials
Hydrogen peroxide (H2O2, 30%, CAS nr: 7722-84-1),
hydrochloric acid (37%, CAS nr: 7647.01-0), sodium
acetate (99%, CAS nr: 127-09-3), sodium hydroxide
(NaOH, 99%, CAS nr: 1310-73-2), lithium chloride
(99%, CAS-nr: 7447-41-8), dimethylacetamide (99%,
CAS-nr: 127-19-5), a-cellulose, from Spruce wood
(99%, CAS-nr: 9004-34-6), L-(?)-arabinose (99%,
CAS nr: 5328-37-0), D-(?)-glucose (99%, CAS nr:
50-99-7), D-(?)-mannose (99%, CAS nr: 3458-28-4),
D-(?)-galactose (99%, CAS nr: 59-23-4), D-(?)-
xylose (99%, CAS nr: 58-86-6), L-(?) rhamnose
(99%, CAS nr: 10030-85-0, D-(?)-glucoronic acid
(98%, CAS nr: 6556-12-3) and D-(?) galacturonic
acid monohydrate (98%, CAS-nr: 91510-62-2) were
all purchased from Sigma Aldrich. Ethanol (99%,
CAS nr: 64-17-5) was purchased from VWR Chem-
icals. Iduronic acid (99%, CAS nr: 2073-35-0,61199-
83-5) was purchased from CarboSynth.
Cultivation of Ulva lactuca
Ulva lactuca were collected from Inre Vattenholmen
(58� 520 37.400 N 11� 60 52.100 E) and brought back to
the lab within 2 h of collection. Collected Ulva
lactuca were rinsed several times in natural seawater
to remove grazers and loose epiphytes. The seaweeds
were placed into cultivation tanks (90 L) under a
neutral light cycle (16 h daylight, 8 h darkness) at a
light intensity of 140 lE m-2 s-1. The light source
was an INDY66 LED 60 W 4000 K 6000 lm. The
seaweeds continuously received filtered seawater that
was passed through 1 lm filters. No additional
medium or chemicals were added to the water. The
natural seawater used in the flow-through system was
pumped in from the bay outside the Tjarno Marine
Laboratory (58� 520 36.400 N 11� 60 42.8400 E). Thus,
the salinity and temperature fluctuated depending on
the prevailing weather and seasonal conditions. Dur-
ing the cultivation period (March–May 2018), the
salinity ranged from 11 to 25 PSU and the temperature
increased from 4 to 19 �C.
Extraction of cellulose
The extraction of the cellulose was performed using
the method suggested by Siddhanta et al. (2009) with
some modifications to avoid the use of sodium
hypochlorite and methanol. The extraction procedure
is schematically shown in Fig. 1. Freeze-dried Ulva
lactuca (50 g) was ground to a fine powder using a
Bosch MKM6003 coffee miller (Clas Ohlson, Swe-
den) and subjected to Soxhlet extraction in EtOH
(85%) for 24 h at 120 �C to remove pigments and fatty
acids. The liquid phase was discarded and the
insoluble fraction was washed several times with
EtOH (99%) and dried in an oven at 37 �C for 16 h.
After drying, the sample was further treated to remove
residual green pigments and other colored impurities
by suspending the sample in 400 mL of 4% H2O2
followed by heating of the mixture to 80 �C for 16 h.
After cooling to room temperature, the mixture was
centrifuged at 5000 rpm for 15 min and the super-
natant was discarded. The insoluble fraction was
washed several times with water until the pH of the
washing water was 7 and was then suspended in
400 mL of 0.5 M NaOH. The mixture was kept at
60 �C for 16 h. After cooling to room temperature, the
mixture was centrifuged at 5000 rpm for 15 min and
the supernatant was discarded. The insoluble fraction
was washed several times with water until the pH of
the washing water was 7 and the insoluble fraction was
then suspended in 200 mL of 5% (v/v) HCl. The
mixture was heated to boiling and then cooled to 30 �Cand kept at this temperature for 16 h. The solution was
centrifuged at 5000 rpm for 15 min and the super-
natant was discarded. The insoluble fraction
123
3710 Cellulose (2020) 27:3707–3725
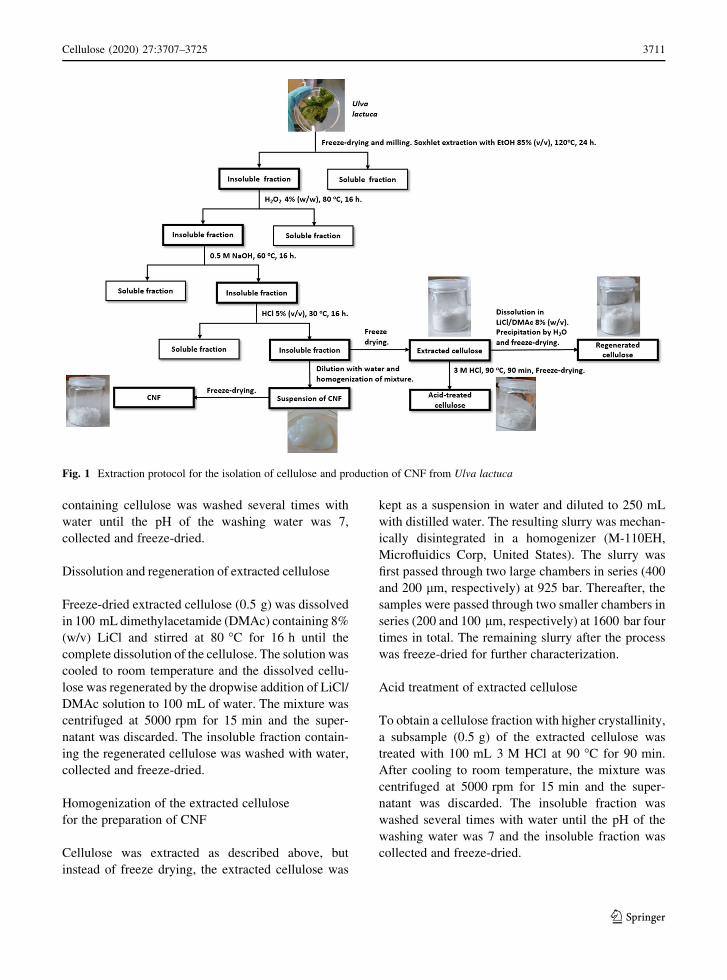
containing cellulose was washed several times with
water until the pH of the washing water was 7,
collected and freeze-dried.
Dissolution and regeneration of extracted cellulose
Freeze-dried extracted cellulose (0.5 g) was dissolved
in 100 mL dimethylacetamide (DMAc) containing 8%
(w/v) LiCl and stirred at 80 �C for 16 h until the
complete dissolution of the cellulose. The solution was
cooled to room temperature and the dissolved cellu-
lose was regenerated by the dropwise addition of LiCl/
DMAc solution to 100 mL of water. The mixture was
centrifuged at 5000 rpm for 15 min and the super-
natant was discarded. The insoluble fraction contain-
ing the regenerated cellulose was washed with water,
collected and freeze-dried.
Homogenization of the extracted cellulose
for the preparation of CNF
Cellulose was extracted as described above, but
instead of freeze drying, the extracted cellulose was
kept as a suspension in water and diluted to 250 mL
with distilled water. The resulting slurry was mechan-
ically disintegrated in a homogenizer (M-110EH,
Microfluidics Corp, United States). The slurry was
first passed through two large chambers in series (400
and 200 lm, respectively) at 925 bar. Thereafter, the
samples were passed through two smaller chambers in
series (200 and 100 lm, respectively) at 1600 bar four
times in total. The remaining slurry after the process
was freeze-dried for further characterization.
Acid treatment of extracted cellulose
To obtain a cellulose fraction with higher crystallinity,
a subsample (0.5 g) of the extracted cellulose was
treated with 100 mL 3 M HCl at 90 �C for 90 min.
After cooling to room temperature, the mixture was
centrifuged at 5000 rpm for 15 min and the super-
natant was discarded. The insoluble fraction was
washed several times with water until the pH of the
washing water was 7 and the insoluble fraction was
collected and freeze-dried.
Fig. 1 Extraction protocol for the isolation of cellulose and production of CNF from Ulva lactuca
123
Cellulose (2020) 27:3707–3725 3711

Characterization
Attenuated total reflectance Fourier transform
infrared spectroscopy (ATR-FTIR)
FTIR spectra of the dried cellulose fractions were
recorded between 4000 and 600 cm-1 at room tem-
perature using a Perkin-Elmer Spectrum 100 FTIR
with a triglycine detector and equipped with an
attenuated total reflectance crystal accessory (ATR
Golden Gate) from Graseby Specac LTD (Kent,
England). Corrections were made for atmospheric
water and carbon dioxide. The obtained spectra were
calculated as an average of 64 scans. The data were
analyzed using PerkinElmer Spectrum software.
High-performance anion exchange chromatography
with pulsed amperometric detection (HPAEC-PAD)
The monosaccharide and uronic acid composition of
the cellulose fractions were measured with an
HPAEC-PAD. Acid hydrolysis of the cellulose frac-
tions to hydrolyze the cellulose into monosaccharides
was performed by adding 0.8 mL 72% H2SO4 to
approximately 10 mg sample. The samples were left
on a shaking board at room temperature for 90 min.
Thereafter, 9.2 mL of water was added to obtain a final
volume of 10 mL. The samples were placed on a
shaking board and left for 70.5 h at 80 �C. The
composition of monosaccharides was determined
using a HPAEC-PAD (HPAEC-PAD, ICS-3000
Dionex, Sunnyvale, CA, USA). The column was a
CarboPac PA1 (4 9 250 mm) column, and MilliQ
water, 0.26 M NaOH and 0.17 M NaAc were used as
the mobile phase. A mixture of fucose, arabinose,
rhamnose, galactose, glucose, xylose, mannose, galac-
toronic acid, glucuronic acid, and iduronic acid was
used as the reference sample. The data were processed
and analyzed using Chromelon 7.1.
Thermal gravimetric analysis (TGA)
The thermal stability of the cellulose fractions, char
and ash contents of Ulva lactuca before extraction and
the cellulose fractions, were estimated using a Mettler
Toledo TGA/DSC. Approximately 4 mg of each
freeze-dried sample was heated in alumina cups from
40 to 800 �C at a heating rate of 10 �C/min under an
N2 atmosphere. After being heated to 800 �C, O2 was
introduced instead of N2 and the temperature was kept
at 800 �C for 15 min. The flow rate was set to 50 mL/
min. The char content was calculated as the weight
that remained after the samples were heated to 800 �Cin N2 and the ash content was calculated as the mass
remaining after finalizing the heating program. The
data were processed and analyzed using STARe
software.
Field-emission scanning electron microscopy (FE-
SEM)
The morphology of the CNF was observed by ultra-
high-resolution field emission scanning electron
microscopy (FE-SEM) using a Hitachi S-4800 oper-
ating at 5 kV. The CNF was freeze-dried overnight
and then attached to the sample supports using double-
sided adhesive carbon tape and sputter-coated with a
7 nm Pt/Pd layer using a Cressington 208HR under an
inert atmosphere.
X-ray diffraction (XRD)
The crystal structure and the crystallinity index of the
cellulose samples were measured at room temperature
using an Empyrean PAN-analytical XRD operating at
45 kV and 45 mA using monochromatic CuKa radi-
ation (k = 0.1541 nm) in the range 2h = 10�–40� with
a scan rate of 1.0 min-1. The crystallinity index
Crl(%) was calculated using Eq. 1 (Segal et al. 1959):
Crl ð%Þ ¼ I200 � Iam
I200
� 100 ð1Þ
where I200 is the intensity of the crystalline peak at
2h = 22� corresponding to the (200) plane and Iam is
the intensity at the local minimum of the curve at
2h = 18� corresponding to the amorphous regions of
the cellulose.
Atomic force microscopy (AFM)
The morphology of the CNF in the dry state was
analyzed using AFM (Multimode V, Bruker, Santa
Barbara, CA). Silicon wafers (1 9 1 cm) were used as
substrates for the adsorption. The wafers were washed
with absolute EtOH and MilliQ water. After washing,
the wafers were placed in an air plasma cleaner (model
PCD 002, Harrick Scientific Corporation, NY) for
3 min at 30 W. The wafers were immersed in 0.1 M
123
3712 Cellulose (2020) 27:3707–3725

NaOH for 2 min after which it was immersed in a
0.020 g/L solution of polyethyleneimine (PEI) for
2 min. After washing with water, the samples were
immersed in a 0.06 mg/mL suspension of CNF in
water for 2 min. The samples were dried using a flow
of nitrogen gas.
The silicon wafers were attached to AFM specimen
disc. The images were taken in the scanning-mode in
height, amplitude and phase modes by using an RTSP
silica cantilever (Bruker) having a spring constant of
5 Nm, a tip radius of 8 nm and a resonance frequency
of 150–200 kHz. Nanoscope Software (version 1.4,
Bruker Corporation) was used for data processing.
Solid-state nuclear magnetic resonance
spectroscopy (NMR)
1H ? 13C cross-polarization magic-angle-spinning
(CPMAS) NMR spectra were collected on a Bruker
Avance-III NMR spectrometer at a magnetic field
strength of 14.1 T (Larmor frequencies of 600.1 and
150.9 MHz for 1H and 13C, respectively) using
4.0 mm zirconia rotors at a MAS rate of 14.00 kHz.
Acquisitions involved proton 90 degree excitation
pulse of 4 ls and matched spin-lock fields that obeyed
a modified Hartmann-Hahn condition tH = tC ? tr.
Contact time of 500 us was used and SPINAL-64
proton decoupling at 60 kHz. From 16,384 to 24,576
signal transients with 4 s relaxation delays were
collected for each sample. Chemical shifts were
referenced with respect to neat tetramethylsilane
(TMS).
Synthesis of optotracers
q-FTAA, p-FTAA and h-FTAA was synthesized as
reported previously (Aslund et al. 2009; Klingstedt
et al. 2011) and HS-310 was synthesized as outlined
below. Chemicals and solvents were obtained from
commercial sources and used as received (Scheme 1).
Microwave reaction was performed using Biotage
Initiator microwave system. TLC was carried out on
Merck precoated 60 F254 plates using UV-light
(k = 254 nm and 366 nm) and charring with
ethanol/sulfuric acid/p-anisaldehyde/acetic acid
90:3:2:1 for visualization. NMR spectra were recorded
on a Varian 300 instrument (Varian Inc., Santa Clara,
CA, USA) operating at 300 MHz for 1H and
75.4 MHz for 13C, using the residual solvent signal
as reference. Analytical liquid chromatography/mass
spectrometry (LC/MS) was performed on a Waters
system equipped with a Waters 1525 gradient pump,
2998 Photodiode Array Detector, 2424 Evaporative
Light Scattering Detector, SQD 2 Mass Detector and
an Xbridge� C18 column (4.6 9 50 mm, 3.5 lm).
A mixture of dimer 1 (115 mg, 0.272 mmol), 5,50-dibromo-2-20-bithiophene (2) (40 mg, 0.123 mmol),
K2CO3 (86 mg, 0.618 mmol) and PEPPS-IPr
(4 mol%) in 1,4-dioxane/methanol (8: 2, 3 mL/mmol,
degassed) were added to a reaction vial, back filled
with nitrogen and the mixture was heated at 100 �C in
microwave system for 30 min. After cooling to room
temperature, the reaction was quenched by glacial
acetic acid and water (20 mL) added. The residue was
extracted with DCM (3 9 40 mL/mmol), washed
with water (2 9 30 mL), brine (30 mL) and the
combined organic phase was dried over Na2SO4,
filtrated and the solvent was evaporated. The crude
product was treated with warm MeOH and filtrated to
obtain hexamer as red solid, yield: 0.35 g (38%).
The hexamer was dissolved in 1,4-dioxane/water
(9:1) and hydrolyzed with NaOH (1 M, aqueous, 1.5
equiv./ester) at 80 �C for 16 h. The solution was
lyophilized to render HS-310 as a red solid with
quantitative yield.1H NMR (300 MHz, D2O) d 7.31 (d, J = 3.9 Hz,
1H), 6.95 (s, 2H), 6.89 (d, J = 3.9 Hz, 1H), 6.86 (s,
1H), 3.50 (s, 2H). 13C NMR (126 MHz, D2O) d179.0, 169.5, 139.9, 139.7, 135.6, 135.1, 134.9, 134.7,
131.3, 130.9, 128.0, 125.7, 124.8, 124.6, 38.3. LCMS
(ESI): m/z calcd for C30H18O8S6 (M ? H) 698.9
found: 699.7.
Optotracers and carbohydrates
Stock solutions (1 mg/mL) of h-FTAA, HS-310,
p-FTAA and q-FTAA in deionized water were stored
at 4 �C. Microcrystalline cellulose fibres (M. cellu-
lose, 100 lm) from cotton liners (CAS no. 9004-34-6)
were from Sigma-Aldrich, Stockholm, Sweden, and
used as reference samples to compare with the aglae
fraction produced in this work. Xyloglucan and xylose
were obtained from Sigma-Aldrich. Polysaccharides
were maintained as 2 mg/mL stock solutions at 4 �C.
123
Cellulose (2020) 27:3707–3725 3713
Optical recordings of optotracer–carbohydrate
interactions
Aliquots (100 lL) of each carbohydrate stock solution
were pipetted into individual wells of a white 96-well
round bottom microtiter plate (Corning, Stockholm,
Sweden). Optotracer stock solutions were diluted in
PBS, pH 7.4, (Sigma-Aldrich, Stockholm, Sweden) to
a final concentration of 1.33 lg/mL, from which
100 lL was added to each well. Samples were sealed
with adhesive PCR plate seals (Termo-Fischer, Stock-
holm, Sweden) and incubated at 4 �C on a rocking
shaker for 30 min. The plate was then positioned in a
Synergy MX platereader (Biotek, Stockholm, Swe-
den), the excitation spectra (emission at 545 nm) were
collected between 300 and 525 nm and the emission
spectrum (excitation at 450 nm) was collected
between 475 and 700 nm. Spectra were collected with
the instruments’ ‘top-down’ setting with 1 nm steps.
Data from experiments performed in triplicates were
processed and analyzed using Prism 6 (Graphpad,
USA).
Results and discussion
This work consists of two interlinked parts: (1)
cellulose extracted from the green macroalgae Ulva
lactuca collected along the Swedish west coast, and
(2) the subsequent production and characterization of
cellulose nanofibrils (CNF) from extracted cellulose.
In the first part, the cellulose was extracted using a
four-step process involving sequential treatment of the
biomass by EtOH, H2O2, NaOH, and HCl, after which
the cellulose was left as an insoluble fraction. In the
second part, CNF was produced from the extracted
cellulose with no further pre-treatments using a
mechanical homogenization process to generate
lignin-free CNF. The chemical composition, crys-
tallinity, and morphology of the produced CNF were
investigated. Both extracted cellulose and the pro-
duced CNF contain xylose residues, the origin of
which cannot be understood with ion chromatography.
Investigation by optotracing confirmed that the
extracted cellulose fraction indeed contain high-purity
cellulose, mixed with a xylose-glucose
polysaccharide.
Extraction of cellulose
About 1.1 g of extracted cellulose was obtained in the
extraction starting from 50.0 g freeze-dried biomass,
giving an overall yield of 2.2%(w/w) on a dry weight
basis. This value is very similar to the value reported
from extraction of Ulva lactuca collected in France
(Lahaye et al. 1994) but lower than the yield reported
from the extraction of cellulose from Ulva lactuca
collected in India (Siddhanta et al. 2009). The
chemical composition of Ulva lactuca is strongly
dependent on the local growing conditions, so Ulva
lactuca collected along the west coast of Sweden
cannot be directly compared to Ulva lactuca from
other localities. The age of algae individuals is another
factor that strongly influences the chemical composi-
tion (Starko et al. 2018). Ulva lactuca individuals used
in this study were harvested at an early stage of
maturity, which likely caused an overall lower content
of cellulose.
After the dissolution of 0.5 g of the extracted
cellulose fraction in LiCl/DMAc followed by precip-
itation and freeze-drying, 0.35 g of regenerated cellu-
lose was obtained which corresponds to 70% (w/w) of
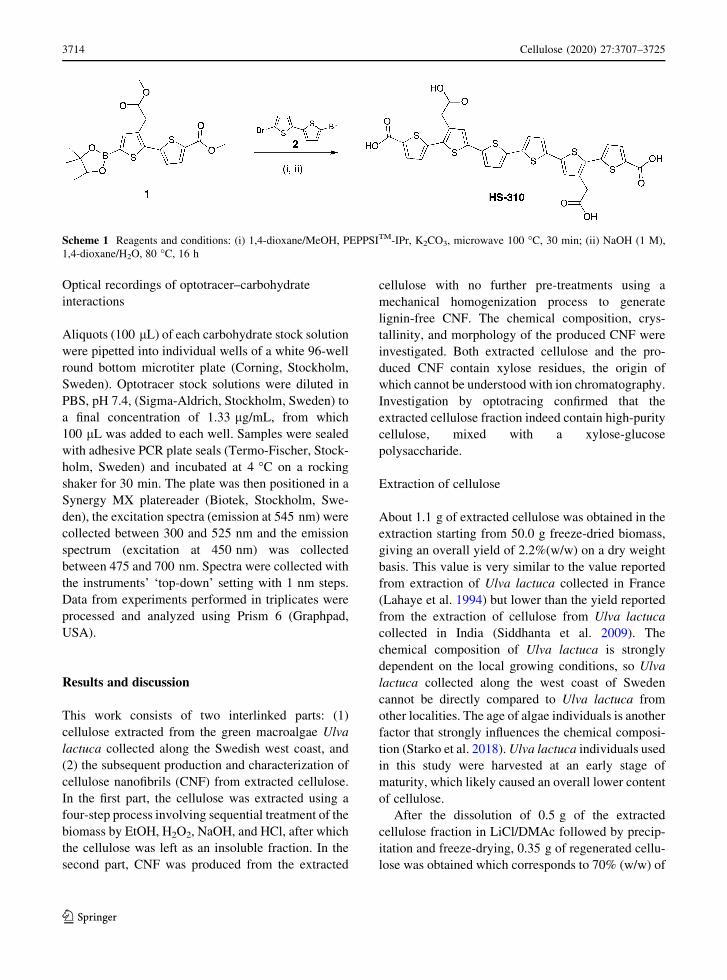
Scheme 1 Reagents and conditions: (i) 1,4-dioxane/MeOH, PEPPSITM-IPr, K2CO3, microwave 100 �C, 30 min; (ii) NaOH (1 M),
1,4-dioxane/H2O, 80 �C, 16 h
123
3714 Cellulose (2020) 27:3707–3725
the dissolved cellulose. This means that 30% (w/w) of
the dissolved cellulose remains in the supernatant after
precipitation. A possible explanation is that dissolu-
tion and heating of cellulose in LiCl/DMAc lead to
partial degradation of the cellulose over time due to
random cleavage of the glycosidic bonds (Potthast
et al. 2002, 2003) The cleavage of the glycosidic bonds
leads to a decrease in the average molecular weight
and formation of low molecular weight fragments.
These fragments might be soluble in the DMAc/water
mixture and will not precipitate upon addition of
water. Another possibility is that the extracted cellu-
lose fraction contains smaller amounts of other Ulva
lactuca cell-wall polysaccharides such as xyloglucan
or ulvan which may have a higher solubility than
cellulose in the DMAc/water mixture and thus not
fully precipitate upon the addition of water.
After the acidic treatment of 0.5 g of the extracted
cellulose, 0.34 g cellulose remained as an insoluble
fraction, which means that the cellulose was partially
degraded during the acidic treatment. The degradation
process is caused by acid hydrolysis which causes
cleavage of the glycosidic bonds.
Extracted cellulose was mechanically disintegrated
in a homogenizer to produce CNF, as further discussed
below.
Structural characterization of the extracted
cellulose and CNF
HPAEC-PAD analysis on the cellulose fractions was
carried out to determine the carbohydrate composi-
tion, targeting, in particular, the glucose purity indi-
cating if the cellulose fractions contain other cell-wall
carbohydrates such as ulvan, xylan and xyloglucan.
The chromatograms with assigned peaks from the
HPAEC-PAD analysis are shown in the supporting
information (Figs. S1–S4).
The cellulose fractions extracted from Ulva lactuca
contain mostly glucose (Table 1), but also a smaller
amount of xylose, which sustains that indeed a
glucose-rich polysaccharide was isolated in the
extraction. This is in agreement with previous studies,
which showed that an insoluble fraction consisting of
mostly glucose and smaller amounts of xylose is
obtained if Ulva lactuca is bleached and treated with
alkali (Lahaye et al. 1994; Bobin-Dubigeon et al.
1997; Cronshaw et al. 1958; Ray and Lahaye 1995).
However, the origin of the xylose moieties is still not
fully established. Lahaye et al. (1994) used enzymatic
depolymerization of the extracted cellulose followed
by HPLC analysis in an attempt to identify the origin
of the xylose. Their analysis suggests that the
extracted cellulose is likely a mixture of cellulose
and smaller amounts of xyloglucan rather than the
cellulose chain itself carrying the xylose residues. As
shown in our study, neither pigment removal nor an
additional post-production acidic treatment removed
the xylose from the sample. Even after treatment with
3 M HCl, the sample still contains xylose. This is a
possible indication that xylose and glucose units are, at
least to some extent, covalently linked and that the
cellulose is indeed a mixture of pure cellulose and a
xylose-glucose polymer such as xyloglucan. Another
possibility is that the insoluble fraction consists only
of a glucose-xylose polysaccharide and not true
cellulose I or II at all. Rhamnose, glucuronic acid,
and iduronic acid were not found in the samples
verifying that there is no ulvan in the samples. The
overall carbohydrate content in the regenerated cellu-
lose fraction was lower than in the extracted cellulose
and the CNF. This can be explained by the fact that
cellulose partially degrades upon dissolution in LiCl/
DMAc at higher temperatures. One of the suggested
degradation mechanisms is the peeling and degrada-
tion of monomer units at the reducing end of the
cellulose chain (Potthast et al. 2002, 2003). The
degradation of the monomers will lead to a lower
monosaccharide content in the regenerated sample and
therefore a lower carbohydrate content. The acid-
treated cellulose had the highest carbohydrate content
with an overall carbohydrate content of 89% (w/w),
probably because the acid-treatment removed impu-
rities that were present in the extracted cellulose.
Another interesting observation is that the regenerated
cellulose had a lower relative amount of xylose (10%)
compared with the extracted cellulose and CNF
(15%). This is another indication that the extracted
cellulose fraction is a mixture of cellulose and
xyloglucan. The xyloglucan is likely to have a higher
solubility in the DMAc/water mixture and will not
precipitate completely. Consequently, the regenerated
cellulose will be more enriched in pure cellulose than
the extracted cellulose before dissolution. The acid-
treated cellulose also contains a lower relative amount
of xylose (9%) than the extracted cellulose and CNF
(15%) further sustaining that the xyloglucan was
partly removed during the acid-treatment process. In
123
Cellulose (2020) 27:3707–3725 3715
conclusion, the HPAEC-PAD analysis verifies the
absence of ulvan and indicates that the extracted
fractions contain cellulose mixed with a xylose-
glucose polysaccharide, but cannot convincingly ver-
ify that the fractions contain cellulose I or II. Further
characterization is necessary.
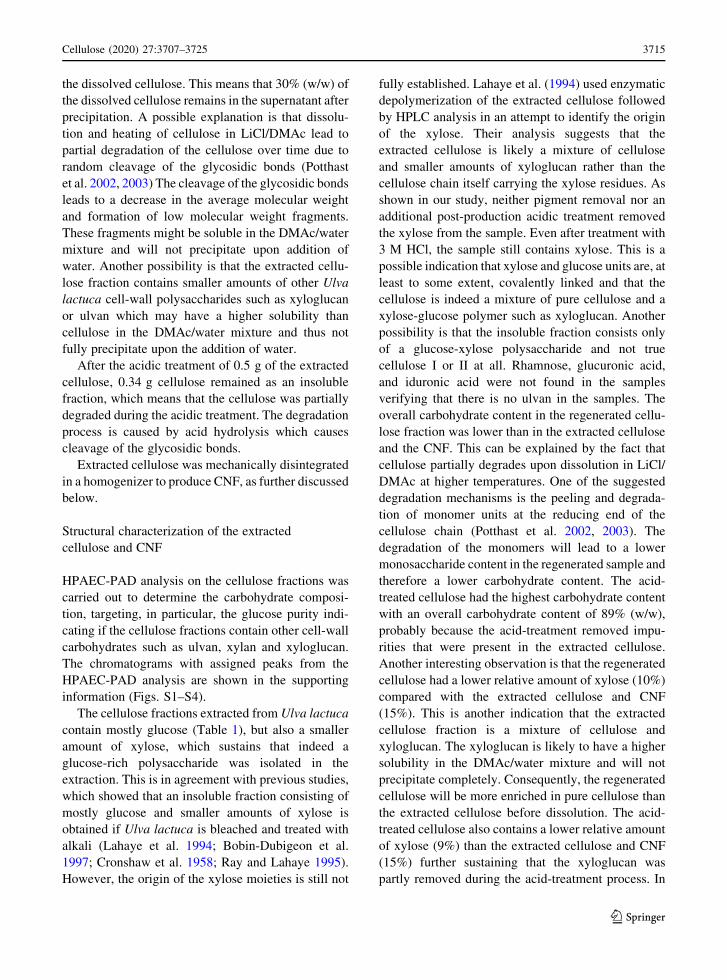
The cellulose fractions were further analyzed by
FTIR (Fig. 2). Lists of all assigned peaks are included
in the Supporting information (Tables S1–S4). The
FTIR spectra of the cellulose fractions show many of
the characteristic peaks for polysaccharides. The
broad bands at 3500–3200 cm-1 correspond to the
O–H stretching for the hydroxyl groups and the bands
in the range 3000–2800 cm-1 correspond to C–H
stretching. The peaks at 1420 cm-1 and 1315 cm-1
correspond to H–C–H scissor vibration and H–C–H tip
vibration, respectively. The sharp peaks around
1020–1050 cm-1 correspond to symmetric stretching
of C–O–C linkages. The small peak around 895 cm-1
is characteristic of the b-glycosidic bond, which is a
strong indication of the presence of polymeric
polysaccharides such as cellulose (Ververis et al.
2004). Importantly, the spectra show no traces of
strong peaks around 1220 cm-1 and 840–845 cm-1.
These peaks correspond to S=O stretching and C–O–S
stretching and are characteristic of the polysaccharide
ulvan, a major component of Ulva lactuca. The
absence of such peaks hence indicates that ulvan was
successfully removed from the cellulose fraction using
the proposed fractionation protocol, which is in
agreement with the results from the HPAEC-PAD
analysis. Furthermore, no peak around 1550 cm-1
corresponding to N–H bending in proteins was
observed indicating that the cellulose samples were
free from proteins. A small peak is observed around
1710 cm-1, possibly corresponding to C=O stretching
in oxycellulose (Zeronian and Inglesby 1995) indicat-
ing that oxidation of cellulose into oxycellulose took
place to a minor extent during the extraction, probably
during the bleaching step with hydrogen peroxide.
Oxidation of xyloglucan probably also occurred to
some extent. No significant differences were observed
between the extracted, regenerated, and the CNF
samples and all the samples show all the peaks that are
expected for cellulose.
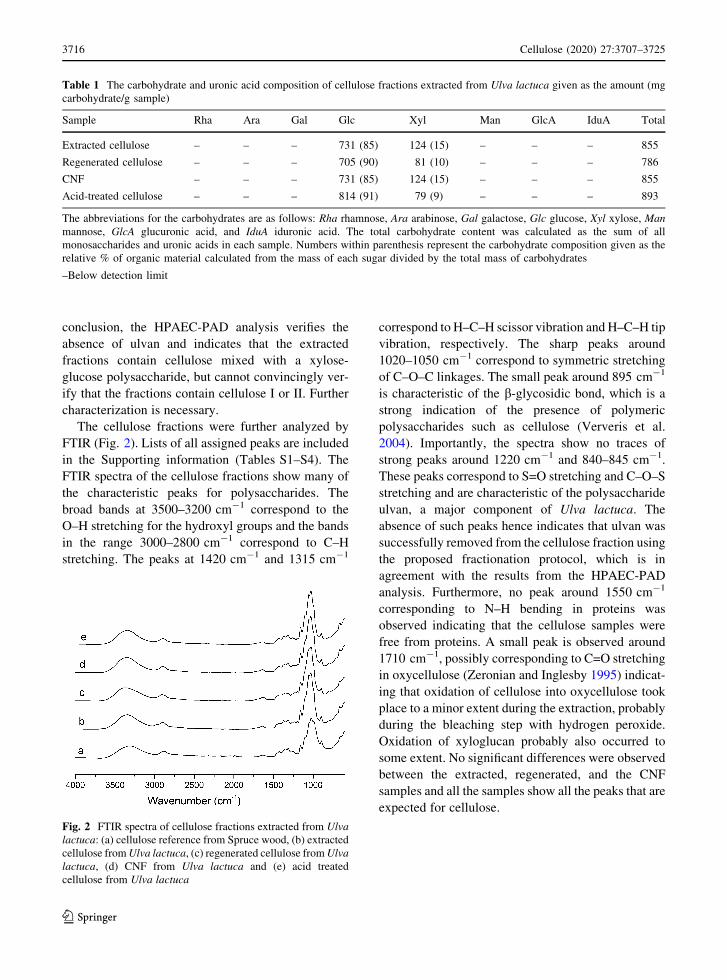
Table 1 The carbohydrate and uronic acid composition of cellulose fractions extracted from Ulva lactuca given as the amount (mg
carbohydrate/g sample)
Sample Rha Ara Gal Glc Xyl Man GlcA IduA Total
Extracted cellulose – – – 731 (85) 124 (15) – – – 855
Regenerated cellulose – – – 705 (90) 81 (10) – – – 786
CNF – – – 731 (85) 124 (15) – – – 855
Acid-treated cellulose – – – 814 (91) 79 (9) – – – 893
The abbreviations for the carbohydrates are as follows: Rha rhamnose, Ara arabinose, Gal galactose, Glc glucose, Xyl xylose, Man
mannose, GlcA glucuronic acid, and IduA iduronic acid. The total carbohydrate content was calculated as the sum of all
monosaccharides and uronic acids in each sample. Numbers within parenthesis represent the carbohydrate composition given as the
relative % of organic material calculated from the mass of each sugar divided by the total mass of carbohydrates
–Below detection limit
Fig. 2 FTIR spectra of cellulose fractions extracted from Ulva
lactuca: (a) cellulose reference from Spruce wood, (b) extracted
cellulose from Ulva lactuca, (c) regenerated cellulose from Ulva
lactuca, (d) CNF from Ulva lactuca and (e) acid treated
cellulose from Ulva lactuca
123
3716 Cellulose (2020) 27:3707–3725
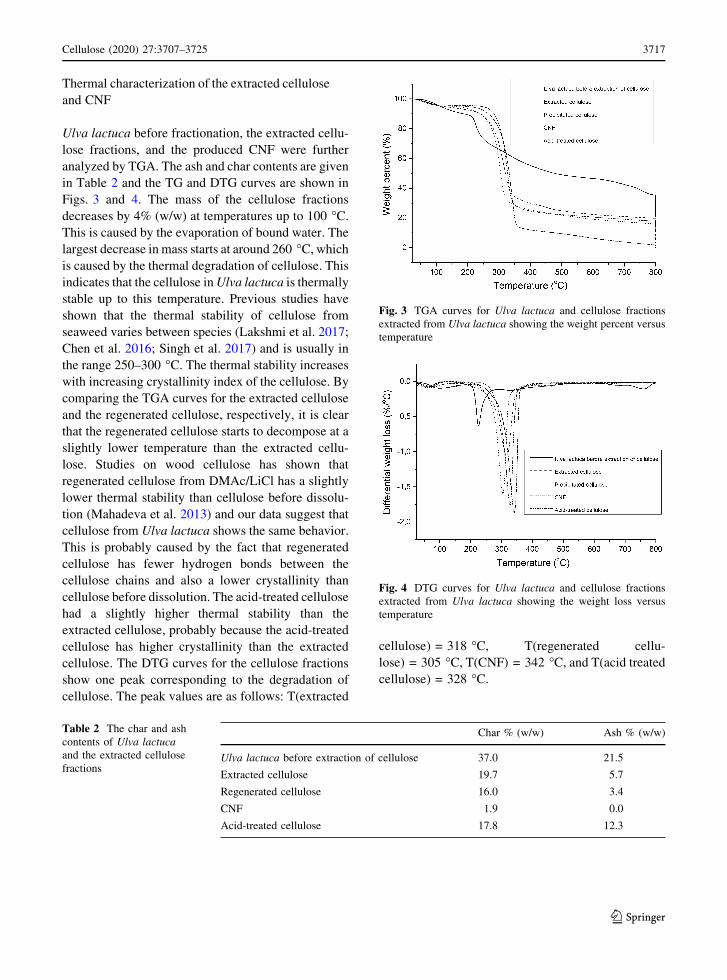
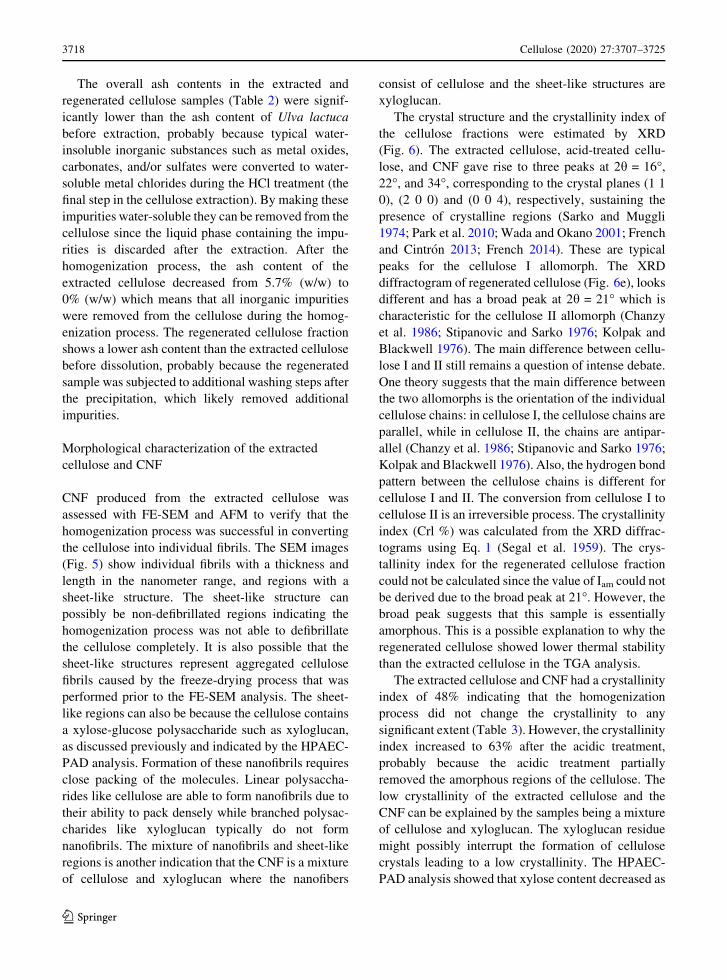
Thermal characterization of the extracted cellulose
and CNF
Ulva lactuca before fractionation, the extracted cellu-
lose fractions, and the produced CNF were further
analyzed by TGA. The ash and char contents are given
in Table 2 and the TG and DTG curves are shown in
Figs. 3 and 4. The mass of the cellulose fractions
decreases by 4% (w/w) at temperatures up to 100 �C.
This is caused by the evaporation of bound water. The
largest decrease in mass starts at around 260 �C, which
is caused by the thermal degradation of cellulose. This
indicates that the cellulose in Ulva lactuca is thermally
stable up to this temperature. Previous studies have
shown that the thermal stability of cellulose from
seaweed varies between species (Lakshmi et al. 2017;
Chen et al. 2016; Singh et al. 2017) and is usually in
the range 250–300 �C. The thermal stability increases
with increasing crystallinity index of the cellulose. By
comparing the TGA curves for the extracted cellulose
and the regenerated cellulose, respectively, it is clear
that the regenerated cellulose starts to decompose at a
slightly lower temperature than the extracted cellu-
lose. Studies on wood cellulose has shown that
regenerated cellulose from DMAc/LiCl has a slightly
lower thermal stability than cellulose before dissolu-
tion (Mahadeva et al. 2013) and our data suggest that
cellulose from Ulva lactuca shows the same behavior.
This is probably caused by the fact that regenerated
cellulose has fewer hydrogen bonds between the
cellulose chains and also a lower crystallinity than
cellulose before dissolution. The acid-treated cellulose
had a slightly higher thermal stability than the
extracted cellulose, probably because the acid-treated
cellulose has higher crystallinity than the extracted
cellulose. The DTG curves for the cellulose fractions
show one peak corresponding to the degradation of
cellulose. The peak values are as follows: T(extracted
cellulose) = 318 �C, T(regenerated cellu-
lose) = 305 �C, T(CNF) = 342 �C, and T(acid treated
cellulose) = 328 �C.
Table 2 The char and ash
contents of Ulva lactuca
and the extracted cellulose
fractions
Char % (w/w) Ash % (w/w)
Ulva lactuca before extraction of cellulose 37.0 21.5
Extracted cellulose 19.7 5.7
Regenerated cellulose 16.0 3.4
CNF 1.9 0.0
Acid-treated cellulose 17.8 12.3
Fig. 3 TGA curves for Ulva lactuca and cellulose fractions
extracted from Ulva lactuca showing the weight percent versus
temperature
Fig. 4 DTG curves for Ulva lactuca and cellulose fractions
extracted from Ulva lactuca showing the weight loss versus
temperature
123
Cellulose (2020) 27:3707–3725 3717
The overall ash contents in the extracted and
regenerated cellulose samples (Table 2) were signif-
icantly lower than the ash content of Ulva lactuca
before extraction, probably because typical water-
insoluble inorganic substances such as metal oxides,
carbonates, and/or sulfates were converted to water-
soluble metal chlorides during the HCl treatment (the
final step in the cellulose extraction). By making these
impurities water-soluble they can be removed from the
cellulose since the liquid phase containing the impu-
rities is discarded after the extraction. After the
homogenization process, the ash content of the
extracted cellulose decreased from 5.7% (w/w) to
0% (w/w) which means that all inorganic impurities
were removed from the cellulose during the homog-
enization process. The regenerated cellulose fraction
shows a lower ash content than the extracted cellulose
before dissolution, probably because the regenerated
sample was subjected to additional washing steps after
the precipitation, which likely removed additional
impurities.
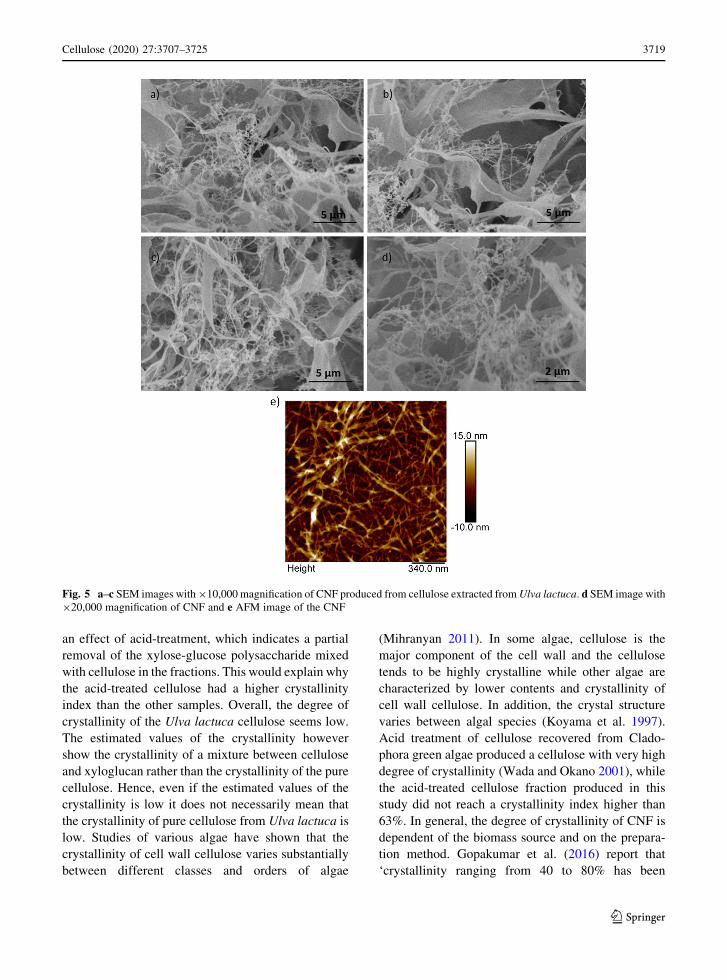
Morphological characterization of the extracted
cellulose and CNF
CNF produced from the extracted cellulose was
assessed with FE-SEM and AFM to verify that the
homogenization process was successful in converting
the cellulose into individual fibrils. The SEM images
(Fig. 5) show individual fibrils with a thickness and
length in the nanometer range, and regions with a
sheet-like structure. The sheet-like structure can
possibly be non-defibrillated regions indicating the
homogenization process was not able to defibrillate
the cellulose completely. It is also possible that the
sheet-like structures represent aggregated cellulose
fibrils caused by the freeze-drying process that was
performed prior to the FE-SEM analysis. The sheet-
like regions can also be because the cellulose contains
a xylose-glucose polysaccharide such as xyloglucan,
as discussed previously and indicated by the HPAEC-
PAD analysis. Formation of these nanofibrils requires
close packing of the molecules. Linear polysaccha-
rides like cellulose are able to form nanofibrils due to
their ability to pack densely while branched polysac-
charides like xyloglucan typically do not form
nanofibrils. The mixture of nanofibrils and sheet-like
regions is another indication that the CNF is a mixture
of cellulose and xyloglucan where the nanofibers
consist of cellulose and the sheet-like structures are
xyloglucan.
The crystal structure and the crystallinity index of
the cellulose fractions were estimated by XRD
(Fig. 6). The extracted cellulose, acid-treated cellu-
lose, and CNF gave rise to three peaks at 2h = 16�,22�, and 34�, corresponding to the crystal planes (1 1
0), (2 0 0) and (0 0 4), respectively, sustaining the
presence of crystalline regions (Sarko and Muggli
1974; Park et al. 2010; Wada and Okano 2001; French
and Cintron 2013; French 2014). These are typical
peaks for the cellulose I allomorph. The XRD
diffractogram of regenerated cellulose (Fig. 6e), looks
different and has a broad peak at 2h = 21� which is
characteristic for the cellulose II allomorph (Chanzy
et al. 1986; Stipanovic and Sarko 1976; Kolpak and
Blackwell 1976). The main difference between cellu-
lose I and II still remains a question of intense debate.
One theory suggests that the main difference between
the two allomorphs is the orientation of the individual
cellulose chains: in cellulose I, the cellulose chains are
parallel, while in cellulose II, the chains are antipar-
allel (Chanzy et al. 1986; Stipanovic and Sarko 1976;
Kolpak and Blackwell 1976). Also, the hydrogen bond
pattern between the cellulose chains is different for
cellulose I and II. The conversion from cellulose I to
cellulose II is an irreversible process. The crystallinity
index (Crl %) was calculated from the XRD diffrac-
tograms using Eq. 1 (Segal et al. 1959). The crys-
tallinity index for the regenerated cellulose fraction
could not be calculated since the value of Iam could not
be derived due to the broad peak at 21�. However, the
broad peak suggests that this sample is essentially
amorphous. This is a possible explanation to why the
regenerated cellulose showed lower thermal stability
than the extracted cellulose in the TGA analysis.
The extracted cellulose and CNF had a crystallinity
index of 48% indicating that the homogenization
process did not change the crystallinity to any
significant extent (Table 3). However, the crystallinity
index increased to 63% after the acidic treatment,
probably because the acidic treatment partially
removed the amorphous regions of the cellulose. The
low crystallinity of the extracted cellulose and the
CNF can be explained by the samples being a mixture
of cellulose and xyloglucan. The xyloglucan residue
might possibly interrupt the formation of cellulose
crystals leading to a low crystallinity. The HPAEC-
PAD analysis showed that xylose content decreased as
123
3718 Cellulose (2020) 27:3707–3725
an effect of acid-treatment, which indicates a partial
removal of the xylose-glucose polysaccharide mixed
with cellulose in the fractions. This would explain why
the acid-treated cellulose had a higher crystallinity
index than the other samples. Overall, the degree of
crystallinity of the Ulva lactuca cellulose seems low.
The estimated values of the crystallinity however
show the crystallinity of a mixture between cellulose
and xyloglucan rather than the crystallinity of the pure
cellulose. Hence, even if the estimated values of the
crystallinity is low it does not necessarily mean that
the crystallinity of pure cellulose from Ulva lactuca is
low. Studies of various algae have shown that the
crystallinity of cell wall cellulose varies substantially
between different classes and orders of algae
(Mihranyan 2011). In some algae, cellulose is the
major component of the cell wall and the cellulose
tends to be highly crystalline while other algae are
characterized by lower contents and crystallinity of
cell wall cellulose. In addition, the crystal structure
varies between algal species (Koyama et al. 1997).
Acid treatment of cellulose recovered from Clado-
phora green algae produced a cellulose with very high
degree of crystallinity (Wada and Okano 2001), while
the acid-treated cellulose fraction produced in this
study did not reach a crystallinity index higher than
63%. In general, the degree of crystallinity of CNF is
dependent of the biomass source and on the prepara-
tion method. Gopakumar et al. (2016) report that
‘crystallinity ranging from 40 to 80% has been
Fig. 5 a–c SEM images with 910,000 magnification of CNF produced from cellulose extracted from Ulva lactuca. d SEM image with
920,000 magnification of CNF and e AFM image of the CNF
123
Cellulose (2020) 27:3707–3725 3719

reported for the CNFs obtained from softwoods and
hardwoods.’
In-depth carbohydrate compositional
characterization of the extracted cellulose
and CNF
Further structural investigations of the cellulose
extracted from Ulva lactuca and the produced CNF
were performed with solid-state NMR (Fig. 7). The
reference cellulose sample shows all the characteristic
signals for cellulose. Signals at 65 and 63 ppm
correspond to the C6 carbon in crystalline and
amorphous regions in cellulose, respectively. The
strong signals at 76 and 73 ppm correspond to the C2,
C3, and C5 carbons. The weaker signals at 89 and
85 ppm correspond to the C4 carbon in crystalline and
amorphous regions in cellulose, respectively. The
signal at 105 ppm is attributed to the C1 carbon (Wada
et al. 2004). The spectra for the cellulose samples from
Ulva lactuca look similar, but some important differ-
ences can be observed. For the extracted cellulose,
acid-treated cellulose and CNF, the intensity of the
signal at 89 ppm corresponding to crystalline domains
is lower than for the reference samples indicating that
the crystallinity of these samples is lower than the
crystallinity for the reference samples, which is in
agreement with the XRD data (Table 3). The regen-
erated cellulose shows only a very faint signal at
89 ppm indicating that this sample is largely amor-
phous. The same behavior can be observed for the
signals from the C6 carbon. In the reference sample,
the signals corresponding to the crystalline regions
have the same intensity as the signal from the
amorphous regions. However, for the extracted,
acid-treated and CNF, the amorphous signal has a
higher intensity than the crystalline signal. For the
regenerated cellulose, we only see the amorphous
signals at 63 ppm and 85 ppm, which is another
indication that this sample is amorphous. As previ-
ously discussed, if the cellulose samples are indeed
mixtures of cellulose and xyloglucan, we would
expect individual signals from each monosaccharide
(glucose and xylose). However, the chemical shifts for
the C1–C5 carbons in xylose are very close to the
chemical shifts for C1–C6 in glucose (Lahaye et al.
Fig. 6 XRD diffractograms of (a) reference cellulose from
Spruce wood, (b) extracted cellulose (c) CNF (d) acid-treated
cellulose and (e) regenerated cellulose
Table 3 The crystallinity
index, Crl(%) for cellulose
fractions and CNF extracted
from Ulva lactuca
Sample I200 Iam Crl(%) = (I200 - Iam)/I200
Reference cellulose 1750 500 71
Extracted cellulose 1050 550 48
CNF 1050 550 48
Acid-treated cellulose 1350 500 63
Fig. 7 The CP-MAS 13C-NMR of cellulose fractions. (a) ref-
erence cellulose from Spruce wood, (b) extracted cellulose,
(c) CNF, (d) acid-treated cellulose and (e) regenerated cellulose
123
3720 Cellulose (2020) 27:3707–3725

1994) and since the peaks in the NMR spectra are very
broad, the peaks for glucose and xylose are likely to
overlap. The results from the solid-state NMR in
summary sustain that the extracted cellulose fractions
are mixtures of cellulose with a xylose-glucose
polysaccharide. Still, just as in the case of HPAEC-
PAD, the results cannot convincingly verify that the
fractions contain cellulose I or II.
Optotracing was developed as a non-disruptive
method to optically detect and visualize cellulose in
biological tissues in their native states. The method
utilizes optotracers, a class of molecular probes called
oligothiophenes, which bind selectively to glucans
producing a unique spectral pattern that identifies the
bound target. Applying heptameric (Choong et al.
2018) and pentameric (Choong et al. 2019) optotrac-
ers, cellulose can be clearly distinguished from a range
of glucans and glucose-containing heteropolysaccha-
rides based on differences in size and stereochemistry.
Here, we applied optotracing as a complementary tool
to overcome the limitation of HPAEC-PAD and solid-
state NMR to verify the polymeric origin of the
detected xylose and glucose building blocks in the
extracted cellulose. To determine if optotracing could
differentiate cellulose from xyloglucan, a panel of 4
optotracers ranging from heptameric to tetrameric was
screened against pure referenced samples of micro-
crystalline cellulose (M. cellulose), xyloglucan and
xylose. For easy comparison of spectral patterns and
wavelengths representing the peak amplitudes, the
fluorescence emitted by optotracers in each interaction
was normalized by calculating the percentage of the
emitted fluorescence at each excitation wavelength
relative to the highest and lowest values in the
spectrum (N. RFU). The N. RFU was then plotted in
Normalized Spec-Plots (Fig. 8). The wavelengths of
maximum excitation (Ex. kmax) and emission (Em.
kmax) are summarized in Table 4.
Analysis of the normalized Spec-Plots of h-FTAA
showed visibly different spectral patterns when in
interaction with cellulose and xyloglucan, which was
reflected in the 5 nm and 11 nm differences in Ex.
kmax and Em. kmax respectively. This indicated that
optotracing with h-FTAA could differentiate between
cellulose and xyloglucan.
Fig. 8 a Optotracer structures, b–e spectra patterns of opto-
tracers fluorescence emitted when M. cellulose (green),
xyloglucan (blue) and xylose (red) are interacting with b h-
FTAA, c HS-310, d p-FTAA and e q-FTAA. Optotracer alone
(black) is analyzed in parallel as a negative control
123
Cellulose (2020) 27:3707–3725 3721
Comparison of the normalized Spec-Plots of xylose
and xyloglucan indicated that the spectral pattern
collected of xyloglucan was not due to interactions
with monosaccharide, but more likely due to interac-
tions with the xyloglucan polysaccharide. To deter-
mine if the detection of xyloglucan, like cellulose, was
due to binding of the b-1,4-glucan segments, 1 mg/mL
of each polysaccharide were screened against hexam-
eric (HS-310), pentameric (p-FTAA) and tetrameric
(q-FTAA) optotracers. Analysis of each normalized
spec. plot showed unique spectral patterns in all
instances, whereby the spectral pattern of cellulose
and xyloglucan were different and distinct. This
indicates that the interaction between optotracers and
xyloglucan was along segments of the polysaccharide
substituted with 1,6-linked xylose side chains.
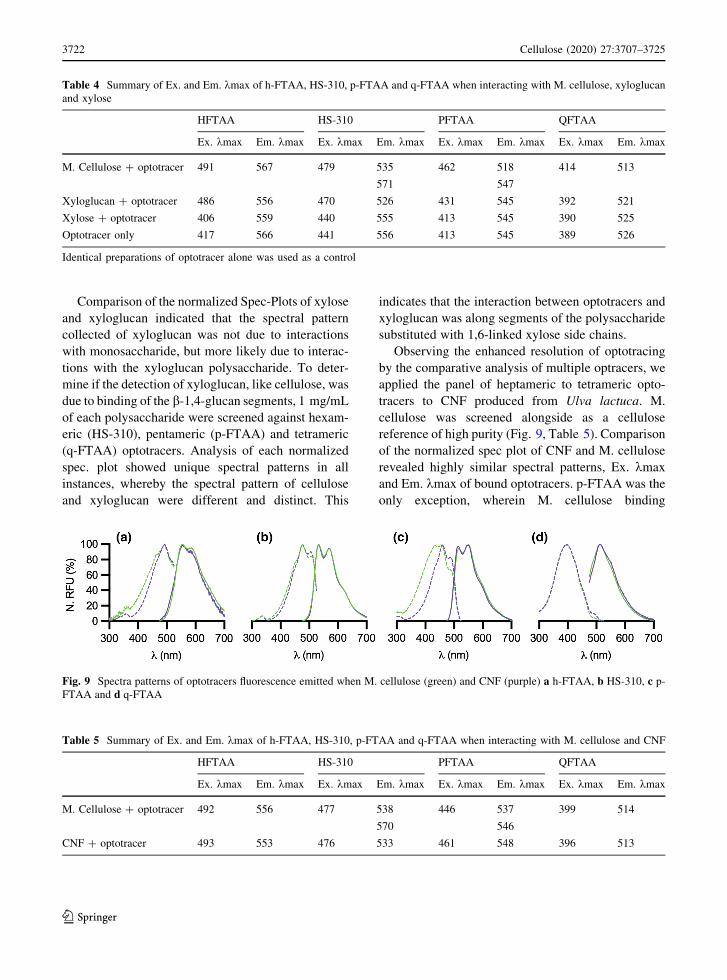
Observing the enhanced resolution of optotracing
by the comparative analysis of multiple optracers, we
applied the panel of heptameric to tetrameric opto-
tracers to CNF produced from Ulva lactuca. M.
cellulose was screened alongside as a cellulose
reference of high purity (Fig. 9, Table 5). Comparison
of the normalized spec plot of CNF and M. cellulose
revealed highly similar spectral patterns, Ex. kmax
and Em. kmax of bound optotracers. p-FTAA was the
only exception, wherein M. cellulose binding
Table 4 Summary of Ex. and Em. kmax of h-FTAA, HS-310, p-FTAA and q-FTAA when interacting with M. cellulose, xyloglucan
and xylose
HFTAA HS-310 PFTAA QFTAA
Ex. kmax Em. kmax Ex. kmax Em. kmax Ex. kmax Em. kmax Ex. kmax Em. kmax
M. Cellulose ? optotracer 491 567 479 535
571
462 518
547
414 513
Xyloglucan ? optotracer 486 556 470 526 431 545 392 521
Xylose ? optotracer 406 559 440 555 413 545 390 525
Optotracer only 417 566 441 556 413 545 389 526
Identical preparations of optotracer alone was used as a control
Fig. 9 Spectra patterns of optotracers fluorescence emitted when M. cellulose (green) and CNF (purple) a h-FTAA, b HS-310, c p-
FTAA and d q-FTAA
Table 5 Summary of Ex. and Em. kmax of h-FTAA, HS-310, p-FTAA and q-FTAA when interacting with M. cellulose and CNF
HFTAA HS-310 PFTAA QFTAA
Ex. kmax Em. kmax Ex. kmax Em. kmax Ex. kmax Em. kmax Ex. kmax Em. kmax
M. Cellulose ? optotracer 492 556 477 538
570
446 537
546
399 514
CNF ? optotracer 493 553 476 533 461 548 396 513
123
3722 Cellulose (2020) 27:3707–3725
produced an additional Ex. kmax at 446 nm, which
may be a reflection of the highly dense crystal
morphology of M. cellulose. Analysis by the opto-
tracer panel indicates that glucose detected in CNF
(Table 1) originates from cellulose. The absence of
other spectral patterns reminiscent of xyloglucan as
described in Fig. 8, suggests that the xylose fraction
detected during monosaccharide analysis is likely due
to the presence of another glucose-xylose copolymer.
This copolymer could possibly be the linear b-(1,4)
xyloglucan reported in previous studies (Lahaye et al.
1994; Lahaye and Robic 2007) which would then
differ from the branched b-(1,6) xyloglucan used as
the reference.
Conclusions
Cellulose was successfully extracted by sequential
treatment from the green macroalgae Ulva lactuca
collected along the Swedish west coast. The recovered
cellulose was then disintegrated into lignin-free cel-
lulose nanofibrils (CNF) using a mechanical homog-
enization process without any enzymatic or chemical
pre-treatment prior to the homogenization process. In
parallel, regenerated cellulose and acid-treated cellu-
lose were produced. The yield of extracted cellulose
was overall low because young Ulva lactuca individ-
uals were used.
Monosaccharide analysis of the extracted cellulose
and CNF shows that it contains mainly glucose, but
also a fraction of xylose indicating that the produced
cellulose fractions contain a mixture of cellulose and a
xylose-glucose polysaccharide, such as xyloglucan.
Acid-treatment or dissolution and regeneration of the
cellulose partly removed the xyloglucan residues.
Solid-state NMR and FTIR analyses support the
hypothesis of samples being mixtures of cellulose
and xyloglucan but cannot fully verify the existence of
cellulose I or II. Optotracing shows that CNF extracted
from Ulva lactuca exhibited the same spectral patterns
as that of M. cellulose originating from cotton.
Absence of similarity of this spectral pattern with that
of a pure xyloglucan reference indicates cellulose of
high purity present. Here, the ability to analyze
carbohydrates in its polymeric state was key to
uncovering the origin of xylose in extracted cellulose
samples.
Characterization of the morphology of the CNF by
FE-SEM and AFM shows both nanofibrils similar to
those found in lignocellulose and regions with a sheet-
like structure. Thermal analysis of the CNF shows that
it is free of inorganic ash and thermally stable up to
260 �C. XRD analysis showed characteristic peaks for
the cellulose I allomorph and the crystallinity index
was estimated to 48%. After dissolution in DMAc/
LiCl and precipitation in water, the crystal structure of
the cellulose changed from cellulose I to cellulose II
and the sample became largely amorphous.
Acknowledgments Open access funding provided by Royal
Institute of Technology. The authors thank Swedish Foundation
for Strategic Research (SSF), Project Number RBP14-0045 for
financial support. Thanks to Carl Moser at the division of Wood
Chemistry and Pulp Technology, KTH Royal Institute of
Technology, for running the homogenizer. Funding was
provided by Erling-Persson Family Foundation and Getinge
AB.
Compliance with ethical standards
Conflict of interest The authors declares that they no conflict
of interest.
Open Access This article is licensed under a Creative Com-
mons Attribution 4.0 International License, which permits use,
sharing, adaptation, distribution and reproduction in any med-
ium or format, as long as you give appropriate credit to the
original author(s) and the source, provide a link to the Creative
Commons licence, and indicate if changes were made. The
images or other third party material in this article are included in
the article’s Creative Commons licence, unless indicated
otherwise in a credit line to the material. If material is not
included in the article’s Creative Commons licence and your
intended use is not permitted by statutory regulation or exceeds
the permitted use, you will need to obtain permission directly
from the copyright holder. To view a copy of this licence, visit
http://creativecommons.org/licenses/by/4.0/.
References
Aslund A, Sigurdson CJ, Klingstedt T, Grathwohl S, Bolmont T,
Dickstein DL, Glimsdal E, Prokop S, Lindgren M, Kon-
radsson P, Holtzman DM, Hof PR, Heppner FL, Gandy S,
Jucker M, Aguzzi A, Hammarstrom P, Nilsson KPR (2009)
Novel pentameric thiophene derivatives for in vitro and
in vivo optical imaging of a plethora of protein aggregates
in cerebral amyloidoses. ACS Chem Biol 4:673–684.
https://doi.org/10.1021/cb900112v
Bettaieb F, Khiari R, Dufresne A, Mhenni MF, Belgacem MN
(2015) Mechanical and thermal properties of Posidonia
oceanica cellulose nanocrystal reinforced polymer.
123
Cellulose (2020) 27:3707–3725 3723
Carbohydr. Polym. 123:99–104. https://doi.org/10.1016/j.
carbpol.2015.01.026
Bobin-Dubigeon C, Lahaye M, Guillon F, Barry J, Gallant DJ
(1997) Factors limiting the biodegradation of Ulva sp cell-
wall polysaccharides. J Sci Food Agric 75(3):341–351.
https://doi.org/10.1002/(SICI)1097-0010(199711)75:3%
3c341:AID-JSFA888%3e3.0.CO;2-B
Chanzy H, Henrissat B, Vuong R, Revol J-F (1986) Structural
changes of cellulose crystals during the reversible trans-
formation cellulose I ? IIII in Valonia. Holzforschung
40(Suppl):25–30
Chen YW, Lee HV, Juan JC, Phang SM (2016) Production of
new cellulose nanomaterial from red algae marine biomass
Gelidium elegans. Carbohydr Polym 151:1210–1219.
https://doi.org/10.1016/j.carbpol.2016.06.083
Choong FX, Back M, Steiner SE, Melican K, Nilsson KPR,
Edlund U, Richter-Dahlfors A (2016) Nondestructive, real-
time determination and visualization of cellulose, hemi-
cellulose and lignin by luminescent oligothiophenes. Sci
Rep 6:35578. https://doi.org/10.1038/srep35578
Choong FX, Back M, Schultz A, Nilsson KPR, Edlund U,
Richter-Dahlfors A (2018) Stereochemical identification of
glucans by oligothiophenes enables cellulose anatomical
mapping in plant tissues. Sci Rep 8:3108. https://doi.org/
10.1038/s41598-018-21466-y
Choong FX, Lantz L, Shirani H, Schultz A, Nilsson KPR,
Edlund U, Richter-Dahlfors A (2019) Stereochemical
identification of glucans by a donor-acceptor-donor con-
jugated pentamer enables multi-carbohydrate anatomical
mapping in plant tissues. Cellulose 26:4253–4264. https://
doi.org/10.1007/s10570-019-02381-5
Cronshaw J, Myers A, Preston RD (1958) A chemical and
physical investigation of the cell walls of some marine
algae. Biochim Biophys Acta 27:89–103. https://doi.org/
10.1016/0006-3002(58)90295-6
Dennis DT, Preston RD (1961) Constitution of cellulose
microfibrils. Nature 191:667–668. https://doi.org/10.1038/
191667a0
French AD (2014) Idealized powder diffraction patterns for
cellulose polymorphs. Cellulose 21:885–896
French AD, Cintron MS (2013) Cellulose polymorphy, crys-
tallite size, and the Segal crystallinity index. Cellulose
20:583–588
Gopakumar DA, Thomas S, Grohens Y (2016) Chapter 8:
Nanocelluloses as innovative polymers for membrane
applications. In: Puglia D, Fortunati E, Kenny JM (eds)
Multifunctional polymeric nanocomposites based on cel-
lulosic reinforcements. Elsevier, Amsterdam, pp 253–275.
https://doi.org/10.1016/C2014-0-04565-0
Griggs D, Stafford-Smith M, Gaffney O, Rockstrom J, Ohman
MC, Shyamsundar P, Noble I (2013) Sustainable devel-
opment goals for people and planet. Nature 495(7441):305.
https://doi.org/10.1038/495305a
Halib N, Perrone F, Cemazar M, Dapas B, Farra R, Abrami M,
Murena L (2017) Potential applications of nanocellulose-
containing materials in the biomedical field. Materials
10(8):977. https://doi.org/10.3390/ma10080977
Hughey JR, Maggs CA, Mineur F, Jarvis C, Miller KA, Shabaka
SH, Gabrielson PW (2019) Genetic analysis of the Lin-
naean Ulva lactuca (Ulvales, Chlorophyta) holotype and
related type specimens reveals name misapplications,
unexpected origins, and new synonymies. J Phycol. https://
doi.org/10.1111/jpy.12860 (in press)Kargarzadeh H, Mariano M, Gopakumar D, Ahmad I, Thomas
S, Dufresne A, Huang J, Lin N (2018) Advances in cellu-
lose nanomaterials. Cellulose 25:2151–2189. https://doi.
org/10.1007/s10570-018-1723-5
Klingstedt T, Aslund A, Simon RA, Johansson LBG, Mason JJ,
Nystrom S, Hammarstrom P, Nilsson KPR (2011) Syn-
thesis of a library of oligothiophenes and their utilization as
fluorescent ligands for spectral assignment of protein
aggregates. Org Biomol Chem 9:8356–8370. https://doi.
org/10.1039/c1ob05637a
Kolpak FJ, Blackwell J (1976) Determination of the structure of
cellulose II. Macromolecules 9:273–278. https://doi.org/
10.1021/ma60050a019
Koyama M, Sugiyama J, Itoh T (1997) Systematic survey on
crystalline features of algal celluloses. Cellulose
4:147–160. https://doi.org/10.1023/A:1018427604670
Lahaye M, Robic A (2007) Structure and functional properties
of ulvan, a polysaccharide from green seaweeds.
Biomacromol 8(6):1765–1774. https://doi.org/10.1021/
bm061185q
Lahaye M, Jegou D, Buleon A (1994) Chemical characteristics
of insoluble glucans from the cell wall of the marine green
alga Ulva lactuca (L.) Thuret. Carbohydr Res
262:115–125. https://doi.org/10.1016/0008-
6215(94)84008-3Lakshmi DS, Trivedi N, Reddy CRK (2017) Synthesis and
characterization of seaweed cellulose derived car-
boxymethyl cellulose. Carbohydr Polym 157:1604–1610.
https://doi.org/10.1016/j.carbpol.2016.11.042
Lavoine N, Desloges I, Dufresne A, Bras J (2012) Microfibril-
lated cellulose—its barrier properties and applications in
cellulosic materials: a review. Carbohydr Polym
90(2):735–764. https://doi.org/10.1016/j.carbpol.2012.05.
026
Mahadeva S, Yeol Yang S, Kim J (2013) Effects of solvent
systems on its structure, properties and electromechanical
behavior of cellulose electro-active paper. Curr Organ
Chem 17(1):83–88. https://doi.org/10.2174/
138527213805289114
Mihranyan A (2011) Cellulose from Cladophorales green algae:
from environmental problem to high-tech composite
materials. J Appl Polym Sci 119:2449–2460. https://doi.
org/10.1002/app.32959
Naderi A (2017) Nanofibrillated cellulose: properties reinves-
tigated. Cellulose 24:1933–1945. https://doi.org/10.1007/
s10570-017-1258-1
Park S, Baker JO, Himmel ME, Parilla PA, Johnson DK (2010)
Cellulose crystallinity index: measurement techniques and
their impact on interpreting cellulase performance.
Biotechnol Biofuels 3:1–10. https://doi.org/10.1186/1754-
6834-3-10
Potthast A, Rosenau T, Sixta H, Kosma P (2002) Degradation of
cellulosic materials by heating in DMAc/LiCl. Tetrahedron
Lett 43:7757–7759. https://doi.org/10.1016/S0040-
4039(02)01767-7
Potthast A, Rosenau T, Sartori J, Sixta H, Kosma P (2003)
Hydrolytic processes and condensation reactions in the
cellulose solvent system N, N-dimethylacetamide/lithium
chloride. Part 2: degradation of cellulose. Polymer
123
3724 Cellulose (2020) 27:3707–3725
44(1):7–17. https://doi.org/10.1016/S0032-
3861(02)00751-6
Przybysz P, Buzała K (2014) Development directions of the raw
material base of the paper industry with regard to the sus-
tainable development concept. Fibres Text East Eur
22(4):18–23
Ray B, Lahaye M (1995) Cell-wall polysaccharides from the
marine green alga Ulva ‘‘rigida’’(Ulvales, Chlorophyta).
Extraction and chemical composition. Carbohydr Res
274:251–261. https://doi.org/10.1016/0008-
6215(95)00138-J
Rocha I, Lindh J, Hong J, Strømme M, Mihranyan A, Ferraz N
(2018) Blood compatibility of sulfonated cladophora
nanocellulose beads. Molecules 23(3):601. https://doi.org/
10.3390/molecules23030601
Sarko A, Muggli R (1974) Packing analysis of carbohydrates
and polysaccharides. III. Valonia cellulose and cellulose II.
Macromolecules 7:486–494. https://doi.org/10.1021/
ma60040a016
Schiener P, Black KD, Stanley MS, Green DH (2015) The
seasonal variation in the chemical composition of the kelp
species Laminaria digitata, Laminaria hyperborea, Sac-
charina latissima and Alaria esculenta. Appl Phycol
27(1):363–373. https://doi.org/10.1007/s10811-014-0327-
1
Segal L, Creely JJ, Martin AE Jr, Conrad CM (1959) An
Empirical method for estimating the degree of crystallinity
of native cellulose using the X-ray diffractometer. Text Res
J 29(10):786–794. https://doi.org/10.1177/
004051755902901003
Shanmugam K, Varanasi S, Garnier G, Batchelor W (2017)
Rapid preparation of smooth nanocellulose films using
spray coating. Cellulose 24(7):2669–2676. https://doi.org/
10.1007/s10570-017-1328-4
Siddhanta AK, Prasad K, Meena R, Prasad G, Mehta GK,
Chhatbar MU, Oza MD, Kumar S, Sanandiya ND (2009)
Profiling of cellulose content in Indian seaweed species.
Biores Technol 100:6669–6673. https://doi.org/10.1016/j.
biortech.2009.07.047
Siddhanta AK, Chhatbar MU, Mehta GK, Sanandiya ND,
Kumar S, Oza MD, Meena R (2011) The cellulose contents
of Indian seaweeds. J Appl Phycol 23(5):919–923. https://
doi.org/10.1007/s10811-010-9599-2
Siddhanta AK, Kumar S, Mehta GK, Chhatbar MU, Oza MD,
Sanandiya ND, Kondaveeti S (2013) Cellulose contents of
some abundant Indian seaweed species. Nat Prod Commun
8(4):497–500. https://doi.org/10.1177/
1934578X1300800423
Singh S, Gaikwad KK, Park SI, Lee YS (2017) Microwave-
assisted step reduced extraction of seaweed (Gelidiella
aceroso) cellulose nanocrystals. Int J Biol Macromol
99:506–510. https://doi.org/10.1016/j.ijbiomac.2017.03.
004
Siro I, Plackett D (2010) Microfibrillated cellulose and new
nanocomposite materials: a review. Cellulose
17(3):459–494. https://doi.org/10.1007/s10570-010-9405-
y
Starko S, Mansfield SD, Martone PT (2018) Cell wall chemistry
and tissue structure underlie shifts in material properties of
a perennial kelp. Eur J Phycol 53(3):307–317. https://doi.
org/10.1080/09670262.2018.1449013
Stipanovic AJ, Sarko A (1976) Packing analysis of carbohy-
drates and polysaccharides. 6. Molecular and crystal
structure of regenerated cellulose II. Macromolecules
9:851–857. https://doi.org/10.1021/ma60053a027
Taboada C, Millan R, Miguez I (2010) Composition, nutritional
aspects and effect on serum parameters of marine algae
Ulva rigida. J Sci Food Agric 3:445–449. https://doi.org/
10.1002/jsfa.3836
Tayeb A, Amini E, Ghasemi S, Tajvidi M (2018) Cellulose
nanomaterials—binding properties and applications: a
review. Molecules 23(10):2684. https://doi.org/10.3390/
molecules23102684
Ververis C, Georghiou K, Christodoulakis N, Santas P, Santas R
(2004) Fiber dimensions, lignin and cellulose content of
various plant materials and their suitability for paper pro-
duction. Ind Crops Prod 19(3):245–254. https://doi.org/10.
1016/j.indcrop.2003.10.006
Wada M, Okano T (2001) Localization of Ia and Ib phases in
algal cellulose revealed by acid treatments. Cellulose
8:183–188. https://doi.org/10.1023/A:1013196220602
Wada M, Heux L, Sugiyama J (2004) Polymorphism of cellu-
lose I family: reinvestigation of cellulose IV. Biomacromol
5(4):1385–1391. https://doi.org/10.1021/bm0345357
Zeronian SH, Inglesby MK (1995) Bleaching of cellulose by
hydrogen peroxide. Cellulose 2(4):265–272. https://doi.
org/10.1007/BF00811817
Publisher’s Note Springer Nature remains neutral with
regard to jurisdictional claims in published maps and
institutional affiliations.
123
Cellulose (2020) 27:3707–3725 3725