cellular networks modeling, analysis, and design using ... · key performance indicators (kpis)...
TRANSCRIPT
MotivationKey Performance Indicators (KPIs)
Stochastic Point ProcessesModeling, Analysis, and Design of Cellular Networks
High Density Small Cells Heterogenous Cellular NetworksResearch Directions and Conclusion
Cellular Networks Modeling, Analysis, and DesignUsing Stochastic Geometry
Hazem Ibrahim
Department of Electrical Engineering and Computer Science,York University, Toronto, Canada
EECS York University, Canada 1 / 39

MotivationKey Performance Indicators (KPIs)
Stochastic Point ProcessesModeling, Analysis, and Design of Cellular Networks
High Density Small Cells Heterogenous Cellular NetworksResearch Directions and Conclusion
Outline
1 Motivation
2 Key Performance Indicators (KPIs)
3 Stochastic Point Processes
4 Modeling, Analysis, and Design of Cellular Networks
5 High Density Small Cells Heterogenous Cellular Networks
6 Research Directions and Conclusion
EECS York University, Canada 2 / 39

MotivationKey Performance Indicators (KPIs)
Stochastic Point ProcessesModeling, Analysis, and Design of Cellular Networks
High Density Small Cells Heterogenous Cellular NetworksResearch Directions and Conclusion
BackgroundCoverage ProbabilitySolution
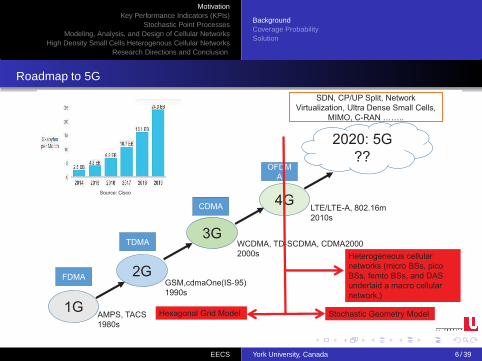
Roadmap to 5G
1G
2G
3G
4G
2020: 5G
??
AMPS, TACS
1980s
GSM,cdmaOne(IS 95)
1990s
WCDMA, TD SCDMA, CDMA2000
2000s
LTE/LTE-A, 802.16m
2010s
FDMA
OFDM
A
CDMA
TDMA
SDN, CP/UP Split, Network
Virtualization, Ultra Dense Small Cells,
MIMO, C-RAN ……..
Source: Cisco
EECS York University, Canada 3 / 39

MotivationKey Performance Indicators (KPIs)
Stochastic Point ProcessesModeling, Analysis, and Design of Cellular Networks
High Density Small Cells Heterogenous Cellular NetworksResearch Directions and Conclusion
BackgroundCoverage ProbabilitySolution
Roadmap to 5G
1G
2G
3G
4G
2020: 5G
??
AMPS, TACS
1980s
GSM,cdmaOne(IS 95)
1990s
WCDMA, TD SCDMA, CDMA2000
2000s
LTE/LTE-A, 802.16m
2010s
FDMA
OFDM
A
CDMA
TDMA
SDN, CP/UP Split, Network
Virtualization, Ultra Dense Small Cells,
MIMO, C-RAN ……..
Source: Cisco
Heterogeneous cellular
networks (micro BSs, pico
BSs, femto BSs, and DAS
underlaid a macro cellular
network,)
EECS York University, Canada 4 / 39

MotivationKey Performance Indicators (KPIs)
Stochastic Point ProcessesModeling, Analysis, and Design of Cellular Networks
High Density Small Cells Heterogenous Cellular NetworksResearch Directions and Conclusion
BackgroundCoverage ProbabilitySolution
Roadmap to 5G
1G
2G
3G
4G
2020: 5G
??
AMPS, TACS
1980s
GSM,cdmaOne(IS 95)
1990s
WCDMA, TD SCDMA, CDMA2000
2000s
LTE/LTE-A, 802.16m
2010s
FDMA
OFDM
A
CDMA
TDMA
SDN, CP/UP Split, Network
Virtualization, Ultra Dense Small Cells,
MIMO, C-RAN ……..
Source: Cisco
Heterogeneous cellular
networks (micro BSs, pico
BSs, femto BSs, and DAS
underlaid a macro cellular
network,)
Hexagonal Grid Model
EECS York University, Canada 5 / 39
MotivationKey Performance Indicators (KPIs)
Stochastic Point ProcessesModeling, Analysis, and Design of Cellular Networks
High Density Small Cells Heterogenous Cellular NetworksResearch Directions and Conclusion
BackgroundCoverage ProbabilitySolution
Roadmap to 5G
1G
2G
3G
4G
2020: 5G
??
AMPS, TACS
1980s
GSM,cdmaOne(IS 95)
1990s
WCDMA, TD SCDMA, CDMA2000
2000s
LTE/LTE-A, 802.16m
2010s
FDMA
OFDM
A
CDMA
TDMA
SDN, CP/UP Split, Network
Virtualization, Ultra Dense Small Cells,
MIMO, C-RAN ……..
Source: Cisco
Heterogeneous cellular
networks (micro BSs, pico
BSs, femto BSs, and DAS
underlaid a macro cellular
network,)
Stochastic Geometry Model Hexagonal Grid Model
EECS York University, Canada 6 / 39

MotivationKey Performance Indicators (KPIs)
Stochastic Point ProcessesModeling, Analysis, and Design of Cellular Networks
High Density Small Cells Heterogenous Cellular NetworksResearch Directions and Conclusion
BackgroundCoverage ProbabilitySolution
Modeling single-tier Cellular Network
Grid Model Actual 4G Deployment Poisson Point Process (PPP)
EECS York University, Canada 7 / 39

MotivationKey Performance Indicators (KPIs)
Stochastic Point ProcessesModeling, Analysis, and Design of Cellular Networks
High Density Small Cells Heterogenous Cellular NetworksResearch Directions and Conclusion
BackgroundCoverage ProbabilitySolution
Modeling single-tier Cellular Network
Grid Model Actual 4G Deployment Poisson Point Process (PPP)
Stochastic Network Model is better model for 4G macrocells!
EECS York University, Canada 8 / 39

MotivationKey Performance Indicators (KPIs)
Stochastic Point ProcessesModeling, Analysis, and Design of Cellular Networks
High Density Small Cells Heterogenous Cellular NetworksResearch Directions and Conclusion
BackgroundCoverage ProbabilitySolution
Modeling single-tier Cellular Network
J. Andrews, F. Baccelli, and R. Ganti, “A tractable approach to coverage and rate in cellular networks”
IEEE Transactions on Communications, vol. 59, no. 11, 2011.
EECS York University, Canada 9 / 39
MotivationKey Performance Indicators (KPIs)
Stochastic Point ProcessesModeling, Analysis, and Design of Cellular Networks
High Density Small Cells Heterogenous Cellular NetworksResearch Directions and Conclusion
BackgroundCoverage ProbabilitySolution
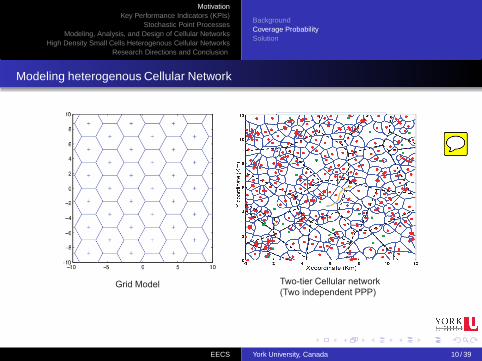
Modeling heterogenous Cellular Network
Grid Model
Actual 4G DeploymentAAAAAAAAAcccccttttttttttttuuuuuuuuuaaaaaaaaaaalllll 44444GGGGGGGGG DDDDDeeeeeppppplllllooooooooooooooooooyyyyyyyyymmmmmeeeeennnnttttt
Two-tier Cellular network
(Two independent PPP)
EECS York University, Canada 10 / 39

MotivationKey Performance Indicators (KPIs)
Stochastic Point ProcessesModeling, Analysis, and Design of Cellular Networks
High Density Small Cells Heterogenous Cellular NetworksResearch Directions and Conclusion
BackgroundCoverage ProbabilitySolution
Modeling heterogenous Cellular Network
Grid Model
Actual 4G DeploymentAAAAAAAAAcccccttttttttttttuuuuuuuuuaaaaaaaaaaalllll 44444GGGGGGGGG DDDDDeeeeeppppplllllooooooooooooooooooyyyyyyyyymmmmmeeeeennnnttttt
Two-tier Cellular network
(Two independent PPP)
Stochastic Network Model is better model for heterogenous cellularnetworks.
EECS York University, Canada 11 / 39
MotivationKey Performance Indicators (KPIs)
Stochastic Point ProcessesModeling, Analysis, and Design of Cellular Networks
High Density Small Cells Heterogenous Cellular NetworksResearch Directions and Conclusion
BackgroundCoverage ProbabilitySolution
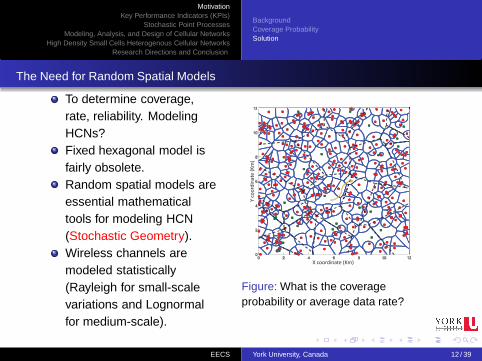
The Need for Random Spatial Models
To determine coverage,rate, reliability. ModelingHCNs?Fixed hexagonal model isfairly obsolete.Random spatial models areessential mathematicaltools for modeling HCN(Stochastic Geometry).Wireless channels aremodeled statistically(Rayleigh for small-scalevariations and Lognormalfor medium-scale).
Y c
oo
rdin
ate
(K
m)
X coordinate (Km)
Figure: What is the coverageprobability or average data rate?
EECS York University, Canada 12 / 39
MotivationKey Performance Indicators (KPIs)
Stochastic Point ProcessesModeling, Analysis, and Design of Cellular Networks
High Density Small Cells Heterogenous Cellular NetworksResearch Directions and Conclusion
BackgroundCoverage ProbabilitySolution
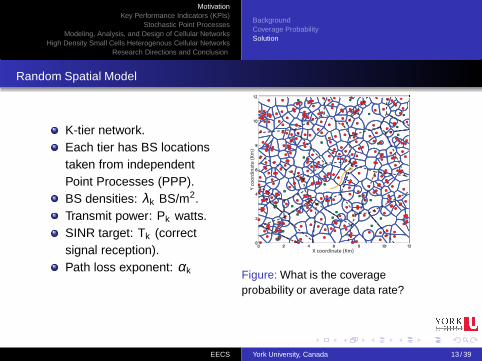
Random Spatial Model
K-tier network.Each tier has BS locationstaken from independentPoint Processes (PPP).BS densities: λk BS/m2.Transmit power: Pk watts.SINR target: Tk (correctsignal reception).Path loss exponent: αk
Y c
oo
rdin
ate
(K
m)
X coordinate (Km)
Figure: What is the coverageprobability or average data rate?
EECS York University, Canada 13 / 39

MotivationKey Performance Indicators (KPIs)
Stochastic Point ProcessesModeling, Analysis, and Design of Cellular Networks
High Density Small Cells Heterogenous Cellular NetworksResearch Directions and Conclusion
SINR ModelThe Shannon Limit5G Capacity
SINR Model
# Statistic characteristics of aggregation interference signal power:
• Propagation model
• Topology (Interferers spatial distribution).
• Available channels.
• Traffic model.
• MAC layer protocol (Network operation model).
• Association model.
EECS York University, Canada 14 / 39
MotivationKey Performance Indicators (KPIs)
Stochastic Point ProcessesModeling, Analysis, and Design of Cellular Networks
High Density Small Cells Heterogenous Cellular NetworksResearch Directions and Conclusion
SINR ModelThe Shannon Limit5G Capacity
The Shannon Limit
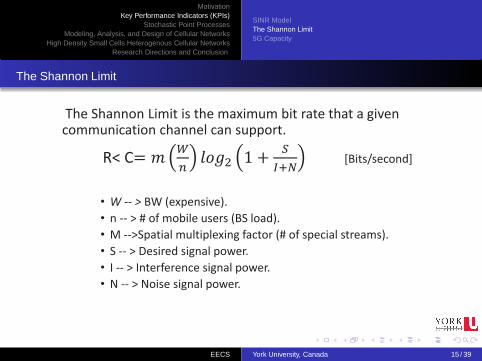
The Shannon Limit is the maximum bit rate that a given communication channel can support.
R< C [Bits/second]
• W -- > BW (expensive).
• n -- > # of mobile users (BS load).
• M -->Spatial multiplexing factor (# of special streams).
• S -- > Desired signal power.
• I -- > Interference signal power.
• N -- > Noise signal power.
EECS York University, Canada 15 / 39

MotivationKey Performance Indicators (KPIs)
Stochastic Point ProcessesModeling, Analysis, and Design of Cellular Networks
High Density Small Cells Heterogenous Cellular NetworksResearch Directions and Conclusion
SINR ModelThe Shannon Limit5G Capacity
5G Capacity
EECS York University, Canada 16 / 39

MotivationKey Performance Indicators (KPIs)
Stochastic Point ProcessesModeling, Analysis, and Design of Cellular Networks
High Density Small Cells Heterogenous Cellular NetworksResearch Directions and Conclusion
SINR ModelThe Shannon Limit5G Capacity
5G Capacity
EECS York University, Canada 17 / 39

MotivationKey Performance Indicators (KPIs)
Stochastic Point ProcessesModeling, Analysis, and Design of Cellular Networks
High Density Small Cells Heterogenous Cellular NetworksResearch Directions and Conclusion
SINR ModelThe Shannon Limit5G Capacity
5G Capacity
EECS York University, Canada 18 / 39

MotivationKey Performance Indicators (KPIs)
Stochastic Point ProcessesModeling, Analysis, and Design of Cellular Networks
High Density Small Cells Heterogenous Cellular NetworksResearch Directions and Conclusion
SINR ModelThe Shannon Limit5G Capacity
5G Capacity
EECS York University, Canada 19 / 39

MotivationKey Performance Indicators (KPIs)
Stochastic Point ProcessesModeling, Analysis, and Design of Cellular Networks
High Density Small Cells Heterogenous Cellular NetworksResearch Directions and Conclusion
Poisson point processPoisson cluster processHard core point process
Poisson point process
ψ = {xi ; i = 1,2,3,4, .......} ⊂R
d is a PPP with intensity λ if:
# of points N(B) fallinginside any compact setB ⊂ R
d is a Poissonrandom variable with amean λ‖B‖.
# of points in a disjoint setsare independent.
0 5 10 15 20 250
5
10
15
20
25
Figure: PPP in a 25m x 25m regionwith intensity 0.15 points/m2.
EECS York University, Canada 20 / 39

MotivationKey Performance Indicators (KPIs)
Stochastic Point ProcessesModeling, Analysis, and Design of Cellular Networks
High Density Small Cells Heterogenous Cellular NetworksResearch Directions and Conclusion
Poisson point processPoisson cluster processHard core point process
Poisson cluster process
0 5 10 15 20 250
5
10
15
20
25
Figure: (a)PPP in a 25m x 25mregion with intensity 0.15 points/m2.
0 5 10 15 20 250
5
10
15
20
25
Figure: (b)PCP in a 25m x 25mregion for the parent PPP in (a).
EECS York University, Canada 21 / 39
MotivationKey Performance Indicators (KPIs)
Stochastic Point ProcessesModeling, Analysis, and Design of Cellular Networks
High Density Small Cells Heterogenous Cellular NetworksResearch Directions and Conclusion
Poisson point processPoisson cluster processHard core point process
Hard core point process
0 5 10 15 20 250
5
10
15
20
25
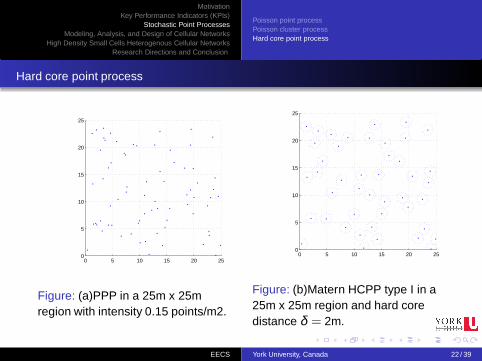
Figure: (a)PPP in a 25m x 25mregion with intensity 0.15 points/m2.
0 5 10 15 20 250
5
10
15
20
25
Figure: (b)Matern HCPP type I in a25m x 25m region and hard coredistance δ = 2m.
EECS York University, Canada 22 / 39

MotivationKey Performance Indicators (KPIs)
Stochastic Point ProcessesModeling, Analysis, and Design of Cellular Networks
High Density Small Cells Heterogenous Cellular NetworksResearch Directions and Conclusion
Aggregation interferenceCoverage probabilityAverage data rate
Aggregation interference modeling
Locations of interferers BSs are modeled as PP.
Aggregation interference can be modeled as LT of pdf or cdf .
No predefined expression for the pdf of the aggregationinterference.
Methods to model the aggregation interference:1 LT of the pdf of the aggregation interference.2 CF of the pdf of the aggregation interference.3 MGF of pdf of the aggregation interference.
Stochastic geometry provides a predefined way to obtain the LT,or CF or the MGF of the aggregation interference which isassociated with a specific point process.
EECS York University, Canada 23 / 39

MotivationKey Performance Indicators (KPIs)
Stochastic Point ProcessesModeling, Analysis, and Design of Cellular Networks
High Density Small Cells Heterogenous Cellular NetworksResearch Directions and Conclusion
Aggregation interferenceCoverage probabilityAverage data rate
Aggregation interference assumptions
How to tackle the problem of nonexistence of any useful closed-formexpression for the pdf of the interference?
BSs are distributed as a PPP and both desired and interferingsignals are modeled as Rayleigh fading with channel power gainhxy ∼ exp(µ).Approximate the pdf of the aggregation interference by one of theknown pdf distributions. Then, LT, CF, and MGF can be used.
Considering only the effect of nearest interferers assumption[dominant interferers and assuming a high pass loss exponent,i.e, α = 4].
EECS York University, Canada 24 / 39
MotivationKey Performance Indicators (KPIs)
Stochastic Point ProcessesModeling, Analysis, and Design of Cellular Networks
High Density Small Cells Heterogenous Cellular NetworksResearch Directions and Conclusion
Aggregation interferenceCoverage probabilityAverage data rate
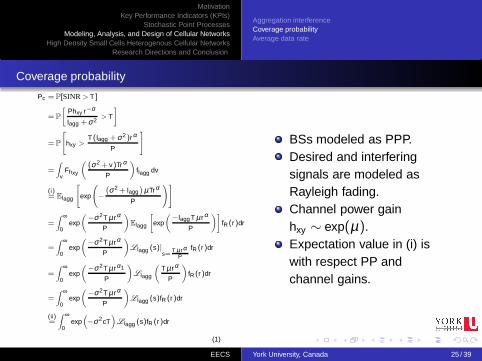
Coverage probability
Pc = P[SINR > T ]
= P
[
Phxy r−α
Iagg +σ2> T
]
= P
[
hxy >T(Iagg +σ2)rα
P
]
=
∫
vFhxy
(
(σ2 + v)Trα
P
)
fIagg dv
(i)= EIagg
[
exp
(
−
(
σ2 + Iagg)
µTrα
P
)]
=∫ ∞
0exp
(
−σ2T µrα
P
)
EIagg
[
exp
(
−Iagg T µrα
P
)]
fR(r)dr
=∫ ∞
0exp
(
−σ2T µrα
P
)
LIagg (s)|s=
T µrαP
fR (r)dr
=∫ ∞
0exp
(
−σ2T µrα1
P
)
LIagg
(
T µrα
P
)
fR(r)dr
=∫ ∞
0exp
(
−σ2T µrα
P
)
LIagg (s)fR (r)dr
(ii)=∫ ∞
0exp(
−σ2cT)
LIagg (s)fR (r)dr
(1)
BSs modeled as PPP.Desired and interferingsignals are modeled asRayleigh fading.Channel power gainhxy ∼ exp(µ).Expectation value in (i) iswith respect PP andchannel gains.
EECS York University, Canada 25 / 39
MotivationKey Performance Indicators (KPIs)
Stochastic Point ProcessesModeling, Analysis, and Design of Cellular Networks
High Density Small Cells Heterogenous Cellular NetworksResearch Directions and Conclusion
Aggregation interferenceCoverage probabilityAverage data rate
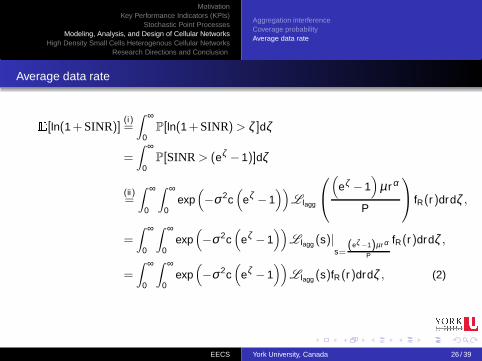
Average data rate
E[ln(1+SINR)](i)=
∫ ∞
0P[ln(1+SINR)> ζ ]dζ
=∫ ∞
0P[SINR > (eζ − 1)]dζ
(ii)=
∫ ∞
0
∫ ∞
0exp(
−σ2c(
eζ − 1))
LIagg
(
eζ − 1)
µrα
P
fR(r)drdζ ,
=∫ ∞
0
∫ ∞
0exp(
−σ2c(
eζ − 1))
LIagg (s)|s=
(eζ −1)µrα
P
fR(r)drdζ ,
=
∫ ∞
0
∫ ∞
0exp(
−σ2c(
eζ − 1))
LIagg (s)fR(r)drdζ , (2)
EECS York University, Canada 26 / 39

MotivationKey Performance Indicators (KPIs)
Stochastic Point ProcessesModeling, Analysis, and Design of Cellular Networks
High Density Small Cells Heterogenous Cellular NetworksResearch Directions and Conclusion
Single-tier cellular networksMulti-tier heterogenous cellular networksResource allocation and interference management
Single-tier cellular networks
Coverage of BSs forms a PoissonVoronoi tessellation.
Pc and data rate do not depend onBSs density [interference limited(σ2 = 0)] [?].
BSs intensity ↑ =⇒ neither increasethe coverage probability nor degradeit.
Coverage probability ↑ =⇒Interference management (inter-cellcooperation and frequency reuse).
0 5 10 15 20 250
5
10
15
20
25
EECS York University, Canada 27 / 39

MotivationKey Performance Indicators (KPIs)
Stochastic Point ProcessesModeling, Analysis, and Design of Cellular Networks
High Density Small Cells Heterogenous Cellular NetworksResearch Directions and Conclusion
Single-tier cellular networksMulti-tier heterogenous cellular networksResource allocation and interference management
Multi-tier heterogenous cellular networks
Small cells (micro BS, pico BSs,femto BSs, relays and DAS) =⇒underlaid macro cellular.
Macro BSs =⇒ 40 W.
Small cells =⇒ 250 mW to 2 W.
Mobile user association =⇒maximum received power.
Multi-tier cellular network =⇒weighted Possion Voronoitessellation.
Y c
oo
rdin
ate
(K
m)
X coordinate (Km)
EECS York University, Canada 28 / 39
MotivationKey Performance Indicators (KPIs)
Stochastic Point ProcessesModeling, Analysis, and Design of Cellular Networks
High Density Small Cells Heterogenous Cellular NetworksResearch Directions and Conclusion
Single-tier cellular networksMulti-tier heterogenous cellular networksResource allocation and interference management
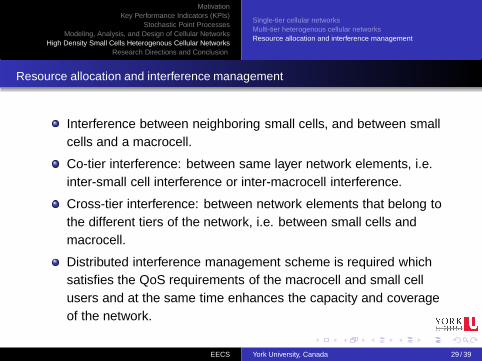
Resource allocation and interference management
Interference between neighboring small cells, and between smallcells and a macrocell.
Co-tier interference: between same layer network elements, i.e.inter-small cell interference or inter-macrocell interference.
Cross-tier interference: between network elements that belong tothe different tiers of the network, i.e. between small cells andmacrocell.
Distributed interference management scheme is required whichsatisfies the QoS requirements of the macrocell and small cellusers and at the same time enhances the capacity and coverageof the network.
EECS York University, Canada 29 / 39

MotivationKey Performance Indicators (KPIs)
Stochastic Point ProcessesModeling, Analysis, and Design of Cellular Networks
High Density Small Cells Heterogenous Cellular NetworksResearch Directions and Conclusion
Single-tier cellular networksMulti-tier heterogenous cellular networksResource allocation and interference management
Resource allocation and interference management OFDMA-based BSs
Small cells and macrocell =⇒OFDMA-based BSs.
BSs schedule resource blocks tomobile users using FDD and TDD.
LTE and LTE-A =⇒ frequency reusefactor=1 (⇑ spectrum efficiency).
High inter-cell interfere for cell edgeusers.
Interference coordination ismandatory to enhances the capacityand coverage of the network.
Coordination between BSs =⇒ X2interface.
Figure: Resource blocksscheduling LTE downlink.
EECS York University, Canada 30 / 39

MotivationKey Performance Indicators (KPIs)
Stochastic Point ProcessesModeling, Analysis, and Design of Cellular Networks
High Density Small Cells Heterogenous Cellular NetworksResearch Directions and Conclusion
Single-tier cellular networksMulti-tier heterogenous cellular networksResource allocation and interference management
Intercell interference coordination (ICIC)
EECS York University, Canada 31 / 39

MotivationKey Performance Indicators (KPIs)
Stochastic Point ProcessesModeling, Analysis, and Design of Cellular Networks
High Density Small Cells Heterogenous Cellular NetworksResearch Directions and Conclusion
Single-tier cellular networksMulti-tier heterogenous cellular networksResource allocation and interference management
Enhanced intercell interference coordination (eICIC)
EECS York University, Canada 32 / 39
MotivationKey Performance Indicators (KPIs)
Stochastic Point ProcessesModeling, Analysis, and Design of Cellular Networks
High Density Small Cells Heterogenous Cellular NetworksResearch Directions and Conclusion
Single-tier cellular networksMulti-tier heterogenous cellular networksResource allocation and interference management
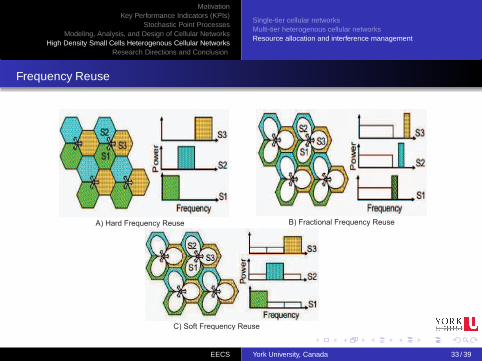
Frequency Reuse
A) Hard Frequency Reuse B) Fractional Frequency Reuse
C) Soft Frequency Reuse
EECS York University, Canada 33 / 39

MotivationKey Performance Indicators (KPIs)
Stochastic Point ProcessesModeling, Analysis, and Design of Cellular Networks
High Density Small Cells Heterogenous Cellular NetworksResearch Directions and Conclusion
Single-tier cellular networksMulti-tier heterogenous cellular networksResource allocation and interference management
Spectrum Allocation
The available spectrum bandwidth is divided into orthogonalgroups of channels.
The first group of channels is assigned to macro BSs and thesecond group of channels is assigned to small cells BSs.
Allocation scheme (fixed/dynamic)? maximizes area spectralefficiency which guaranties a certain QoS for both macro mobileusers and small cells mobile users.
Spectrum allocation has to consider QoS, BSs densities in eachtier, and spectral efficiency for mobile users in each tier.
EECS York University, Canada 34 / 39
MotivationKey Performance Indicators (KPIs)
Stochastic Point ProcessesModeling, Analysis, and Design of Cellular Networks
High Density Small Cells Heterogenous Cellular NetworksResearch Directions and Conclusion
Single-tier cellular networksMulti-tier heterogenous cellular networksResource allocation and interference management
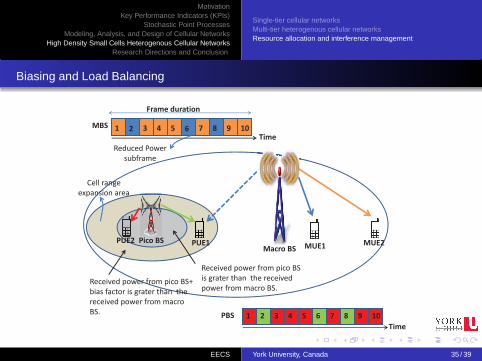
Biasing and Load Balancing
Macro BS
Pico BS
Received power from pico BS
is grater than the received
power from macro BS.Received power from pico BS+
bias factor is grater than the
received power from macro
BS.
Frame duration
MBS 71 2 6543 8 9 10
Time
71 2 6543 8 9 10PBS
MUE1MUE2PUE1PUE2
Time
Reduced Power
subframe
Cell range
expansion area
EECS York University, Canada 35 / 39
MotivationKey Performance Indicators (KPIs)
Stochastic Point ProcessesModeling, Analysis, and Design of Cellular Networks
High Density Small Cells Heterogenous Cellular NetworksResearch Directions and Conclusion
Research DirectionsConclusion
Research Directions
CP/UP split cellular network architecture (two-tier).
Handover impact on the control signaling for CP/UP split cellularnetwork architecture.
Intelligent mobile users velocity aware offloading mechanism intwo-tier C-plane/U-plane split RAN downlink which offloadsmobile UEs from small cells to macro BS, while static UEs shouldbe handed over to the ultra-dense small cell tier.
Idle mode capability of small cells (turning off low load small cells)in two-tier C-plane/U-plane split RAN downlink 5G cellularnetworks to mitigate inter-cell interference and save energy.
handover failure probability under fluctuating channel conditionsEECS York University, Canada 36 / 39

MotivationKey Performance Indicators (KPIs)
Stochastic Point ProcessesModeling, Analysis, and Design of Cellular Networks
High Density Small Cells Heterogenous Cellular NetworksResearch Directions and Conclusion
Research DirectionsConclusion
Research Directions
Handover failure probability under fluctuating channel conditionsusing handover system level parameters optimization, i.e,adaptive time to trigger and adaptive A3-offset.
Study the effect WiFi and LTE coexistence in unlicensedspectrum 5 GHz (LTE-U).
EECS York University, Canada 37 / 39

MotivationKey Performance Indicators (KPIs)
Stochastic Point ProcessesModeling, Analysis, and Design of Cellular Networks
High Density Small Cells Heterogenous Cellular NetworksResearch Directions and Conclusion
Research DirectionsConclusion
Conclusion
The future network architecture is heterogeneous with macrocells, small cells, along with WiFi.
Random spatial models are essential mathematical tools formodeling modern cellular paradigm.
Small cells architectures are going to be ubiquitous very soon.
Small cells is one of the essential technologies to meet the 5Gcapacity requirements.
EECS York University, Canada 38 / 39

MotivationKey Performance Indicators (KPIs)
Stochastic Point ProcessesModeling, Analysis, and Design of Cellular Networks
High Density Small Cells Heterogenous Cellular NetworksResearch Directions and Conclusion
Questions
Questions?
EECS York University, Canada 39 / 39