cellular lean model to reduce wip fluctuation in garment ...in+sri+lanka.pdf · cellular lean model...
TRANSCRIPT

1
Cellular Lean Model to Reduce WIP Fluctuation in Garment Manufacturing
Vijitha Ratnayake, Gamini Lanarolle
Department of Textile & Clothing Technology, University of Moratuwa, Sri Lanka
James Marsh
School of Engineering, Sheffield Hallam University, United Kingdom
Abstract
Purpose – High Work In Progress (WIP) and its fluctuation are found to be common in
garment manufacturing lines in Sri Lanka. The purpose of this paper is to demonstrate a
lean cellular manufacturing model as a solution.
Design/Methodology/Approach – The application of group technology/ lean cellular
manufacturing techniques and its benefits are examined. The significance of the WIP and
its fluctuation is investigated through the data obtained from several garment
manufacturing lines. Root cause analysis on the problem reveals the major factors
contributing to the problem. The sewing line is identified in few (more commonly four)
clusters and each cluster behaves as a separate manufacturing cell termed as a ‘sub cell’.
Findings – The hypothesis testing demonstrates that WIP fluctuation is significant in
garment manufacturing lines. Poor line balancing is one of the major reasons for WIP
fluctuation.
Practical Implication - The proposed sub cell concept leads to reduce the WIP level and
its fluctuation significantly and delivers many advantages. The validation of the model is
tested by implementing the concept into a garment manufacturing company with 20
production lines. The results are promising with a 12% increase in the production
efficiency, equivalent to US$ Million 1.23 annually.
Originality/ Value –The existing cellular systems are dedicated to work on parts of few
products. In garment manufacturing the lines are temporarily dedicated to manufacture
only one product. The existing cellular manufacturing systems do not suit for
manufacturing garments. Presently each garment manufacturing line behaves as one
entity, where empowerment, team work are difficult to be promoted. The new sub-cell
concept changes the organisational culture and makes the production lines more flexible
through motivated, cohesive team. The operators are motivated with higher earning
through higher productivity and dignity. .

2
Key Words – Group Technology, Lean, Cellular Manufacturing, Lean Implementation,
Mistake Proofing, Garment, Sub-cell, Work In Progress, Line Balancing, Root Cause
Analysis.
Paper Type - Research Paper
Introduction
The Garment Industry in Sri Lanka today accounts for more than 43% of Sri Lanka’s
total exports. The industry was protected by the Multi Fibre Agreement (MFA) which
secured garment quotas. After phasing out of MFA in year 2005, the apparel
manufacturing business became open. Although Sri Lanka’s garment industry is reputed
as a quality manufacturer it has many disadvantages such as low labour productivity and
excessive lead times. The initial advantage of low labour costs has diminished and that
has steadily increased in recent years. Therefore it is essential to increase the labour
productivity through Lean manufacturing techniques and the introduction of value added
automated systems and machinery. The main reason for long lead times is the lack of
raw material and accessory base in addition to the market being far away.
Lean Manufacturing for better performance
The concepts of Lean Manufacturing and the 5 Lean Principles (Womack and Jones,
1996) demonstrated the importance of manufacturing the quantity needed by the
customer and when they need it. The above situation can be created by employing Just in
Time (JIT) principles using a Kanban system which instructs the user to produce products
and/or services when the customer needs it with the correct amount required by the
customer.
The lack of using Kanban cards or similar technique to control the operators’ work, often
results in the very common situation of the production lines being unbalanced (WIP
levels) in the majority of Sri Lanken garment factories. Piles of WIP can be seen at some
workstations while some other workstations are starving for inputs. Waiting of down
stream operators due to bottlenecks towards upstream workstations not only reduces the
line efficiency but also breaks the rhythm of working and affects the learning of the
operator.
The ultimate result is long lead-time, high percentage of rejects, low efficiency, operator
de-motivation and many more. The aim is therefore to clarify the root causes for these
issues and to determine which techniques are the most appropriate to reduce the
fluctuations of WIP.

3
Cellular Manufacturing and Group Technology – a review
The Group Technology (GT) approach originally proposed by Burbidge in 1971 and
Mitrofanove in 1966 has projected the philosophy that exploits the proximity among the
attributes of given objects (Singh, 1993). GT is identified by many researchers as
dividing the manufacturing facility into small groups or cells of machines; each cell is
being dedicated to a specific set of part types and it is called cellular manufacturing
(Nicoletti et al., 1998, Askin et al., 1993, Buffa et al., 2002). Singh (1993) depicts the
cellular manufacturing as an application of GT in manufacturing while Mahesh and
Srinivasan (2002) mentions Cellular Manufacturing as one of the primary applications of
GT principles, where parts with similar process requirements are placed together into
groups called part families. Thus Group Technology and Cellular manufacturing are
often refers to similar production environments and Cellular manufacturing is considered
to be one of the main techniques towards a lean environment.
The benefits of implementing GT is identified by many researchers as to minimise the
through put time, improve the quality of the product, reduce the WIP levels and stocks
and thereby the cost, improve the deliveries, reduced set-up times and improve
productivity level (Burbidge, 1979, Singh, 1993, Wemmerlov, 1989). Askin and
Standridge (1993) explained the set up time reduction as an important aspect of GT. A
work centre will work only on a family of similar parts. The changes of tools may be
required only due to wear out. The common tools can use for all parts and the cost is
reduced. As a consequence of set up reduction, the labour cost and the through put time
are reduced. Thomopouulos (1986) explains the objective of cell formation as to
minimise the inter cell part movements and to allocate the work equally across all
machines on a style basis thus making the flow smooth. One of another major advantage
of GT is that it creates a better human relations (Richard et al., 2003) as the cells consists
of only a few workers who form a small work team. Indeed claims were made by
Burbidge, (1979) that GT makes a climate that increases job satisfaction, employee
motivation and industrial relations. Wemmerlov (1989) identifies that working in cells
naturally encourages team work and motivation for process improvement.
The research jointly carried out by the London Business School, Salford and Bradford
Universities on GT revealed that the reduction of WIP and the through put time are 62%
and 70% respectively and the out put per employee increased by 33% in best companies
(Burbidge, 1979).

4
Measure and Analyse
Following the principles of Lean 6 Sigma and the DMAIC process it is important to keep
to a structured approach order to solve the problem of the WIP fluctuation defined above.
Two levels of analysis were required to establish a way forward, a statistical analysis of
the garment industry to measure the magnitude of the problem with regard to the WIP
and its level of Variation. Secondly an analysis to determine the root causes of the WIP
levels and its inherent fluctuations.
Statistical Analysis of Garment Manufacturing Companies
Investigation into the low efficiencies in manufacturing garments was carried out at 14
garment manufacturing companies in Sri Lanka which manufacture various types of
garments. The level of WIP and its variations were analysed across 3 Lines for each
company giving a total of 42 garment manufacturing lines. The data reveals that the WIP
fluctuation within production lines is very high with CV% ranging from 79.2 to 165.6.
Definition of CV (Amir, 1989) - Coefficient of Variation (CV) is a relative measure of the
dispersion of a set of numbers in a population or sample.
CV=Standard Deviation /Mean Value of the Sample
Hypothesis testing of WIP Level
As the sample size is more than 25, the data was analyzed using F-distribution. The
hypothesis testing is presented below.
Correction factor = G2/n (where G-Grand Total and n is sample size)
= 14202
42
= 48074.46
Total sum of squares = 50889.37- 48074.46 = 2814.91
Sum of squares between varieties = ∑ Ti2/ ni - G
2/n
Where, Ti is the total for the ith variety.
ni is the number of replicates for the ith variety.

5
Sum of Squares between varieties = 144331/3 – 48074.47 = 36.2
“Take in Table I”
For a test with 5% level of significant,
F 2, 39 (5%) = 3.239 > VR
Therefore reject the null hypothesis and concludes that there is no difference between the
factories as far as WIP level is concerned.
Hypothesis testing of WIP fluctuation
Correction factor = G2/n
= 50012
42
= 597255.16
Total sum of squares = 608419.27- 597255.16 = 12943.03
Sum of squares between varieties = ∑ Ti2/ ni - G
2/n
Where, Ti is the total for the ith variety.
ni is the number of replicates for the ith variety.
Sum of Squares between varieties =1791765.48/3 – 597255.16 = 1778.95
“Take in Table II”
For a test with 5% level of significant,
F 2, 39 (5%) = 3.239 > VR
Hypothesis testing conducted on the above data shows that there is no statistical
difference between the style and the garment factories.
Root Cause Analysis of WIP fluctuation
The next stage of the analysis needed to determine the root causes for the WIP variation
that the garment industry faces. This is required in order to develop a useful solution that
could be implemented within the garment Industry. Figure 1 shows the cause and effect

6
diagram of the WIP fluctuation. This diagram was developed with Key Stakeholders
from the garment industry from all levels within the organisation. Therefore the analysis
was conducted with Senior Management through to operator level to get a good level of
understanding of the “real” issues faced. The importance of getting a balanced
perspective of the root causes at this stage cannot be emphasised enough. The fishbone
diagram is related to the seven wastes as identified and utilised by most lean experts in
industry for the last few decades (Tapping, 2002).
“take in Figure 1”
The diagram highlights that poor line balancing is related to all of the wastes that cause
WIP fluctuation. Both senior management and operators recognised this was a major
problem and the inherent impact that it had on them. Another major factor impacting the
WIP fluctuation was high rework percentages which in some case reached 30-35%. The
third highest factor was absenteeism rates as high as 10% on some factories, which again
seriously affect the WIP fluctuation in addition to several other factors as illustrated in
Figure 1. This paper concentrates mainly on poor line balancing as this from a Pareto
perspective has the largest impact, but the rework level and the absenteeism are also
improved.
Implementation Process
The following implementation process was developed and implemented in one garment
manufacturing company with 20 production lines. The results are promising and solved
many production related issues. The changing of operators and the supervisor’s attitudes
as well as winning the operators trust are the key challenges of the implementation
process. Within this phase there was absolutely no capital investment needed in order to
gain the benefits demonstrated. The resource utilisation is made high and the redesigned
incentive system boost the operators’ motivation and helped changing the attitudes.
Balancing of garment manufacturing lines
The operations breakdown of manufacturing most garments can consist of a large number
of operations depending on the type of garment. According to the breakdown of
operations and the SMVs of each operation, the production line is balanced before
actually setting up of the machine layout. This balancing is called ‘initial balancing’.
A few hours after the initial balancing, the line is ‘rebalanced’ in order to balance the line
with minimum bottle necks. This will therefore react towards any unexpected variations

7
in manufacturing and to alleviate the problems of bottle necks, ‘replace balancing’ is
performed as a temporary measure for unexpected bottle necks. ‘Late hour balancing’ is
unofficially carried out by mainly the supervisors in some factories in order to meet the
daily target, but not a secret to the management.
Initial balancing - The operations sequence of a garment is analysed and the Standard
Minute Values (SMV) are allocated. The SMVs are determined by most manufacturers
using standard databases available, while some companies use their own databases based
on past experience and using time studies. General Sewing Data, GSD is one such
internationally accepted database software package widely used by most companies in Sri
Lanka. The times obtained using GSD is added with operator allowances such as
machine allowances, personnel fatigue and resting allowances, contingency allowances
etc. The allowances given are mainly according to the allowances specified by the
International Labour Organisation, ILO (Kanawaty, 1992). These allowances however
can be identified as non value added (NVA) wastes that are being built into the overall
expected operation times.
Rebalancing – This is performed few hours after the whole line is completely laid down
and may be performed several times in order to make the material flow with the least
bottle necks in the line. Capacity studies conducted on the line also help the line
balancing process.
Reactive balancing – Despite the production line being balanced, spontaneous variations
are inevitable due to problems on the line. This “reactive” balancing is often due to
machine break downs, operator absenteeism, quality defects and shortages. The
operators or the machines are moved to the bottleneck until the severity of the problem is
suppressed. This leads to an imbalance on the other parts of the line and this will
generally lead to chaos along the production line with the queues and bottlenecks
changing places regularly. This reactive process is very common in the garment industry
(and other sectors) and is against the lean manufacturing concepts.
Late hour balancing – In order to fulfil the daily demanded out put from a production line
the upstream operators are moved to the line end by the supervisors of some garment
manufacturing companies. This happens unofficially but not uncommon and makes the
line unbalanced in the next day especially in early hours. The down stream operators are
waiting to receive garment pieces resulting extremely low output in early hours.
8
The proposed manufacturing cells for garment manufacturing totally resist ‘late hour
balancing’. The operators are empowered to carry out ‘replace balancing’ and
‘rebalancing’. Thus only initial balancing needs to be act upon by the industrial
engineer/work study officer.
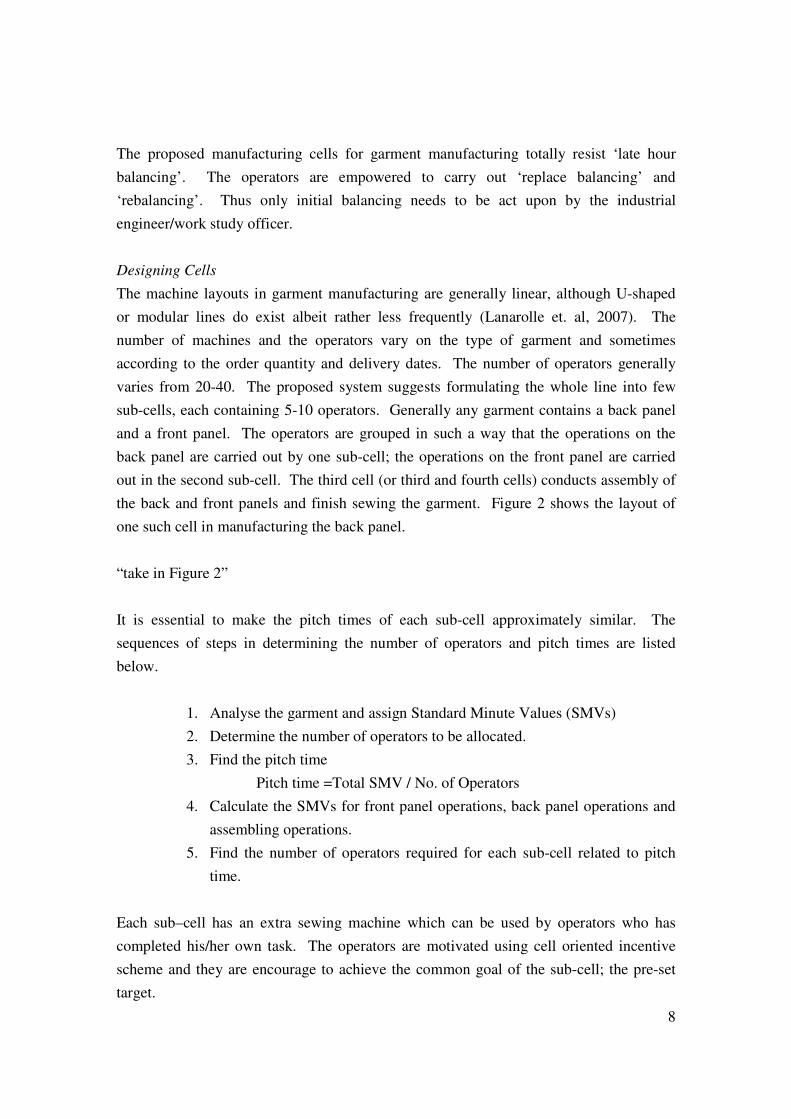
Designing Cells
The machine layouts in garment manufacturing are generally linear, although U-shaped
or modular lines do exist albeit rather less frequently (Lanarolle et. al, 2007). The
number of machines and the operators vary on the type of garment and sometimes
according to the order quantity and delivery dates. The number of operators generally
varies from 20-40. The proposed system suggests formulating the whole line into few
sub-cells, each containing 5-10 operators. Generally any garment contains a back panel
and a front panel. The operators are grouped in such a way that the operations on the
back panel are carried out by one sub-cell; the operations on the front panel are carried
out in the second sub-cell. The third cell (or third and fourth cells) conducts assembly of
the back and front panels and finish sewing the garment. Figure 2 shows the layout of
one such cell in manufacturing the back panel.
“take in Figure 2”
It is essential to make the pitch times of each sub-cell approximately similar. The
sequences of steps in determining the number of operators and pitch times are listed
below.
1. Analyse the garment and assign Standard Minute Values (SMVs)
2. Determine the number of operators to be allocated.
3. Find the pitch time
Pitch time =Total SMV / No. of Operators
4. Calculate the SMVs for front panel operations, back panel operations and
assembling operations.
5. Find the number of operators required for each sub-cell related to pitch
time.
Each sub–cell has an extra sewing machine which can be used by operators who has
completed his/her own task. The operators are motivated using cell oriented incentive
scheme and they are encourage to achieve the common goal of the sub-cell; the pre-set
target.

9
The previous incentive scheme was to make an extra payment when the line efficiency is
higher than a predetermined level. The extra payment increased with increase in
efficiency. The previous incentive is very difficult to achieve as all the operators have to
work equally and the number of operators are too high to work as a team and they are far
away. The operators in a sub-cell are very close to each other and the numbers of
operators are 6-12, thus the communication made easy. The previous incentive scheme is
modified in such a way that the same extra amounts are paid but 75% for the sub-cell
achievements and the balance 25% is paid if the whole line achieve the specified levels of
efficiency. The operators feel the responsibility on quality as rework relevant to them has
to be performed by the sub-cell.
Graphical representation of the sub-cell
A graphical model representing the sub-cell concept is illustrated in Figure 3. The model
represents a composite structure with several layers. The layers represent the WIP in the
system, WIP fluctuation in the system, Re-work/ scrap percentages, absenteeism, which
are the burning problems identified in the analysis. The thickness of each layer or the
significance of each component represented by the layers is determined by how powerful
the cells or the workgroup developed.
“take in Figure 3”
The success of the model mainly depends on the motivation of the operators and their
attitude towards the work. The model describes, when the cellular system represented by
the spheres of the diagram in Figure 3 is made strong the fluctuation of the WIP becomes
flat. It also can make the height of the WIP layer (representing the amount of WIP in the
line) reduced due to the strength/ power (representing the weight) of the cellular system.
The thicknesses of the re-work layer and the absenteeism layer representing the amounts
of re-work percentage and the absenteeism percentage will be reduced when the cells are
more powerful. When the cells become more and more strong the thicknesses
(representing their significance) of each layer gets reduced.
The responsibility of making the cells strong is the responsibility of the management,
where special role should be played by the supervisors. It is observed that the decisions
taken by the management directly affect the strength of the cells and lead to reduce
/increase the power of the cells. The management must have the thinking that the
operators are the heart of the system.

10
If the power of the cells is reduced the weight of the sphere representing the cells are
reduced and the WIP fluctuation, WIP levels, re-work percentages, absenteeism etc. may
be increased. Therefore management must set a prime goal towards the operator
motivation.
Extending the concept across the factory
Following the successful implementation and documented benefits made on the selected
production Line, the concept was introduced to all the other Lines in the factory (20
Lines). All the Lines showed results similar to the results obtained on the pilot Line.
Overall the production efficiency of the factory is increased significantly from 58% to
70%. The following calculation represents the monitory benefits experienced by the
company post implementation.
Number of operators working to the factory = 800
Working time/day = 9 hrs
Total working time/day = 432000 min
Time saving for 1% increase in efficiency = 4320 min
Cost per minute of the factory = US$ 0.09
Cost Saving/day for 1% increase in efficiency = US$ 389
Annual cost savings for 12% increase of efficiency = US$ Million 1.23
(22 working days/ month)
Results and Discussion
1. Making the flow smooth - As the sub-cells are designed to promote sharing of work
and the workgroups within cells are empowered and they are benefited through a revised
incentive scheme this results in people are motivated to help the others within the cell.
The current fluctuation of WIP is seriously high as the bottle necks create vacuums at
some of the workstations making WIP zero. When WIP levels increase due to issues on
the line e.g. a quality problem, , the operators with less WIP/ no WIP are expected to help
the others in the cell until a preset level is reached, resulting in less WIP fluctuation with
in the. This will help return the line to a balanced state before the problem occurred and
will assist returning a sense of synchronicity to the cell and increase motivation as the
team is working together not against each other.
2. Reduction of WIP within the line- With reduced fluctuation of WIP the flow becomes
considerably smoother. When the flow is smooth gradual reduction in WIP is possible.
Presently the size of the garment ply (number of garment pieces in one bundle) is about
11
100 units. When the ply size is large the total WIP within the line is high, this in itself
causes problems at the start of the line and the effects of this are felt through the rest of
the process operations. If the flow has become smooth due to workgroups and the sub-
cells, gradual reduction of input of less number of garment pieces at a time is possible.
This cost of WIP by implementing this approach would reduce significantly. The impact
of this could be increased more when this is conducted across multiple production lines
and it would also significantly reduce the product lead-time.
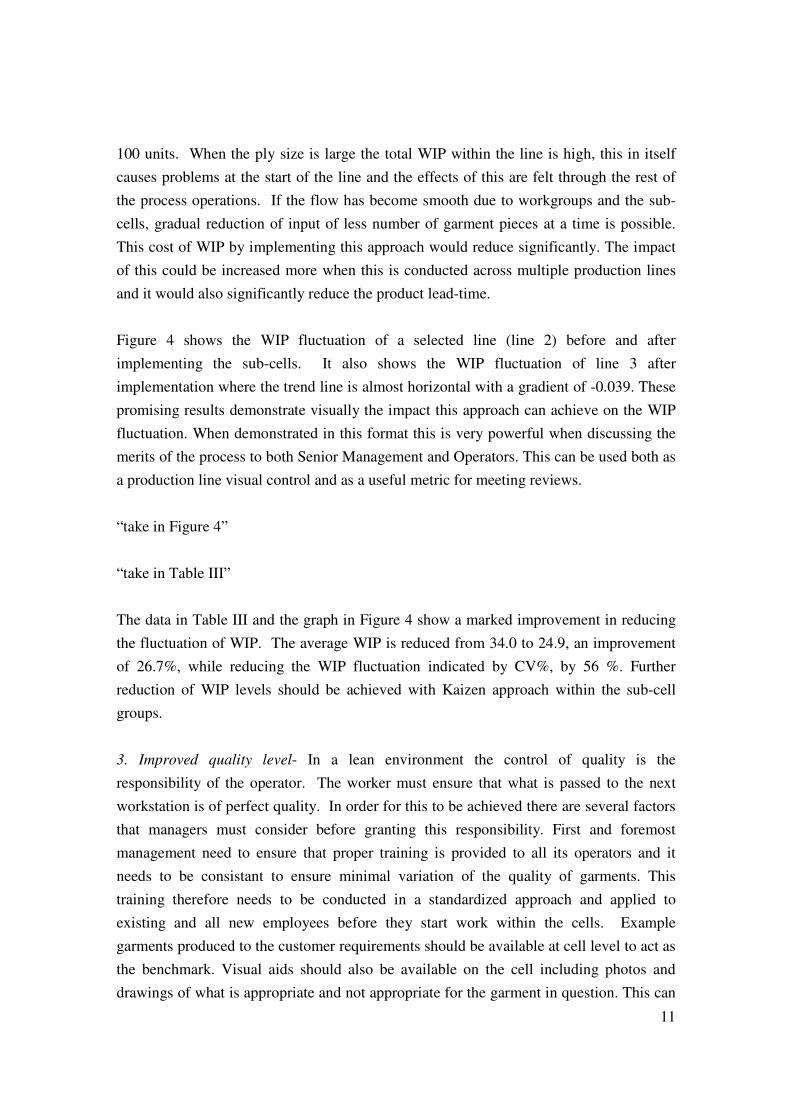
Figure 4 shows the WIP fluctuation of a selected line (line 2) before and after
implementing the sub-cells. It also shows the WIP fluctuation of line 3 after
implementation where the trend line is almost horizontal with a gradient of -0.039. These
promising results demonstrate visually the impact this approach can achieve on the WIP
fluctuation. When demonstrated in this format this is very powerful when discussing the
merits of the process to both Senior Management and Operators. This can be used both as
a production line visual control and as a useful metric for meeting reviews.
“take in Figure 4”
“take in Table III”
The data in Table III and the graph in Figure 4 show a marked improvement in reducing
the fluctuation of WIP. The average WIP is reduced from 34.0 to 24.9, an improvement
of 26.7%, while reducing the WIP fluctuation indicated by CV%, by 56 %. Further
reduction of WIP levels should be achieved with Kaizen approach within the sub-cell
groups.
3. Improved quality level- In a lean environment the control of quality is the
responsibility of the operator. The worker must ensure that what is passed to the next
workstation is of perfect quality. In order for this to be achieved there are several factors
that managers must consider before granting this responsibility. First and foremost
management need to ensure that proper training is provided to all its operators and it
needs to be consistant to ensure minimal variation of the quality of garments. This
training therefore needs to be conducted in a standardized approach and applied to
existing and all new employees before they start work within the cells. Example
garments produced to the customer requirements should be available at cell level to act as
the benchmark. Visual aids should also be available on the cell including photos and
drawings of what is appropriate and not appropriate for the garment in question. This can

12
form a series of checks that need to be undertaken before the product can go to the next
process. This mistake proofing ideally should take the form of the principles employed
in Poke Yoke. Once this is in place at process level, the operators can therefore take the
responsibility of controlling the quality within their own cell.
When the operators feel the power of work groups and their responsibility and benefited
through earning more money at a reduced work pressure, with working no over time, they
are motivated. They realize the benefits they earn are reduced by producing second grade
quality. The leaders of the workgroups naturally will try to ensure the quality of sub
assemblies that are passed from their cell to the next cell. If second quality is produced by
a certain work cell, the responsibly of the rework is given to the same cell. Knowing that
their efficiency is dropped by the time spent on re-work, the operators try to ensure right
first time quality. The income of operators on average has increased by 40%.
4. Replace balancing – As the operators are empowered and motivated they themselves
balance each sub-cell within the line to achieve their target in the case of a machine
breakdown, absenteeism etc. In fact the absenteeism was reduced by 2% within a period
of two months as the members of the sub-cell think as a team. This is not a large decrease
however these levels will be continually monitored as culture changes aren’t expected
overnight, Lean has historically demonstrated quick wins in some areas (improvements to
product lead time and quality) but the changing of organisation culture in practice is not
one of them. This can take 2-5 years, however as long as this is understood by the
organisation and expectation aren’t too high to soon then a steady improvement of
absenteeism levels may be obtainable.
5. Late hour balancing- When the cells are formed, the bad practice of moving the people
towards the end of the production shift (in order to hit production shift targets) will have
to be stopped if the workgroups are expected to be successful. Awareness of the impact
of this with the operators helps reduce the problem within the sub-cells.
6. Reducing the un-cut thread percentage- Within the garment industry un-cut thread is a
defect. This defect can occur anywhere in the production line and this type of defect
makes the benefits of lean received by the workers reduced. Therefore the responsibility
of the un-cut thread should be passed to the respective group/ manufacturing sub-cell.

13
Conclusion
High Work in Progress (WIP) levels and its fluctuation are inherent characteristics in a
non lean environment. The CV% as high as 165 in some garment manufacturing lines
reveals the significance of the problem. The hypothesis testing on the WIP of 42 garment
manufacturing lines manufacturing various types of garments shows this is a common
problem across the industry. High CV% indicates how far the companies analysed are
away from lean environment where the ultimate goal is single piece flow (SPF).
Introducing the sub-cell concept or the work groups helped reducing the average WIP
level by a considerable margin of 26.7%. Even more significant was the CV% of WIP
fluctuation which has reduced from 119.1 to 52.1. This demonstrated an improvement of
56%.
The results of this deployment are highly encouraging and the consistency gained over
the implementation on a good sample size (20 production lines) gives a high level of
Confidense in this approach. It is planned to conduct further Lean implementation at
other textile companies in order to statistically compare results and gain further
conclusions. More Hypothesis testing could then be undertaken to prove beyond
reasonable doubt that this approach gives far reaching benefits in relation to WIP
reduction and the levels of fluctuation experienced in the garment industry. If this can be
proven then the long term strategy would be to implement the Cellular Lean approach in
other sectors besides textiles to gauge whether similar benefits can be obtained.
References
Amir, D.A. (1989), Complete Business Statistics, R.R.Donnelly & Sons Company, USA,
pp. 729-730.
Askin,R.G., Standridge, C. R. (1993), Modelling and Analysis of manufacturing
systems, Hamiton Printing, USA, pp.163-165.
Burbidge, J. (1979), Group Technology in the Engineering Industry, Mechanical
Engineering Publications LTD, London, pp. 60-68, 103-105.
Buffa, E.S., Sarin, R.K. (2002), Modern Production operations and management, 8th
edition, Gopsons Paper Ltd., India, pp. 484, 672-674.
Chase, R.B, Jacobs, F.R., Aquilano, N.J., (2003), Operations Management for
Competitive advantage, Tata Mc Graw – Hill publishing Company Limited,
NewDelli, pp. 200-201.
Kanawaty, G.(1992), Introduction to Work study, 4th Edition, International Labour
Organisation, Geneva, pp. 329-336.

14
Lanarolle, G., Ratnayake, V, Silva, N, Perera, T. (2007), The Simulation of a Novel
Manufacturing Cell for Garment Fabrication, 85th World Conference of Textile
Institute, Sri Lanka, pp. 115-122.
Nicoletti, S., Nicosia, G., Pacifici, A. (1998), Group Technology with flow shop cells,
University of Roma, Italy.
Singh, N. (1993), Design of cellular manufacturing systems, European Journal of
Operational Research 69, pp.284-291.
Srinivasan (2002), Increment cell formation considering alternative machines,
International Journal of Production Research, vol. 40, No. 14, 3291-3310.
Tapping D., Luyster, T., Shuker, T. (2002), Value Stream Management, Productivity Inc,
NewYork, pp. 41.
Thomopoulos, N.T. (1986), Mixed model line balancing with smoothed station
assignments, Management Science 16, pp 593-603.
Wemmerlov,U., Hyer, N.L., (1989), Cellular manufacturing in the U.S. industry : a
survey of users, International Journal of Production Research, Vol. 27, No.9,
pp1511-1530.
Womack, J.P, Jones, D.T. (1996), Lean Thinking, CPI, Great Britain, pp29-90.

15
Figures
Figure 1- Cause and effect diagram of WIP fluctuation
Figure 2 - Layout of a sub-cell

16
Figure 3 – Graphical representation of a sub-model
0
20
40
60
80
100
120
140
0 20 40 60 80
Workstation No.
WIP
(p
ieces)
Line 2-before
Line 2-after
Line 3-after
Linear (Line
2-before)
Linear (Line
2-after)
Linear (Line
3-after)
Figure 4 – WIP between workstations of Line No.2 before and after the formation of
Cells and the WIP of Line No.3 after implementation and the linear trend lines
N
UF
CA T
NUR
I
AM
G
M
L
C
IN
T
E
F
R
E
O
HR
A
E
T
E
SM
Y
T
N
S
IVE
T
E
-
IG
IN
TY
-
D
LY IT
O
L
A
YR
O
A
WT
DSORGANISA
TIO
MPE LOYN
_R
BO
LEM
I
Y
NG
OS
V
L
RE
A WR
DIDEAS
D
E
P
RE
ATO R
O
M OP WE RM
E
E
NT
NE
UM
R
AA
RET
_
,
P
D
EE
N
UF
CA T
NUR
I
AM
G
M
L
C
IN
T
E
F
R
E
O
HR
A
E
T
E
SM
Y
T
N
S
IVE
T
E
-
IG
IN
TY
-
D
LY IT
O
L
A
YR
O
A
WT
DSORGANISA
TIO
MPE LOYN
_R
BO
LEM
I
Y
NG
OS
V
L
RD
DE
P
RE
AT O
R
O
M OP WE RM
E
E
NT
NE
UM
R
AA
RET
_
,
P
D
EE
N
UF
CA T
NUR
I
AM
G
M
L
C
IN
T
E
F
R
E
O
HRA
E
T
E
SM
Y
T
N
S
IVE
T
E
-
IG
IN
TY
-
D
LY IT
O
L
A
YR
O
A
WT
DSORGANISA
TIO
MPE LOYN
_R
BO
LEM
I
Y
NG
OS
V
L
RE
A WR
DIDEAS
DE
P
RE
AT O
R
O
M OP WE RM
E
E
NT
NE
UM
R
AA
RET
_
,
P
D
EE
N
UF
CA T
NUR
I
AM
G
M
L
C
IN
T
E
F
R
E
O
HR
A
E
T
E
SM
Y
T
N
S
IVE
T
E
-
IG
IN
TY
-
D
LY IT
O
L
A
YR
O
A
WT
DSORGANISA
TIO
MPE LOYN
_R
BO
LEM
I
Y
NG
OS
V
L
RE
A WR
DIDEAS
D E
P
RE
AT O
R
O
M OP WE RM
E
E
NT
NE
UM
R
AA
RET
_
,
P
D
EE

17
Tables
Source of Variation Sum of
Squares
Degrees of
freedom
Mean
Square
Variance
Ratio (VR)
Between varieties 36.2 2 18.1 0.25
Residual 2814.91 39 72.17
Total 2851.11 41
Table I- ANOVA table for testing WIP level
Source of Variation Sum of
Squares
Degrees of
freedom
Mean
Square
Variance
Ratio (VR)
Between varieties 1778.92 2 889.46 2.68
Residual 12943.03 39 331.87
Total 14721.95 41
Table II- ANOVA table for testing WIP fluctuation
Line No.2 –
before
implementation
Line No.2 – After
implementation
Average WIP 34.0 24.9
Standard deviation 40.5 12.9
CV% 119.1 52.1
Table III - WIP between workstations of Line No. 2, standard deviations and the CV%
before and after implementation