cell report publication
TRANSCRIPT

Resource
Transplantation Dose Alte
rs the DifferentiationProgram of Hematopoietic Stem CellsGraphical Abstract
Highlights
d 70%–80% HSC clones do not supply every blood cell type in
the presence of other HSCs
d HSC differentiation changes with the transplantation dose
d Maximum blood production by a single HSC is unaffected by
transplantation dose
d High transplantation doses increase the number of short-
term differentiating clones
Brewer et al., 2016, Cell Reports 15, 1848–1857May 24, 2016 ª 2016 The Author(s).http://dx.doi.org/10.1016/j.celrep.2016.04.061
Authors
Casey Brewer, Elizabeth Chu, Mike Chin,
Rong Lu
In Brief
HSCs are thought to supply all blood cell
types after transplantation. Brewer et al.
show that most HSCs specialize in
producing only a subset of blood cell
types post transplantation. They also find
that transplantation dose alters
differentiation specialization and
dynamics.

Cell Reports
Resource
Transplantation Dose Alters the DifferentiationProgram of Hematopoietic Stem CellsCasey Brewer,1 Elizabeth Chu,1 Mike Chin,1 and Rong Lu1,*1Department of Stem Cell Biology and Regenerative Medicine, Eli and Edythe Broad Center for Regenerative Medicine and Stem CellResearch, Keck School of Medicine, University of Southern California, Los Angeles, CA 90033, USA
*Correspondence: [email protected]
http://dx.doi.org/10.1016/j.celrep.2016.04.061
SUMMARY
Hematopoietic stem cell (HSC) transplantation is themost prevalent stem cell therapy, but it remains arisky procedure. To improve this treatment, it isimportant to understand how transplanted stem cellsrebuild the blood and immune systems and howthis process is impacted by transplantation variablessuch as the HSC dose. Here, we find that, in the longterm following transplantation, 70%–80% of donor-HSC-derived clones do not produce all measuredblood cell types. High HSC doses lead to moreclones that exhibit balanced lymphocyte production,whereas low doses produce more T-cell-specializedclones. High HSC doses also produce significantlyhigher proportions of early-differentiating clonescompared to low doses. These complex differentia-tion behaviors uncover the clonal-level regenerationdynamics of hematopoietic regeneration and sug-gest that transplantation dose can be exploited toimprove stem cell therapy.
INTRODUCTION
Hematopoietic stem cells (HSCs) replenish the blood and im-
mune systems. Residing in the bone marrow, each HSC is
capable of generating every blood and immune cell type (Barker
et al., 2010; Bryder et al., 2006). Since the mid-20th century,
scientists have recognized HSCs as a potential cure for patients
suffering from hematologic diseases or injuries (Copelan, 2006).
HSC transplantation, also known as bone marrow transplanta-
tion, is currently used to treat a variety of blood diseases, to reset
the immune system during organ transplantation, and to regen-
erate blood systems destroyed by radiation and chemotherapy
during cancer treatment (Kondo et al., 2003). It remains the
only cure option for many diseases. Although millions of patients
could potentially benefit from HSC transplantation, only a small
fraction of these patients undergo the procedure due to high
treatment-related mortality (Copelan, 2006). Most adverse inci-
dents arise from infection or from graft-versus-host complica-
tions following the procedure. In addition, patients with hema-
tological malignancies such as leukemia often suffer relapse
following disease remission. A better understanding of how
1848 Cell Reports 15, 1848–1857, May 24, 2016 ª 2016 The Author(sThis is an open access article under the CC BY-NC-ND license (http://
HSCs rebuild the blood and immune system post transplantation
will help develop a safer and more effective therapy.
Althoughmuch has been learned about HSC transplantation in
recent years, most of our knowledge comes from population-
level analyses. In these studies, a population of HSCs is isolated
using cell-surfacemarkers, and their progeny are analyzed at the
population level. Limiting dilution assays of HSC transplantation
suggest that the number of donor HSCs quantitatively deter-
mines the fraction of blood cells that they produce (Eaves
et al., 1997; Purton and Scadden, 2007). These experiments
support a simple model for HSC coordination in which individual
HSCs play equal roles and uniformly alter their blood production
in response to changes in hematopoiesis. This simple, homoge-
neous model was challenged by recent work from our group and
others indicating the heterogeneity of HSC differentiation at the
single-cell level (Beerman et al., 2010; Benz et al., 2012; Dykstra
et al., 2007; Ergen et al., 2012; Lu et al., 2011; McKenzie et al.,
2006; Sieburg et al., 2006; Yamamoto et al., 2013). For instance,
individual HSC clones supply differential amounts of blood cells
in mice and in human patients (McKenzie et al., 2006; Weksberg
et al., 2008; Fehse and Roeder, 2008; Roeder et al., 2005; Nien-
huis, 2008; Yamamoto et al., 2013). They also exhibit distinct dif-
ferentiation preferences for myeloid or lymphoid lineages post
transplantation (Beerman et al., 2010; Cho et al., 2008; Dykstra
et al., 2007; Lu et al., 2011; Sieburg et al., 2006). In addition,
recent studies of native hematopoiesis suggest that different
blood cell types have distinct clonal origins as well (Pietras
et al., 2015; Sun et al., 2014). These findings raise the question
of how the diverse differentiation programs of individual HSCs
are coordinated following transplantation. Manipulating this co-
ordination may provide alternative approaches to controlling
HSC differentiation and to improving stem cell therapy.
Previous studies showed that the regeneration of the blood
supply post transplantation occurs in two phases (Camargo
et al., 2006; Eaves, 2015; Morrison andWeissman, 1994). Imme-
diately after transplantation, HSCs and short-termhematopoietic
progenitors collectively supply blood cells. 4 months later, HSCs
are thought to be the only cells to supply every blood cell type as
short-term progenitor cells lack the capacity for long-term self-
renewal. This two-phase mode of blood supply suggests that
the coordination of HSC blood production changes during the
blood reconstitution process. Immediately after transplantation,
HSC clonesmust respond to the presence of short-term progen-
itors and to the urgent need for blood cells, while 4 months later,
HSCs only have to contendwith themselves. A full understanding
).creativecommons.org/licenses/by-nc-nd/4.0/).

Figure 1. More Donor HSCs Engraft and
Produce Every Cell Type at High Transplan-
tation Doses
(A) Granulocyte donor chimerism at each trans-
plantation dose.
(B) Number of barcoded clones that produced
every measured cell type (granulocytes, B cells,
CD4 T cells, and CD8 T cells) at each HSC trans-
plantation dose.
(C) Percentage of transplanted clones that pro-
duced every measured cell type at each HSC
transplantation dose. Data in Figure 1B were
divided by the number of transplanted HSCs that
carry barcodes as shown by GFP expression.
Each diamond represents one mouse; horizontal
black lines represent group means. All data were
collected 6 months post transplantation. Seven to
eight mice were used per transplantation dose.
ofHSCdifferentiation requires knowledgeofHSCclonal behavior
during both phases of blood production.
Understanding how individual HSC clones heterogeneously
differentiate over time after transplantation has significant clin-
ical implications. For example, identifying and promoting HSCs
that differentiate immediately following the transplantation pro-
cedure may reduce the risk for infection, one of the most serious
side effects of HSC transplantation. In addition, after decades of
practice, no gold standard exists for determining the optimal
HSC transplantation dose. It is even unknown what proportion
of transplanted HSCs actually engrafts and produces blood.
Thus, in practice, patients receive donor HSCs over a wide range
of doses. Studies have reported mixed results on the effects of
transplantation dose in various groups of patients (Dıez-Cam-
pelo et al., 2005; Dominietto et al., 2002; Gorin et al., 2006;Mehta
et al., 2009; Panse et al., 2005; Perez-Simon et al., 2003). These
differences may have arisen from HSC clonal behaviors that
were not readily apparent at the population level.
To better understand how individual HSCs supply blood cells
post transplantation and how they are affected by the transplan-
tation dose, we used a genetic barcoding technology (Lu et al.,
2011; Wu et al., 2014) to track the blood production of individual
mouse HSCs transplanted over a wide range of doses. We found
that themajority of transplanted HSCs do not exhibit themultipo-
tent behavior manifested at the population level, but rather only
produce one or two measured cell types in a ‘‘specialized’’
manner. More importantly, these ‘‘specialized’’ differentiation
programs and their temporal patterns changewith the transplan-
tation dose.
RESULTS
More Donor HSCs Engraft and Produce Every Cell Typeat High Transplantation DosesPurified mouse HSCs were labeled with genetic barcodes as
described (Lu et al., 2011; Wu et al., 2014) and transplanted at
four doses into lethally irradiated mice. The highest dose used
is equal to approximately a quarter to a half of a mouse’s total
endogenous HSC population. The doses used in most human
bone marrow transplantations range between the middle two
doses that we used (Copelan, 2006). A half million non-bar-
coded, unpurified whole bone marrow cells were co-trans-
planted alongside the purified barcoded HSCs as helper cells.
The purified HSCs (lineage (CD3, CD4, CD8, B220, Gr1, Mac1,
Ter119)-/ckit+/Sca1+/Flk2�/CD34�/CD150+) have been shown
to produce all blood cell types at the population level and in
single-cell transplantation experiments (Seita and Weissman,
2010). We assessed HSC differentiation after transplantation us-
ing the four most abundant white blood cell types as follows:
granulocytes, B cells, CD4 T cells, and CD8 T cells. Together,
these four cell types constitute 70%–80% of all white blood cells
in the peripheral blood (Figure S1).
Before transplantation, individual HSC clones were labeled
with unique genetic barcodes that are inherited by progeny cells
(Lu et al., 2011; Wu et al., 2014). These genetic barcodes were
recovered from genomic DNA and precisely quantified by high-
throughput sequencing. Barcode data and flow cytometry data
were combined together to quantify the contribution of individual
HSC clones to each blood cell type. Clones that contributed less
than 0.01% of an examined blood cell population were consid-
ered to be absent and removed from analysis. Our clonal
tracking system offers high reproducibility (Figure S2) and high
fidelity (Figure S3), two qualities that are essential for distinguish-
ing between various HSC differentiation programs.
We found that the donor chimerisms of all measured blood cell
types were proportional to the transplantation dose, consistent
with previous limiting dilution experiments (Figures 1A and S4)
(Eaves et al., 1997; Purton and Scadden, 2007). 1 month after
transplantation, host cells rapidly cleared from the granulocyte
and B cell populations, but still sustained nearly 80% of the
T cell population. T cell production by host cells dropped sharply
after 1 month and was unaffected by the donor HSC dose. Non-
barcoded helper cells contain HSCs that assisted in blood
production. Identical quantities of non-barcoded whole bone
marrow cells supplied differential amounts of blood cells when
combined with different doses of barcoded HSCs, suggesting
that blood production was coordinated between the two popula-
tions of transplanted cells. Despite differences in donor chime-
risms across different HSC transplantation doses, the relative
sizes of the granulocyte, B cell, CD4 T cell, and CD8 T cell pop-
ulations were the same for all HSC transplantation doses
(Figure S1).
Cell Reports 15, 1848–1857, May 24, 2016 1849
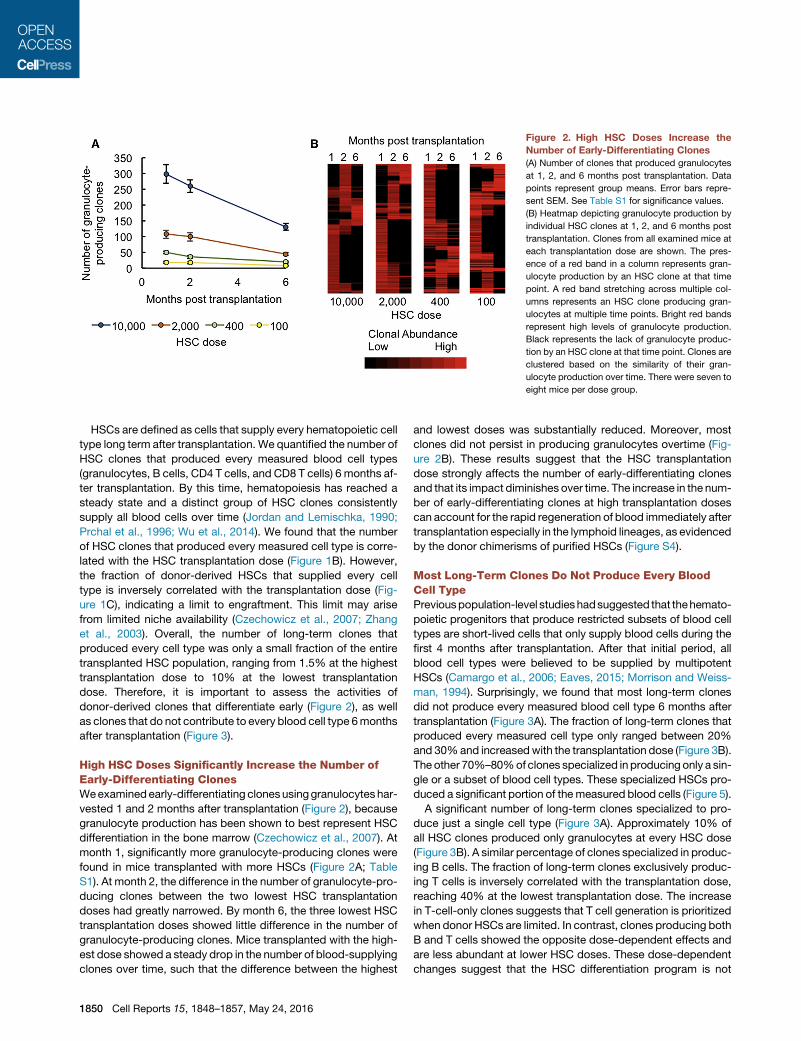
Figure 2. High HSC Doses Increase the
Number of Early-Differentiating Clones
(A) Number of clones that produced granulocytes
at 1, 2, and 6 months post transplantation. Data
points represent group means. Error bars repre-
sent SEM. See Table S1 for significance values.
(B) Heatmap depicting granulocyte production by
individual HSC clones at 1, 2, and 6 months post
transplantation. Clones from all examined mice at
each transplantation dose are shown. The pres-
ence of a red band in a column represents gran-
ulocyte production by an HSC clone at that time
point. A red band stretching across multiple col-
umns represents an HSC clone producing gran-
ulocytes at multiple time points. Bright red bands
represent high levels of granulocyte production.
Black represents the lack of granulocyte produc-
tion by an HSC clone at that time point. Clones are
clustered based on the similarity of their gran-
ulocyte production over time. There were seven to
eight mice per dose group.
HSCs are defined as cells that supply every hematopoietic cell
type long term after transplantation. We quantified the number of
HSC clones that produced every measured blood cell types
(granulocytes, B cells, CD4 T cells, and CD8 T cells) 6 months af-
ter transplantation. By this time, hematopoiesis has reached a
steady state and a distinct group of HSC clones consistently
supply all blood cells over time (Jordan and Lemischka, 1990;
Prchal et al., 1996; Wu et al., 2014). We found that the number
of HSC clones that produced every measured cell type is corre-
lated with the HSC transplantation dose (Figure 1B). However,
the fraction of donor-derived HSCs that supplied every cell
type is inversely correlated with the transplantation dose (Fig-
ure 1C), indicating a limit to engraftment. This limit may arise
from limited niche availability (Czechowicz et al., 2007; Zhang
et al., 2003). Overall, the number of long-term clones that
produced every cell type was only a small fraction of the entire
transplanted HSC population, ranging from 1.5% at the highest
transplantation dose to 10% at the lowest transplantation
dose. Therefore, it is important to assess the activities of
donor-derived clones that differentiate early (Figure 2), as well
as clones that do not contribute to every blood cell type 6months
after transplantation (Figure 3).
High HSC Doses Significantly Increase the Number ofEarly-Differentiating ClonesWeexaminedearly-differentiating clonesusinggranulocytes har-
vested 1 and 2 months after transplantation (Figure 2), because
granulocyte production has been shown to best represent HSC
differentiation in the bone marrow (Czechowicz et al., 2007). At
month 1, significantly more granulocyte-producing clones were
found in mice transplanted with more HSCs (Figure 2A; Table
S1). At month 2, the difference in the number of granulocyte-pro-
ducing clones between the two lowest HSC transplantation
doses had greatly narrowed. By month 6, the three lowest HSC
transplantation doses showed little difference in the number of
granulocyte-producing clones. Mice transplanted with the high-
est dose showed a steady drop in the number of blood-supplying
clones over time, such that the difference between the highest
1850 Cell Reports 15, 1848–1857, May 24, 2016
and lowest doses was substantially reduced. Moreover, most
clones did not persist in producing granulocytes overtime (Fig-
ure 2B). These results suggest that the HSC transplantation
dose strongly affects the number of early-differentiating clones
and that its impact diminishes over time. The increase in the num-
ber of early-differentiating clones at high transplantation doses
can account for the rapid regeneration of blood immediately after
transplantation especially in the lymphoid lineages, as evidenced
by the donor chimerisms of purified HSCs (Figure S4).
Most Long-Term Clones Do Not Produce Every BloodCell TypePreviouspopulation-level studieshadsuggested that thehemato-
poietic progenitors that produce restricted subsets of blood cell
types are short-lived cells that only supply blood cells during the
first 4 months after transplantation. After that initial period, all
blood cell types were believed to be supplied by multipotent
HSCs (Camargo et al., 2006; Eaves, 2015; Morrison and Weiss-
man, 1994). Surprisingly, we found that most long-term clones
did not produce every measured blood cell type 6 months after
transplantation (Figure 3A). The fraction of long-term clones that
produced every measured cell type only ranged between 20%
and 30%and increasedwith the transplantation dose (Figure 3B).
The other 70%–80%of clones specialized in producing only a sin-
gle or a subset of blood cell types. These specialized HSCs pro-
duced a significant portion of themeasured blood cells (Figure 5).
A significant number of long-term clones specialized to pro-
duce just a single cell type (Figure 3A). Approximately 10% of
all HSC clones produced only granulocytes at every HSC dose
(Figure 3B). A similar percentage of clones specialized in produc-
ing B cells. The fraction of long-term clones exclusively produc-
ing T cells is inversely correlated with the transplantation dose,
reaching 40% at the lowest transplantation dose. The increase
in T-cell-only clones suggests that T cell generation is prioritized
when donor HSCs are limited. In contrast, clones producing both
B and T cells showed the opposite dose-dependent effects and
are less abundant at lower HSC doses. These dose-dependent
changes suggest that the HSC differentiation program is not

Figure 3. Most Long-Term Clones Do Not
Produce Every Blood Cell Type
(A) Heatmap depicting the production of gran-
ulocytes, B cells, CD4 T cells, and CD8 T cells by
individual HSC clones. Clones from all examined
mice at each transplantation dose are shown.
A red band in a column represents an HSC clone
producing that specific cell type. A red band
stretching across multiple columns represents an
HSC clone producing multiple cell types. Bright
red bands indicate high levels of blood cell pro-
duction. Black represents the lack of production of
that cell type by an HSC clone. Clones are clus-
tered based on the similarity of their white blood
cell production 6 months after transplantation.
(B) Clones were categorized by the combination of
cell types they produced 6 months post trans-
plantation. All possible combinations of measured
cell types are displayed in the graph. A clone was
considered to produce T cells if CD4 T cells and/or
CD8 T cells were detected among its progeny. Bar
graphs display the percentage of clones belonging
to that category. Percentages were calculated
separately for each mouse and then averaged
across each HSC dose group. Error bars represent
SEM. Seven to eight mice were used per trans-
plantation dose.
predetermined, but is rather significantly influenced by the trans-
plantation dose.
Individual HSC Clones Exhibit Distinct Differentiationand Temporal PatternsIndividual HSC clones exhibit distinct patterns of differentiation
over time (Figures 2 and 3). To classify these patterns, we sepa-
rated long-term HSC clones into the following two categories:
(1) ‘‘all-cell-type’’ clones that produced every measured cell
type and (2) ‘‘specialized’’ clones that only produced a subset
of cell types. We also classified ‘‘early-differentiating’’ clones
based on granulocyte data from months 1 and 2 post transplan-
tation. The number of clones in each category and the overlaps
between different categories vary significantly with the trans-
plantation dose (Figure 4; Tables S2 and S3).
At high transplantation doses, a large number of transplanted
HSCs differentiated early after transplantation (Figure 4; Table
S2). A small portion of transplanted clones produced every
Cell R
measured blood cell type. These clones
often differentiated early at all transplanta-
tion doses. At the two lowest HSC trans-
plantation doses, all HSC clones that
produced every cell type had differenti-
ated early. Thus, early differentiation does
not prevent HSC clones from self-renew-
ing and maintaining their HSC identity.
Conversely, specialized clones constitute
a large proportion of all clones across all
HSC transplantation doses. The number
of specialized clones that differentiated
early is proportional to the transplantation
dose.
To determine the probability for an HSC to commit to a partic-
ular differentiation program, we calculated the fraction of donor-
derived clones in each differentiation category (Table S3). We
found that significantly larger fractions of clones differentiated
at early time points when transplanted at the highest two doses
compared to the lowest dose. Also, a larger proportion of clones
appeared late and produced every cell type at the highest dose
than at the three lower doses. Conversely, a larger proportion of
clones appeared late and produced specialized cell types at the
lowest transplantation dose than at the two highest doses.
Therefore, at a high transplantation dose, donor HSC clones
are more likely to differentiate early. Furthermore, late-differ-
entiating clones are more likely to produce all cell types when
transplanted at a high dose and are more likely to exhibit
specialized blood production when transplanted at a low
dose. These dose-dependent changes again demonstrate
how the HSC differentiation program changes with the trans-
plantation dose.
eports 15, 1848–1857, May 24, 2016 1851

Figure 4. HSCClones Exhibit Various Differ-
entiation and Temporal Patterns
Clones were categorized as ‘‘early differentiating’’
(produced granulocytes 1 and/or 2 months post
transplantation), ‘‘all cell types’’ (produced every
measured cell type 6 months post trans-
plantation), and/or ‘‘specialized’’ (did not produce
every measured cell type 6 months post trans-
plantation). The Venn diagrams show the size and
overlap of these three categories of clones at each
HSC transplantation dose. Numbers represent the
mean clone counts for each category by HSC
dose. See also Tables S2 and S3 for significance
values. Seven to eight mice were used per trans-
plantation dose.
All-Cell-Type Clones Produce Disproportionately LargeNumbers of Blood CellsHSC clones that exhibit different differentiation patterns also
differ in the quantity of their blood production. Here, we quanti-
fied how much each category of clones contributed to the pro-
duction of granulocytes, B cells, CD4 T cells, and CD8 T cells
6months after transplantation (Figure 5; Table S4). At the highest
HSC transplantation dose, all categories of clones contributed to
every measured blood cell type. At lower transplantation doses,
late and all-cell-type clones contributed little-to-no blood pro-
duction, while early and all-cell-type clones produced the major-
ity of blood cells. Early-differentiating and specialized clones
consistently contributed a considerable proportion of blood cells
across all transplantation doses, and this tended to decrease
with the transplantation dose (Figure 5; Table S4). Late-differen-
tiating and specialized clones contributed significantly less to
blood production than the other categories of clones, especially
at low doses (Figure 5; Table S4). An exception is B cells where
late-differentiating and specialized clones significantly contrib-
uted at low transplantation doses (Figure 5; Table S5). The
data suggest that low HSC transplantation doses compel
early-differentiating clones to self-renew and to continue pro-
ducing every blood cell type at later time points. At high trans-
plantation doses, early-differentiating clones are replaced by
other clones at later time points and are not as crucial to long-
term hematopoiesis. Across the range of HSC transplantation
doses assessed in this experiment, the number of all-cell-type
clones was low, but their contribution to blood production was
disproportionately high (Figure 5; Tables S4 and S5). This was
especially true at low HSC transplantation doses.
To characterize the donor-derived clones that supply blood
immediately after transplantation, we quantified granulocyte
production frommonths 1 and 2 after transplantation (Figure S5).
These early-differentiating clones were categorized based on
1852 Cell Reports 15, 1848–1857, May 24, 2016
their later differentiation patterns as
follows: all cell types, specialized cell
types, or no cell types (‘‘early only’’). The
HSC transplantation dose most strongly
affected early-only clones. They pro-
duced a significantly larger proportion of
early granulocytes at high transplantation
doses (Table S6). At lowHSC transplanta-
tion doses, a large proportion of early granulocytes were pro-
duced by clones that would later produce ‘‘all cell types’’ (Table
S7). This is consistent with the previous analysis at month 6 post
transplantation (Figure 5) where early-differentiating clones were
more likely to persist and produce all cell types at low HSC
doses.
Maximum Blood Production by an Individual HSC CloneIs Not Affected by the Transplantation DoseEven though fewer clones supplied blood at low transplantation
doses (Figure 4), we found surprisingly that the most abundant
clones produced similar amounts of blood cells across different
transplantation doses 6 months after transplantation (Figure 6A).
However, dose dependence was observed 1 and 2 months after
transplantation, when granulocyte production by the most abun-
dant clones was significantly less at high HSC doses than at low
HSC doses (Figure 6B). At the highest transplantation dose,
granulocyte production by the most abundant clone significantly
increased over time after transplantation. Other transplantation
doses also exhibited similar temporal trends. A few outliers sup-
plied a large portion of blood cells particularly in granulocyte pro-
duction and at low transplantation doses (Figures 6A and 6B).
These outliers were not present at the highest transplantation
dose (Figures 6A and 6B). Overall, the maximum blood produc-
tion of single clones is largely independent of the transplantation
dose, indicating a physiological limit for HSC clonal expansion in
supplying blood.
While HSC transplantation dose had little effect on the magni-
tude of clonal expansion, it altered the number of expanded
clones (Figures 6C and S6). We quantified the number of clones
that produced at least 0.5% of all granulocytes at each trans-
plantation dose. Our calculations revealed that high HSC
transplantation doses resulted in the expansion of significantly
more HSC clones (Figure 6C). We obtained similar results by

Figure 5. All Cell-Type Clones Produce
Disproportionately Large Numbers of Blood
Cells
Cloneswerecategorizedas ‘‘early andall cell types’’
(produced granulocytes 1 and/or 2 months post
transplantation, and produced every measured cell
type 6 months after transplantation), ‘‘late and all
cell types’’ (produced every measured cell type
6 months after transplantation, but did not produce
granulocytes 1 or 2 months post transplantation),
early and specialized (produced granulocytes
1 and/or 2 months post transplantation, but did not
produce every cell type 6 months post trans-
plantation), or late and specialized (did not produce
granulocytes 1 or 2 months post transplantation,
and did not produce every cell type 6 months
post transplantation). Percentages represent the
average amount of blood cell production by a
category of clones 6months post transplantation. If
the average amount of blood production by a
category of clones was less than 0.5%, it was not
shown. See also Tables S4 and S5. Seven to eight
mice were used per transplantation dose.
quantifying the number of clones producing at least 0.1% of all
granulocytes (Figure S6). Thus, the number of HSC clones that
expanded was correlated with donor HSC dose, although their
maximum expansion levels were not influenced by transplanta-
tion dose.
Increased Lineage Balance Is Associated with High HSCDosesRecent studies suggest that HSC differentiation can be biased
toward a specific hematologic lineage (Beerman et al., 2010;
Cho et al., 2008; Dykstra et al., 2007; Lu et al., 2011; Sieburg
et al., 2006). To determine how this bias is impacted by the trans-
plantation dose, we measured the lineage bias of individual
HSCs at different transplantation doses. In particular, we
compared the clonal production between granulocytes and
B cells and between B cells and T cells 6 months after transplan-
tation (Figures 7 and S7). A clone was categorized as ‘‘special-
ized’’ to a cell type if it only produced that cell type, ‘‘biased’’
to a cell type if it favored producing that cell type while also
contributing to the other cell type, and ‘‘balanced’’ if it produced
similar amounts of both cell types.
We found that the number of specialized, biased, and
balanced clones producing granulocytes over B cells and over
T cells is consistent across all transplantation doses (Figures
Cell R
7A and S7). However, in the production
of B cells over T cells, higher HSC doses
yielded significantly more donor HSC
clones with balanced lymphocyte pro-
duction (Figure 7B). In addition, high
HSC doses were associated with an
increase in B-cell-biased clones and a
decrease in T-cell-specialized clones
(Figure 7B). These results demonstrate
that HSC dose alters the clonal produc-
tion of lymphocytes, with high HSC doses
generating a greater proportion of balanced lymphocyte-pro-
ducing clones and low HSC doses generating a greater propor-
tion of biased lymphocyte-producing clones.
DISCUSSION
In this study, we demonstrated that the differentiation programs
of individual stem cells are specialized and are coordinated
differently at different transplantation doses. While our data are
consistent with previous studies at the population level (Figures
S1 and S4) (Eaves et al., 1997; Purton and Scadden, 2007; Span-
grude et al., 1988), our discoveries at the clonal level reveal
unexpected stem cell differentiation characteristics that differ
from their collective population-level behaviors.
We discovered that HSCs are specialized in their differentia-
tion to an unexpected degree. Previous population-level studies
suggest that HSCs are the only cells that supply blood long term
after transplantation and that they simultaneously supply every
blood lineage. In contrast, we have discovered at the clonal level
that 70%–80% of all donor-HSC-derived clones do not supply
every measured blood cell type 6 months after transplantation
(Figure 3). This unexpected discovery is counter to results from
previous single-cell transplantation experiments where a single
HSC is forced to supply every blood cell type to ensure the
eports 15, 1848–1857, May 24, 2016 1853

Figure 6. Maximum Blood Production by Individual HSC Clones Is
Not Affected by the Transplantation Dose
(A) Percentage of blood cells produced by the most abundant clone 6 months
after transplantation.
(B) Percentage of granulocytes produced by the most abundant clone at
different time points.
(C) Number of clones that produced at least 0.5% of all granulocytes in each
mouse 6 months after transplantation.
Each diamond represents one mouse; horizontal black lines represent group
means. All data were collected 6 months post transplantation. Seven to eight
mice were used per transplantation dose.
Figure 7. Balanced Lymphoid Production Is Associated with High
HSC Doses(A and B) A clone was considered to be ‘‘specialized’’ to a cell type if it only
produced that cell type, ‘‘biased’’ to a cell type if it favored the production of
that cell type, and ‘‘balanced’’ if its relative production of the two cell types was
similar. The mean percent is displayed for each HSC dose. Error bars repre-
sent SEM.
(A) Granulocyte production was compared to B cell production for each HSC
clone.
(B) B cell production was compared to T cell production for each HSC clone.
Seven to eight mice were used per transplantation dose.
survival of the organism (Dykstra et al., 2007; Osawa et al., 1996;
Yamamoto et al., 2013). In these single-cell transplantation
experiments, long-term specialized differentiation was also
1854 Cell Reports 15, 1848–1857, May 24, 2016
observed, although not extensively discussed. Recent studies
suggest that a similar specialized differentiation program takes
place under homeostasis (Sun et al., 2014) and in human HSCs
(Notta et al., 2016). Here, our data show that HSCs specialize
and coordinate their differentiation programs when transplanted
as a population. The specialized differentiation program may be
induced by the local environment as the cytokine milieu post
transplantation may not be uniformly distributed to all HSCs
throughout the body (Morrison and Scadden, 2014).
HSCs adapt their differentiation programs to different trans-
plantation doses. Particularly, low transplantation doses pro-
duced significantly more T-cell-specialized HSCs, while high
transplantation doses produced a greater proportion of balanced
lymphocyte-producing clones (Figures 3B and 7B). Decades
of studies to identify and isolate stem cells have relied on
the assumption, or functional definition, that stemcellswill reliably
differentiate in a predeterminedmanner.Here,we found that stem
cells changed their differentiation programswhen transplanted at

different doses. These changes may bemodulated by HSC niche
orby co-transplantedhelper bonemarrowcells. Future studies on
how HSC transplantation dose influences niche cells and short-
term progenitor cells can provide further insights.We have shown
here that altering the HSC transplantation dose results in long-
term changes to HSC behavior. While the specializations of indi-
vidual HSCs necessitate their coordination to ensure overall
balanced blood production, the dose dependency suggests this
coordination is altered by adding or removing HSCs.
In this study, granulocytes, B cells, and T cells were examined
as differentiation end products. Other cell types, such as natural
killer cells, may derive from a different repertoire of HSC clones
(Wu et al., 2014).With our genetic barcoding technique, we could
not directly measure red blood cells and platelets due to their
lack of genomic DNAs. Additionally, our analyses of early-differ-
entiating clones relied on measurements at the 1- and 2-month
time points post transplantation and may have missed clones
that differentiated at other times. However, additional data will
not change the conclusions from this study that a substantial
fraction of HSC clones do not produce all blood cell types and
that the transplantation dose changes HSC differentiation pro-
grams at the clonal level.
Our results have important medical implications. For example,
to help patients survive the critical immune-deficient period
immediately following transplantation, it is useful to know that
high transplantation dose promotes a greater number of trans-
planted HSCs to immediately supply blood (Figure 2). This may
help recipients better survive the immune-deficient period that
is a significant risk to patients post transplantation (Dominietto
et al., 2002). While immediate differentiation after transplantation
is generally thought to be stressful to cells, our data suggest that
this does not prevent early-differentiating clones from self-re-
newing and supplying all blood cell types later on. In fact, most
clones that supply all blood cell types over the long term had
supplied blood shortly after transplantation, especially at low
transplantation doses (Figure 4).
While the ‘‘all-cell-type’’ clones were few in number, the actual
blood production from these clones was significantly higher than
other clones (Figure 5). This illustrates the importance of the all-
cell-type clones in reconstituting the hematopoietic system after
transplantation, despite their relative scarcity. Promoting the all-
cell-type phenotype could substantially improve the efficacy of
bone marrow transplantation. This could be achieved in future
studies by isolating HSC clones pre-disposed toward the all-
cell-type phenotype or by exploiting the regulatory mechanism
underlying stem cell coordination to promote the all-cell-type
phenotype.
Our data also reveal a physiological limit for donor stem cell
expansionduringdifferentiation (Figure6). Previously, a fewdomi-
nant cloneswere reported to supply themajority of blood produc-
tion aftermouse andhumanHSC transplantation (McKenzie et al.,
2006; Weksberg et al., 2008; Fehse and Roeder, 2008; Roeder
et al., 2005; Nienhuis, 2008; Yamamoto et al., 2013). We had
expected lower transplantation doses to produce higher levels
of clonal dominance. But surprisingly, we found that the magni-
tudeof clonaldominancedoesnot changeover the rangeof trans-
plantation doses that we examined (Figure 6). Thus, normal HSC
differentiation seems to have a limit for expansion. This has pro-
found implications for cell or gene therapies that rely on donor
cell expansion, as it may be more challenging to repopulate the
patient with altered genetic material than previously expected.
In summary, our data provide a clonal-level perspective on
HSC differentiation post transplantation and on its alteration by
HSC transplantation dose. These findings offer insights into the
complex effects that transplantation dose has on patient survival
during bone marrow transplantation (Dıez-Campelo et al., 2005;
Dominietto et al., 2002; Gorin et al., 2006; Mehta et al., 2009;
Panse et al., 2005; Perez-Simon et al., 2003). Patients with
different pathogeneses might benefit from distinct differentiation
programs associated with particular transplantation doses.
EXPERIMENTAL PROCEDURES
Mice
The donor mice used in the experiments were 8- to 12-week-old C57BL6/Ka
(CD45.1+) mice. The recipient mice were 8- to 12-week-old C57BL6/Ka
(CD45.2+) mice. At each transplantation dose, seven to eight mice were exam-
ined. Helper cells that were co-transplanted with HSCs consisted of F1 whole
bonemarrow cells (CD45.2+/ CD45.1+). 950 cGy irradiation was performed on
all mice immediately before transplantation. All animal procedures were
approved by the International Animal Care and Use Committee.
Cell Isolation and Transplantation
HSCs (lineage (CD3, CD4, CD8, B220, Gr1, Mac1, Ter119)-/ckit+/Sca1+/
Flk2�/CD34�/CD150+) were obtained from the crushed bones of donor
mice and isolated using double fluorescence-activated cell sorting (FACS)
with the FACS-Aria II (BDBiosciences) after enrichment using CD117microbe-
ads (AutoMACS, Miltenyi Biotec). HSCs were infected with lentivirus carrying
barcodes andGFP before transplantation for 10 hr. HSC clonal labeling was as
described in Lu et al. (2011). Helper cells (i.e., whole bone marrow cells) were
flushed from the femurs of F1 mice and added to HSCs right before transplan-
tation. A half million helper cells were transplanted per mouse. Transplantation
was performed via retro-orbital injection.
Blood Sample Collection and FACS Analysis
Blood samples were collected into PBS containing 10 mM EDTA via a small
transverse cut in the tail vein. To separate red blood cells, 2% dextran was
added, and the remaining blood cells were treated with ammonium-chlo-
ride-potassium lysis buffer on ice for 5 min to remove residual red blood cells.
After a 30-min antibody incubation at 4�C, samples were resuspended in pro-
pidium iodide solution (1:5,000 in PBSwith 2% fetal bovine serum [FBS]). Cells
were sorted using a FACS-Aria II cell sorter and separated into granulocytes,
B cells, CD4 T cells, and CD8 T cells. Antibodies were obtained from
eBioscience and BioLegend as described in Lu et al. (2011). Donor cells
were sorted based on the CD45 marker. The following cell-surface markers
were used to sort the different hematopoietic populations.
Granulocytes: CD4�/CD8�/B220�/CD19�/Mac1+/Gr1+/side scatterhigh
B cells: CD4�/CD8�/Gr1�/Mac1�/B220+/CD19+
CD4 T cells: B220�/CD19�/Mac1�/Gr1�/TCRab+/CD4+/CD8�CD8 T cells: B220�/CD19�/Mac1�/Gr1�/TCRab+/CD4�/CD8+
Flow cytometry data were analyzed using FlowJo software version 9.6.1
(Tree Start).
DNA Barcode Extraction and Sequencing
Genomic DNA (gDNA) was extracted from hematopoietic cells and amplified
using Phusion PCR mastermix (Thermo Scientific). The PCR reactions were
halted once they had progressed halfway through the exponential phase.
PCR product was purified and analyzed using high-throughput sequencing
at the USC Epigenome Center. Sequencing data were analyzed as described
(Lu et al., 2011; Wu et al., 2014). The lenti viral vector that delivers the genetic
barcodes also conveys GFP expression that marks the barcoded cells. We
Cell Reports 15, 1848–1857, May 24, 2016 1855

combined the sequencing data with the FACS data to generate clonal abun-
dance for each HSC clone as follows:
Clonal abundance= ðDonor % in the blood cell populationÞ3 ðGFP % among donor cellsÞ3 ðnumber of reads for one barcodeÞ=
ðtotal reads of all barcodesÞ
Statistical Analysis
All group comparisons were evaluated by one-way ANOVA. Post hoc analysis
was done by Tukey test. For nonparametric data, group comparisons were
evaluated via Kruskal-Wallis test with Dunn post hoc test. Significance was
defined as p < 0.05. Error bars in all figures represent SEM.
SUPPLEMENTAL INFORMATION
Supplemental Information includes seven figures and seven tables and can be
foundwith this article online at http://dx.doi.org/10.1016/j.celrep.2016.04.061.
AUTHOR CONTRIBUTIONS
C.B. and R.L. designed and performed the experiments. E.C. wrote custom
Python codes for data analysis. M.C. assisted with experiments. All authors
analyzed the data. C.B. and R.L. wrote the manuscript. All authors edited
the manuscript.
ACKNOWLEDGMENTS
We thank A. Nogalska, Q. Liu, C. Lytal, G. Howard, and Z. Huang for helpful
discussions. We also thank A. Nogalska for laboratory management, L. Barsky
for FACS core management, and C. Nicolet for helping with the high-
throughput sequencing. This work is supported by NIH-R00-HL113104 and
P30CA014089. C.B. is supported by CIRM-TG2-01161.
Received: November 4, 2015
Revised: March 7, 2016
Accepted: April 15, 2016
Published: May 12, 2016
REFERENCES
Barker, N., Bartfeld, S., and Clevers, H. (2010). Tissue-resident adult stem cell
populations of rapidly self-renewing organs. Cell Stem Cell 7, 656–670.
Beerman, I., Bhattacharya, D., Zandi, S., Sigvardsson, M., Weissman, I.L.,
Bryder, D., and Rossi, D.J. (2010). Functionally distinct hematopoietic stem
cells modulate hematopoietic lineage potential during aging by a mechanism
of clonal expansion. Proc. Natl. Acad. Sci. USA 107, 5465–5470.
Benz, C., Copley, M.R., Kent, D.G., Wohrer, S., Cortes, A., Aghaeepour, N.,
Ma, E., Mader, H., Rowe, K., Day, C., et al. (2012). Hematopoietic stem cell
subtypes expand differentially during development and display distinct lym-
phopoietic programs. Cell Stem Cell 10, 273–283.
Bryder, D., Rossi, D.J., and Weissman, I.L. (2006). Hematopoietic stem cells:
the paradigmatic tissue-specific stem cell. Am. J. Pathol. 169, 338–346.
Camargo, F.D., Chambers, S.M., Drew, E., McNagny, K.M., and Goodell, M.A.
(2006). Hematopoietic stem cells do not engraft with absolute efficiencies.
Blood 107, 501–507.
Cho, R.H., Sieburg, H.B., and Muller-Sieburg, C.E. (2008). A new mechanism
for the aging of hematopoietic stem cells: aging changes the clonal composi-
tion of the stem cell compartment but not individual stem cells. Blood 111,
5553–5561.
Copelan, E.A. (2006). Hematopoietic stem-cell transplantation. N. Engl. J.
Med. 354, 1813–1826.
Czechowicz, A., Kraft, D., Weissman, I.L., and Bhattacharya, D. (2007). Effi-
cient transplantation via antibody-based clearance of hematopoietic stem
cell niches. Science 318, 1296–1299.
1856 Cell Reports 15, 1848–1857, May 24, 2016
Dıez-Campelo, M., Perez-Simon, J.A., Ocio, E.M., Castilla, C., Gonzalez-Por-
ras, J.R., Sanchez-Guijo, F.M., Vazquez, L., Caballero, M.D., Canizo, M.C.,
and San Miguel, J.F. (2005). CD34 + cell dose and outcome of patients under-
going reduced-intensity-conditioning allogeneic peripheral blood stem cell
transplantation. Leuk. Lymphoma 46, 177–183.
Dominietto, A., Lamparelli, T., Raiola, A.M., Van Lint, M.T., Gualandi, F., Be-
risso, G., Bregante, S., Di Grazia, C., Soracco, M., Pitto, A., et al. (2002). Trans-
plant-related mortality and long-term graft function are significantly influenced
by cell dose in patients undergoing allogeneic marrow transplantation. Blood
100, 3930–3934.
Dykstra, B., Kent, D., Bowie, M., McCaffrey, L., Hamilton, M., Lyons, K., Lee,
S.-J., Brinkman, R., and Eaves, C. (2007). Long-term propagation of distinct
hematopoietic differentiation programs in vivo. Cell Stem Cell 1, 218–229.
Eaves, C.J. (2015). Hematopoietic stem cells: concepts, definitions, and the
new reality. Blood 125, 2605–2613.
Eaves, C., Miller, C., Cashman, J., Conneally, E., Petzer, A., Zandstra, P., and
Eaves, A. (1997). Hematopoietic stem cells: inferences from in vivo assays.
Stem Cells 15 (Suppl 1), 1–5.
Ergen, A.V., Boles, N.C., and Goodell, M.A. (2012). Rantes/Ccl5 influences
hematopoietic stem cell subtypes and causes myeloid skewing. Blood 119,
2500–2509.
Fehse, B., and Roeder, I. (2008). Insertional mutagenesis and clonal domi-
nance: biological and statistical considerations. Gene Ther. 15, 143–153.
Gorin, N.-C., Labopin, M., Boiron, J.-M., Theorin, N., Littlewood, T., Slavin, S.,
Greinix, H., Cahn, J.Y., Alessandrino, E.P., Rambaldi, A., et al.; Acute Leuke-
mia Working Party of the European Cooperative Group for Blood and Marrow
Transplantation (2006). Results of genoidentical hemopoietic stem cell trans-
plantation with reduced intensity conditioning for acute myelocytic leukemia:
higher doses of stem cells infused benefit patients receiving transplants in sec-
ond remission or beyond—the Acute LeukemiaWorking Party of the European
Cooperative Group for Blood and Marrow Transplantation. J. Clin. Oncol. 24,
3959–3966.
Jordan, C.T., and Lemischka, I.R. (1990). Clonal and systemic analysis of long-
term hematopoiesis in the mouse. Genes Dev. 4, 220–232.
Kondo,M.,Wagers, A.J., Manz, M.G., Prohaska, S.S., Scherer, D.C., Beilhack,
G.F., Shizuru, J.A., and Weissman, I.L. (2003). Biology of hematopoietic stem
cells and progenitors: implications for clinical application. Annu. Rev. Immunol.
21, 759–806.
Lu, R., Neff, N.F., Quake, S.R., and Weissman, I.L. (2011). Tracking single
hematopoietic stem cells in vivo using high-throughput sequencing in conjunc-
tion with viral genetic barcoding. Nat. Biotechnol. 29, 928–933.
McKenzie, J.L., Gan, O.I., Doedens, M., Wang, J.C.Y., and Dick, J.E. (2006).
Individual stem cells with highly variable proliferation and self-renewal proper-
ties comprise the human hematopoietic stem cell compartment. Nat. Immunol.
7, 1225–1233.
Mehta, J., Mehta, J., Frankfurt, O., Altman, J., Evens, A., Tallman, M., Gordon,
L., Williams, S., Winter, J., Krishnamurthy, J., et al. (2009). Optimizing the
CD34 + cell dose for reduced-intensity allogeneic hematopoietic stem cell
transplantation. Leuk. Lymphoma 50, 1434–1441.
Morrison, S.J., and Scadden, D.T. (2014). The bone marrow niche for haema-
topoietic stem cells. Nature 505, 327–334.
Morrison, S.J., and Weissman, I.L. (1994). The long-term repopulating subset
of hematopoietic stem cells is deterministic and isolatable by phenotype. Im-
munity 1, 661–673.
Nienhuis, A.W. (2008). Development of gene therapy for blood disorders.
Blood 111, 4431–4444.
Notta, F., Zandi, S., Takayama, N., Dobson, S., Gan, O.I., Wilson, G., Kauf-
mann, K.B., McLeod, J., Laurenti, E., Dunant, C.F., et al. (2016). Distinct routes
of lineage development reshape the human blood hierarchy across ontogeny.
Science 351, aab2116.
Osawa, M., Hanada, K., Hamada, H., and Nakauchi, H. (1996). Long-term lym-
phohematopoietic reconstitution by a single CD34-low/negative hematopoi-
etic stem cell. Science 273, 242–245.
Panse, J.P., Heimfeld, S., Guthrie, K.A., Maris, M.B., Maloney, D.G., Baril,
B.B., Little, M.-T., Chauncey, T.R., Storer, B.E., Storb, R., and Sandmaier,
B.M. (2005). Allogeneic peripheral blood stem cell graft composition affects
early T-cell chimaerism and later clinical outcomes after non-myeloablative
conditioning. Br. J. Haematol. 128, 659–667.
Perez-Simon, J.A., Diez-Campelo, M., Martino, R., Sureda, A., Caballero, D.,
Canizo, C., Brunet, S., Altes, A., Vazquez, L., Sierra, J., and Miguel, J.F.
(2003). Impact of CD34+ cell dose on the outcome of patients undergoing
reduced-intensity-conditioning allogeneic peripheral blood stem cell trans-
plantation. Blood 102, 1108–1113.
Pietras, E.M., Reynaud, D., Kang, Y.-A., Carlin, D., Calero-Nieto, F.J., Leavitt,
A.D., Stuart, J.M., Gottgens, B., and Passegue, E. (2015). Functionally distinct
subsets of lineage-biased multipotent progenitors control blood production in
normal and regenerative conditions. Cell Stem Cell 17, 35–46.
Prchal, J.T., Prchal, J.F., Belickova, M., Chen, S., Guan, Y., Gartland, G.L., and
Cooper, M.D. (1996). Clonal stability of blood cell lineages indicated by X-chro-
mosomal transcriptional polymorphism. J. Exp. Med. 183, 561–567.
Purton, L.E., and Scadden, D.T. (2007). Limiting factors in murine hematopoi-
etic stem cell assays. Cell Stem Cell 1, 263–270.
Roeder, I., Kamminga, L.M., Braesel, K., Dontje, B., de Haan, G., and Loeffler,
M. (2005). Competitive clonal hematopoiesis in mouse chimeras explained by
a stochastic model of stem cell organization. Blood 105, 609–616.
Seita, J., and Weissman, I.L. (2010). Hematopoietic stem cell: self-renewal
versus differentiation. Wiley Interdiscip. Rev. Syst. Biol. Med. 2, 640–653.
Sieburg, H.B., Cho, R.H., Dykstra, B., Uchida, N., Eaves, C.J., and Muller-Sie-
burg, C.E. (2006). The hematopoietic stem compartment consists of a limited
number of discrete stem cell subsets. Blood 107, 2311–2316.
Spangrude, G.J., Heimfeld, S., and Weissman, I.L. (1988). Purification and
characterization of mouse hematopoietic stem cells. Science 241, 58–62.
Sun, J., Ramos, A., Chapman, B., Johnnidis, J.B., Le, L., Ho, Y.-J., Klein, A.,
Hofmann, O., and Camargo, F.D. (2014). Clonal dynamics of native haemato-
poiesis. Nature 514, 322–327.
Weksberg, D.C., Chambers, S.M., Boles, N.C., and Goodell, M.A. (2008).
CD150- side population cells represent a functionally distinct population of
long-term hematopoietic stem cells. Blood 111, 2444–2451.
Wu, C., Li, B., Lu, R., Koelle, S.J., Yang, Y., Jares, A., Krouse, A.E., Metzger,
M., Liang, F., Lore, K., et al. (2014). Clonal tracking of rhesus macaque hema-
topoiesis highlights a distinct lineage origin for natural killer cells. Cell Stem
Cell 14, 486–499.
Yamamoto, R., Morita, Y., Ooehara, J., Hamanaka, S., Onodera, M., Rudolph,
K.L., Ema, H., and Nakauchi, H. (2013). Clonal analysis unveils self-renewing
lineage-restricted progenitors generated directly from hematopoietic stem
cells. Cell 154, 1112–1126.
Zhang, J., Niu, C., Ye, L., Huang, H., He, X., Tong, W.-G., Ross, J., Haug, J.,
Johnson, T., Feng, J.Q., et al. (2003). Identification of the haematopoietic
stem cell niche and control of the niche size. Nature 425, 836–841.
Cell Reports 15, 1848–1857, May 24, 2016 1857