cell number (% vehicle control) cisplatin concentration (µm)gefitinib concentration (µm) 10 1 10 2...
TRANSCRIPT

0.01 0.10 1.00 10.00 100.000
20
40
60
80
100
120
0.01 0.10 1.00 10.00 100.000
20
40
60
80
100
120
cell
nu
mb
er (
% v
ehic
le c
on
tro
l)
cell
nu
mb
er (
% v
ehic
le c
on
tro
l)
cisplatin concentration (µM)gefitinib concentration (µM)
101 102 103
cell
nu
mb
er
expression level(fluorescence intensity)
control EGFR
sensitive
resistant
P-EGFR
total EGFR
P-AKT
total AKT
GAPDH
S2 R2S R
P-ERK 1/2
total ERK 1/2
cell
nu
mb
er
0.0 0.1 1.00
25
50
75
100
concentration of gefitinib (M)
% c
ells
0.0 0.1 1.00
25
50
75
100
concentration of gefitinib (M)
% c
ells
gefitinib concentration (µM) gefitinib concentration (µM)
% c
ells
% c
ells
0.0 0.1 1.0 0.0 0.1 1.0
100
75
50
25
0
100
75
50
25
0
sensitive resistant
Supplementary Fig. S1 Box et al.
A) B)
C)
E)
D)
F)

tum
ou
r vo
lum
e (c
m3)
Supplementary Fig. S2 Box et al.
0 40 80 120 16010
100
1000
10000
7 9 11 13 15 17 19 210.0
0.1
0.2
0.3
0.4
0.5A) B)
time (days)
cell
nu
mb
er (
% 0
h)
time (hours)
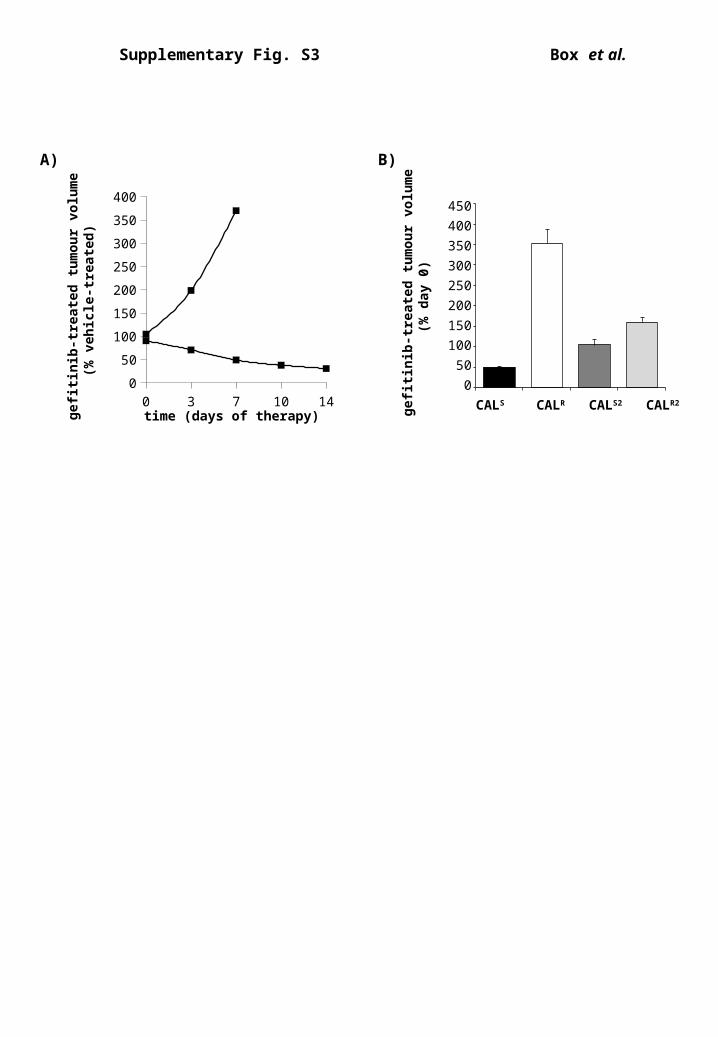
Supplementary Fig. S3 Box et al.
0
50
100
150
200
250
300
350
400
450
S R S2 R2g
efit
inib
-tre
ated
tu
mo
ur
volu
me
(% d
ay 0
)
A)
450
400
350
300
250
200
150
100
50
0
B)
0 3 7 10 140
50
100
150
200
250
300
350
400
time (days of therapy)CALS CALR CALS2 CALR2
gef
itin
ib-t
reat
ed t
um
ou
r vo
lum
e(%
veh
icle
-tre
ated
)
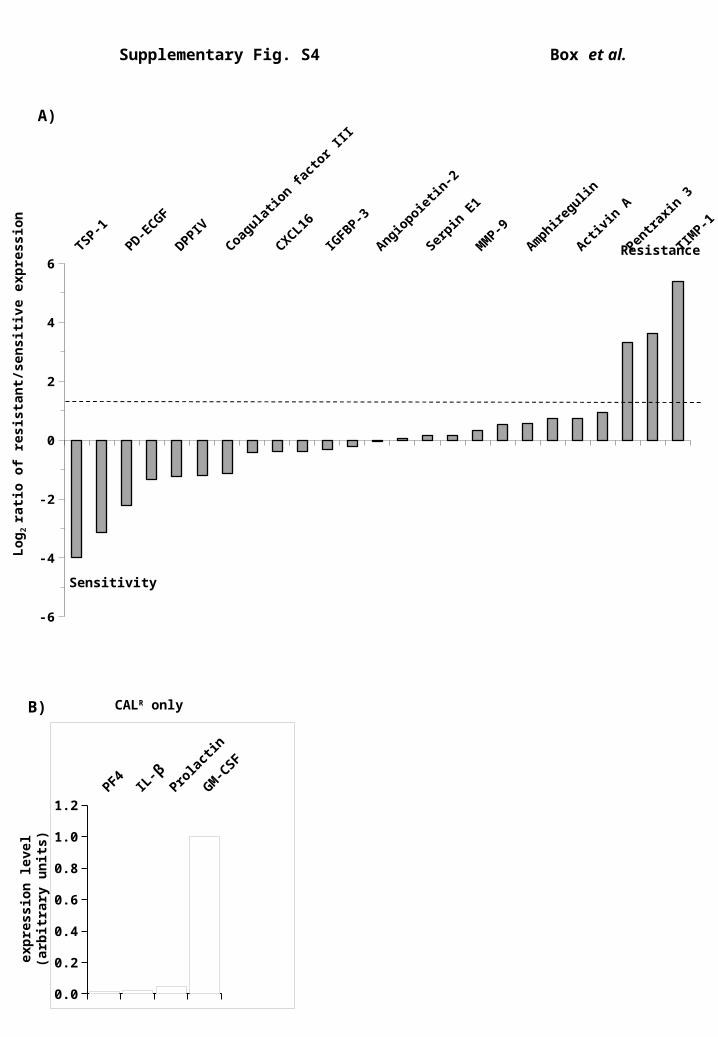
TSP-1
Serpin
B5
PD-ECGF
Angiogen
in
DPPIV
EG-VEGF
Coagula
tion fa
ctor I
II
TSP-2
CXCL16
Endothel
in-1
IGFBP-3
Angiost
atin
Angiopoie
tin-2
VEGF
Serpin
E1
uPAM
MP-9
HB-EGF
Amphire
gulin
EGFAct
ivin
A
Basic
FGF
Pentra
xin 3
IL-8
TIMP-1
-6
-4
-2
0
2
4
6
Supplementary Fig. S4 Box et al.
A)
B)
PF4IL
-1B
Prola
ctin
GM-C
SF
0.0
0.2
0.4
0.6
0.8
1.0
1.2
Sensitivity
Resistance
CALR only
β
exp
ress
ion
leve
l(a
rbit
rary
un
its)
Lo
g2 ra
tio
of
resi
stan
t/se
nsi
tive
exp
ress
ion

dmso gefi0
5000
10000
15000
20000
25000
30000
35000
Supplementary Fig. S5 Box et al.
A)
IL-8
GM-CSF
TIMP-1
dmso gefi0
10000
20000
30000
40000
50000
60000
dmso gefi0
1000
2000
3000
4000
5000
6000
7000
con
cen
trat
ion
(p
g/m
l)co
nce
ntr
atio
n (
pg
/ml)
con
cen
trat
ion
(p
g/m
l)
**
C)
E)
dmso gefi0
100200300400500600700800900
*
con
cen
trat
ion
(p
g/m
l)IL-8
dmso gefi0
5000
10000
15000
20000
25000
con
cen
trat
ion
(p
g/m
l)D)
B)
F)
dmso gefi0
20000
40000
60000
80000
100000
120000
TIMP-1
con
cen
trat
ion
(p
g/m
l)
GM-CSF
S2 R2 S2 R2
con gefitinib
S2 R2 S2 R2
con gefitinib
S2 R2 S2 R2
con gefitinib
PJS PJR PJS PJR
con gefitinib
PJS PJR PJS PJR
con gefitinib
PJS PJR PJS PJR
con gefitinib

Supplementary Fig. S6 Box et al.
# Maps pValue1 Inflammatory mechanisms of pancreatic cancerogenesis 1.945E-17 11 672 EGFR signaling pathway in Lung Cancer 6.244E-13 8 473 IGF signaling in HCC 1.480E-12 8 524 ERBB family and HGF signaling in gastric cancer 2.039E-12 8 545 Role of stellate cells in progression of pancreatic cancer 3.361E-10 7 606 Muscle contraction_Regulation of eNOS activity in endothelial cells 5.364E-10 7 647 Immune response_Oncostatin M signaling via MAPK in mouse cells 6.340E-10 6 358 Immune response_Oncostatin M signaling via MAPK in human cells 9.044E-10 6 379 Angiogenesis in HCC 6.023E-09 6 50
10 Development_Leptin signaling via JAK/STAT and MAPK cascades 8.628E-09 5 2511 Inhibition of apoptosis in pancreatic cancer 1.356E-08 6 5712 Development_Role of IL-8 in angiogenesis 1.510E-08 6 5813 Immune response_IL-17 signaling pathways 1.860E-08 6 6014 Development_PDGF signaling via STATs and NF-kB 3.224E-08 5 3215 Mucin expression in CF via IL-6, IL-17 signaling pathways 4.437E-08 5 3416 EGFR family signaling in pancreatic cancer 7.865E-08 6 7617 LKB1 signaling pathway in lung cancer cells 1.178E-07 5 4118 Immune response_IL-1 signaling pathway 1.697E-07 5 4419 Role of DNA methylation in progression of multiple myeloma 1.697E-07 5 4420 Immune response_Oncostatin M signaling via JAK-Stat in mouse cells 1.963E-07 4 1821 Role and regulation of Prostaglandin E2 in gastric cancer 2.382E-07 5 4722 IL-6 signaling in multiple myeloma 2.949E-07 5 4923 Cytokine production by Th17 cells in CF (Mouse model) 2.949E-07 5 4924 Immune response_Oncostatin M signaling via JAK-Stat in human cells 3.095E-07 4 2025 Pro-inflammatory action of Gastrin in gastric cancer 3.269E-07 5 5026 PI3K signaling in gastric cancer 3.617E-07 5 5127 Mucin expression in CF via TLRs, EGFR signaling pathways 3.617E-07 5 5128 Immune response_MIF-mediated glucocorticoid regulation 4.653E-07 4 2229 PGE2 pathways in cancer 5.314E-07 5 5530 Dual role of TGF-beta 1 in HCC 6.732E-07 4 2431 Effect of H. pylori infection on gastric epithelial cell proliferation 6.956E-07 5 5832 Development_Prolactin receptor signaling 6.956E-07 5 5833 Development_EGFR signaling pathway 1.056E-06 5 6334 Regulation of VEGF signaling in pancreatic cancer 1.105E-06 4 2735 Immune response_CD40 signaling 1.143E-06 5 6436 Immune response_IL-6 signaling pathway 1.489E-06 4 2937 DNA damage_Brca1 as a transcription regulator 1.715E-06 4 3038 Transcription_Ligand-dependent activation of the ESR1/SP pathway 1.715E-06 4 3039 EML4/ALK fusion protein in nonsmoking-related lung cancer 2.241E-06 4 3240 Influence of multiple myeloma cells on bone marrow stromal cells 2.545E-06 4 3341 IGF-1 signaling in pancreatic cancer 3.641E-06 4 3642 HBV signaling via protein kinases leading to HCC 3.641E-06 4 3643 Development_Beta-adrenergic receptors transactivation of EGFR 4.074E-06 4 3744 Cytokine production by Th17 cells in CF 5.053E-06 4 3945 Immune response_MIF in innate immunity response 5.603E-06 4 4046 Immune response_Neurotensin-induced activation of IL-8 in colonocytes 6.834E-06 4 4247 Development_ACM2 and ACM4 activation of ERK 7.519E-06 4 4348 Development_VEGF signaling and activation 7.519E-06 4 4349 K-RAS signaling in pancreatic cancer 8.254E-06 4 4450 Cell adhesion_Chemokines and adhesion 1.049E-05 5 100
Ratio

patient number5 6 7 9 10 11 13 14 15 16 17 18 19 20 22 23 24 25 27 28 30 31 32 34 35
0
50
100
150
200
250
Supplementary Fig. S7 Box et al.
IL-8
TIMP-1
con
cen
trat
ion
(p
g/m
l)co
nce
ntr
atio
n (
ng
/ml)
A)
B)
patient number5 6 7 9 10 11 13 14 15 16 17 18 19 20 22 23 24 25 27 28 30 31 32 34 35
0
100
200
300
400
500
600
700
800
900
1000

5 6 7 9 10 11 13 14 15 16 17 18 19 20 22 23 24 25 27 28 30 31 32 34 350
500
1000
1500
2000
2500
3000
Supplementary Fig. S7 (contd.) Box et al.
VEGF-AC)
con
cen
trat
ion
(p
g/m
l)
patient number

Supplementary Fig. S8 Box et al.
A)
B)
no rash rash0
20
40
60
80
100P
FS
(m
onth
s)
no rash rash0
20
40
60
80
100
OS
(m
onth
s)