cell metabolism article - connecting repositories · cell metabolism article ... 3division of...
TRANSCRIPT
Cell Metabolism
Article
Increased Hepatic Synthesis and Dysregulationof Cholesterol Metabolism Is Associated withthe Severity of Nonalcoholic Fatty Liver DiseaseHae-Ki Min,1 Ashwani Kapoor,1 Michael Fuchs,1 Faridoddin Mirshahi,1 Huiping Zhou,1 James Maher,2 John Kellum,2
Russell Warnick,4 Melissa J. Contos,3 and Arun J. Sanyal1,*1Division of Gastroenterology, Hepatology and Nutrition, Department of Internal Medicine2Division of General Surgery, Department of Surgery3Division of Surgical Pathology, Department of Pathology
Virginia Commonwealth University School of Medicine, Richmond, VA 23298, USA4Health Diagnostic Laboratory, Richmond, VA 23219, USA
*Correspondence: [email protected] 10.1016/j.cmet.2012.04.004
SUMMARY
Nonalcoholic fatty liver disease (NAFLD) is associ-ated with increased cardiovascular and liver-relatedmortality. NAFLD is characterized by both triglyc-eride and free cholesterol (FC) accumulation withouta corresponding increment in cholesterol esters. Theaim of this study was to evaluate the expression ofcholesterol metabolic genes in NAFLD and relatethese to disease phenotype. NAFLD was associatedwith increased SREBP-2 maturation, HMG CoAreductase (HMGCR) expression and decreasedphosphorylation of HMGCR. Cholesterol synthesiswas increased as measured by the circulatingdesmosterol:cholesterol ratio. miR-34a, a microRNAincreased in NAFLD, inhibited sirtuin-1 with down-stream dephosphorylation of AMP kinase andHMGCR. Cholesterol ester hydrolase was increasedwhile ACAT-2 remained unchanged. LDL receptorexpression was significantly decreased and similarin NAFLD subjects on or off statins. HMGCR expres-sion was correlated with FC, histologic severity ofNAFLD and LDL-cholesterol. These data demon-strate dysregulated cholesterol metabolism inNAFLD which may contribute to disease severityand cardiovascular risks.
INTRODUCTION
Nonalcoholic fatty liver disease (NAFLD) is a common cause
of chronic liver disease (Browning et al., 2004; Wanless and
Lentz, 1990). The clinical-histologic phenotype of NAFLD
extends from a nonalcoholic fatty liver (NAFL) to nonalcoholic
steatohepatitis (NASH) (Ludwig et al., 1980). NASH can progress
to cirrhosis in up to 15% of affected subjects (Adams et al.,
2005; Ekstedt et al., 2006). Several studies have also linked
NAFLD to an increased risk of cardiovascular disease, a leading
cause of death in this population (Brea et al., 2005; Hanley
C
et al., 2005; Targher et al., 2007; Villanova et al., 2005). The
potential mechanisms underlying these findings remain to be
fully defined.
NAFLD has classically been associated with increased hepatic
triglycerides (Browning and Horton, 2004). Lipidomic analyses of
NAFLD have however demonstrated that there is also an accu-
mulation of free cholesterol (FC) without a similar increment in
cholesterol esters (CE) in both NAFL and NASH (Puri et al.,
2007). We evaluated the expression of genes involved in hepatic
cholesterol metabolism to better understand themolecular basis
for FC accumulation. Given the known cellular toxicity of FC and
the linkage of NAFLD with cardiac disease (Devries-Seimon
et al., 2005; Geng et al., 2003; Ginsberg, 2006), we further eval-
uated the relationship of changes in the molecular pathways of
cholesterol metabolism to liver disease severity and known risk
factors for cardiovascular disease.
A previous study found increased HMG CoA reductase
(HMGCR) expression in NASH but did not clarify if this was
due to underlying obesity or the liver disease (Caballero et al.,
2009). It also did not provide detailed information on the status
of all cholesterol metabolic pathways in the various phenotypes
of NAFLD. We evaluated the mRNA and protein expression of
genes involved in cholesterol metabolism in subjects with
biopsy-proven NAFL or NASH and compared them to lean
normal individuals and age, gender andweight matched controls
without liver disease. We demonstrate numerous changes in the
expression status of genes involved in cholesterol metabolism
and clarify those that are related to underlying obesity versus
those related to NAFLD. We further evaluated the functional
significance of the observed changes by measurement of surro-
gate markers of cholesterol synthesis.
A key finding is that the expression of HMGCR is increased in
both NAFL and NASH and that it is related to FC levels and the
severity of the liver disease. Moreover, the HMGCR is relatively
dephosphorylated in both phenotypes of NAFLD and thus in its
active form (Beg et al., 1985, 1987). MiR-34a is a microRNA
that is overexpressed in NASH (Cheung et al., 2008). It inhibits
sirtuin-1 which is known to dephosphorylate AMP kinase
a known regulator of HMGCR phosphorylation (Beg et al.,
1984; Chaudhary and Pfluger, 2009; Clarke and Hardie, 1990).
To evaluate the potential role of miR-34a as a regulator of
ell Metabolism 15, 665–674, May 2, 2012 ª2012 Elsevier Inc. 665

Table 1. Baseline Demographic, Clinical and Laboratory Data
Parameter
Lean Normal N = 6
Mean ± S.D.
Obese Normal N = 20
Mean ± S.D.
NAFL N = 20
Mean ± S.D.
NASH N = 20
Mean ± S.D. P Value
Age (yrs) 42.5 ± 7.5 44 ± 6.5 46.4 ± 7.5 52.2 ± 7.7 n.s.
Males:females (n) 3:5 6:14 7:13 8:12 n.s.
Caucasian (n) 6 16 15 18 n.s.
BMI (kg/m2) 21.4 ± 2.2 33.2 ± 2.2 34.1 ± 3 34.2 ± 3 <0.0001*
Type 2 diabetes mellitus (n) 0 3 5 5 n.s.
Hypertension (n) 0 8 12 12 0.02**
AST (IU/l) 18 ± 5 19 ± 7 47 ± 21 56 ± 23 <0.002**
ALT (IU/l) 22 ± 6 24 ± 5 69 ± 32 72 ± 37 <0.003**
Alk phos (IU/l) 86 ± 21 90 ± 9 97 ± 18 101 ± 21 n.s.
Bilirubin (mg/dl) 0.2 ± 0.08 0.3 ± 0.1 0.2 ± 0.1 0.3 ± 0.1 n.s.
Albumin (gm/dl) 4.2 ± 0.2 4 ± 0.4 3.9 ± 0.3 4 ± 0.3 n.s.
Fasting blood sugar (mg/dl) 78 ± 8 85 ± 9 92 ± 12 93 ± 14 n.s.
Fasting insulin (uIU/dl) 6.5 ± 3 17.2 ± 8 18 ± 12 22 ± 9 <0.004*
Hemoglobin A1C (%) 5.9 ± 0.3 6.3 ± 1 6.5 ± 1.5 6.3 ± 1.2 n.s.
Total cholesterol (mg/dl) 135 ± 21 142 ± 34 155 ± 32 146 ± 34 n.s.
LDL-cholesterol (mg/dl) 82 ± 27 118 ± 16 128 ± 17 132 ± 14 <0.01***
HDL-cholesterol (mg/dl) 62 ± 8 46 ± 10 42 ± 12 38 ± 13 <0.03**
Triglycerides (mg/dl) 145 ± 35 152 ± 41 175 ± 45 186 ± 33 <0.01*
Steatosis grade 0 0 2.5 2.8 N/A
Inflammation grade 0 0 0 2.4 N/A
Cytologic ballooning grade 0 0 0 1.9 N/A
Fibrosis stage 0 0 0 1.6 N/A
*lean versus other groups.
**NAFL or NASH versus either control group.
***NAFL and NASH higher than lean control, but only NASH significantly higher than obese controls.
Cell Metabolism
Cholesterol Metabolism Is Dysregulated in NASH
HMGCR phosphorylation, the effects of overexpression and
silencing of miR-34a were evaluated in Huh-7 cells. We demon-
strate that miR-34a enhances HMGCR dephosphorylation which
represents a novel function of miR-34a of potential clinical rele-
vance in NASH.
LDL-cholesterol (LDL-C) is a well-known risk factor for cardiac
disease. We also demonstrate that HMGCR and LDL receptor
(LDLR) are directly and inversely related to LDL-C respectively
in subjects with NAFLD. Although statin therapy lowers LDL-C
in subjects with NAFLD, the LDLR and HMGCR expression
remain at the levels seen in those not on statins. Together,
these data suggest widespread abnormalities in hepatic choles-
terol metabolism in NAFLD which are tightly associated with
disease activity and cardiovascular risk factors specifically
LDL-C.
RESULTS
The Patient Population StudiedA total of 20 subjects with NAFL and NASH each were enrolled
and compared to 20 obese controls and 6 lean normal controls.
The summary of demographic, clinical and laboratory data are
shown in Table 1. Subjects with NAFL or NASH were similar
with respect to gender, ethnicity, body mass index, alkaline
phosphate, total cholesterol (TC), and LDL-C to the obese
control group. As expected, lean normal subjects had lower
666 Cell Metabolism 15, 665–674, May 2, 2012 ª2012 Elsevier Inc.
insulin concentrations, LDL-C and aspartate and alanine amino-
transferases compared to subjects with NAFL or NASH. NASH
subjects had significantly higher triglyceride levels compared
with the lean and obese controls (p < 0.01 and 0.006 respec-
tively). Lean normal control subjects had lower LDL-C compared
to those with NAFL or NASH (p < 0.0001) while only those with
NASH had a significantly higher LDL-C compared to obese
controls (p < 0.005). A small minority of subjects in the obese
controls, NAFL and NASH had type 2 diabetes mellitus that
was controlled with diet alone. These subsets did not differ
from the rest of the subjects in their groups with respect to other
parameters.
Status of Cholesterol Metabolic PathwaysCholesterol Synthetic Pathways Are Upregulated
in NAFLD
The expression of HMGCR, the rate-limiting enzyme for choles-
terol synthesis, was similar in lean versus obese normal controls.
Both NAFL andNASHwere associated with a 2-3 fold increase in
HMGCR mRNA expression (p < 0.001 versus lean or obese
controls for both) and 3-4 fold increase in HMGCR protein levels
(Figures 1A, 2A and 2B). The increase in HMGCR expression was
not accompanied by a concomitant increase in the mRNA levels
of SREBP-2 the principal transcriptional regulator of HMGCR
(Figure 1A). However, the nuclear protein content of SREBP-2
was increased significantly in NASH (Figures 2A and 2B). There
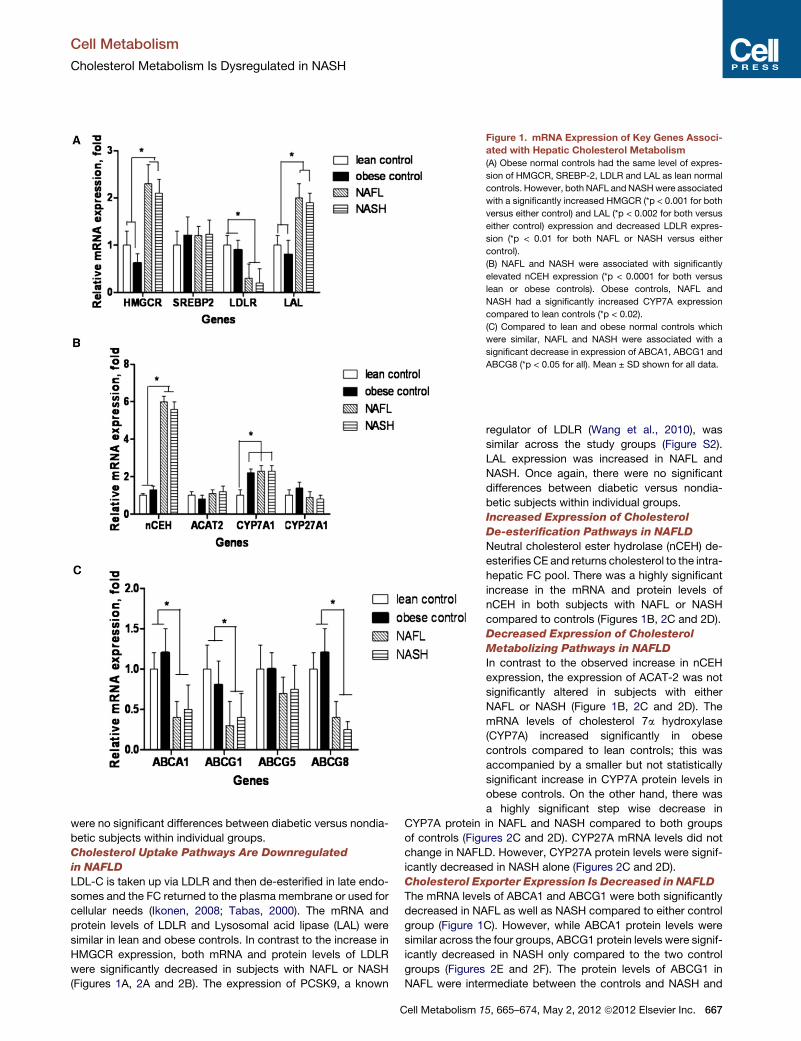
Figure 1. mRNA Expression of Key Genes Associ-
ated with Hepatic Cholesterol Metabolism
(A) Obese normal controls had the same level of expres-
sion of HMGCR, SREBP-2, LDLR and LAL as lean normal
controls. However, both NAFL andNASHwere associated
with a significantly increased HMGCR (*p < 0.001 for both
versus either control) and LAL (*p < 0.002 for both versus
either control) expression and decreased LDLR expres-
sion (*p < 0.01 for both NAFL or NASH versus either
control).
(B) NAFL and NASH were associated with significantly
elevated nCEH expression (*p < 0.0001 for both versus
lean or obese controls). Obese controls, NAFL and
NASH had a significantly increased CYP7A expression
compared to lean controls (*p < 0.02).
(C) Compared to lean and obese normal controls which
were similar, NAFL and NASH were associated with a
significant decrease in expression of ABCA1, ABCG1 and
ABCG8 (*p < 0.05 for all). Mean ± SD shown for all data.
Cell Metabolism
Cholesterol Metabolism Is Dysregulated in NASH
were no significant differences between diabetic versus nondia-
betic subjects within individual groups.
Cholesterol Uptake Pathways Are Downregulated
in NAFLD
LDL-C is taken up via LDLR and then de-esterified in late endo-
somes and the FC returned to the plasma membrane or used for
cellular needs (Ikonen, 2008; Tabas, 2000). The mRNA and
protein levels of LDLR and Lysosomal acid lipase (LAL) were
similar in lean and obese controls. In contrast to the increase in
HMGCR expression, both mRNA and protein levels of LDLR
were significantly decreased in subjects with NAFL or NASH
(Figures 1A, 2A and 2B). The expression of PCSK9, a known
Cell Metabolism 1
regulator of LDLR (Wang et al., 2010), was
similar across the study groups (Figure S2).
LAL expression was increased in NAFL and
NASH. Once again, there were no significant
differences between diabetic versus nondia-
betic subjects within individual groups.
Increased Expression of Cholesterol
De-esterification Pathways in NAFLD
Neutral cholesterol ester hydrolase (nCEH) de-
esterifies CE and returns cholesterol to the intra-
hepatic FC pool. There was a highly significant
increase in the mRNA and protein levels of
nCEH in both subjects with NAFL or NASH
compared to controls (Figures 1B, 2C and 2D).
Decreased Expression of Cholesterol
Metabolizing Pathways in NAFLD
In contrast to the observed increase in nCEH
expression, the expression of ACAT-2 was not
significantly altered in subjects with either
NAFL or NASH (Figure 1B, 2C and 2D). The
mRNA levels of cholesterol 7a hydroxylase
(CYP7A) increased significantly in obese
controls compared to lean controls; this was
accompanied by a smaller but not statistically
significant increase in CYP7A protein levels in
obese controls. On the other hand, there was
a highly significant step wise decrease in
CYP7A protein in NAFL and NASH compared to both groups
of controls (Figures 2C and 2D). CYP27A mRNA levels did not
change in NAFLD. However, CYP27A protein levels were signif-
icantly decreased in NASH alone (Figures 2C and 2D).
Cholesterol Exporter Expression Is Decreased in NAFLD
The mRNA levels of ABCA1 and ABCG1 were both significantly
decreased in NAFL as well as NASH compared to either control
group (Figure 1C). However, while ABCA1 protein levels were
similar across the four groups, ABCG1 protein levels were signif-
icantly decreased in NASH only compared to the two control
groups (Figures 2E and 2F). The protein levels of ABCG1 in
NAFL were intermediate between the controls and NASH and
5, 665–674, May 2, 2012 ª2012 Elsevier Inc. 667

Figure 2. Expression of Key Proteins Involved in Cholesterol Homeostasis
(A–F) Western blot analysis and graphic summary of protein expression (mean ± SD) of HMGCR, LAL, SREBP-2 and LDLR in lean controls, obese controls, NAFL
and NASH (A and B respectively), nCEH, ACAT2, CYP7A andCYP27A (C and D), and ABCA1, ABCG1 and ABCG8 (E and F). b-actin was used as a loading control
for all except SREBP-2 which was performed on nuclear extracts and where lamin B was used as the loading control. NAFL and NASH were associated with
a highly significant increase in HMGCR (*p < 0.0001 for both). SREBP-2 levels were significantly higher in NASH compared to controls (*p < 0.02). LDLR was
significantly decreased in both NAFL and NASH (*p < 0.03 for both compared to controls) while LALwas increased (p < 0.02 for both compared to controls). NAFL
and NASH were also associated with significantly increased nCEH (*p < 0.01 for both versus controls) along with decreased expression of CYP7A (*p < 0.05 for
both). There was a stepwise decrease in ABCG8 expression from normal to NAFL to NASH (p < 0.05 for NASH versus lean and obese controls). CYP27A was
decreased in NASH alone compared to controls and NAFL (p < 0.02 versus both controls and NAFL).
Cell Metabolism
Cholesterol Metabolism Is Dysregulated in NASH
were not significantly different from either (Figures 2C and 2D).
There were no significant changes in the expression of the biliary
canalicular cholesterol transporter ABCG5; however, there was
668 Cell Metabolism 15, 665–674, May 2, 2012 ª2012 Elsevier Inc.
a stepwise decrease in ABCG8 mRNA and protein levels from
normal to NAFL to NASH which was significant for NASH
(Figures 1C, 2C and 2D).
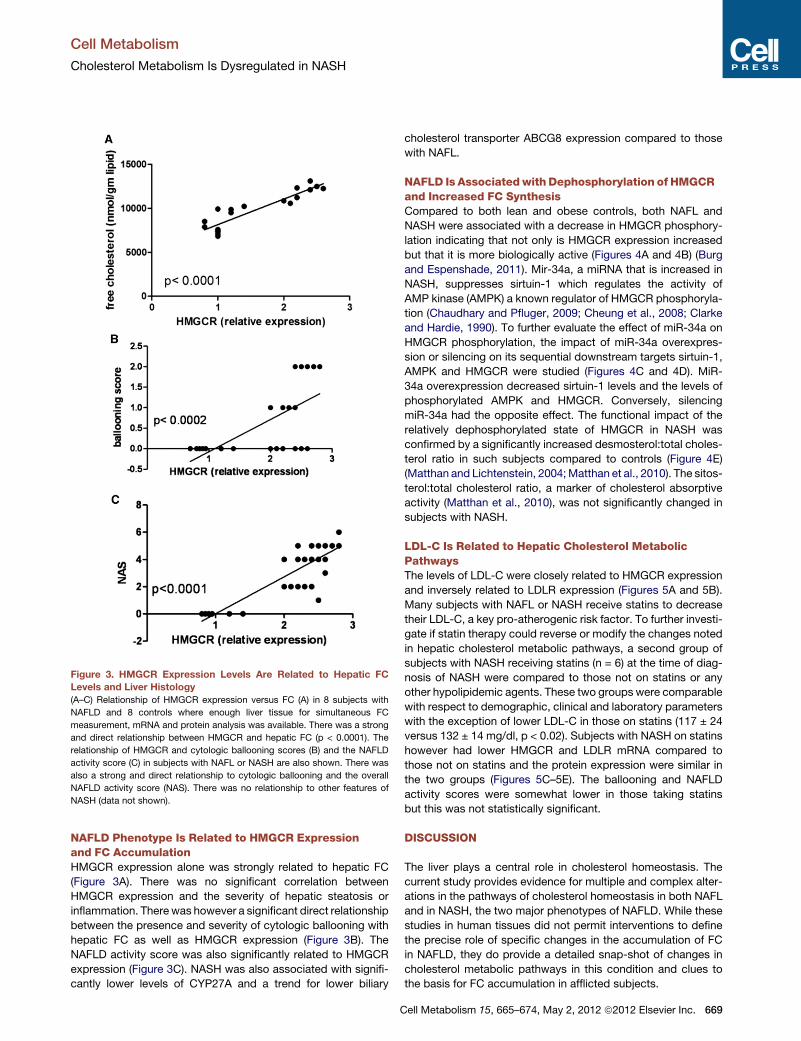
Figure 3. HMGCR Expression Levels Are Related to Hepatic FC
Levels and Liver Histology
(A–C) Relationship of HMGCR expression versus FC (A) in 8 subjects with
NAFLD and 8 controls where enough liver tissue for simultaneous FC
measurement, mRNA and protein analysis was available. There was a strong
and direct relationship between HMGCR and hepatic FC (p < 0.0001). The
relationship of HMGCR and cytologic ballooning scores (B) and the NAFLD
activity score (C) in subjects with NAFL or NASH are also shown. There was
also a strong and direct relationship to cytologic ballooning and the overall
NAFLD activity score (NAS). There was no relationship to other features of
NASH (data not shown).
Cell Metabolism
Cholesterol Metabolism Is Dysregulated in NASH
NAFLD Phenotype Is Related to HMGCR Expressionand FC AccumulationHMGCR expression alone was strongly related to hepatic FC
(Figure 3A). There was no significant correlation between
HMGCR expression and the severity of hepatic steatosis or
inflammation. Therewas however a significant direct relationship
between the presence and severity of cytologic ballooning with
hepatic FC as well as HMGCR expression (Figure 3B). The
NAFLD activity score was also significantly related to HMGCR
expression (Figure 3C). NASH was also associated with signifi-
cantly lower levels of CYP27A and a trend for lower biliary
C
cholesterol transporter ABCG8 expression compared to those
with NAFL.
NAFLD Is Associatedwith Dephosphorylation of HMGCRand Increased FC SynthesisCompared to both lean and obese controls, both NAFL and
NASH were associated with a decrease in HMGCR phosphory-
lation indicating that not only is HMGCR expression increased
but that it is more biologically active (Figures 4A and 4B) (Burg
and Espenshade, 2011). Mir-34a, a miRNA that is increased in
NASH, suppresses sirtuin-1 which regulates the activity of
AMP kinase (AMPK) a known regulator of HMGCR phosphoryla-
tion (Chaudhary and Pfluger, 2009; Cheung et al., 2008; Clarke
and Hardie, 1990). To further evaluate the effect of miR-34a on
HMGCR phosphorylation, the impact of miR-34a overexpres-
sion or silencing on its sequential downstream targets sirtuin-1,
AMPK and HMGCR were studied (Figures 4C and 4D). MiR-
34a overexpression decreased sirtuin-1 levels and the levels of
phosphorylated AMPK and HMGCR. Conversely, silencing
miR-34a had the opposite effect. The functional impact of the
relatively dephosphorylated state of HMGCR in NASH was
confirmed by a significantly increased desmosterol:total choles-
terol ratio in such subjects compared to controls (Figure 4E)
(Matthan and Lichtenstein, 2004;Matthan et al., 2010). The sitos-
terol:total cholesterol ratio, a marker of cholesterol absorptive
activity (Matthan et al., 2010), was not significantly changed in
subjects with NASH.
LDL-C Is Related to Hepatic Cholesterol MetabolicPathwaysThe levels of LDL-C were closely related to HMGCR expression
and inversely related to LDLR expression (Figures 5A and 5B).
Many subjects with NAFL or NASH receive statins to decrease
their LDL-C, a key pro-atherogenic risk factor. To further investi-
gate if statin therapy could reverse or modify the changes noted
in hepatic cholesterol metabolic pathways, a second group of
subjects with NASH receiving statins (n = 6) at the time of diag-
nosis of NASH were compared to those not on statins or any
other hypolipidemic agents. These two groups were comparable
with respect to demographic, clinical and laboratory parameters
with the exception of lower LDL-C in those on statins (117 ± 24
versus 132 ± 14 mg/dl, p < 0.02). Subjects with NASH on statins
however had lower HMGCR and LDLR mRNA compared to
those not on statins and the protein expression were similar in
the two groups (Figures 5C–5E). The ballooning and NAFLD
activity scores were somewhat lower in those taking statins
but this was not statistically significant.
DISCUSSION
The liver plays a central role in cholesterol homeostasis. The
current study provides evidence for multiple and complex alter-
ations in the pathways of cholesterol homeostasis in both NAFL
and in NASH, the two major phenotypes of NAFLD. While these
studies in human tissues did not permit interventions to define
the precise role of specific changes in the accumulation of FC
in NAFLD, they do provide a detailed snap-shot of changes in
cholesterol metabolic pathways in this condition and clues to
the basis for FC accumulation in afflicted subjects.
ell Metabolism 15, 665–674, May 2, 2012 ª2012 Elsevier Inc. 669

Figure 4. Phosphorylation Status of HMGCR and Cholesterol Synthetic Activity
(A–E) NAFL and NASHwere associated with less phosphorylation of the HMGCR compared to lean or obese controls. Western blot of representative subjects (A)
and graphic summary of data (n = 6 for each group), p < 0.05 for both (B). In another set of experiments, miR-34a, amicroRNA that is overexpressed in NASH, was
overexpressed or silenced in Huh-7 cells (C and D). Overexpression of miR-34a suppressed Sirt1 and the phosphorylation of downstream AMP kinase and
HMGCR. Silencing miR-34a had the opposite effect. These data indicate that miR-34a can modulate the phosphorylation of HMGCR. To further determine if
these changes were reflected in increased cholesterol synthetic activity, the circulating desmosterol to cholesterol ratio was measured in subjects with NAFLD
(n = 10) versus lean controls (n = 10) (E). The desmosterol:cholesterol ratio in subjects with NAFLD was almost double that in controls confirming that there was
increased cholesterol synthetic activity. The sitosterol:cholesterol ratios were not significantly different indicating that cholesterol absorptionwas not significantly
different. Mean ± SD shown for all graphical data.
Cell Metabolism
Cholesterol Metabolism Is Dysregulated in NASH
The present studies indicate that a combination of increased
production, decreased utilization and transport (Figure 6) could
contribute to the accumulation of FC in NAFLD. These include
activation of HMGCR and nCEH on one hand and inhibition of
CYP7A and ABCG8 on the other. Of these, the increase in
HMGCR was most dominant and its expression was tightly
linked to both hepatic FC and the NAFLD activity score. It was
also associatedwith the serumLDL-C levels. These data support
the concept that HMGCR overexpression is a key factor driving
both the LDL-C and accumulation of hepatic FC in NAFLD.
670 Cell Metabolism 15, 665–674, May 2, 2012 ª2012 Elsevier Inc.
The increase in both HMGCR mRNA and protein levels in
NAFLD suggests that it is transcriptionally activated. Increased
activation of SREBP-2, the principal transcriptional activator of
HMGCR (Horton et al., 1998), appears to be the mechanism
for increased HMGCR expression. These findings appear to be
specific for NAFLD because they were not seen in obese,
weight-matched controls. We have also not seen increased
HMGCRmRNA expression in hepatitis C (provided in Figure S1).
There are several potential mechanisms that could contribute to
SREBP-2 activation in NAFLD including increased FC content,

Figure 5. Relationship of HMGCR and LDLR Expression to LDL-C and Effects of Statins on HMGCR and LDLR Expression in NASH
(A–E) Circulating LDL-C was directly related to HMGCR expression levels (A) and inversely related to LDLR expression (B) (data for all subjects from all groups
shown). Subjects with NASH who were on statins for more than six months were compared to those who were not on statins. HMGCR and LDLR protein levels,
shown as a Western blot in three representative subjects each (C), were similar in both groups (shown graphically for six subjects each in D). mRNA levels of
HMGCR and SREBP-2 were paradoxically lower in subjects on statins (p < 0.05 for both) compared to those not on statins (E). Data for 6 subjects on statins were
compared to 20 subjects not on statins. Mean ± SD shown for all graphical data.
Cell Metabolism
Cholesterol Metabolism Is Dysregulated in NASH
unfolded protein response (Puri et al., 2007; Puri et al., 2008). The
precise mechanisms now await experimental elucidation.
HMGCR is not only increased in NAFLD but is also relatively
dephosphorylated and in its active form in NAFLD (Clarke and
Hardie, 1990). The functional consequence of increased
HMGCR activity was corroborated by the nearly doubled levels
of the desmosterol:cholesterol ratio, a marker of cholesterol
C
synthetic activity (Matthan et al., 2010), in subjects with NAFLD.
Our data indicate that miR-34a can modulate HMGCR phos-
phorylation and support the concept that increased miR-34a
may play a role in maintaining HMGCR in its active form in
NAFLD. It is however recognized that the only way to be certain
is to suppress miR-34a and evaluate its impact on HMGCR and
hepatic cholesterol accumulation in NAFLD. Unfortunately there
ell Metabolism 15, 665–674, May 2, 2012 ª2012 Elsevier Inc. 671

Figure 6. A Schematic Demonstrating the Molecular Alterations in
Cholesterol Metabolic Pathways in NASH Compared to Lean and
Obese Controls
Increased HMGCR and nCEH expression would be expected to increase the
FC pool. Utilization of FC for bile acid synthesis is decreased due to decreased
CYP7A and CYP27A expression. ABCG1 and ABCG8 expression are also
decreased which would be expected to decrease export of cholesterol from
hepatocytes.
Cell Metabolism
Cholesterol Metabolism Is Dysregulated in NASH
are no reagents currently available to selectively suppress miR-
34a in humans. Also, diet-induced animal models of NAFLD have
a proportional increase in FC and CE (personal observation) and
are thus different from humans with NAFLD (Puri et al., 2007).
It is well known that uptake of LDL-C via LDLR provides
feedback inhibition of HMGCR by inhibition SREBP-2 activation
(Goldstein and Brown, 2009). One could therefore hypothesize
that decreased hepatic uptake of LDL-derived cholesterol
due to decreased LDLR in NAFLD causes disinhibition of
SREBP-2 maturation and consequent transcriptional activation
of HMGCR. However, this would also be expected to increase
LDLR expression unless it was unable to overcome the effects
of the primary cause for LDLR suppression. PCSK9 is a known
inhibitor of LDLR expression (Horton et al., 2007). However,
PCSK9 mRNA was similar across our study groups suggesting
that other mechanisms are responsible for the low LDLR expres-
sion in NAFLD.
NASH is also associated with a decrease in CYP7A and
CYP27A levels; CYP27A is a mitochondrial protein and its
decrease may reflect mitochondrial injury that is present in
NASH but not in NAFL (Caldwell et al., 2009; Perez-Carreras
et al., 2003). Also, biliary cholesterol would be expected to be
decreased by the decrease in ABCG8. Cholesterol gallstones
are however prevalent in this obese population of subjects
(Chen et al., 2006). This suggests that ABCG5/ABCG8-indepen-
dent biliary cholesterol secretion is present in NASH. These
possibilities and their implications need further clarification.
Prior studies have focused on the role of free fatty acids as
a key driver of lipotoxicity in NAFLD and support the concept
that triglyceride synthesis diminishes fatty acid toxicity by acting
as a sump to limit fatty acid accumulation (Feldstein et al., 2004;
Yamaguchi et al., 2008). The current study extends the concept
of lipotoxicity to FC accumulation by providing evidence for
672 Cell Metabolism 15, 665–674, May 2, 2012 ª2012 Elsevier Inc.
a relationship between HMGCR activity and FC accumulation
to the severity of histologic injury and stage of disease. From a
cardiovascular point of view the direct relation between LDL-C
and HMGCR expression suggests that the liver disease
contributes to LDL-mediated cardiovascular risk. Also, the lower
than expected LDLR expression on statin therapy may nega-
tively impact the benefits of statins in this population. This
however requires prospective validation because it is at least
theoretically possible that subjects on statins had a lower
LDLR prior to starting treatment compared to those not on
statins.
The inclusion of subjects with type 2 diabetes could be consid-
ered as a potential confounder. However, given the high preva-
lence of diabetes in subjects with NASH, the failure to include
such subjects would limit the generalizability of the data. These
patients were otherwise similar to the rest of their cohorts and
no differences were noted between these subjects and the rest
of the subjects within each group. It is however possible that
with more severe diabetes additional differential changes in
cholesterol metabolic pathways could be uncovered.
In summary, the current study provides evidence for wide-
spread abnormalities in cholesterol homeostatic pathways in
NAFLD. The key findings are an increase in HMGCR expression
and decreased expression of LDL receptors and bile acid
synthetic enzymes. The mechanisms for these abnormalities
and the impact of the changes in specific pathways on disease
activity and progression as well as accelerated atherosclerosis
in NASH await elucidation.
EXPERIMENTAL PROCEDURES
Human Subjects and Liver Biopsies
Four groups of subjects were studied: (1) biopsy-proven NASH, (2) biopsy
proven nonalcoholic fatty liver (NAFL), (3) weight- and gender-matched obese
subjects with normal liver histology, and (4) lean subjects with normal liver
histology. Normal liver status was defined as normal liver enzymes and
imaging studies along with an asymptomatic status. Fatty liver and steatohe-
patitis were diagnosed using standard criteria used before (Kleiner et al.,
2005). The nonalcoholic nature of the disease was established clinically using
a daily intake cutoff of < 20 g of alcohol for females and < 30 g/day for males
within the past five years, as used in other studies of this disease (Chalasani
et al., 2009). Subjects with diet-controlled type 2 diabetes mellitus were
allowed to be included because many subjects with NAFLD have type 2
diabetes their exclusion could limit the generalizability of the data.
The exclusion criteria for the study included failure to obtain informed
consent, concurrent pregnancy, presence of advanced liver fibrosis (stage 3
or 4 disease), liver failure (elevated bilirubin or INR > 1.5), greater than 5%
weight gain or loss within prior 3 months, HIV infection, concomitant presence
of other liver diseases and use of drugs known to affect lipid metabolism e.g.,
statins, fibrates, polyunsaturated fatty acids etc. or impact NASH e.g., vitamin
E, thiazolidinediones and pentoxyfylline. For studies on the effect of statins,
subjects who met inclusion criteria for NASH or NAFL but were on a stable
dose of statins for over 6 months were studied.
Liver tissue was obtained at the time of clinically indicated liver biopsies or at
the beginning of a non-hepatic elective operation (bariatric surgery or chole-
cystectomy) for obese normal subjects. Lean normal liver tissue was obtained
from a tissue repository in the department of surgical pathology at the author’s
institution. Tissue was snap frozen in liquid nitrogen for future use. All subjects
provided informed consent. The study was approved by the institutional IRB
(VCU IRB # 1960).
Quantification of Gene Expression Using Real-Time PCR
Primers were designed by using Beacon Designer software (Bio-Rad Labora-
tories, Inc.) and verified by using BLAST search (Table S1). These included
Cell Metabolism
Cholesterol Metabolism Is Dysregulated in NASH
ABCA1, ABCG1, ABCG5, ABCG8, ACAT2, CYP7A1, CYP27A1, HMGCR, LAL,
LDLR, nCEH, PCSK9 and SREBP-2. Total RNA from liver biopsies was
extracted with a commercial RNA isolation kit (Trizol, Invitrogen), in each
case according to the manufacturer’s instructions. Following purification
with RNase-free DNase to remove genomic DNA from the preparation,
cDNA was synthesized from 4 mg of total RNA by using Maloney-murine
leukemia virus reverse transcriptase and oligo(dT) primers and subjected
to PCR by the manufacturer’s instructions. The quantitative RT-PCR
was performed using SYBR Green PCR master mix (BioRad, Hercules, CA)
on an ABI Prism 7300 Sequence Detection System as described before
(Puri et al., 2008): 50�C for 2 min and then at 95�C for 10 min followed
by 40 cycles of amplification (95�C for 15 s; 60�C for 30 s; 80�C for
30 s). Glyceraldehyde-3-phosphate dehydrogenase (GAPDH) was used as
the endogenous normalizer. The specificity of qPCR was established by
incorporating no template and no reverse transcript controls. Total RNA ex-
tracted from a histologically normal liver of a lean normal individual obtained
at the time of living donor liver transplantation was used as an internal cali-
brator across all experiments. Cycle threshold (Ct) values were normalized
to GAPDH and comparative quantification of target mRNA done by the
DDCt method using integrated software with Stratagene Mx3000P� QPCR
system.
Quantitative RT-PCR Measurement of miRNA
This was performed as previously described. Total RNA and small micro RNAs
were isolated and extracted from frozen liver tissues or cell cultures as previ-
ously described (Puri et al., 2008). cDNA was synthesized using TaqMan
MicroRNA Reverse Transcriptase (Applied Biosystems, Foster City, CA)
according tomanufacturer’s instructions. RT-PCRwas performed in triplicates
using an Applied Biosystems 7300 Sequence Detection system, as described
by Bloomston (Bloomston et al., 2007). The relative abundance of miRNA
was calculated after normalization to small nuclear RNA U6 (RNU6B, Applied
Biosystems) to the manufacturer’s protocol.
Protein Extraction and Western Blot Analysis
This was performed as previously described by us (Puri et al., 2008). Human
liver tissues were homogenized using lysis buffer (Sigma, St.Louis, MO) and
then sonicated on ice with a Sonicator cell disrupter, Model 100 Sonic
Dismembrator (Thermo Fisher Scientific Inc., Waltham, MA; power 2, 6
pulses 3 2). Cell lysates were centrifuged at 12000 g x 30 min and proteins
in the supernatants quantified and separated using 4%–12% NuPAGE�Novex Bis-Tris Mini Gels (Invitrogen) and were transferred to a nitrocellulose
membrane for 1 hr at 40 V using a Western blot apparatus (Invitrogen). After
overnight incubation with primary antibody, membranes were washed and
incubated with HRP-conjugated secondary antibodies (Pierce Biotechnology,
Inc., Rockford, IL) and were detected using the SuperSignal chemilumines-
cence kit (Pierce). The signal capture and protein levels analyses were
performed as described before (Cheung et al., 2008). SREBP-2 and Lamin B
were measured in nuclear extracts by Western blots as described before
(Cheung et al., 2008).
Cell Culture and Transfection Protocols
Huh-7 cell line was grown in DMEM containing 10% fetal bovine serum (FBS),
100 IU/ml penicillin and 100 mg/ml Streptomycin. Total RNA from Huh-7 cell
was extracted with a commercial RNA isolation kit (Trizol, Invitrogen), in
each case according to the manufacturer’s instructions. miR-34a and miR-
34a-inhibitor were purchased from Dharmacon RNA Technologies(Lafayette,
CO, USA). Cells were plated to 50% confluency and were transfected with
40 nmol/l miR-34a, miR-34a inhibitor or negative control by Lipofectamine
2000 (Invitrogen) in Opti-MEM (Invitrogen, Carlsbad, CA), according to the
manufacturer’s protocol. Transfection efficiency was monitored with FAM
dye-labeled Pre-miR Negative Control #1 (Ambion. Co.). After 48 hr, cells
were harvested for analysis.
Measurement of Desmosterol, Sitosterols
Briefly, 200 ml of serum was spiked with deuterated internal standard and
the sterols in the sample were extracted from the specimen using hexane.
The organic supernatant was dried down using a turbovap at 40�C and the
samples were reconstituted in 80:20 methanol:isopropanol and analyzed via
liquid chromatography tandem mass spectrometry (LC-MSMS), monitoring
specific m/z transitions for each sterol. The analysis is performed on an AB
Sciex 5500 MSMS with Shimadzu Prominence 20 series pumps.
C
Statistical Analysis and Sample Size Estimation
Sample size estimations were performed using N Query Advisor 7.0. To test
the hypothesis that size (mean levels controls versus disease) of 1.25 for
NAFL and 1.5 for NASH, and assuming a standard deviation of 25% for
each of the groups and a power of 80% to detect changes at a p value of
0.05, a total of 6 subjects would be required in each arm. If the effect size
was a 2-fold change in NASH, and 1.5 fold change in NAFL, the sample size
dropped to 3 subjects in each arm. Not knowing the exact standard deviation
for each of the biologic parameters to be measured, a minimum sample size of
20 subjects in each group was planned with the exception of lean normals
where 6 subjects were studied (mainly due to limited availability of tissue).
The RNA and protein levels for a given gene were compared across groups
using Kruskal Wallis analysis of variance (ANOVA), a distribution-free test.
A Bonnferroni post-test was used for multiple comparisons. Significance
was set at a p value of 0.05.
SUPPLEMENTAL INFORMATION
Supplemental Information includes two figures and one table and can be found
with this article online at doi:10.1016/j.cmet.2012.04.004.
ACKNOWLEDGMENTS
This is original work and is not under consideration elsewhere for publication.
This work has only been presented in part at the annual meeting of the
American Association for Study of Liver Diseases in San Francisco in 2008.
This work was supported by three grants from the National Institutes of Health
to A.J.S.: 5R01DK081410-03, K24 DK 02755 and T32 DK-007150-33. The
authors are indebted to Michael Pandak, Shunlin Ren and Phillip Hylemon
for their advice.
Received: October 25, 2011
Revised: January 16, 2012
Accepted: April 5, 2012
Published online: May 1, 2012
REFERENCES
Adams, L.A., Sanderson, S., Lindor, K.D., and Angulo, P. (2005). The histolog-
ical course of nonalcoholic fatty liver disease: a longitudinal study of 103
patients with sequential liver biopsies. J. Hepatol. 42, 132–138.
Beg, Z.H., Stonik, J.A., and Brewer, H.B., Jr. (1984). In vivo modulation of rat
liver 3-hydroxy-3-methylglutaryl-coenzyme A reductase, reductase kinase,
and reductase kinase kinase by mevalonolactone. Proc. Natl. Acad. Sci.
USA 81, 7293–7297.
Beg, Z.H., Stonik, J.A., and Brewer, H.B., Jr. (1985). Phosphorylation of
hepatic 3-hydroxy-3-methylglutaryl coenzyme A reductase and modulation
of its enzymic activity by calcium-activated and phospholipid-dependent
protein kinase. J. Biol. Chem. 260, 1682–1687.
Beg, Z.H., Stonik, J.A., and Brewer, H.B., Jr. (1987). Modulation of the enzymic
activity of 3-hydroxy-3-methylglutaryl coenzyme A reductase by multiple
kinase systems involving reversible phosphorylation: a review. Metabolism
36, 900–917.
Bloomston, M., Frankel, W.L., Petrocca, F., Volinia, S., Alder, H., Hagan, J.P.,
Liu, C.G., Bhatt, D., Taccioli, C., and Croce, C.M. (2007).MicroRNA expression
patterns to differentiate pancreatic adenocarcinoma from normal pancreas
and chronic pancreatitis. JAMA 297, 1901–1908.
Brea, A., Mosquera, D., Martın, E., Arizti, A., Cordero, J.L., and Ros, E. (2005).
Nonalcoholic fatty liver disease is associated with carotid atherosclerosis:
a case-control study. Arterioscler. Thromb. Vasc. Biol. 25, 1045–1050.
Browning, J.D., and Horton, J.D. (2004). Molecular mediators of hepatic stea-
tosis and liver injury. J. Clin. Invest. 114, 147–152.
Browning, J.D., Szczepaniak, L.S., Dobbins, R., Nuremberg, P., Horton, J.D.,
Cohen, J.C., Grundy, S.M., and Hobbs, H.H. (2004). Prevalence of hepatic
steatosis in an urban population in the United States: impact of ethnicity.
Hepatology 40, 1387–1395.
ell Metabolism 15, 665–674, May 2, 2012 ª2012 Elsevier Inc. 673
Cell Metabolism
Cholesterol Metabolism Is Dysregulated in NASH
Burg, J.S., and Espenshade, P.J. (2011). Regulation of HMG-CoA reductase in
mammals and yeast. Prog. Lipid Res. 50, 403–410.
Caballero, F., Fernandez, A., De Lacy, A.M., Fernandez-Checa, J.C.,
Caballerıa, J., and Garcıa-Ruiz, C. (2009). Enhanced free cholesterol,
SREBP-2 and StAR expression in human NASH. J. Hepatol. 50, 789–796.
Caldwell, S.H., de Freitas, L.A., Park, S.H., Moreno, M.L., Redick, J.A., Davis,
C.A., Sisson, B.J., Patrie, J.T., Cotrim, H., Argo, C.K., and Al-Osaimi, A. (2009).
Intramitochondrial crystalline inclusions in nonalcoholic steatohepatitis.
Hepatology 49, 1888–1895.
Chalasani, N.P., Sanyal, A.J., Kowdley, K.V., Robuck, P.R., Hoofnagle, J.,
Kleiner, D.E., Unalp, A., and Tonascia, J.; NASH CRN Research Group.
(2009). Pioglitazone versus vitamin E versus placebo for the treatment of
non-diabetic patients with non-alcoholic steatohepatitis: PIVENS trial design.
Contemp. Clin. Trials 30, 88–96.
Chaudhary, N., and Pfluger, P.T. (2009). Metabolic benefits fromSirt1 and Sirt1
activators. Curr. Opin. Clin. Nutr. Metab. Care 12, 431–437.
Chen, C.H., Huang, M.H., Yang, J.C., Nien, C.K., Etheredge, G.D., Yang, C.C.,
Yeh, Y.H., Wu, H.S., Chou, D.A., and Yueh, S.K. (2006). Prevalence and risk
factors of gallstone disease in an adult population of Taiwan: an epidemiolog-
ical survey. J. Gastroenterol. Hepatol. 21, 1737–1743.
Cheung, O., Puri, P., Eicken, C., Contos, M.J., Mirshahi, F., Maher, J.W.,
Kellum, J.M., Min, H., Luketic, V.A., and Sanyal, A.J. (2008). Nonalcoholic
steatohepatitis is associated with altered hepatic MicroRNA expression.
Hepatology 48, 1810–1820.
Clarke, P.R., and Hardie, D.G. (1990). Regulation of HMG-CoA reductase:
identification of the site phosphorylated by the AMP-activated protein kinase
in vitro and in intact rat liver. EMBO J. 9, 2439–2446.
Devries-Seimon, T., Li, Y., Yao, P.M., Stone, E., Wang, Y., Davis, R.J., Flavell,
R., and Tabas, I. (2005). Cholesterol-induced macrophage apoptosis requires
ER stress pathways and engagement of the type A scavenger receptor. J. Cell
Biol. 171, 61–73.
Ekstedt, M., Franzen, L.E., Mathiesen, U.L., Thorelius, L., Holmqvist, M.,
Bodemar, G., and Kechagias, S. (2006). Long-term follow-up of patients
with NAFLD and elevated liver enzymes. Hepatology 44, 865–873.
Feldstein, A.E., Werneburg, N.W., Canbay, A., Guicciardi, M.E., Bronk, S.F.,
Rydzewski, R., Burgart, L.J., and Gores, G.J. (2004). Free fatty acids promote
hepatic lipotoxicity by stimulating TNF-alpha expression via a lysosomal
pathway. Hepatology 40, 185–194.
Geng, Y.J., Phillips, J.E., Mason, R.P., and Casscells, S.W. (2003). Cholesterol
crystallization and macrophage apoptosis: implication for atherosclerotic
plaque instability and rupture. Biochem. Pharmacol. 66, 1485–1492.
Ginsberg, H.N. (2006). Is the slippery slope from steatosis to steatohepatitis
paved with triglyceride or cholesterol? Cell Metab. 4, 179–181.
Goldstein, J.L., and Brown, M.S. (2009). The LDL receptor. Arterioscler.
Thromb. Vasc. Biol. 29, 431–438.
Hanley, A.J., Williams, K., Festa, A., Wagenknecht, L.E., D’Agostino, R.B., Jr.,
and Haffner, S.M. (2005). Liver markers and development of the metabolic
syndrome: the insulin resistance atherosclerosis study. Diabetes 54, 3140–
3147.
Horton, J.D., Shimomura, I., Brown, M.S., Hammer, R.E., Goldstein, J.L., and
Shimano, H. (1998). Activation of cholesterol synthesis in preference to fatty
674 Cell Metabolism 15, 665–674, May 2, 2012 ª2012 Elsevier Inc.
acid synthesis in liver and adipose tissue of transgenic mice overproducing
sterol regulatory element-binding protein-2. J. Clin. Invest. 101, 2331–2339.
Horton, J.D., Cohen, J.C., and Hobbs, H.H. (2007). Molecular biology of
PCSK9: its role in LDL metabolism. Trends Biochem. Sci. 32, 71–77.
Ikonen, E. (2008). Cellular cholesterol trafficking and compartmentalization.
Nat. Rev. Mol. Cell Biol. 9, 125–138.
Kleiner, D.E., Brunt, E.M., VanNatta,M., Behling, C., Contos,M.J., Cummings,
O.W., Ferrell, L.D., Liu, Y.C., Torbenson, M.S., Unalp-Arida, A., et al;
Nonalcoholic Steatohepatitis Clinical Research Network. (2005). Design and
validation of a histological scoring system for nonalcoholic fatty liver disease.
Hepatology 41, 1313–1321.
Ludwig, J., Viggiano, T.R., McGill, D.B., and Oh, B.J. (1980). Nonalcoholic
steatohepatitis: Mayo Clinic experiences with a hitherto unnamed disease.
Mayo Clin. Proc. 55, 434–438.
Matthan, N.R., and Lichtenstein, A.H. (2004). Approaches to measuring
cholesterol absorption in humans. Atherosclerosis 174, 197–205.
Matthan, N.R., Resteghini, N., Robertson, M., Ford, I., Shepherd, J., Packard,
C., Buckley, B.M., Jukema, J.W., Lichtenstein, A.H., and Schaefer, E.J.;
PROSPER Group. (2010). Cholesterol absorption and synthesis markers in
individuals with and without a CHD event during pravastatin therapy: insights
from the PROSPER trial. J. Lipid Res. 51, 202–209.
Perez-Carreras, M., Del Hoyo, P., Martın, M.A., Rubio, J.C., Martın, A.,
Castellano, G., Colina, F., Arenas, J., and Solis-Herruzo, J.A. (2003).
Defective hepatic mitochondrial respiratory chain in patients with nonalcoholic
steatohepatitis. Hepatology 38, 999–1007.
Puri, P., Baillie, R.A., Wiest, M.M., Mirshahi, F., Choudhury, J., Cheung, O.,
Sargeant, C., Contos, M.J., and Sanyal, A.J. (2007). A lipidomic analysis of
nonalcoholic fatty liver disease. Hepatology 46, 1081–1090.
Puri, P., Mirshahi, F., Cheung, O., Natarajan, R.,Maher, J.W., Kellum, J.M., and
Sanyal, A.J. (2008). Activation and dysregulation of the unfolded protein
response in nonalcoholic fatty liver disease. Gastroenterology 134, 568–576.
Tabas, I. (2000). Cholesterol and phospholipid metabolism in macrophages.
Biochim. Biophys. Acta 1529, 164–174.
Targher, G., Bertolini, L., Padovani, R., Rodella, S., Tessari, R., Zenari, L., Day,
C., and Arcaro, G. (2007). Prevalence of nonalcoholic fatty liver disease and its
association with cardiovascular disease among type 2 diabetic patients.
Diabetes Care 30, 1212–1218.
Villanova, N., Moscatiello, S., Ramilli, S., Bugianesi, E., Magalotti, D., Vanni, E.,
Zoli, M., andMarchesini, G. (2005). Endothelial dysfunction and cardiovascular
risk profile in nonalcoholic fatty liver disease. Hepatology 42, 473–480.
Wang, Z., Yao, T., and Song, Z. (2010). Chronic alcohol consumption disrupted
cholesterol homeostasis in rats: down-regulation of low-density lipoprotein
receptor and enhancement of cholesterol biosynthesis pathway in the liver.
Alcohol. Clin. Exp. Res. 34, 471–478.
Wanless, I.R., and Lentz, J.S. (1990). Fatty liver hepatitis (steatohepatitis)
and obesity: an autopsy study with analysis of risk factors. Hepatology 12,
1106–1110.
Yamaguchi, K., Yang, L., McCall, S., Huang, J., Yu, X.X., Pandey, S.K., Bhanot,
S., Monia, B.P., Li, Y.X., and Diehl, A.M. (2008). Diacylglycerol acyltranferase 1
anti-sense oligonucleotides reduce hepatic fibrosis in mice with nonalcoholic
steatohepatitis. Hepatology 47, 625–635.