cell design to maximize capacity in cdma networks
DESCRIPTION
Cell Design to Maximize Capacity in CDMA Networks. Robert Akl, D.Sc. Outline. CDMA inter-cell effects Capacity region Base station location Pilot-signal power Transmission power of the mobiles Maximize network capacity Mobility Call admission control algorithm Network performance. - PowerPoint PPT PresentationTRANSCRIPT

Cell Design to Maximize Cell Design to Maximize Capacity in CDMA NetworksCapacity in CDMA Networks
Robert Akl, D.Sc.

OutlineOutline
CDMA inter-cell effects Capacity region– Base station location– Pilot-signal power– Transmission power of the mobiles
Maximize network capacity Mobility Call admission control algorithm Network performance

CDMA Capacity IssuesCDMA Capacity Issues
Depends on inter-cell interference and intra-cell interference
Complete frequency reuse Soft Handoff Power Control Sectorization Voice activity detection Graceful degradation
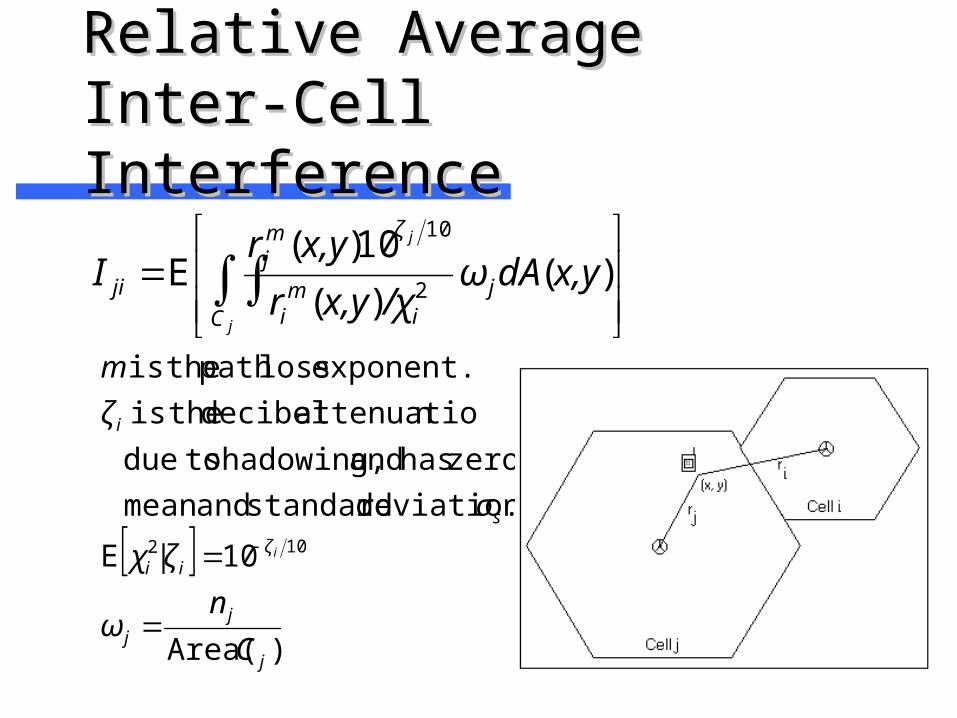
Relative Average Inter-Cell Relative Average Inter-Cell InterferenceInterference
)Area(
10E
.deviation standard andmean
zero has and shadowing, todue
nattenuatio decibel theis
exponent. losspath theis
102
j
jj
ζii
s
i
C
nω
|ζχ
σ
ζ
m
i
j
j
C
ji
mi
ζmj
ji x,ydAω/χx,yr
x,yrI )(
)(
10)(E
2
10

Soft HandoffSoft Handoff
User is permitted to be in soft handoff to its two nearest cells.

Soft HandoffSoft Handoff
(c)region
1010210
(c)region
1010210
(b)region
1010210
(a)region
1010210
)(101010E
)(101010E
)(101010E
)(101010E
x,yωdAr|rχr
rI
x,yωdAr|rχr
rI
x,yωdAr|rχr
rI
x,yωdAr|rχr
rI
jkk
kjj
ikk
ijj
ζmj
ζmki
ζmi
mk
ki
ζmk
ζmji
ζ
mi
mj
ji
ζmi
ζmki
ζmi
mk
ki
ζmi
ζmji
ζ
mi
mj
ji

Inter-Cell Interference FactorInter-Cell Interference Factor
. toequal cellin ceinterferen
average relative a produce cellin users
. cell to cell from
factor ceinterferen cell-interuser per
jij
j
ji
κni
jn
ij
κ

Capacity RegionCapacity Region

Network CapacityNetwork Capacity
Transmission power of mobiles
Pilot-signal power
Base station location

Power Compensation FactorPower Compensation Factor
Fine tune the nominal transmission power of the mobiles
PCF defined for each cell
PCF is a design tool to maximize the capacity of the entire network

Power Compensation Factor (PCF)Power Compensation Factor (PCF)
Interference is linear in PCF
Find the sensitivity of the network capacity w.r.t. the PCF

Sensitivity w.r.t. pilot-signal powerSensitivity w.r.t. pilot-signal power
Increasing the pilot-signal power of one cell:
– Increases intra-cell interference and decreases inter-cell interference in that cell
– Opposite effect takes place in adjacent cells

Sensitivity w.r.t. LocationSensitivity w.r.t. Location
Moving a cell away from neighbor A and closer to neighbor B:
– Inter-cell interference from neighbor A increases
– Inter-cell interference from neighbor B decreases

Optimization using PCFOptimization using PCF

Optimization using LocationOptimization using Location

Optimization using Pilot-signal PowerOptimization using Pilot-signal Power
.,...,1for
,0),(
subject to
capacity)(network ,max
)(
1
1
Mi
cβ
LCκβnn
n
ieff
M
j i
ijjijji
M
ii
T

Combined OptimizationCombined Optimization

Twenty-seven Cell CDMA Twenty-seven Cell CDMA NetworkNetwork
Uniform user distribution profile.
Network capacity equals 559 simultaneous users.
Uniform placement is optimal for uniform user distribution.

Three Hot SpotsThree Hot Spots
All three hot spots have a relative user density of 5 per grid point.
Network capacity decreases to 536.
Capacity in cells 4, 15, and 19, decreases from 18 to 3, 17 to 1, and 17 to 9.

Optimization using PCFOptimization using PCF
Network capacity increases to 555.
Capacity in cells 4, 15, and 19, increases from 3 to 12, 1 to 9, and 9 to 14.
Smallest cell-capacity is 9.

Optimization using Pilot-signal Power Optimization using Pilot-signal Power
Network capacity increases to 546.
Capacity in cells 4, 15, and 19, increases from 3 to 11, 1 to 9, and 9 to 16.
Smallest cell-capacity is 9.

Optimization using Location Optimization using Location
Network capacity increases to 549.
Capacity in cells 4, 15, and 19, increases from 3 to 14, 1 to 8, and 9 to 17.
Smallest cell-capacity is 8.

Combined OptimizationCombined Optimization
Network capacity increases to 565.
Capacity in cells 4, 15, and 19, increases from 3 to 16, 1 to 13, and 9 to 16.
Smallest cell-capacity is 13.


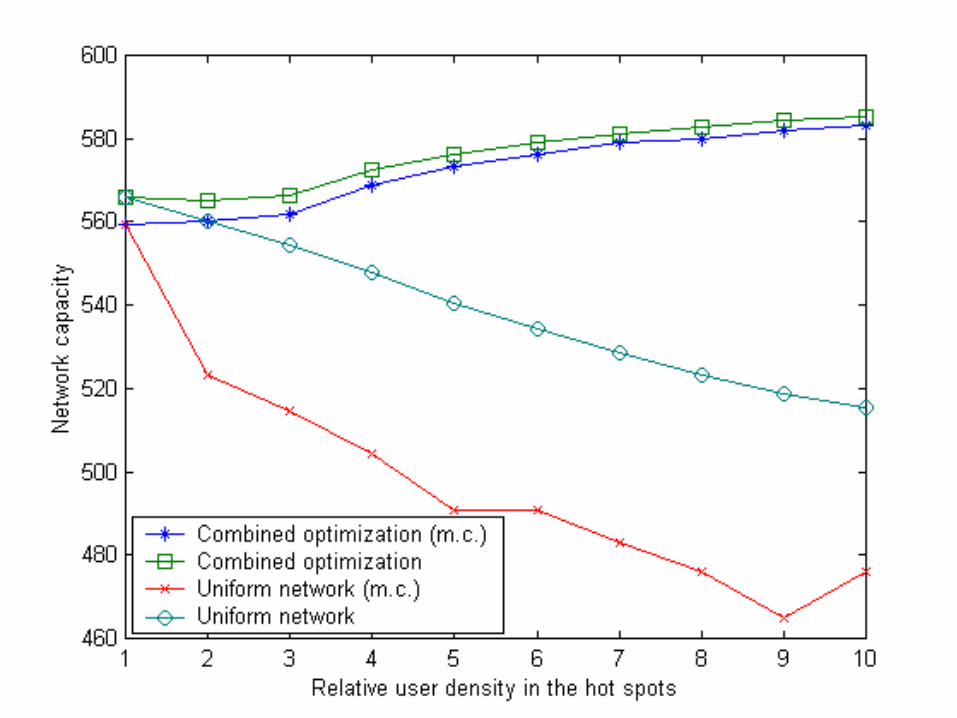
Combined Optimization (m.c.)Combined Optimization (m.c.)


Call Admission ControlCall Admission Control
Fix cell design parameters
Design a call admission control algorithm
– Guarantees quality of service requirements
– “Good” blocking probability

Our ModelOur Model
New call arrival process to cell i is Poisson.
Total offered traffic to cell i is:

Handoff RateHandoff Rate

Blocking ProbabilityBlocking Probability
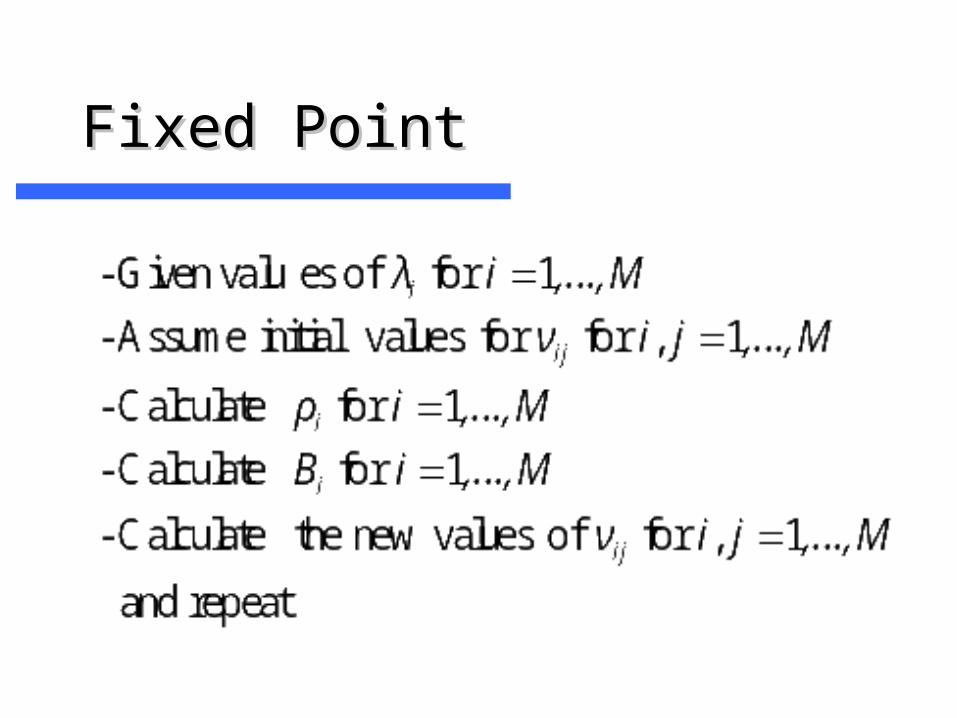
Fixed PointFixed Point

Net Revenue Net Revenue HH
Revenue generated by accepting a new call
Cost of a forced termination due to handoff failure
Finding the derivative of H w.r.t. the arrival rate and w.r.t. N is difficult.

Maximization of Net RevenueMaximization of Net Revenue

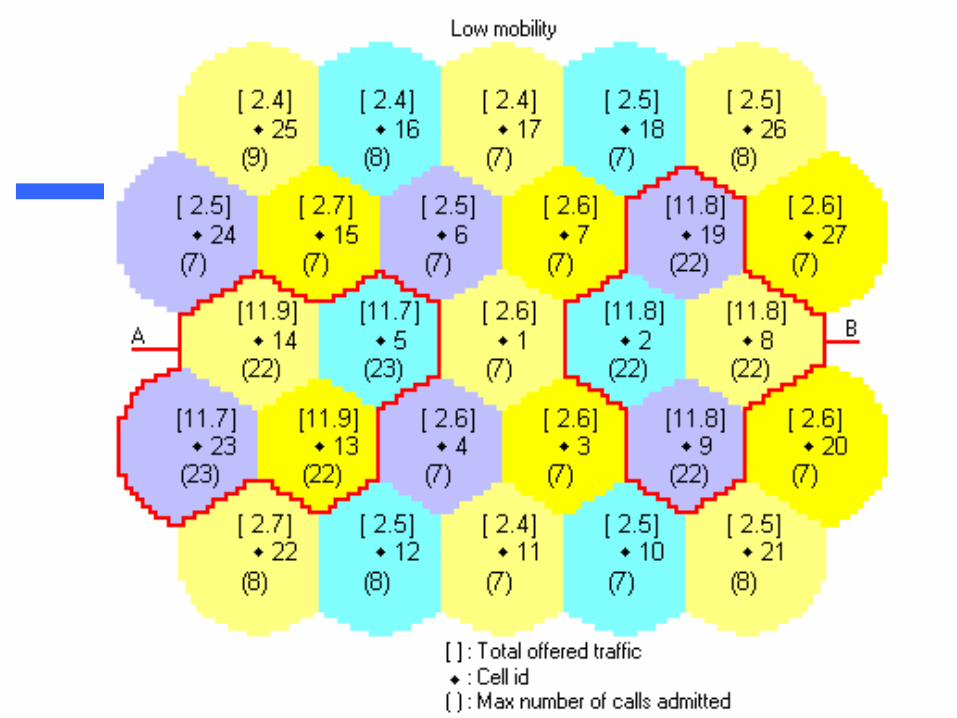
3 Mobility Cases3 Mobility Cases
No mobility qii= 0.3 and qi= 0.7
Low Mobility High Mobility
||Ai|| qij qii qi
3 0.020 0.24 0.7
4 0.015 0.24 0.7
5 0.012 0.24 0.7
6 0.010 0.24 0.7
||Ai|| qij qii qi
3 0.100 0.0 0.7
4 0.075 0.0 0.7
5 0.060 0.0 0.7
6 0.050 0.0 0.7


Maximization of ThroughputMaximization of Throughput


ConclusionsConclusions
Solved cell design problem.
Formed general principles on cell design.
Designed a call admission control algorithm.
Calculated upper bounds on throughput for a given network topology and traffic distribution profile.