cell-cycle-dependent regulation of androgen receptor function · cell-cycle-dependent regulation of...
TRANSCRIPT
En
do
crin
e-R
ela
ted
Can
cer
ResearchY Koryakina et al. Cell cycle regulation of
androgen receptor22 :2 249–264
Cell-cycle-dependent regulation ofandrogen receptor function
Yulia Koryakina1, Karen E Knudsen2 and Daniel Gioeli1,3
1Department of Microbiology, Immunology, and Cancer Biology, University of Virginia, Jordan Hall Room 2-16,
1300 Jefferson Park Avenue, PO Box 800734, Charlottesville, Virginia 22908, USA2Sidney Kimmel Cancer Center, Thomas Jefferson University, Philadelphia, Pennsylvania, USA3Cancer Center Member, University of Virginia, Charlottesville, Virginia, USA
http://erc.endocrinology-journals.org q 2015 Society for EndocrinologyDOI: 10.1530/ERC-14-0549 Printed in Great Britain
Published by Bioscientifica Ltd.
Downloa
Correspondence
should be addressed
to D Gioeli
Abstract
The androgen receptor (AR) is a critical oncogene in prostate cancer (PCa) development and
progression. In this study, we demonstrate cell-cycle-dependent regulation of AR activity,
localization, and phosphorylation. We show that for three AR-target genes, androgen-
stimulated AR transactivation is highest during the G1 phase, decreased during S-phase,
and abrogated during G2/M. This change in AR transactivation parallels changes in AR
localization and phosphorylation. A combination of imaging techniques and quantitative
analysis reveals nuclear AR localization during interphase and the exclusion of the majority,
but not all, AR from chromatin during mitosis. Flow cytometry analyses using a phospho-
S308 AR-specific antibody in asynchronous and chemically enriched G2/M PCa cells revealed
ligand-independent induction of S308 phosphorylation in mitosis when CDK1 is activated.
Consistent with our flow cytometry data, IP-western blotting revealed an increase in S308
phosphorylation in G2/M, and the results of an in vitro kinase assay indicated that CDK1 was
able to phosphorylate the AR on S308. Pharmacological inhibition of CDK1 activity resulted
in decreased S308 phosphorylation in PCa cells. Importantly, using a combination of
anti-total AR and phospho-S308-specific antibodies in immunofluorescence experiments,
we showed that the AR is excluded from condensed chromatin in mitotic cells when it was
phosphorylated on S308. In summary, we show that the phosphorylation of the AR on
S308 by CDK1 during mitosis regulates AR localization and correlates with changes in
AR transcriptional activity. These findings have important implications for understanding
the function of AR as an oncogene.
Key Words
" androgen receptor
" cell cycle
" phosphorylation
" localization
" mitosis
ded
Endocrine-Related Cancer
(2015) 22, 249–264
Introduction
Inhibition of androgen receptor (AR) function is a
standard therapy for the initial presentation of dissemi-
nated prostate cancer (PCa) (George & Moul 2011).
However, treatment almost invariably fails, leading to the
emergence of castration-resistant prostate cancer (CRPC).
The clinical importance of targeting AR function in CRPC
is best illustrated by the FDA approval of abiraterone,
a CYP17 inhibitor, and the anti-androgen, enzalutamide.
Unfortunately, the clinical benefit of these new therapies
is not durable (Joseph et al. 2013). These observations
further emphasize the importance of AR signaling in PCa
development and progression. Only a thorough under-
standing of AR biology will provide novel insights into
how to therapeutically target this critical driver of PCa.
The AR functions as a driver of G1 progression
through cross-communication with the cell cycle
from Bioscientifica.com at 06/06/2020 07:01:54AMvia free access
En
do
crin
e-R
ela
ted
Can
cer
Research Y Koryakina et al. Cell cycle regulation ofandrogen receptor
22 :2 250
machinery and regulation of transcription of genes that
control the G1-S transition (Balk & Knudsen 2008). Upon
androgen withdrawal, PCa cells arrest in early G1 with
hypo-phosphorylated RB suppressing E2F activity
(Knudsen et al. 1998, Xu et al. 2006). Stimulation with
androgen leads to the accumulation of cyclin D1 and
activation of CDK4, which promotes phosphorylation of
RB (Xu et al. 2006). Furthermore, AR-induced expression
of p21 and degradation of p27 enhance CycD/CDK4 and
CycE/CDK2-dependent phosphorylation and inactivation
of RB allowing the expression of E2F-target genes
(Knudsen et al. 1998, Lu et al. 1999). Thus, androgen-
induced alterations in CDK activity enable expression of
genes critical for S-phase entry (Knudsen 2006).
A cross-talk between AR signaling and the cell cycle
machinery is not limited to the effects of androgens on the
G1-S transition as several components of the cell cycle
machinery have been shown to modulate AR function.
It was first noted, in a study using fibroblasts, that AR
activity is regulated as a function of the cell cycle; the
results of this study indicated that AR transcriptional
activity is lowest at the G1/S transition, when cyclin D1
levels and CDK4 activity are at their peak (Martinez &
Danielsen 2002). Cyclin D1 represses AR transcriptional
activity independently of CDK4 by directly binding the
coactivator-binding–AR dimerization motif in the AR AF-1
(Knudsen et al. 1999, Reutens et al. 2001, Martinez &
Danielsen 2002, Petre et al. 2002). This interaction
competes with AR coactivators such as p300/CAF and
interferes with N/C-terminal AR interactions (Knudsen
et al. 1999, Reutens et al. 2001, Burd et al. 2006). Thus,
cyclin D1 can act in a negative feedback loop, attenuating
AR activity. This cyclin D1 repression is disrupted at
multiple levels in human tumors facilitating increased AR
activity (Burd et al. 2006, Knudsen 2006, Comstock &
Knudsen 2007). Cyclin E has also been shown to associate
with the AR AF-1 to enhance AR transcription indepen-
dently of CDK2 (Yamamoto et al. 2000). In addition, CDK6
negates the ability of cyclin D1 to suppress AR function,
and can serve to heighten AR activity independent of its
kinase function (Lim et al. 2005). However, surprisingly
little has been reported on the role of the AR in G2
or mitosis.
The effect of the cell cycle on AR protein expression
has been examined in one study where it was suggested
that AR protein expression is lost during mitosis and that
the AR functions as a mitotic licensing factor (Litvinov
et al. 2006). However, others have reported that the AR is
bound to condensed chromatin during mitosis (Kumar
et al. 2008). Thus, little is known about the AR during
http://erc.endocrinology-journals.org q 2015 Society for EndocrinologyDOI: 10.1530/ERC-14-0549 Printed in Great Britain
G2/M and what is postulated about the AR during mitosis
is conflicting.
In this study, we examined endogenous AR tran-
scriptional activity, protein levels, localization, and
phosphorylation during the cell cycle. We found that
for a subset of AR-dependent genes, transcription is
highest during the G1 phase of the cell cycle, reduced
during S-phase, and essentially abrogated during G2/M.
This change in transcription was not due to a reduction
in AR levels during cell cycle progression. AR localization
changes in mitotic cells compared with interphase
cells. This change in AR localization and reduction in
transactivation correlated with AR phosphorylation on
S308 during mitosis. AR S308 phosphorylation occurs
during mitosis coincident with peak CDK1 activity and
pharmacological inhibition of CDK1 abrogated S308
phosphorylation. Moreover, CDK1 phosphorylated the
AR on S308 in an in vitro kinase assay. Using a
combination of phospho-S308-specific and anti-total AR
antibodies, we showed that: i) only mitotic PCa cells
express AR phosphorylated on S308; and ii) AR phos-
phorylated on S308 is excluded from chromatin. The
data reported herein indicates that AR phosphorylation
on S308 by CDK1 regulates AR localization during
mitosis. We further propose that this CDK1-mediated
change in AR localization may regulate AR transcrip-
tional activity. These observations have important
implications for understanding AR biology and elucidat-
ing possible mechanisms of PCa progression.
Materials and methods
Cell culture and treatment conditions
PCa cell lines LNCaP and C4-2 were cultured in T-Media
supplemented with 5% fetal bovine serum (FBS)
(Invitrogen). For experiments, cells were switched to
phenol-red-free RPMI supplemented with 5% charcoal-
stripped serum (CSS) (Invitrogen). PC3 and COS7 cell lines
were maintained in DMEM with 5% FBS. LHS cells were
cultured in PrEBM media supplemented with growth
factors (Lonza, Allendale, NJ, USA). RWPE-1 cells were
maintained in KLM media supplemented with pituitary
factors. The identity of our cell lines was verified by DNA
fingerprinting using commercial kits containing multiple
STR markers (DDC Medical, Fairfield, OH, USA). The cells
were synchronized in G2/M by aphidicolin-block/release
and nocodazole block: cells were treated with 2 mg/ml
aphidicolin for 24 h, washed, and treated with 50 ng/ml
Published by Bioscientifica Ltd.
Downloaded from Bioscientifica.com at 06/06/2020 07:01:54AMvia free access
En
do
crin
e-R
ela
ted
Can
cer
Research Y Koryakina et al. Cell cycle regulation ofandrogen receptor
22 :2 251
nocodazole for 16 h. For ImageStream experiments, cells
were treated with aphidicolin and released for 12 h.
Cell sorting
For protein analysis, growing cells were stained with
4 mg/ml Hoechst 3342 and collected for sorting. For RNA,
cells were treated with 1 nm DHT for 2 h, washed,
collected, and fixed in cold methanol for 20 min. Then
cells were washed with PBS and stained with 4 mg/ml
Hoechst 3342 at 4 8C O/N. The cells were sorted into cell
cycle compartments on the basis of DNA content using a
Vantage flow cytometer. The sorted cells were centrifuged
and cell pellets were subjected to lysis for protein or RNA
isolation as previously described (Gordon et al. 2010,
Whitworth et al. 2012).
qRT-PCR
qRT-PCR experiments were performed as previously
described (Gordon et al. 2010, Whitworth et al. 2012).
The primers were as follows: SNAI2, forward: 50-CTCCATCT-
GACACCTCCT-3 0, reverse: 50-ACTGTAGTCTTTCCTCTT-
CATC-3 0; SGK1, forward: 5 0-GGATGGGTCTGAACGAC
TTT-3 0, reverse: 5 0-GAAGGACTTGGTGGAGGAGA-3 0;
UBE2C, forward: 50-TGGTCTGCCCTGTATGATGT-30, rev-
erse: 50-AAAAGCTGTGGGGTTTTTCC-30; PSMB6, forward:
50-CAAACTGCACGGCCATGATA-30, reverse: 50-GAGGCA-
TTCACTCCAGACTGG-30; GUS, forward: 50-CTCATTTGGA-
ATTTTGCCGATT-30, reverse: 50-CCGAGTGAAGATCCCCT-
TTTTA-30. The expression levels of analyzed genes were
normalized to those of the housekeeping genes proteasome
subunit beta type-6 (PSMB6) and beta-glucuronidase (GUS).
Flow cytometry
For flow cytometry experiments using anti-phospho
Histone-H3 (Cell Signaling, Danvers, MA, USA) and
anti-AR antibodies, cells were fixed in freshly prepared 4%
(w/v) paraformaldehyde (PFA), pH 7.2, for 15 min and then
permeabilized with cold methanol for 20 min. The cells
were blocked using a blocking buffer containing 5% goat
serum and then incubated with mix of mouse anti-phospho
Histone-H3 (Cell Signaling) and rabbit anti-AR (antigen,
first 20 N-terminal amino acids (Gordon et al. 2010))
primary antibodies followed by separate incubations with
mix of secondary goat fluorescein (FITC)-conjugated anti-
mouse antibody (Jackson ImmunoResearch, West Grove,
PA, USA) and goat R-phycoerythrin (PE)-conjugated anti-
rabbit antibody (Invitrogen, Molecular Probes). The
http://erc.endocrinology-journals.org q 2015 Society for EndocrinologyDOI: 10.1530/ERC-14-0549 Printed in Great Britain
alternative anti-AR antibody used in flow cytometry studies
was mouse antibody from BD Pharmingen (part of BD
Biosciences, San Jose, CA, USA). DNA was stained with
TO-PRO3 iodide (Invitrogen). Primary rabbit anti-
phospho-S308 antibody was from Santa Cruz. Data were
collected using a BD FACSCalibur flow cytometer (BD
Biosciences). FITC and PE fluorescence was detected in the
FL1 and FL2 channels, respectively, and TO-PRO-3 fluor-
escence was detected in the FL4 channel, with CellQUEST
Pro Software (Becton–Dickinson, Franklin Lakes, NJ, USA).
Data were analyzed using FlowJo 8.6.6 Software. For the
ImageStream experiments, samples were stained similarly
as for flow cytometry and imaged on an ImageStream
imaging cytometer (Amnis, EMD Millipore, Billerica, MA,
USA ) with data analysis using IDEAS 4.0 Software.
Fluorescence microscopy
For indirect immunofluorescence microscopy, cells were
grown on glass coverslips in six-well dishes, treated with
50 ng/ml nocodazole for 16 h, and fixed in freshly
prepared 4% PFA for 20 min. The samples were rinsed
with PBS, blocked and permeabilized in blocking/antibody
dilution buffer containing 5%-normal goat serum and
0.3%-Triton X in PBS for 1 h. The samples were incubated
with anti-AR or anti-phospho-S308 AR primary antibodies
followed by secondary goat Alexa Flour 594-conjugated
anti-rabbit (Invitrogen, Molecular Probes) or secondary
goat FITC-conjugated anti-mouse antibody (Jackson
ImmunoResearch). Anti-AR antibodies used were a rabbit
antibody developed against the N-terminal domain
(Gordon et al. 2010), and mouse antibodies from Santa
Cruz (AR441) and BD Pharmingen. Optimal dilutions of
the antibodies were determined in titration experiments.
The samples were mounted in Vectashield mounting
medium containing 4’,6-diamidino-2-phenylindole
(DAPI) for nuclear staining (Vector Laboratories, Inc.,
Burlingame, CA, USA) and visualized by confocal
microscopy using the LSM510. A Zeiss Plan-Apo 40!
1.40 NA oil immersion objective was used for image
acquisition. Co-localization of AR and DNA was quantified
by calculating the percentage of signal overlap as
described previously (Koryakina et al. 2012).
In vitro kinase assay and western blots
The in vitro kinase assays and western blots were performed
as described previously (Gordon et al. 2010, Whitworth
et al. 2012) and analyzed using an Odyssey (Licor, Lincoln,
NE, USA) imaging system.
Published by Bioscientifica Ltd.
Downloaded from Bioscientifica.com at 06/06/2020 07:01:54AMvia free access
En
do
crin
e-R
ela
ted
Can
cer
Research Y Koryakina et al. Cell cycle regulation ofandrogen receptor
22 :2 252
Statistical methods
Differences between groups were analyzed using one-way
ANOVA. Where multiple groups were compared using
ANOVA, a post hoc Tukey’s test was used to enable multiple
comparisons between groups.
Results
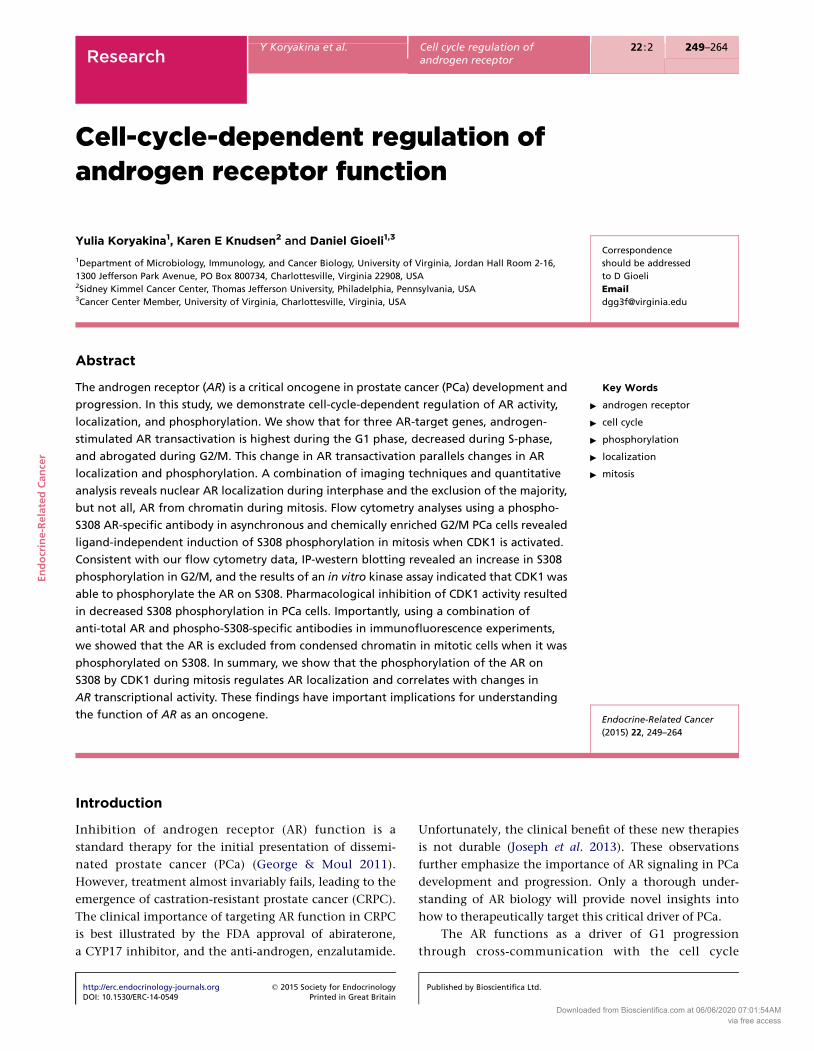
AR transcriptional activity changes during the cell cycle
AR transactivation of endogenous genes was assessed by
performing qRT-PCR analyses of the AR target genes
TMPRSS2, SGK1, and SNAI2 of LNCaP cells sorted into the
G1, S-early, S-late, and G2/M cell cycle compartments.
LNCaP cells were sorted on the basis of DNA content
(Fig. 1A). We found that androgen-dependent transcription
decreases at these AR target genes during the cell cycle
(Fig. 1). Transcription of SGK (SGK1), SNAI2, and TMPRSS2
increased in response to DHT with the greatest induction
during G1, decreased during S-phase, and for SGK1 and
SNAI2, it was essentially abrogated in G2/M. This decrease in
transcription was not due to a global effect on transcription;
UBE2C, which encodes a ubiquitin-conjugating ligase
necessary for degradation of mitotic cyclins, demonstrated
the inverse pattern of expression where UBE2C expression
was minimal in G1, increased in S-phase, and showed the
highest levels of expression in G2/M, consistent with
its function in mitosis (Fig. 1E). In addition, the expression
0123456789
A
SORT 122007-PRESORT
H33342 BLUE-A
G1
50
0
25
50
75
Cou
nt
100
125
100 150 200 250(× 1000)
S-early S-late G2
001
E
Rel
ativ
e ex
pres
sion
Rel
ativ
e ex
pres
sion
Rel
ativ
e ex
pres
sion
0
1
2
3
4
5B
G1 S-ear
(–)
(–) (–)(–) (–) (–) (–)
(–)(+) (
G1 S-ear(+) (
1 nM DHT
Cell cycle
1 nM DHTCell cycle
1 nM DHTCell cycle G1 G2/MS-early S-late
(+) (+) (+) (+)0
1.0
2.0
3.0
0.5
1.5
2.5
TMPRSS2D
Figure 1
Regulation of AR target genes during the cell cycle. LNCaP cells were grown
in T-Media supplemented with 5% FBS. Media was switched to phenol-
red-free RPMI with 5% CSS. The cells were treated with either 1 nm DHT
or vehicle, fixed, stained with Hoechst 3342, and sorted into cell cycle
compartments by flow cytometry on the basis of DNA content.
The expression of AR target genes in different cell cycle compartments was
analyzed by qRT-PCR after cell sorting. (A) Histogram shows gating on
http://erc.endocrinology-journals.org q 2015 Society for EndocrinologyDOI: 10.1530/ERC-14-0549 Printed in Great Britain
of the housekeeping gene PSMB6 encoding the proteasome
subunit, beta type 6 (and the housekeeping gene GUS, data
not shown) did not change during the cell cycle (Fig. 1F).
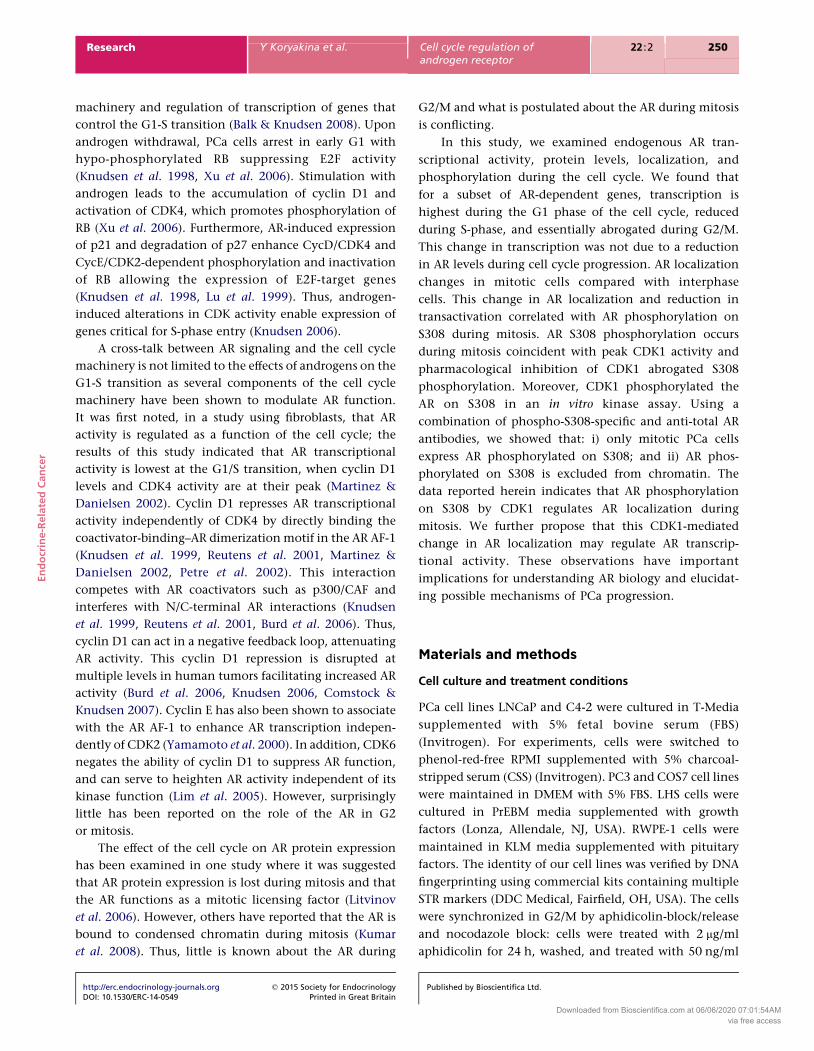
AR levels do not change during the cell cycle
We initially proposed the hypothesis that the change in AR
transcriptional activity could be due to changes in AR levels
during the cell cycle because a results from a previous study
indicated that the AR is degraded during mitosis (Litvinov
et al. 2006). We performed a series of flow cytometry
experiments using two different anti-AR antibodies target-
ing different epitopes. To distinguish cell cycle compart-
ments, DNA was stained with TO-PRO3. Histone H3
phosphorylation on Ser10 is necessary for chromosome
condensation during mitosis (Van Hooser et al. 1998) and
was used as a mitotic marker in our studies. Dual-
parametric analysis of AR fluorescence and DNA fluor-
escence did not reveal differences in the AR levels during
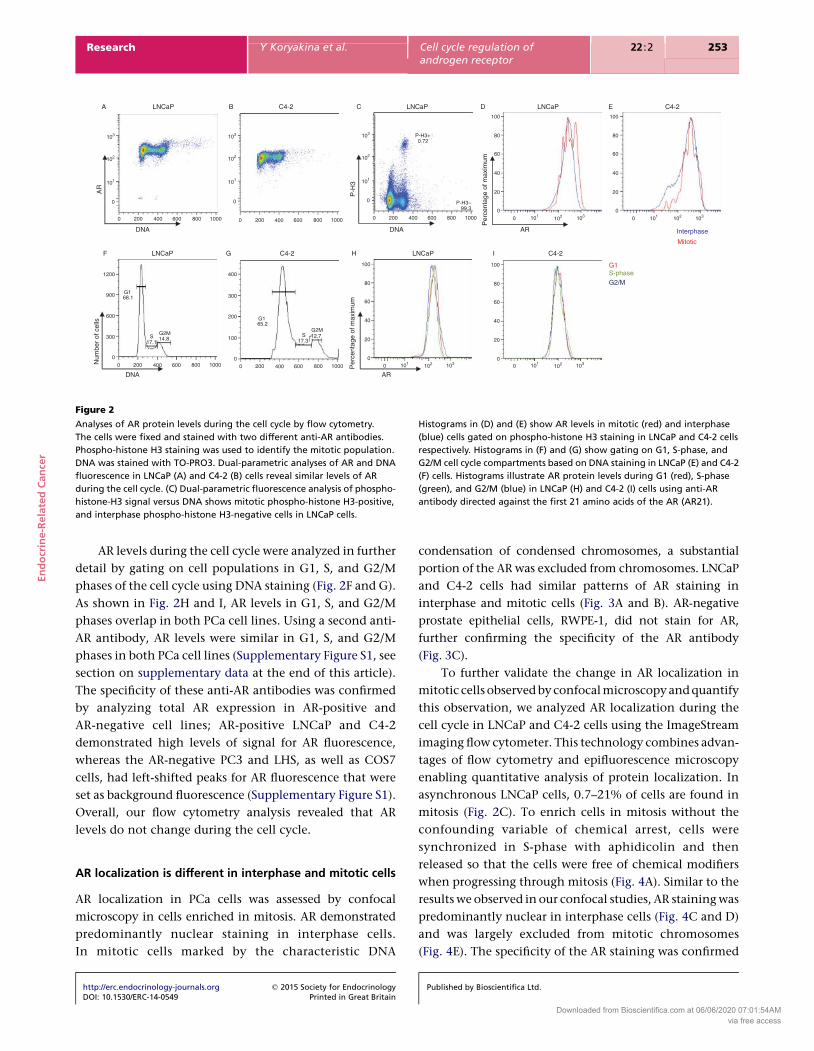
the cell cycle in LNCaP and C4-2 cells (Fig. 2A and B).
Gating on mitotic phospho-histone H3-positive and
interphase phospho-histone H3-negative populations to
analyze AR levels in mitotic and interphase cells (Fig. 2C),
we found that w0.7–1% of asynchronous LNCaP cells
expressed phospho-histone H3. AR levels in interphase
and mitotic cells were very similar as shown in Fig. 2D and E
for LNCaP and C4-2 cells respectively.
0
1
2
UBE2C F
SGK1
Rel
ativ
e ex
pres
sion
Rel
ativ
e ex
pres
sion
G2/Mly S-late
(–) (–) (–) (–) (–) (–)
(–) (–) (–) (–) (–) (–)+) (+) (+)0
1
2
3
4
5
6
7SNAI2C
G1 G2/MS-early S-late
(+) (+) (+) (+)
PSMB6
G2/Mly S-late+) (+) (+)
G1 G2/MS-early S-late(+) (+) (+) (+)1 nM DHT
Cell cycle
1 nM DHT
Cell cycle
cell cycle compartments during flow sorting on the basis of DNA content.
AR-dependent genes SGK1 (B), SNAI2 (C), and TMPRSS2 (D) showed cell-
cycle-specific regulation. (E) Transcription of UBE2C was increased during
G2/M and was not changed in response to DHT. (F) Transcription of the
housekeeping gene PSMB6 was uniform throughout the cell cycle.
A full colour version of this figure is available at http://dx.doi.org/10.1530/
ERC-14-0549.
Published by Bioscientifica Ltd.
Downloaded from Bioscientifica.com at 06/06/2020 07:01:54AMvia free access
G1S-phaseG2/M
DNA
Num
ber
of c
ells
AR
LNCaP C4-2 H IGF
DNA
LNCaP C4-2
AR
AR
Interphase
Mitotic
DNA
Per
cent
age
of m
axim
um
Per
cent
age
of m
axim
umP
-H3
C4-2LNCaPLNCaP LNCaPC4-2 EA C DB
103
102
101
0
0 200 400 600 800 1000
0
0
300
600
900 G1
G2MG2M
G165.2
S17.3
12.7S17.1
14.8
68.1
1200 400
100
80
60
40
20
0
100
80
60
40
20
0
300
200
100
0200 400 600 800 1000 0 200 400 600 800 1000
103
102
101
0
0 200 400 600 800 1000
103
100
80
60
40
20
0
100
80
60
40
20
0
0
P-H3+0.72
P-H3–99.3
102
101
103102101
0 1031021010 103102101
0 103102101
0
0 200 400 600 800 1000
Figure 2
Analyses of AR protein levels during the cell cycle by flow cytometry.
The cells were fixed and stained with two different anti-AR antibodies.
Phospho-histone H3 staining was used to identify the mitotic population.
DNA was stained with TO-PRO3. Dual-parametric analyses of AR and DNA
fluorescence in LNCaP (A) and C4-2 (B) cells reveal similar levels of AR
during the cell cycle. (C) Dual-parametric fluorescence analysis of phospho-
histone-H3 signal versus DNA shows mitotic phospho-histone H3-positive,
and interphase phospho-histone H3-negative cells in LNCaP cells.
Histograms in (D) and (E) show AR levels in mitotic (red) and interphase
(blue) cells gated on phospho-histone H3 staining in LNCaP and C4-2 cells
respectively. Histograms in (F) and (G) show gating on G1, S-phase, and
G2/M cell cycle compartments based on DNA staining in LNCaP (E) and C4-2
(F) cells. Histograms illustrate AR protein levels during G1 (red), S-phase
(green), and G2/M (blue) in LNCaP (H) and C4-2 (I) cells using anti-AR
antibody directed against the first 21 amino acids of the AR (AR21).
En
do
crin
e-R
ela
ted
Can
cer
Research Y Koryakina et al. Cell cycle regulation ofandrogen receptor
22 :2 253
AR levels during the cell cycle were analyzed in further
detail by gating on cell populations in G1, S, and G2/M
phases of the cell cycle using DNA staining (Fig. 2F and G).
As shown in Fig. 2H and I, AR levels in G1, S, and G2/M
phases overlap in both PCa cell lines. Using a second anti-
AR antibody, AR levels were similar in G1, S, and G2/M
phases in both PCa cell lines (Supplementary Figure S1, see
section on supplementary data at the end of this article).
The specificity of these anti-AR antibodies was confirmed
by analyzing total AR expression in AR-positive and
AR-negative cell lines; AR-positive LNCaP and C4-2
demonstrated high levels of signal for AR fluorescence,
whereas the AR-negative PC3 and LHS, as well as COS7
cells, had left-shifted peaks for AR fluorescence that were
set as background fluorescence (Supplementary Figure S1).
Overall, our flow cytometry analysis revealed that AR
levels do not change during the cell cycle.
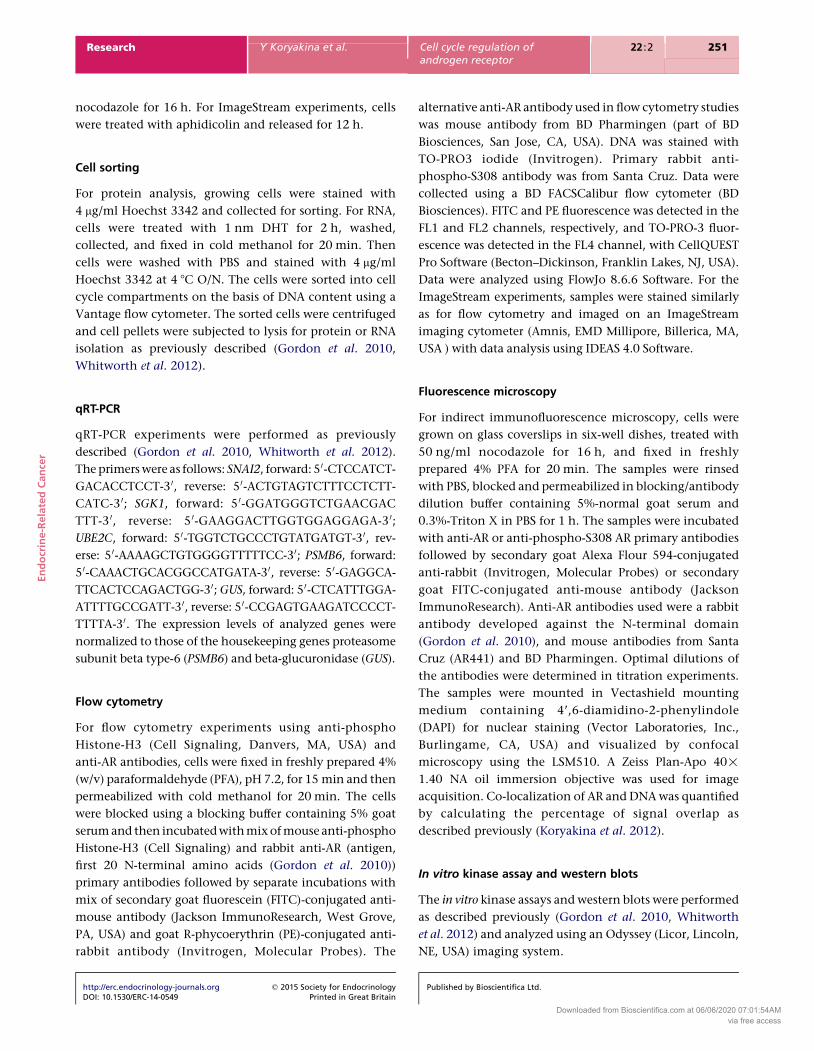
AR localization is different in interphase and mitotic cells
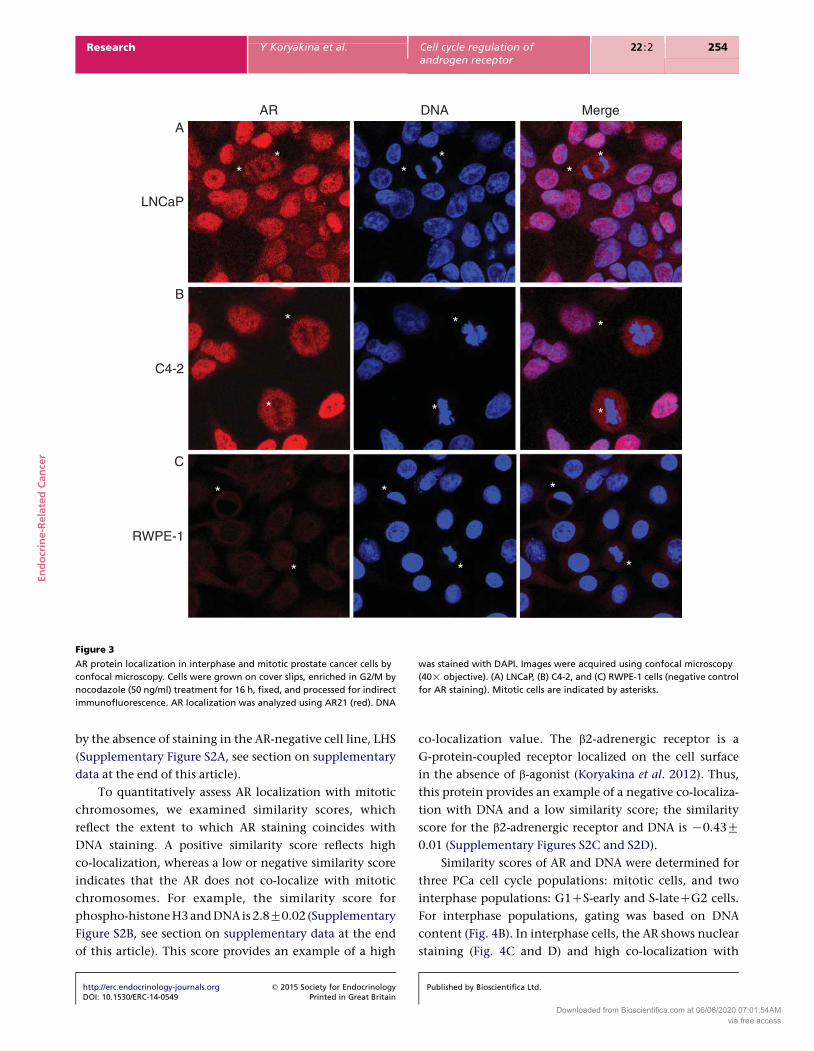
AR localization in PCa cells was assessed by confocal
microscopy in cells enriched in mitosis. AR demonstrated
predominantly nuclear staining in interphase cells.
In mitotic cells marked by the characteristic DNA
http://erc.endocrinology-journals.org q 2015 Society for EndocrinologyDOI: 10.1530/ERC-14-0549 Printed in Great Britain
condensation of condensed chromosomes, a substantial
portion of the AR was excluded from chromosomes. LNCaP
and C4-2 cells had similar patterns of AR staining in
interphase and mitotic cells (Fig. 3A and B). AR-negative
prostate epithelial cells, RWPE-1, did not stain for AR,
further confirming the specificity of the AR antibody
(Fig. 3C).
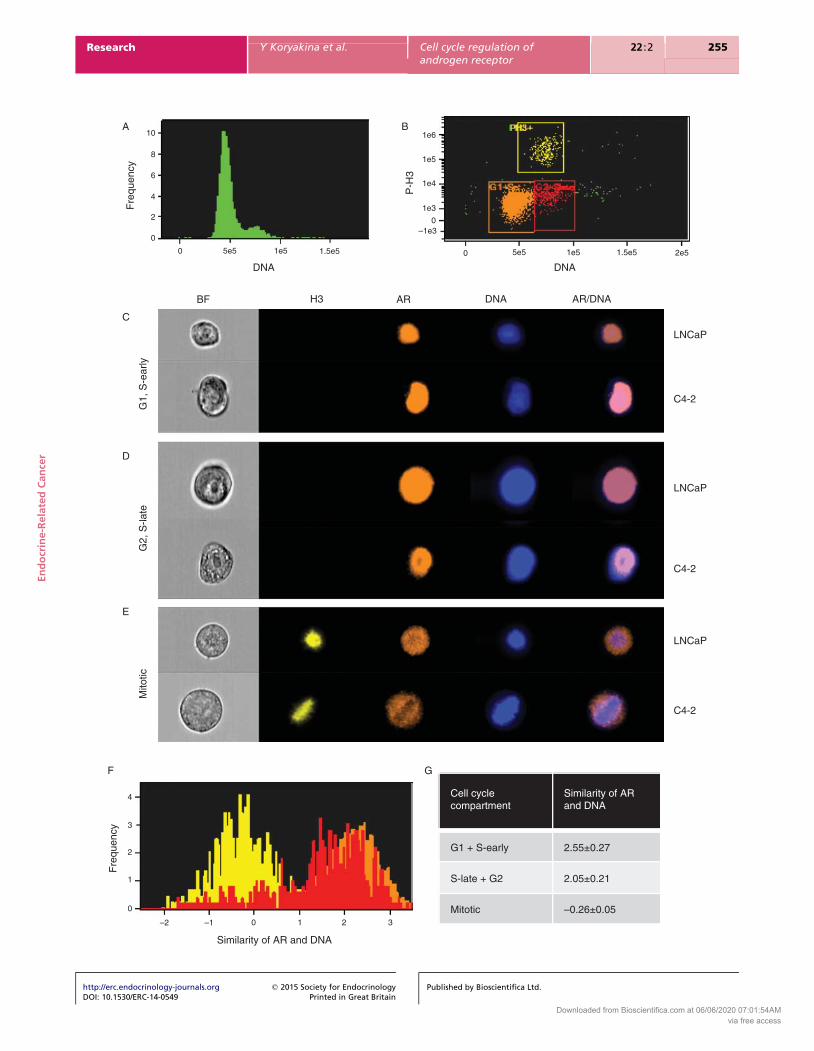
To further validate the change in AR localization in
mitotic cells observed by confocal microscopy and quantify
this observation, we analyzed AR localization during the
cell cycle in LNCaP and C4-2 cells using the ImageStream
imaging flow cytometer. This technology combines advan-
tages of flow cytometry and epifluorescence microscopy
enabling quantitative analysis of protein localization. In
asynchronous LNCaP cells, 0.7–21% of cells are found in
mitosis (Fig. 2C). To enrich cells in mitosis without the
confounding variable of chemical arrest, cells were
synchronized in S-phase with aphidicolin and then
released so that the cells were free of chemical modifiers
when progressing through mitosis (Fig. 4A). Similar to the
results we observed in our confocal studies, AR staining was
predominantly nuclear in interphase cells (Fig. 4C and D)
and was largely excluded from mitotic chromosomes
(Fig. 4E). The specificity of the AR staining was confirmed
Published by Bioscientifica Ltd.
Downloaded from Bioscientifica.com at 06/06/2020 07:01:54AMvia free access
**
*
*
A
B
C
AR DNA Merge
*
C4-2
LNCaP
RWPE-1
**
**
*
*
*
*
*
*
*
*
*
Figure 3
AR protein localization in interphase and mitotic prostate cancer cells by
confocal microscopy. Cells were grown on cover slips, enriched in G2/M by
nocodazole (50 ng/ml) treatment for 16 h, fixed, and processed for indirect
immunofluorescence. AR localization was analyzed using AR21 (red). DNA
was stained with DAPI. Images were acquired using confocal microscopy
(40! objective). (A) LNCaP, (B) C4-2, and (C) RWPE-1 cells (negative control
for AR staining). Mitotic cells are indicated by asterisks.
En
do
crin
e-R
ela
ted
Can
cer
Research Y Koryakina et al. Cell cycle regulation ofandrogen receptor
22 :2 254
by the absence of staining in the AR-negative cell line, LHS
(Supplementary Figure S2A, see section on supplementary
data at the end of this article).
To quantitatively assess AR localization with mitotic
chromosomes, we examined similarity scores, which
reflect the extent to which AR staining coincides with
DNA staining. A positive similarity score reflects high
co-localization, whereas a low or negative similarity score
indicates that the AR does not co-localize with mitotic
chromosomes. For example, the similarity score for
phospho-histone H3 and DNA is 2.8G0.02 (Supplementary
Figure S2B, see section on supplementary data at the end
of this article). This score provides an example of a high
http://erc.endocrinology-journals.org q 2015 Society for EndocrinologyDOI: 10.1530/ERC-14-0549 Printed in Great Britain
co-localization value. The b2-adrenergic receptor is a
G-protein-coupled receptor localized on the cell surface
in the absence of b-agonist (Koryakina et al. 2012). Thus,
this protein provides an example of a negative co-localiza-
tion with DNA and a low similarity score; the similarity
score for the b2-adrenergic receptor and DNA is K0.43G
0.01 (Supplementary Figures S2C and S2D).
Similarity scores of AR and DNA were determined for
three PCa cell cycle populations: mitotic cells, and two
interphase populations: G1CS-early and S-lateCG2 cells.
For interphase populations, gating was based on DNA
content (Fig. 4B). In interphase cells, the AR shows nuclear
staining (Fig. 4C and D) and high co-localization with
Published by Bioscientifica Ltd.
Downloaded from Bioscientifica.com at 06/06/2020 07:01:54AMvia free access
LNCaP
C4-2
Cell cyclecompartment
Similarity of ARand DNA
G1 + S-early 2.55±0.27
S-late + G2 2.05±0.21
Mitotic –0.26±0.05
Fre
quen
cy
Fre
quen
cy
P-H
3
Similarity of AR and DNA
A B
LNCaP
C4-2
BF H3 AR DNA AR/DNA
G1,
S-e
arly
Mito
ticG
2, S
-late
C
LNCaP
C4-2
D
E
F G
DNADNA
10
8
6
4
2
0
4
3
2
1
0
–2 –1 0 1 2 3
0 5e5 1e5 1.5e5 5e5 1e5 1.5e5 2e5
1e6
1e5
1e4
1e3
–1e30
0
En
do
crin
e-R
ela
ted
Can
cer
Research Y Koryakina et al. Cell cycle regulation ofandrogen receptor
22 :2 255
http://erc.endocrinology-journals.org q 2015 Society for EndocrinologyDOI: 10.1530/ERC-14-0549 Printed in Great Britain
Published by Bioscientifica Ltd.
Downloaded from Bioscientifica.com at 06/06/2020 07:01:54AMvia free access
En
do
crin
e-R
ela
ted
Can
cer
Research Y Koryakina et al. Cell cycle regulation ofandrogen receptor
22 :2 256
DNA. The two interphase populations had similarity
scores of 2.55G0.27 and 2.05G0.21 for G1CS-early and
S-lateCG2 respectively (Fig. 4F and G). These values are
close to the similarity score for the positive control,
phospho-histone H3 (2.8G0.02). For the G1CS-early
population, 98.8% of the cells showed AR co-localization
with DNA while the S-lateCG2 population showed
88.8%; this reduced percentage is probably due to the
redistribution of the AR from chromatin occurring in
late G2 as cells are entering mitosis. In mitotic cells, the
similarity score of the AR and DNA was strongly left-
shifted in 95.6% of the cells, yielding a negative similarity
score of K0.26G0.05 (Fig. 4F and G). This similarity score
of the AR and mitotic chromosomes was similar to that
of the negative control, b2-adrenergic receptor (Supple-
mentary Figure S2C). Similar data were obtained with
C4-2 cells (not shown). These results indicate that AR
localization changes in mitotic when compared with
interphase cells. In interphase cells, the AR is nuclear
and co-localized with DNA whereas in mitotic cells the
AR is predominately excluded from chromosomes (Fig. 4).
We next quantified the AR fluorescence intensity
during each stage of mitosis to examine AR levels. The
variation in AR fluorescence intensity for each stage of
mitosis was only 5% from the AR fluorescence intensity
of all mitotic cells. This indicates that AR levels do not
change during mitosis and validates our previous obser-
vations that AR levels do not change during the cell cycle
(Fig. 2 and Supplementary Figure S1).
Hormone does not affect AR localization in mitosis
The effects of a hormone on AR localization during mitosis
was assessed. LNCaP and C4-2 cells were treated with 1 nM
DHT for 2 h and analyzed by ImageStream. In both cell
lines, DHT treatment for 2 h did not significantly affect AR
localization relative to DNA in mitotic cells. All P values
were O0.05 for all comparisons of AR and DNA co-loca-
lization in untreated versus hormone treated populations;
Figure 4
AR localization is different in interphase and mitotic prostate cancer cells.
LNCaP cells were enriched in mitosis by aphidicolin block-release: cells were
treated with aphidicolin for 24 h, washed, and released for 12 h. Cells were
fixed, stained for total AR, phospho-histone-H3, and DNA, and analyzed by
using ImageStream. (A) Histogram showing cell cycle profile for LNCaP cells
subjected to analysis. (B) Dual-parameter fluorescence analysis of phospho-
histone H3 and DNA showing gating strategy for isolating cell cycle
populations based on DNA content and the presence of the mitotic marker.
Yellow: phospho-histone-H3-positive mitotic cells; red and orange:
phospho-histone-H3-negative cells; orange: G1 and S early; and red: S late
and G2/M. (C, D, and E) Representative images of LNCaP and C4-2 cells in
http://erc.endocrinology-journals.org q 2015 Society for EndocrinologyDOI: 10.1530/ERC-14-0549 Printed in Great Britain
PZ0.56 for (K) versus (C) DHT in Mitotic LNCaP; PZ0.86
for (K) versus (C) DHT in Mitotic C4-2 (Supplementary
Figure S3, see section on supplementary data at the end
of this article).
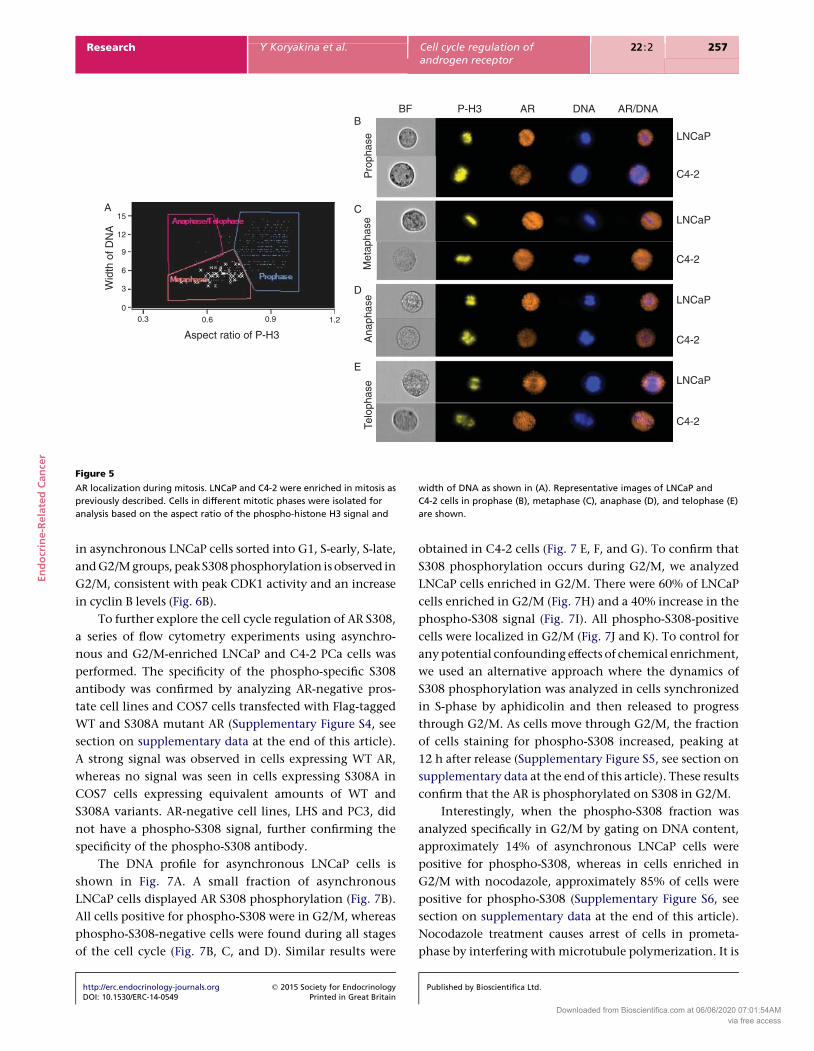
AR is excluded from chromosomes during all phases
of mitosis
Our data presented above indicates that AR protein levels are
preserved during mitosis and that AR localization changes
leading to AR exclusion from DNA. To analyze this further,
we examined AR localization during all phases of mitosis. To
isolate cells in specificphasesof mitosis weused an algorithm
that analyzes the shape of condensed chromosomes
(Guttinger et al. 2009). The cells in different mitotic phases:
prophase, metaphase, anaphase, and telophase, were
isolated on the basis of the relationship between the width
of chromosomes and the aspect ratio (ratio of width to
length)of the phospho-histoneH3signal (Fig. 5A). Although
the majority of mitotic cells were either in prophase or
metaphase, we were able to isolate cells in all mitotic phases,
including anaphaseand telophase (Fig. 5B,C,D,andE). In all
mitotic phases, theARwas presentandlargely excluded from
DNA. These results further indicate that during mitosis the
AR is predominately excluded from mitotic chromosomes.
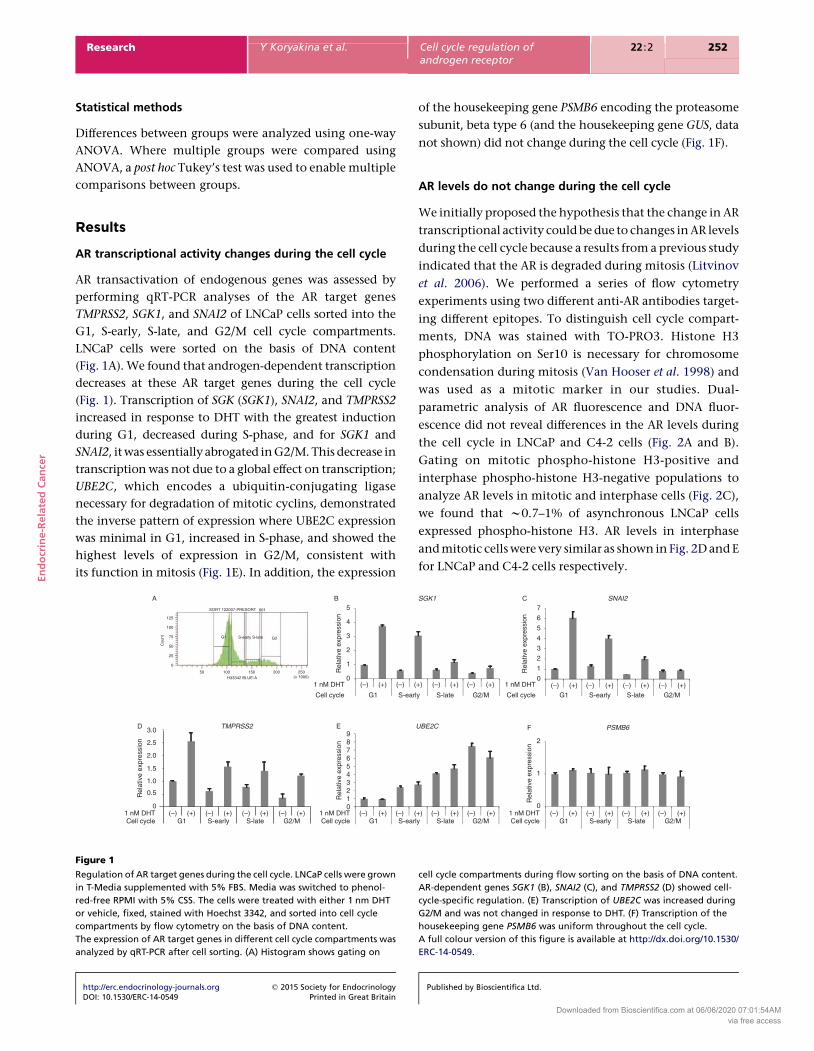
AR is phosphorylated on S308 in mitosis
The AR is phosphorylated at multiple sites with different
functional consequences, including regulation of AR local-
ization (Koryakina et al. 2014). CDK1 is activated during
mitosis, associates with the AR (Chen et al. 2006, Gordon
et al. 2010) and regulates AR S81 phosphorylation (Chen
et al. 2006, 2012). In addition to S81, the AR sequence
contains multiple CDK1 consensus phosphorylation sites
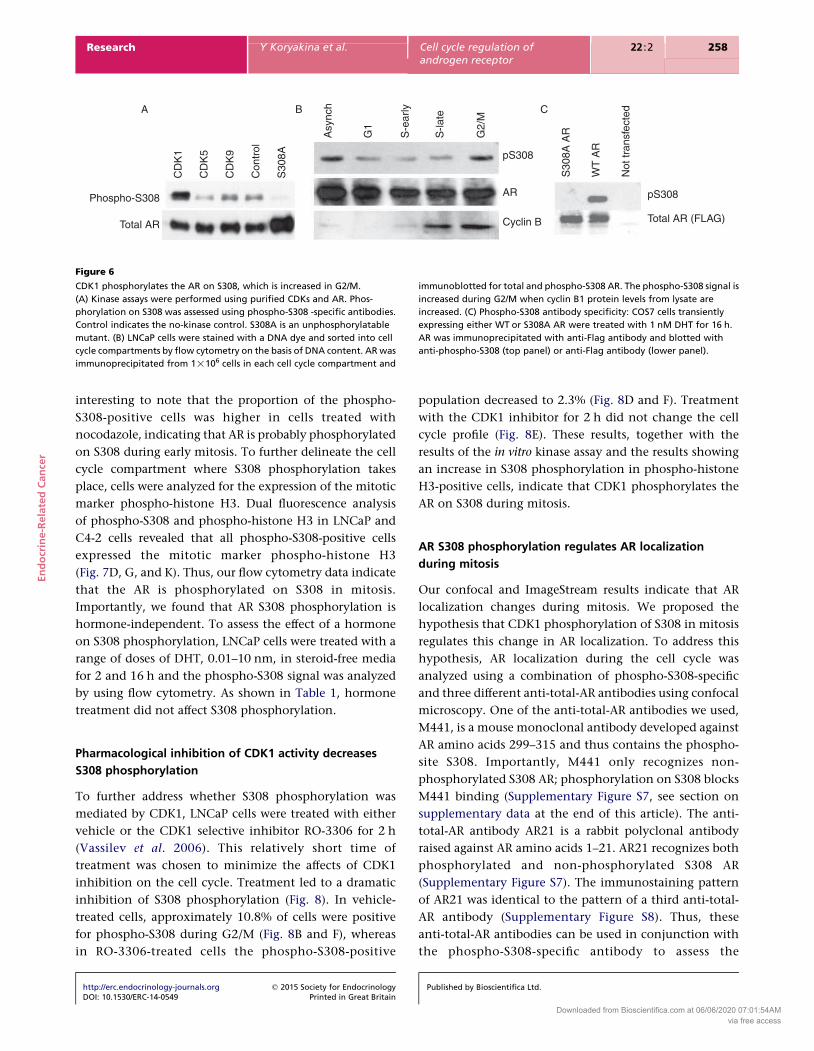
including a full site at S308. To directly test whether CDK1
can phosphorylate the AR on S308, we performed an in vitro
kinase assay. CDK1, but not CDK5 or CDK9, phosphorylates
AR S308 (Fig. 6A). When S308 phosphorylation is examined
each cell cycle compartment are shown. Note that only mitotic cells are
positive for phospho histone-H3. (F) Representative graphical illustration
of AR and DNA similarity scores in three populations: mitotic, G1 and
S early, and S late, and G2 cells. Color-coding is as in B. (G) Table showing
similarity scores of AR and DNA in cell cycle compartments. Values shown
are meanGS.E.M. from four independent experiments. The similarity scores
are significantly different for G1CS early and mitotic populations
(PZ0.0002) and S late CG2 and mitotic populations (PZ0.0002). Similarity
scores for G1CS early and S late CG2 are not significantly different
(PZ0.24). Post hoc Tukey’s test was used.
Published by Bioscientifica Ltd.
Downloaded from Bioscientifica.com at 06/06/2020 07:01:54AMvia free access
A15
12
9
6
3
00.3 0.6 0.9 1.2
LNCaP
C4-2
LNCaP
C4-2
BF P-H3 AR DNA AR/DNA
Pro
phas
e
C
D
E
Wid
th o
f DN
A
Aspect ratio of P-H3 Ana
phas
eM
etap
hase
Telo
phas
e
LNCaP
C4-2
LNCaP
C4-2
B
Figure 5
AR localization during mitosis. LNCaP and C4-2 were enriched in mitosis as
previously described. Cells in different mitotic phases were isolated for
analysis based on the aspect ratio of the phospho-histone H3 signal and
width of DNA as shown in (A). Representative images of LNCaP and
C4-2 cells in prophase (B), metaphase (C), anaphase (D), and telophase (E)
are shown.
En
do
crin
e-R
ela
ted
Can
cer
Research Y Koryakina et al. Cell cycle regulation ofandrogen receptor
22 :2 257
in asynchronous LNCaP cells sorted into G1, S-early, S-late,
and G2/M groups, peak S308 phosphorylation is observed in
G2/M, consistent with peak CDK1 activity and an increase
in cyclin B levels (Fig. 6B).
To further explore the cell cycle regulation of AR S308,
a series of flow cytometry experiments using asynchro-
nous and G2/M-enriched LNCaP and C4-2 PCa cells was
performed. The specificity of the phospho-specific S308
antibody was confirmed by analyzing AR-negative pros-
tate cell lines and COS7 cells transfected with Flag-tagged
WT and S308A mutant AR (Supplementary Figure S4, see
section on supplementary data at the end of this article).
A strong signal was observed in cells expressing WT AR,
whereas no signal was seen in cells expressing S308A in
COS7 cells expressing equivalent amounts of WT and
S308A variants. AR-negative cell lines, LHS and PC3, did
not have a phospho-S308 signal, further confirming the
specificity of the phospho-S308 antibody.
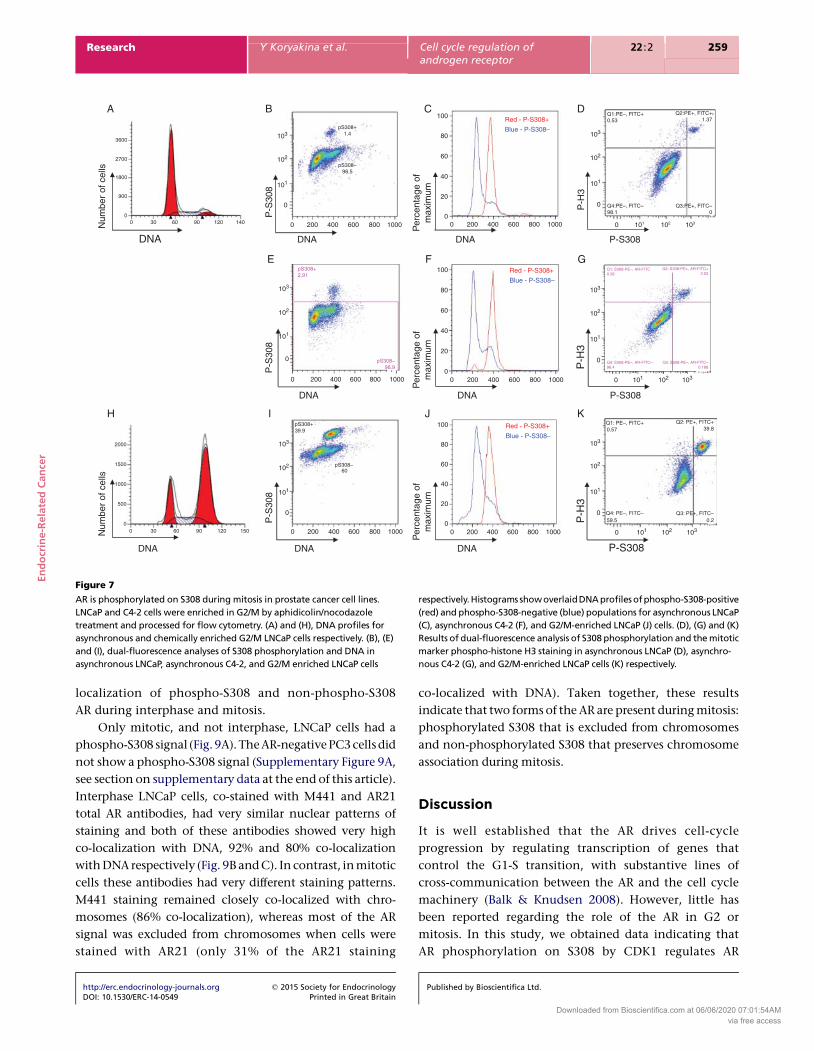
The DNA profile for asynchronous LNCaP cells is
shown in Fig. 7A. A small fraction of asynchronous
LNCaP cells displayed AR S308 phosphorylation (Fig. 7B).
All cells positive for phospho-S308 were in G2/M, whereas
phospho-S308-negative cells were found during all stages
of the cell cycle (Fig. 7B, C, and D). Similar results were
http://erc.endocrinology-journals.org q 2015 Society for EndocrinologyDOI: 10.1530/ERC-14-0549 Printed in Great Britain
obtained in C4-2 cells (Fig. 7 E, F, and G). To confirm that
S308 phosphorylation occurs during G2/M, we analyzed
LNCaP cells enriched in G2/M. There were 60% of LNCaP
cells enriched in G2/M (Fig. 7H) and a 40% increase in the
phospho-S308 signal (Fig. 7I). All phospho-S308-positive
cells were localized in G2/M (Fig. 7J and K). To control for
any potential confounding effects of chemical enrichment,
we used an alternative approach where the dynamics of
S308 phosphorylation was analyzed in cells synchronized
in S-phase by aphidicolin and then released to progress
through G2/M. As cells move through G2/M, the fraction
of cells staining for phospho-S308 increased, peaking at
12 h after release (Supplementary Figure S5, see section on
supplementary data at the end of this article). These results
confirm that the AR is phosphorylated on S308 in G2/M.
Interestingly, when the phospho-S308 fraction was
analyzed specifically in G2/M by gating on DNA content,
approximately 14% of asynchronous LNCaP cells were
positive for phospho-S308, whereas in cells enriched in
G2/M with nocodazole, approximately 85% of cells were
positive for phospho-S308 (Supplementary Figure S6, see
section on supplementary data at the end of this article).
Nocodazole treatment causes arrest of cells in prometa-
phase by interfering with microtubule polymerization. It is
Published by Bioscientifica Ltd.
Downloaded from Bioscientifica.com at 06/06/2020 07:01:54AMvia free access
A CB
Asy
nch
G1
S-e
arly
S-la
te
G2/
M
CD
K1
CD
K5
CD
K9
Con
trol
S30
8A
Phospho-S308
Total AR
pS308
AR
Cyclin B
S30
8A A
R
WT
AR
Not
tran
sfec
ted
Total AR (FLAG)
pS308
Figure 6
CDK1 phosphorylates the AR on S308, which is increased in G2/M.
(A) Kinase assays were performed using purified CDKs and AR. Phos-
phorylation on S308 was assessed using phospho-S308 -specific antibodies.
Control indicates the no-kinase control. S308A is an unphosphorylatable
mutant. (B) LNCaP cells were stained with a DNA dye and sorted into cell
cycle compartments by flow cytometry on the basis of DNA content. AR was
immunoprecipitated from 1!106 cells in each cell cycle compartment and
immunoblotted for total and phospho-S308 AR. The phospho-S308 signal is
increased during G2/M when cyclin B1 protein levels from lysate are
increased. (C) Phospho-S308 antibody specificity: COS7 cells transiently
expressing either WT or S308A AR were treated with 1 nM DHT for 16 h.
AR was immunoprecipitated with anti-Flag antibody and blotted with
anti-phospho-S308 (top panel) or anti-Flag antibody (lower panel).
En
do
crin
e-R
ela
ted
Can
cer
Research Y Koryakina et al. Cell cycle regulation ofandrogen receptor
22 :2 258
interesting to note that the proportion of the phospho-
S308-positive cells was higher in cells treated with
nocodazole, indicating that AR is probably phosphorylated
on S308 during early mitosis. To further delineate the cell
cycle compartment where S308 phosphorylation takes
place, cells were analyzed for the expression of the mitotic
marker phospho-histone H3. Dual fluorescence analysis
of phospho-S308 and phospho-histone H3 in LNCaP and
C4-2 cells revealed that all phospho-S308-positive cells
expressed the mitotic marker phospho-histone H3
(Fig. 7D, G, and K). Thus, our flow cytometry data indicate
that the AR is phosphorylated on S308 in mitosis.
Importantly, we found that AR S308 phosphorylation is
hormone-independent. To assess the effect of a hormone
on S308 phosphorylation, LNCaP cells were treated with a
range of doses of DHT, 0.01–10 nm, in steroid-free media
for 2 and 16 h and the phospho-S308 signal was analyzed
by using flow cytometry. As shown in Table 1, hormone
treatment did not affect S308 phosphorylation.
Pharmacological inhibition of CDK1 activity decreases
S308 phosphorylation
To further address whether S308 phosphorylation was
mediated by CDK1, LNCaP cells were treated with either
vehicle or the CDK1 selective inhibitor RO-3306 for 2 h
(Vassilev et al. 2006). This relatively short time of
treatment was chosen to minimize the affects of CDK1
inhibition on the cell cycle. Treatment led to a dramatic
inhibition of S308 phosphorylation (Fig. 8). In vehicle-
treated cells, approximately 10.8% of cells were positive
for phospho-S308 during G2/M (Fig. 8B and F), whereas
in RO-3306-treated cells the phospho-S308-positive
http://erc.endocrinology-journals.org q 2015 Society for EndocrinologyDOI: 10.1530/ERC-14-0549 Printed in Great Britain
population decreased to 2.3% (Fig. 8D and F). Treatment
with the CDK1 inhibitor for 2 h did not change the cell
cycle profile (Fig. 8E). These results, together with the
results of the in vitro kinase assay and the results showing
an increase in S308 phosphorylation in phospho-histone
H3-positive cells, indicate that CDK1 phosphorylates the
AR on S308 during mitosis.
AR S308 phosphorylation regulates AR localization
during mitosis
Our confocal and ImageStream results indicate that AR
localization changes during mitosis. We proposed the
hypothesis that CDK1 phosphorylation of S308 in mitosis
regulates this change in AR localization. To address this
hypothesis, AR localization during the cell cycle was
analyzed using a combination of phospho-S308-specific
and three different anti-total-AR antibodies using confocal
microscopy. One of the anti-total-AR antibodies we used,
M441, is a mouse monoclonal antibody developed against
AR amino acids 299–315 and thus contains the phospho-
site S308. Importantly, M441 only recognizes non-
phosphorylated S308 AR; phosphorylation on S308 blocks
M441 binding (Supplementary Figure S7, see section on
supplementary data at the end of this article). The anti-
total-AR antibody AR21 is a rabbit polyclonal antibody
raised against AR amino acids 1–21. AR21 recognizes both
phosphorylated and non-phosphorylated S308 AR
(Supplementary Figure S7). The immunostaining pattern
of AR21 was identical to the pattern of a third anti-total-
AR antibody (Supplementary Figure S8). Thus, these
anti-total-AR antibodies can be used in conjunction with
the phospho-S308-specific antibody to assess the
Published by Bioscientifica Ltd.
Downloaded from Bioscientifica.com at 06/06/2020 07:01:54AMvia free access
A B D
H
E G
DNA
Num
ber
of c
ells
Num
ber
of c
ells
DNA
DNA
P-S
308
P-S
308
P-S308
P-S308
P-H
3P
-H3
C
F
I K
P-S308
J
DNA
P
erce
ntag
e of
max
imum
Per
cent
age
ofm
axim
um
P-S
308
P-H
3
Per
cent
age
ofm
axim
um
Red - P-S308+
Blue - P-S308–
DNADNADNA
Red - P-S308+
Blue - P-S308–
DNA
Red - P-S308+
Blue - P-S308–
00 30 60 90 120 140
900
1800
2700
3600103
100
80
60
40
20
0
102
101
0
103
102
101
0
103
102
101
0
103
102
101
0
103
102
101
0
1031021010
1031021010
1031021010
0 200
pS308+1.4
pS308+2.91
pS308–98.5
pS308–96.9
Q1:PE–, FITC+0.53
Q1: S308-PE–, AR-FITC0.38
Q1: PE–, FITC+
Q4: PE–, FITC– Q3: PE+, FITC–0.259.5
Q2: PE+, FITC+39.80.57
Q4: S308-PE–, AR-FITC–96.4
Q3: S308-PE–, AR-FITC–0.188
Q2: S308-PE+, AR-FITC+3.03
Q4:PE–, FITC–98.1
Q3:PE+, FITC–0
Q2:PE+, FITC+1.37
400 600 800 1000
0 200 400 600 800 1000
103
102
101
0
pS308+39.9
pS308–60
0 200 400 600 800 1000
0 200 400 600 800 1000
100
80
60
40
20
00 200 400 600 800 1000
100
80
60
40
20
00 200 400 600 800 1000
00 30 60 90 120 150
500
1000
1500
2000
Figure 7
AR is phosphorylated on S308 during mitosis in prostate cancer cell lines.
LNCaP and C4-2 cells were enriched in G2/M by aphidicolin/nocodazole
treatment and processed for flow cytometry. (A) and (H), DNA profiles for
asynchronous and chemically enriched G2/M LNCaP cells respectively. (B), (E)
and (I), dual-fluorescence analyses of S308 phosphorylation and DNA in
asynchronous LNCaP, asynchronous C4-2, and G2/M enriched LNCaP cells
respectively. Histograms showoverlaidDNA profiles ofphospho-S308-positive
(red) and phospho-S308-negative (blue) populations for asynchronous LNCaP
(C), asynchronous C4-2 (F), and G2/M-enriched LNCaP (J) cells. (D), (G) and (K)
Results of dual-fluorescence analysis of S308 phosphorylation and the mitotic
marker phospho-histone H3 staining in asynchronous LNCaP (D), asynchro-
nous C4-2 (G), and G2/M-enriched LNCaP cells (K) respectively.
En
do
crin
e-R
ela
ted
Can
cer
Research Y Koryakina et al. Cell cycle regulation ofandrogen receptor
22 :2 259
localization of phospho-S308 and non-phospho-S308
AR during interphase and mitosis.
Only mitotic, and not interphase, LNCaP cells had a
phospho-S308 signal (Fig.9A). TheAR-negativePC3cellsdid
not show a phospho-S308 signal (Supplementary Figure 9A,
see section on supplementary data at the end of this article).
Interphase LNCaP cells, co-stained with M441 and AR21
total AR antibodies, had very similar nuclear patterns of
staining and both of these antibodies showed very high
co-localization with DNA, 92% and 80% co-localization
with DNA respectively (Fig. 9B and C). In contrast, in mitotic
cells these antibodies had very different staining patterns.
M441 staining remained closely co-localized with chro-
mosomes (86% co-localization), whereas most of the AR
signal was excluded from chromosomes when cells were
stained with AR21 (only 31% of the AR21 staining
http://erc.endocrinology-journals.org q 2015 Society for EndocrinologyDOI: 10.1530/ERC-14-0549 Printed in Great Britain
co-localized with DNA). Taken together, these results
indicate that two forms of the AR are present during mitosis:
phosphorylated S308 that is excluded from chromosomes
and non-phosphorylated S308 that preserves chromosome
association during mitosis.
Discussion
It is well established that the AR drives cell-cycle
progression by regulating transcription of genes that
control the G1-S transition, with substantive lines of
cross-communication between the AR and the cell cycle
machinery (Balk & Knudsen 2008). However, little has
been reported regarding the role of the AR in G2 or
mitosis. In this study, we obtained data indicating that
AR phosphorylation on S308 by CDK1 regulates AR
Published by Bioscientifica Ltd.
Downloaded from Bioscientifica.com at 06/06/2020 07:01:54AMvia free access
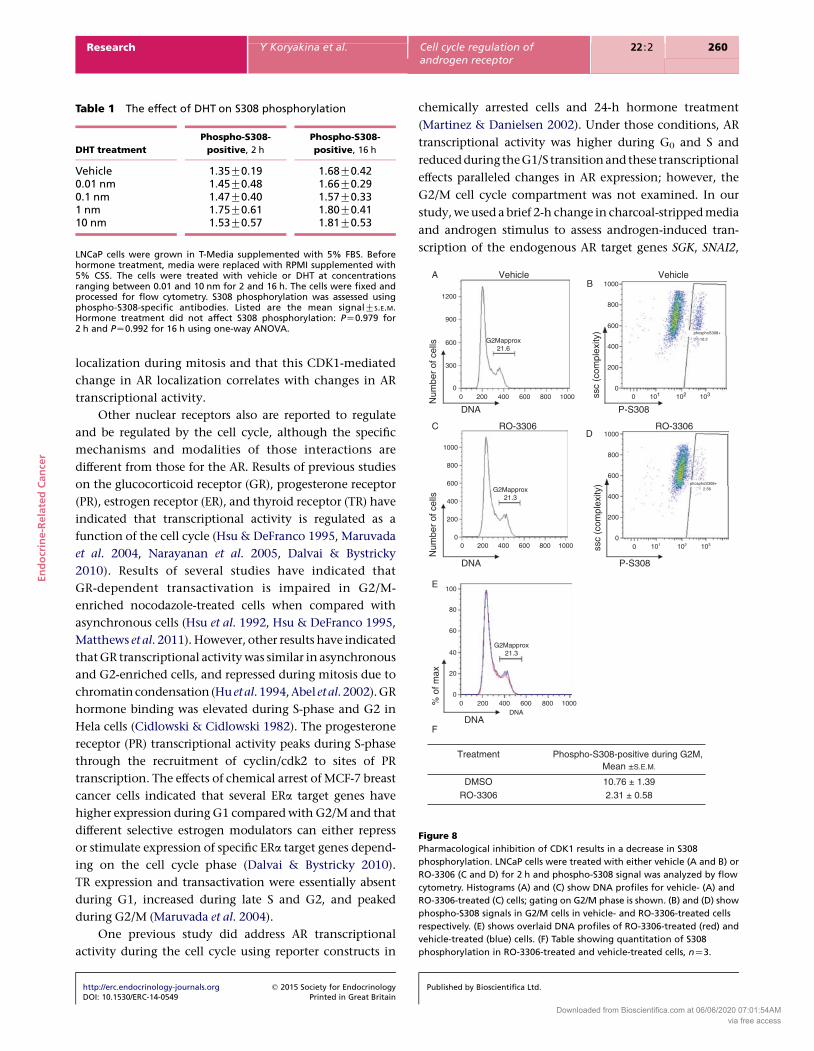
Table 1 The effect of DHT on S308 phosphorylation
DHT treatment
Phospho-S308-
positive, 2 h
Phospho-S308-
positive, 16 h
Vehicle 1.35G0.19 1.68G0.420.01 nm 1.45G0.48 1.66G0.290.1 nm 1.47G0.40 1.57G0.331 nm 1.75G0.61 1.80G0.4110 nm 1.53G0.57 1.81G0.53
LNCaP cells were grown in T-Media supplemented with 5% FBS. Beforehormone treatment, media were replaced with RPMI supplemented with5% CSS. The cells were treated with vehicle or DHT at concentrationsranging between 0.01 and 10 nm for 2 and 16 h. The cells were fixed andprocessed for flow cytometry. S308 phosphorylation was assessed usingphospho-S308-specific antibodies. Listed are the mean signalGS.E.M.Hormone treatment did not affect S308 phosphorylation: PZ0.979 for2 h and PZ0.992 for 16 h using one-way ANOVA.
Treatment Phospho-S308-positive during G2M, Mean ±S.E.M.
DMSO 10.76 ± 1.39RO-3306 2.31 ± 0.58
AB
CD
F
DNA
Num
ber
of c
ells
DNA
DNA
Num
ber
of c
ells
P-S308
ssc
(com
plex
ity)
ssc
(com
plex
ity)
P-S308
E
Vehicle
RO-3306 RO-3306
Vehicle
% o
f max
1200
1000
800
600phosphoS308+
10.2
phosphoS308+2.56
400
200
0
1000
800
600
400
200
0
0
20
40
60
80
100
1000
800
600
400
200
0
0 101 102 103
0 101 102 103
900
600
300
00 200 400
G2Mapprox21.6
G2Mapprox21.3
G2Mapprox21.3
600 800 1000
0 200 400 600 800 1000
0 200 400 600DNA
800 1000
Figure 8
Pharmacological inhibition of CDK1 results in a decrease in S308
phosphorylation. LNCaP cells were treated with either vehicle (A and B) or
RO-3306 (C and D) for 2 h and phospho-S308 signal was analyzed by flow
cytometry. Histograms (A) and (C) show DNA profiles for vehicle- (A) and
RO-3306-treated (C) cells; gating on G2/M phase is shown. (B) and (D) show
phospho-S308 signals in G2/M cells in vehicle- and RO-3306-treated cells
respectively. (E) shows overlaid DNA profiles of RO-3306-treated (red) and
vehicle-treated (blue) cells. (F) Table showing quantitation of S308
phosphorylation in RO-3306-treated and vehicle-treated cells, nZ3.
En
do
crin
e-R
ela
ted
Can
cer
Research Y Koryakina et al. Cell cycle regulation ofandrogen receptor
22 :2 260
localization during mitosis and that this CDK1-mediated
change in AR localization correlates with changes in AR
transcriptional activity.
Other nuclear receptors also are reported to regulate
and be regulated by the cell cycle, although the specific
mechanisms and modalities of those interactions are
different from those for the AR. Results of previous studies
on the glucocorticoid receptor (GR), progesterone receptor
(PR), estrogen receptor (ER), and thyroid receptor (TR) have
indicated that transcriptional activity is regulated as a
function of the cell cycle (Hsu & DeFranco 1995, Maruvada
et al. 2004, Narayanan et al. 2005, Dalvai & Bystricky
2010). Results of several studies have indicated that
GR-dependent transactivation is impaired in G2/M-
enriched nocodazole-treated cells when compared with
asynchronous cells (Hsu et al. 1992, Hsu & DeFranco 1995,
Matthews et al. 2011). However, other results have indicated
that GR transcriptional activity was similar in asynchronous
and G2-enriched cells, and repressed during mitosis due to
chromatincondensation (Hu etal. 1994,Abel etal. 2002).GR
hormone binding was elevated during S-phase and G2 in
Hela cells (Cidlowski & Cidlowski 1982). The progesterone
receptor (PR) transcriptional activity peaks during S-phase
through the recruitment of cyclin/cdk2 to sites of PR
transcription. The effects of chemical arrest of MCF-7 breast
cancer cells indicated that several ERa target genes have
higher expression during G1 compared with G2/M and that
different selective estrogen modulators can either repress
or stimulate expression of specific ERa target genes depend-
ing on the cell cycle phase (Dalvai & Bystricky 2010).
TR expression and transactivation were essentially absent
during G1, increased during late S and G2, and peaked
during G2/M (Maruvada et al. 2004).
One previous study did address AR transcriptional
activity during the cell cycle using reporter constructs in
http://erc.endocrinology-journals.org q 2015 Society for EndocrinologyDOI: 10.1530/ERC-14-0549 Printed in Great Britain
chemically arrested cells and 24-h hormone treatment
(Martinez & Danielsen 2002). Under those conditions, AR
transcriptional activity was higher during G0 and S and
reduced during theG1/S transition and these transcriptional
effects paralleled changes in AR expression; however, the
G2/M cell cycle compartment was not examined. In our
study, we used a brief 2-h change in charcoal-stripped media
and androgen stimulus to assess androgen-induced tran-
scription of the endogenous AR target genes SGK, SNAI2,
Published by Bioscientifica Ltd.
Downloaded from Bioscientifica.com at 06/06/2020 07:01:54AMvia free access
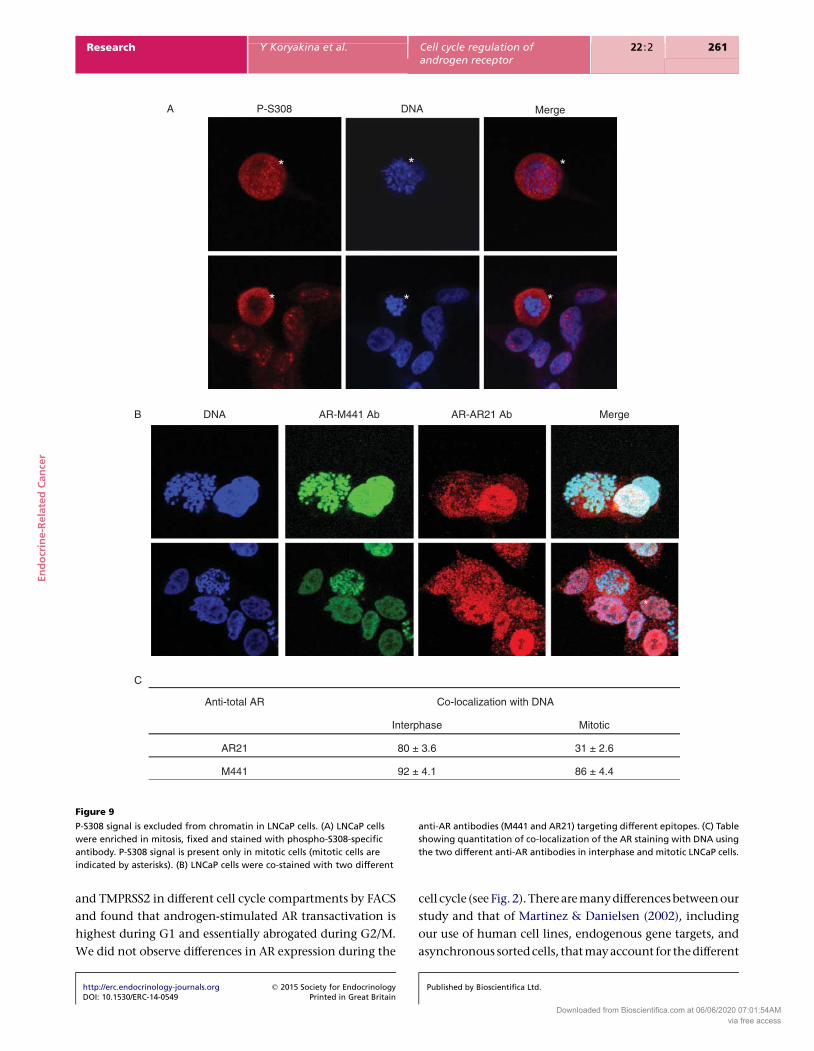
*
C
P-S308 DNA Merge
***
***
B
A
Anti-total AR Co-localization with DNA
Interphase Mitotic
AR21 80 ± 3.6 31 ± 2.6
M441 92 ± 4.1 86 ± 4.4
AR-M441 AbDNA MergeAR-AR21 Ab
Figure 9
P-S308 signal is excluded from chromatin in LNCaP cells. (A) LNCaP cells
were enriched in mitosis, fixed and stained with phospho-S308-specific
antibody. P-S308 signal is present only in mitotic cells (mitotic cells are
indicated by asterisks). (B) LNCaP cells were co-stained with two different
anti-AR antibodies (M441 and AR21) targeting different epitopes. (C) Table
showing quantitation of co-localization of the AR staining with DNA using
the two different anti-AR antibodies in interphase and mitotic LNCaP cells.
En
do
crin
e-R
ela
ted
Can
cer
Research Y Koryakina et al. Cell cycle regulation ofandrogen receptor
22 :2 261
and TMPRSS2 in different cell cycle compartments by FACS
and found that androgen-stimulated AR transactivation is
highest during G1 and essentially abrogated during G2/M.
We did not observe differences in AR expression during the
http://erc.endocrinology-journals.org q 2015 Society for EndocrinologyDOI: 10.1530/ERC-14-0549 Printed in Great Britain
cell cycle (see Fig.2).Therearemanydifferencesbetweenour
study and that of Martinez & Danielsen (2002), including
our use of human cell lines, endogenous gene targets, and
asynchronous sortedcells, thatmayaccount for thedifferent
Published by Bioscientifica Ltd.
Downloaded from Bioscientifica.com at 06/06/2020 07:01:54AMvia free access
En
do
crin
e-R
ela
ted
Can
cer
Research Y Koryakina et al. Cell cycle regulation ofandrogen receptor
22 :2 262
observations of AR levels during the cell cycle. Interestingly,
when AR localization of exogenous GFP-tagged AR in
response to hormone was examined, increased nuclear
localization was observed in G2 cells (Szafran et al. 2008).
This result indicates that AR transcriptional activity would
be highest during G2. Our study only examined a small
subset of AR target genes. To date, no published study, to our
knowledge, has examined the global cell-cycle-dependent
gene expression profile of the AR, or any other steroid
hormone receptor. Thus, the increased hormone-induced
AR nuclear localization during G2 may lead to increased
transactivation of G2-specific AR target genes.
Results of an earlier study analyzing the effect of the
cell cycle on AR protein expression indicated that AR
protein expression was lost during mitosis and that the
AR functions as a mitotic licensing factor (Litvinov et al.
2006). However, this is in contrast to the results of our
experiments reported here as well as the results of studies
by other groups showing AR expression during mitosis
(Kumar et al. 2008). In our study, we detected AR expression
throughout the cell cycle. Kumar et al. (2008) showed that
overexpression of GFP-tagged AR in COS1 cells led to
agonist-mediated docking of AR onto mitotic chromatin.
The association of AR with chromatin was dependent on
the method used for fixation/permeabilization, where one
method provided evidence of endogenous hormone-
bound AR associated with mitotic chromatin and others
showed the majority of the AR was excluded from
chromatin. In our studies, different fixation/permeabiliza-
tion methods did not reveal differences in AR localization
or phosphorylation (data not shown). In further support
of AR expression during mitosis, results of other studies
have indicated that CDK1 activity, which peaks during
G2/M, stabilizes the AR (Chen et al. 2006). One possible
explanation for the discrepancy among these reports of
AR expression during mitosis is that the AR is degraded
late in mitosis. However, using ImageStream analysis
we observed endogenous AR during all mitotic phases,
including telophase, consistent with AR expression being
maintained throughout mitosis. Another possibility is the
method used to analyze the flow cytometry data (Litvinov
et al. 2006), which could lead to alternative conclusions.
While uncommon, there is a precedent for transcription
factor association and activity during mitosis even though
chromatin favors a highly condensed state and global
transcription during mitosis is silenced (Gottesfeld & Forbes
1997). Most basal transcription factors, RNA polymerases,
and sequence-specific DNA-binding proteins and histone
modifying enzymes are absent from condensed mitotic
chromosomes. However, evidence indicates that certain
http://erc.endocrinology-journals.org q 2015 Society for EndocrinologyDOI: 10.1530/ERC-14-0549 Printed in Great Britain
transcription factors remain bound to mitotic condensed
chromosomes (Burke et al. 2005, Saradhi et al. 2005, Yan et al.
2006, Young et al. 2007). Forexample, the zinc-finger protein
CTCFandthe lineage-specific transcription factor RUNX2are
implicated in the maintenance of epigenetic marks during
mitosis (Burke et al. 2005,Young et al. 2007) and the forkhead
FoxI1 transcription factor is implicated in organization of
mitotic chromatin structure (Yan et al. 2006).
Our data are in general agreement with results of
studies of GR localization demonstrating GR nuclear
localization throughout interphase and exclusion from
the nucleus during mitosis (Hsu et al. 1992, Matthews et al.
2011). In these studies, it was suggested that recycled
GRs do not re-enter the nucleus in G2-synchronized cells
(Hsu et al. 1992). GR localization during mitosis did not
change with dexamethasone treatment, which is similar
to our finding that hormone treatment did not alter AR
localization during mitosis. Interestingly, dexametha-
sone-induced GR transactivation was blocked in G2
synchronized cells, but not in asynchronous cells,
although the number of receptors remained the same in
the two populations. This latter finding is consistent with
our observations of AR transcriptional activity decreasing
during G2/M, although AR protein levels remain
unchanged throughout the cell cycle. Interestingly, the
binding of a nuclear receptor family member pregnane
and xenobiotic receptor (PXR) to mitotic chromatin
during all mitotic phases has been reported for an over-
expression system, although the significance of that
association was not elucidated (Saradhi et al. 2005).
In this study, we show that AR phosphorylated on
S308 is excluded from chromosomes and that non-
phosphorylated S308 preserves chromosome association
during mitosis in a hormone-independent manner. AR
phosphorylation on S308 is coincident with peak CDK1
activity. Previous work performed at our laboratory and
others has collectively demonstrated that CDK1 interacts
with the AR and can phosphorylate AR S81 (Chen et al.
2006, 2012, Gordon et al. 2010) and nocodazole-arrested
cells in G2/M have elevated AR S81 phosphorylation
(Chen et al. 2006, 2012) although our results indicate that
CDK9 is the major AR S81 kinase (Gordon et al. 2010)
and it remains unclear under what biological conditions
each of the reported CDKs phosphorylate the AR on S81.
In experiments reported here we demonstrate that CDK1
phosphorylates the AR on S308 in vitro and that
pharmacological inhibition of CDK1 activity dramatically
decreases S308 phosphorylation in PCa cells. Interestingly,
even though we previously observed an increase in S308
phosphorylation in response to hormone (Gioeli et al.
Published by Bioscientifica Ltd.
Downloaded from Bioscientifica.com at 06/06/2020 07:01:54AMvia free access
En
do
crin
e-R
ela
ted
Can
cer
Research Y Koryakina et al. Cell cycle regulation ofandrogen receptor
22 :2 263
2002), a thorough analysis of S308 phosphorylation in
mitotic cells reported here indicates that S308 phosphory-
lation is hormone-independent. It is likely that the slight
increase in AR S308 phosphorylation observed during
phospho-peptide mapping studies were due to an increase
in the percentage of mitotic cells resulting from hormone
stimulation. Results of a previous study also indicated
that S308 is phosphorylated by the CDK11p58–cyclin D3
complex during G2/M leading to repression of AR
transcriptional activity (Zong et al. 2007). This is in
agreement with the results described in our earlier
publication (Gioeli et al. 2002) and parallels our obser-
vations described in this report in which AR transcrip-
tional activity decreases coincidentally with S308
phosphorylation. Interestingly, results from one study
have indicated that S308 phosphorylation correlates with
patient survival (McCall et al. 2013), which is consistent
with the results indicating that phosphorylation at this
site may reduce AR transcriptional activity.
Interestingly, the GR is also phosphorylated in a cell-
cycle-dependent manner (Matthews et al. 2011). Results
of studies of the GR indicate that G2-synchronized cells
have a distinct phosphorylation pattern compared with
asynchronous cells (Hsu et al. 1992), although comparison
of HPLC phosphopeptide maps revealed no phospho-site-
specific differences in WCL2 cells synchronized in S-phase
and G2/M (Hu et al. 1994). Overall GR phosphorylation
is increased during G2/M compared with S-phase, whereas
hormone-dependent induction is higher during S-phase
and negligible during G2/M. GR phosphorylation on S203
and S211 occurred in a ligand-independent fashion during
G2/M and ligand-independent GR transactivation
required S211 phosphorylation (Matthews et al. 2011).
Our experiments provide evidence that the cell cycle
affects AR function. On the basis of these results we propose
a model in which the AR S308 phosphorylation by CDK1
results in the AR exclusion from mitotic chromatin
thereby negatively regulating AR-dependent transcription.
Using the results of this study it is possible to begin to
integrate the complexity of cycling cells and signal
transduction by kinases with AR biology.
Supplementary data
This is linked to the online version of the paper at http://dx.doi.org/10.1530/
ERC-14-0549.
Declaration of interest
The authors declare that there is no conflict of interest that could be
perceived as prejudicing the impartiality of the research reported.
http://erc.endocrinology-journals.org q 2015 Society for EndocrinologyDOI: 10.1530/ERC-14-0549 Printed in Great Britain
Funding
Grant support: National Cancer Institute (R01 CA124706 and R01
CA178338, D Gioeli), the Paul Mellon Urologic Cancer Institute (D Gioeli),
the Farrow Fellowship (Y Koryakina), and Prostate Cancer Foundation
Challenge Award (K E Knudsen).
Acknowledgements
The authors would like the thank Dr Huy Ta and Christopher McNair for
critically reading the manuscript. They would also like to thank Joanne
Lannigan and Mike Solga of the University of Virginia Flow Cytometry Core
Facility for outstanding technical support.
References
Abel GA, Wochnik GM, Ruegg J, Rouyer A, Holsboer F & Rein T 2002
Activity of the GR in G2 and mitosis. Molecular Endocrinology 16
1352–1366. (doi:10.1210/mend.16.6.0842)
Balk SP & Knudsen KE 2008 AR, the cell cycle, and prostate cancer. Nuclear
Receptor Signaling 6 e001. (doi:10.1621/nrs.06001)
Burd CJ, Petre CE, Morey LM, Wang Y, Revelo MP, Haiman CA, Lu S,
Fenoglio-Preiser CM, Li J, Knudsen ES et al. 2006 Cyclin D1b variant
influences prostate cancer growth through aberrant androgen receptor
regulation. PNAS 103 2190–2195. (doi:10.1073/pnas.0506281103)
Burke LJ, Zhang R, Bartkuhn M, Tiwari VK, Tavoosidana G, Kurukuti S,
Weth C, Leers J, Galjart N, Ohlsson R et al. 2005 CTCF binding and
higher order chromatin structure of the H19 locus are maintained in
mitotic chromatin. EMBO Journal 24 3291–3300. (doi:10.1038/sj.
emboj.7600793)
Chen S, Xu Y, Yuan X, Bubley GJ & Balk SP 2006 Androgen receptor
phosphorylationandstabilizationinprostatecancerbycyclin-dependent
kinase 1. PNAS 103 15969–15974. (doi:10.1073/pnas.0604193103)
Chen S, Gulla S, Cai C & Balk SP 2012 Androgen receptor serine 81
phosphorylation mediates chromatin binding and transcriptional
activation. Journal of Biological Chemistry 287 8571–8583. (doi:10.1074/
jbc.M111.325290)
Cidlowski JA & Cidlowski NB 1982 Glucocorticoid receptors and the cell
cycle: evidence that the accumulation of glucocorticoid receptors during
the S phase of the cell cycle is dependent on ribonucleic acid and protein
synthesis. Endocrinology 110 1653–1662. (doi:10.1210/endo-110-5-1653)
Comstock CE & Knudsen KE 2007 The complex role of AR signaling after
cytotoxic insult: implications for cell-cycle-based chemotherapeutics.
Cell Cycle 6 1307–1313. (doi:10.4161/cc.6.11.4353)
Dalvai M & Bystricky K 2010 Cell cycle and anti-estrogen effects synergize
to regulate cell proliferation and ER target gene expression. PLoS ONE 5
e11011. (doi:10.1371/journal.pone.0011011)
George D & Moul JW 2011 Emerging treatment options for patients with
castration-resistant prostate cancer. Prostate 72 338–349. (doi:10.1002/
pros.21435)
Gioeli D, Ficarro SB, Kwiek JJ, Aaronson D, Hancock M, Catling AD,
White FM, Christian RE, Settlage RE, Shabanowitz J et al. 2002
Androgen receptor phosphorylation. Regulation and identification of
the phosphorylation sites. Journal of Biological Chemistry 277
29304–29314. (doi:10.1074/jbc.M204131200)
Gordon V, Bhadel S, Wunderlich W, Zhang J, Ficarro SB, Mollah SA,
Shabanowitz J, Hunt DF, Xenarios I, Hahn WC et al. 2010 CDK9
regulates AR promoter selectivity and cell growth through serine 81
phosphorylation. Molecular Endocrinology 24 2267–2280. (doi:10.1210/
me.2010-0238)
Gottesfeld JM & Forbes DJ 1997 Mitotic repression of the transcriptional
machinery. Trends in Biochemical Sciences 22 197–202. (doi:10.1016/
S0968-0004(97)01045-1)
Published by Bioscientifica Ltd.
Downloaded from Bioscientifica.com at 06/06/2020 07:01:54AMvia free access

En
do
crin
e-R
ela
ted
Can
cer
Research Y Koryakina et al. Cell cycle regulation ofandrogen receptor
22 :2 264
Guttinger S, Laurell E & Kutay U 2009 Orchestrating nuclear envelope
disassembly and reassembly during mitosis. Nature Reviews. Molecular
Cell Biology 10 178–191. (doi:10.1038/nrm2641)
Hsu SC & DeFranco DB 1995 Selectivity of cell cycle regulation of
glucocorticoid receptor function. Journal of Biological Chemistry 270
3359–3364.
Hsu SC, Qi M & DeFranco DB 1992 Cell cycle regulation of glucocorticoid
receptor function. EMBO Journal 11 3457–3468.
Hu JM, Bodwell JE & Munck A 1994 Cell cycle-dependent glucocorticoid
receptor phosphorylation and activity. Molecular Endocrinology 8
1709–1713. (doi:10.1210/mend.8.12.7708059)
Joseph JD, Lu N, Qian J, Sensintaffar J, Shao G, Brigham D, Moon M,
Maneval EC, Chen I, Darimont B et al. 2013 A clinically relevant
androgen receptor mutation confers resistance to second-generation
antiandrogens enzalutamide and ARN-509. Cancer Discovery 3
1020–1029. (doi:10.1158/2159-8290.CD-13-0226)
Knudsen KE 2006 The cyclin D1b splice variant: an old oncogene learns
new tricks. Cell Division 1 15. (doi:10.1186/1747-1028-1-15)
Knudsen KE, Arden KC & Cavenee WK 1998 Multiple G1 regulatory
elements control the androgen-dependent proliferation of prostatic
carcinoma cells. Journal of Biological Chemistry 273 20213–20222.
(doi:10.1074/jbc.273.32.20213)
Knudsen KE, Cavenee WK & Arden KC 1999 D-type cyclins complex with
the androgen receptor and inhibit its transcriptional transactivation
ability. Cancer Research 59 2297–2301.
Koryakina Y, Jones SM, Cornett LE, Seely K, Brents L, Prather PL, Kofman A
& Kurten RC 2012 Effects of the b-agonist, isoprenaline, on
the down-regulation, functional responsiveness and trafficking of
b2-adrenergic receptors with N-terminal polymorphisms. Cell Biology
International 36 1171–1183. (doi:10.1042/CBI20120134)
Koryakina Y, Ta HQ & Gioeli D 2014 Androgen receptor phosphorylation:
biological context and functional consequences. Endocrine-Related
Cancer 21 T131–T145. (doi:10.1530/ERC-13-0472)
Kumar S, Chaturvedi NK, Kumar S & Tyagi RK 2008 Agonist-mediated
docking of androgen receptor onto the mitotic chromatin platform
discriminates intrinsic mode of action of prostate cancer drugs.
Biochimica et Biophysica Acta 1783 59–73. (doi:10.1016/j.bbamcr.2007.
11.002)
Lim JT, Mansukhani M & Weinstein IB 2005 Cyclin-dependent kinase 6
associates with the androgen receptor and enhances its transcriptional
activity in prostate cancer cells. PNAS 102 5156–5161. (doi:10.1073/
pnas.0501203102)
Litvinov IV, Vander Griend DJ, Antony L, Dalrymple S, De Marzo AM,
Drake CG & Isaacs JT 2006 Androgen receptor as a licensing factor for
DNA replication in androgen-sensitive prostate cancer cells. PNAS 103
15085–15090. (doi:10.1073/pnas.0603057103)
Lu S, Liu M, Epner DE, Tsai SY & Tsai MJ 1999 Androgen regulation of
the cyclin-dependent kinase inhibitor p21 gene through an androgen
response element in the proximal promoter. Molecular Endocrinology 13
376–384. (doi:10.1210/mend.13.3.0254)
Martinez ED & Danielsen M 2002 Loss of androgen receptor transcriptional
activity at the G1/S transition. Journal of Biological Chemistry 277
29719–29729. (doi:10.1074/jbc.M112134200)
Maruvada P, Dmitrieva NI, East-Palmer J & Yen PM 2004 Cell cycle-
dependent expression of thyroid hormone receptor-b is a mechanism
for variable hormone sensitivity. Molecular Biology of the Cell 15
1895–1903. (doi:10.1091/mbc.E03-09-0636)
Matthews L, Johnson J, Berry A, Trebble P, Cookson A, Spiller D, Rivers C,
Norman M, White M & Ray D 2011 Cell cycle phase regulates
http://erc.endocrinology-journals.org q 2015 Society for EndocrinologyDOI: 10.1530/ERC-14-0549 Printed in Great Britain
glucocorticoid receptor function. PLoS ONE 6 e22289. (doi:10.1371/
journal.pone.0022289)
McCall P, Adams CE, Willder JM, Bennett L, Qayyum T, Orange C,
Underwood MA & Edwards J 2013 Androgen receptor phosphorylation
at serine 308 and serine 791 predicts enhanced survival in castrate
resistant prostate cancer patients. International Journal of Molecular
Sciences 14 16656–16671. (doi:10.3390/ijms140816656)
Narayanan R, Adigun AA, Edwards DP & Weigel NL 2005 Cyclin-dependent
kinase activity is required for progesterone receptor function: novel role
for cyclin A/Cdk2 as a progesterone receptor coactivator. Molecular and
Cellular Biology 25 264–277. (doi:10.1128/MCB.25.1.264-277.2005)
Petre CE, Wetherill YB, Danielsen M & Knudsen KE 2002 Cyclin D1:
mechanism and consequence of androgen receptor co-repressor
activity. Journal of Biological Chemistry 277 2207–2215. (doi:10.1074/
jbc.M106399200)
Reutens AT, Fu M, Wang C, Albanese C, McPhaul MJ, Sun Z, Balk SP,
Janne OA, Palvimo JJ & Pestell RG 2001 Cyclin D1 binds the androgen
receptor and regulates hormone-dependent signaling in a p300/CBP-
associated factor (P/CAF)-dependent manner. Molecular Endocrinology
15 797–811. (doi:10.1210/mend.15.5.0641)
Saradhi M, Sengupta A, Mukhopadhyay G & Tyagi RK 2005 Pregnane and
xenobiotic receptor (PXR/SXR) resides predominantly in the nuclear
compartment of the interphase cell and associates with the condensed
chromosomes during mitosis. Biochimica et Biophysica Acta 1746 85–94.
(doi:10.1016/j.bbamcr.2005.10.004)
Szafran AT, Szwarc M, Marcelli M & Mancini MA 2008 Androgen receptor
functional analyses by high throughput imaging: determination of
ligand, cell cycle, and mutation-specific effects. PLoS ONE 3 e3605.
(doi:10.1371/journal.pone.0003605)
Van Hooser A, Goodrich DW, Allis CD, Brinkley BR & Mancini MA 1998
Histone H3 phosphorylation is required for the initiation, but not
maintenance, of mammalian chromosome condensation. Journal of
Cell Science 111 3497–3506.
Vassilev LT, Tovar C, Chen S, Knezevic D, Zhao X, Sun H, Heimbrook DC &
Chen L 2006 Selective small-molecule inhibitor reveals critical mitotic
functions of human CDK1. PNAS 103 10660–10665. (doi:10.1073/
pnas.0600447103)
Whitworth H, Bhadel S, Ivey M, Conaway M, Spencer A, Hernan R,
Holemon H & Gioeli D 2012 Identification of kinases regulating
prostate cancer cell growth using an RNAi phenotypic screen. PLoS ONE
7 e38950. (doi:10.1371/journal.pone.0038950)
Xu Y, Chen SY, Ross KN & Balk SP 2006 Androgens induce prostate cancer
cell proliferation through mammalian target of rapamycin activation
and post-transcriptional increases in cyclin D proteins. Cancer Research
66 7783–7792. (doi:10.1158/0008-5472.CAN-05-4472)
Yamamoto A, Hashimoto Y, Kohri K, Ogata E, Kato S, Ikeda K & Nakanishi M
2000 Cyclin E as a coactivator of the androgen receptor. Journal of Cell
Biology 150 873–880. (doi:10.1083/jcb.150.4.873)
Yan J, Xu L, Crawford G, Wang Z & Burgess SM 2006 The forkhead
transcription factor FoxI1 remains bound to condensed mitotic
chromosomes and stably remodels chromatin structure. Molecular and
Cellular Biology 26 155–168. (doi:10.1128/MCB.26.1.155-168.2006)
Young DW, Hassan MQ, Yang X-Q, Galindo M, Javed A, Zaidi SK, Furcinitti P,
Lapointe D, Montecino M, Lian JB et al. 2007 Mitotic retention of gene
expression patterns by the cell fate-determining transcription factor
Runx2. PNAS 104 3189–3194. (doi:10.1073/pnas.0611419104)
Zong H, Chi Y, Wang Y, Yang Y, Zhang L, Chen H, Jiang J, Li Z, Hong Y,
Wang H et al. 2007 Cyclin D3/CDK11p58 complex is involved in the
repression of androgen receptor. Molecular and Cellular Biology 27
7125–7142. (doi:10.1128/MCB.01753-06)
Received in final form 28 January 2015Accepted 13 February 2015Made available online as an Accepted Preprint17 February 2015
Published by Bioscientifica Ltd.
Downloaded from Bioscientifica.com at 06/06/2020 07:01:54AMvia free access