cell coverage for signal and traffic cell coverage can be based on signal coverage or on traffic...
TRANSCRIPT

Cell Coverage for Signal and Traffic
• Cell coverage can be based on signal coverage or on traffic coverage
• The task is to cover the whole area with a minimum number of cell sites.
• Because 100 percent cell coverage of an area is not possible
• The cell sites must be engineered so that the holes are located in the no-traffic locations.
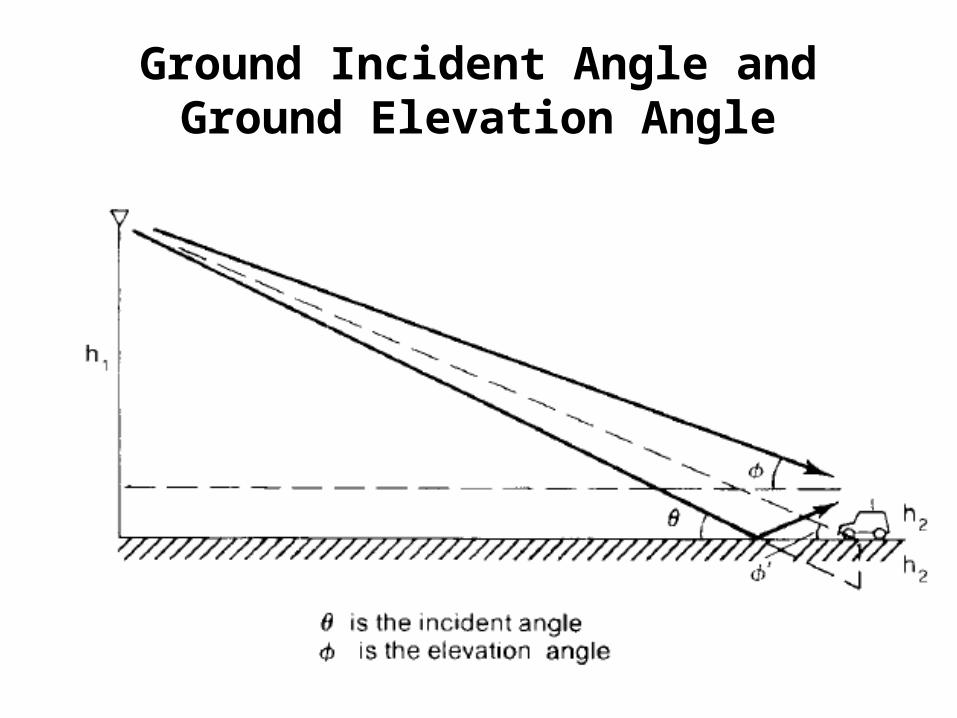
Ground Incident Angle and Ground Elevation Angle

Example 1
In a mobile radio environment, the average cell-site antenna height is about 50 m, the mobile antenna height is about 3 m, and the communication path length is 5 km.
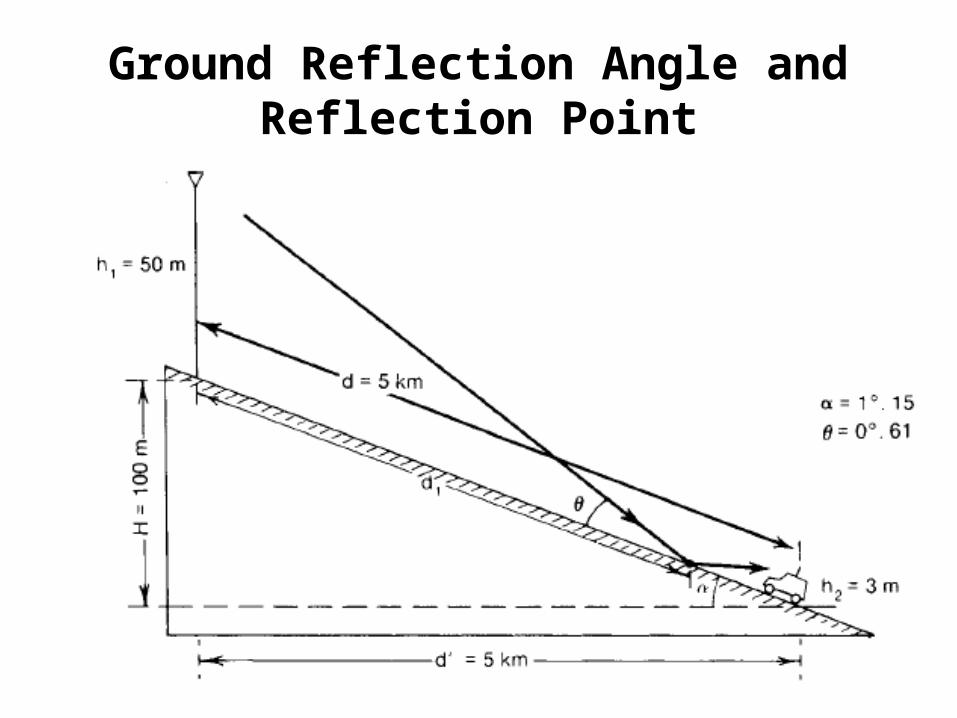
Ground Reflection Angle and Reflection Point
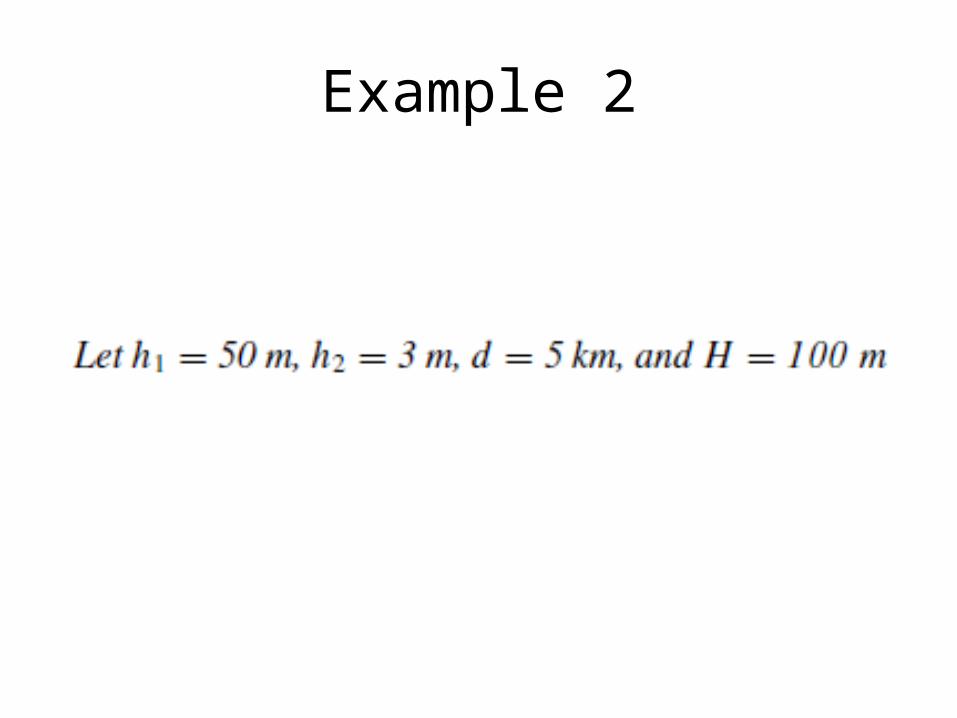
Example 2
OBTAINING THE MOBILE POINT-TO-POINTMODEL (LEE MODEL)
• Generate a standard condition
• Obtain an area-to-area prediction model
• Obtain a mobile point-to-point model using the area-to-area model as a base

Generating the Standard Condition
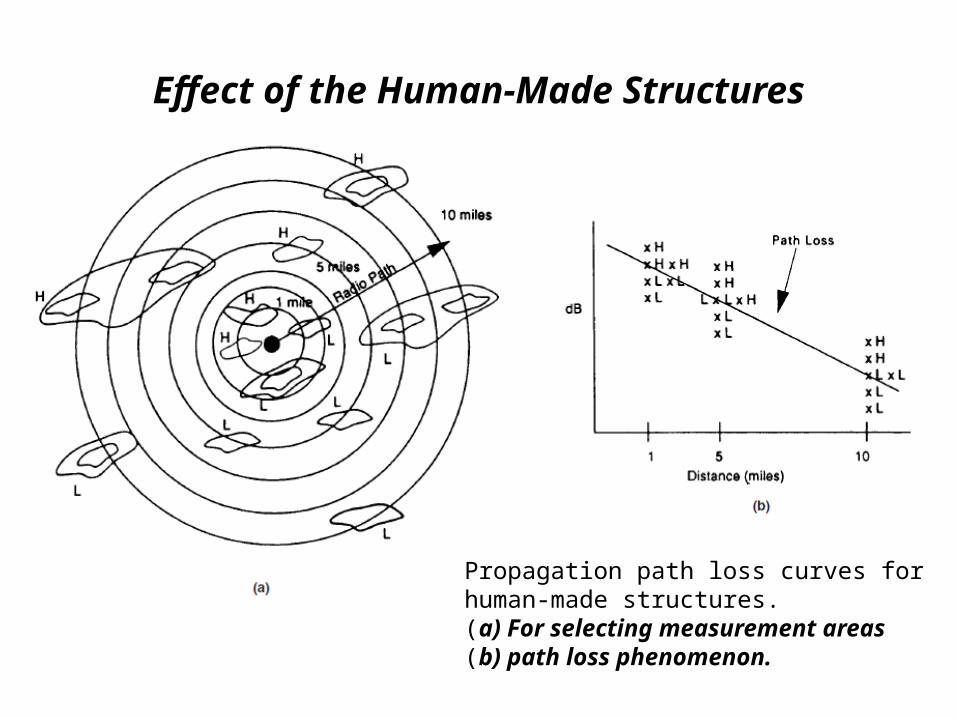
Effect of the Human-Made Structures
Propagation path loss curves for human-made structures. (a) For selecting measurement areas(b) path loss phenomenon.
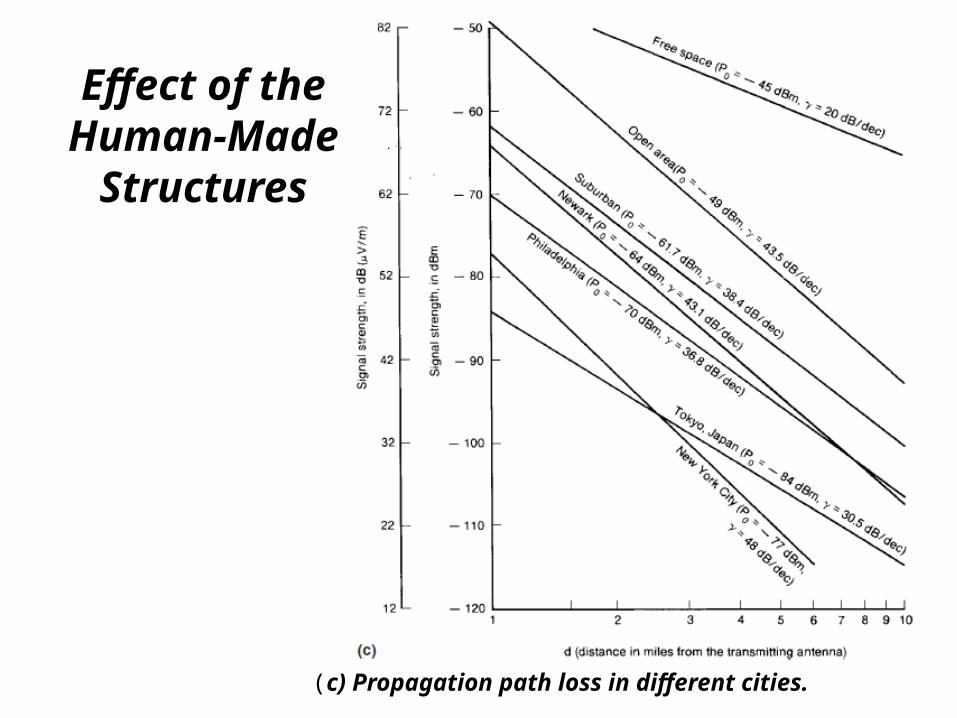
Effect of the Human-Made
Structures
(c) Propagation path loss in different cities.
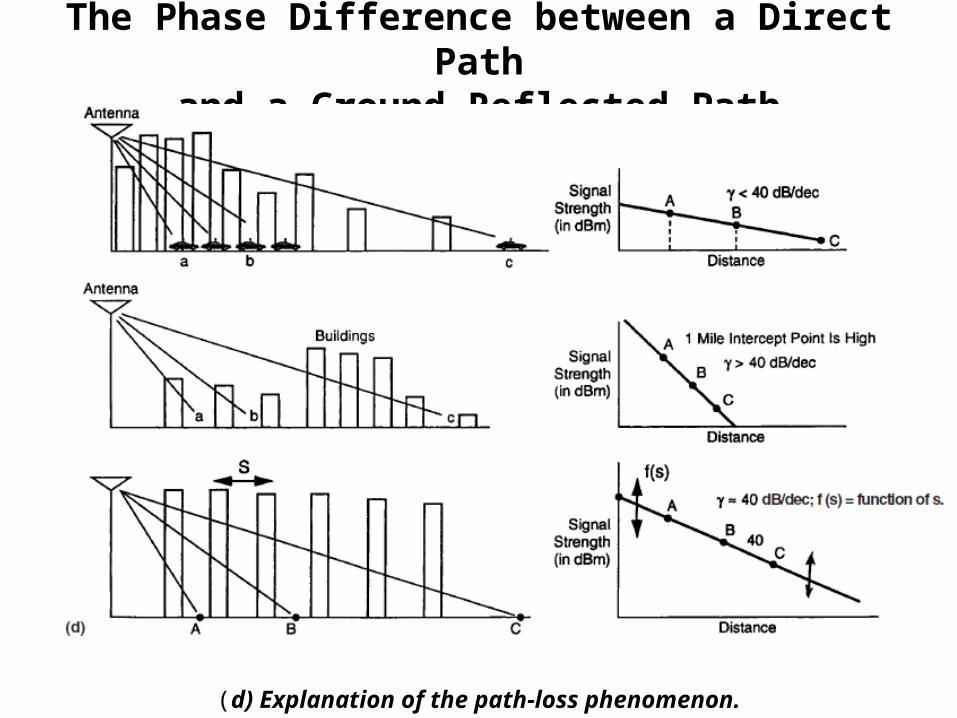
The Phase Difference between a Direct Pathand a Ground-Reflected Path
(d) Explanation of the path-loss phenomenon.
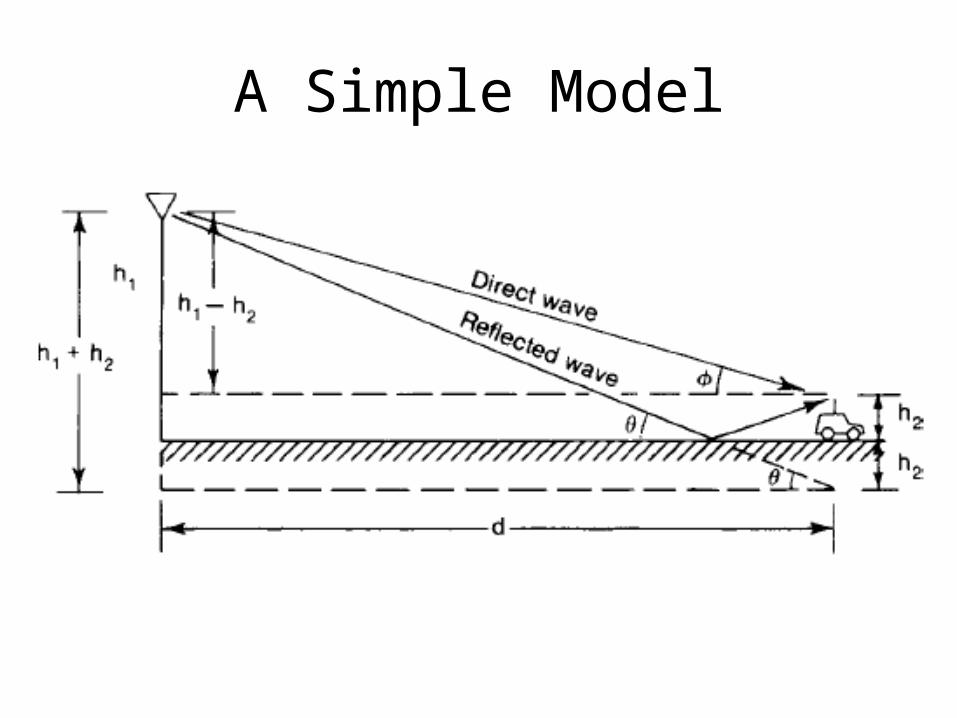
A Simple Model
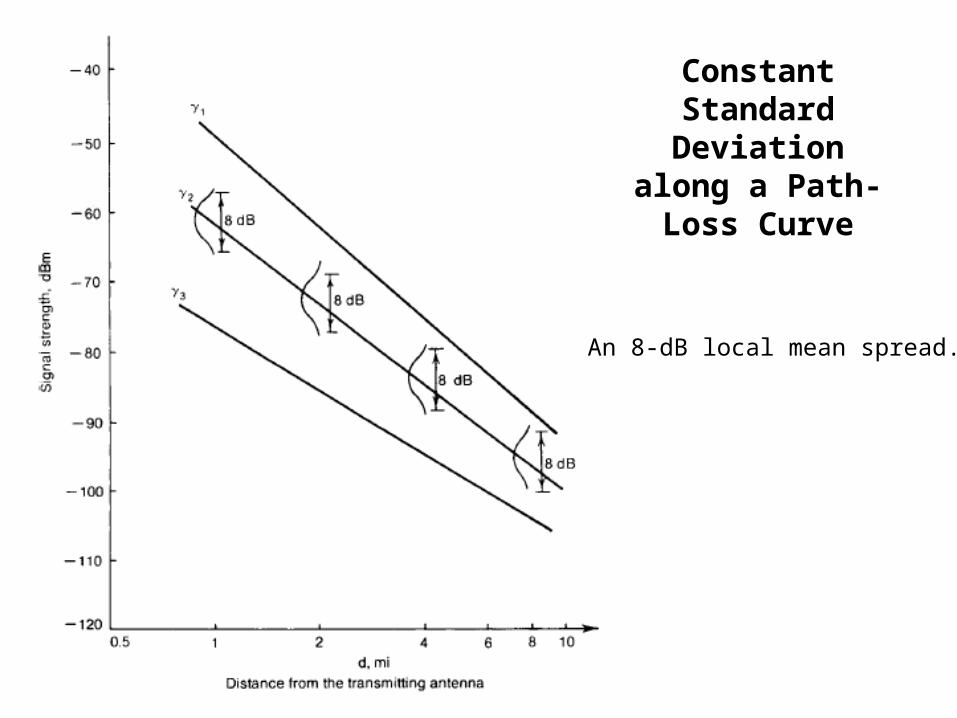
Constant Standard Deviation along a Path-Loss Curve
An 8-dB local mean spread.
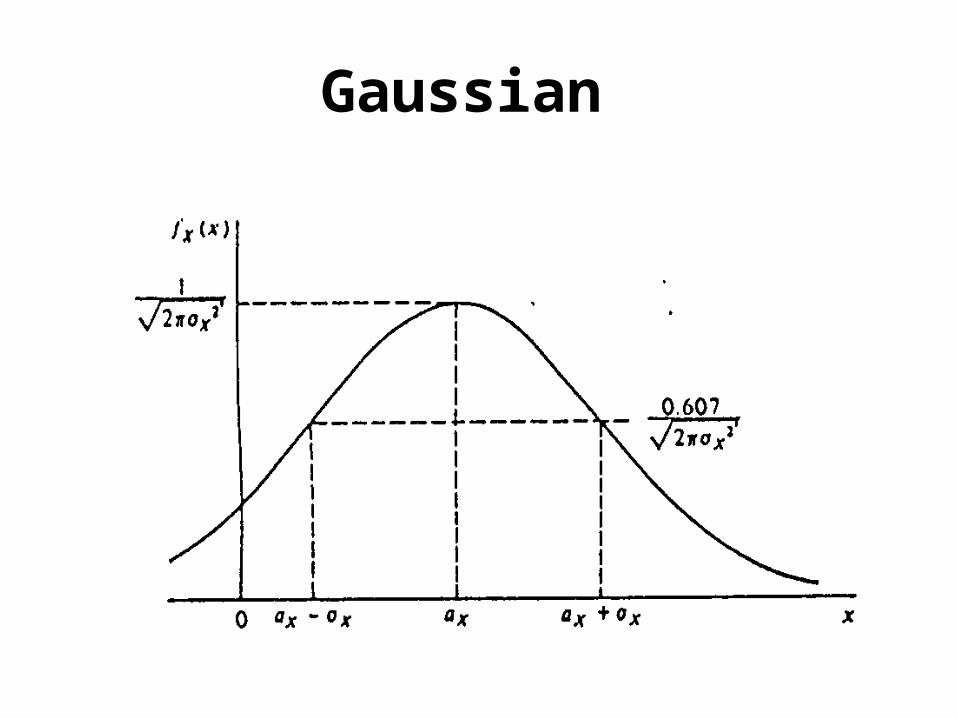
Gaussian

Straight Line path loss slope with confidence
• The received power is
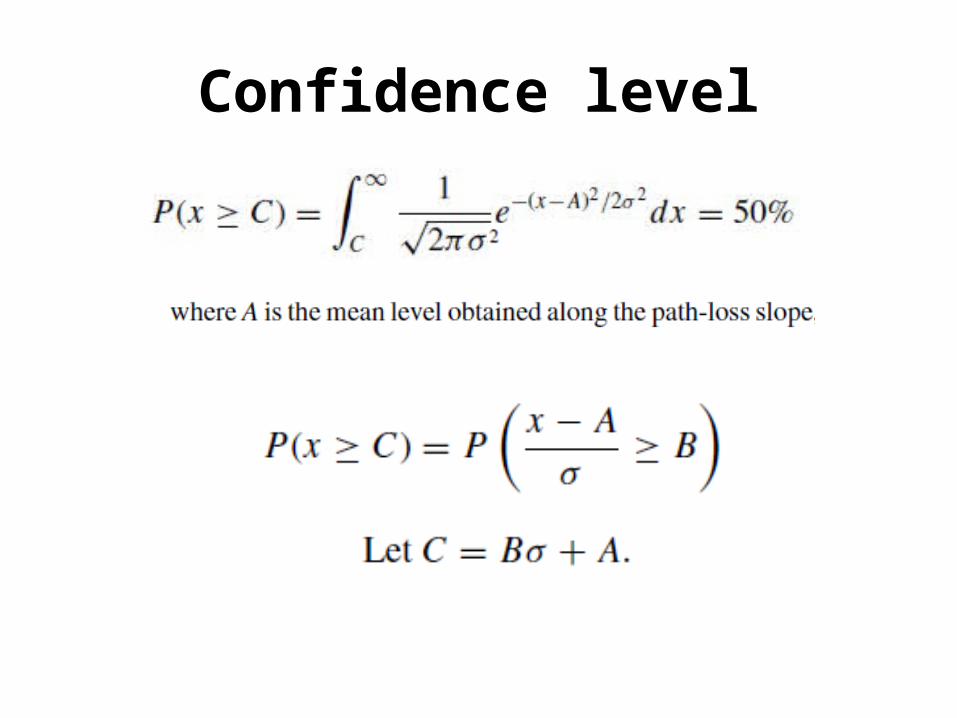
Confidence level

The different Confidence Levels
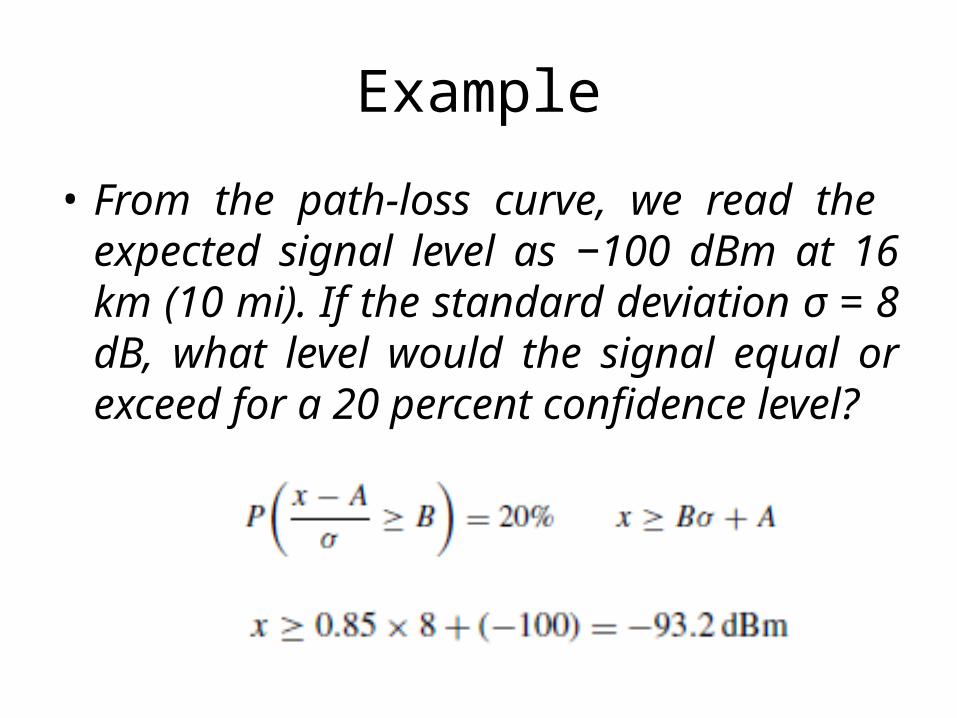
Example
• From the path-loss curve, we read the expected signal level as −100 dBm at 16 km (10 mi). If the standard deviation σ = 8 dB, what level would the signal equal or exceed for a 20 percent confidence level?
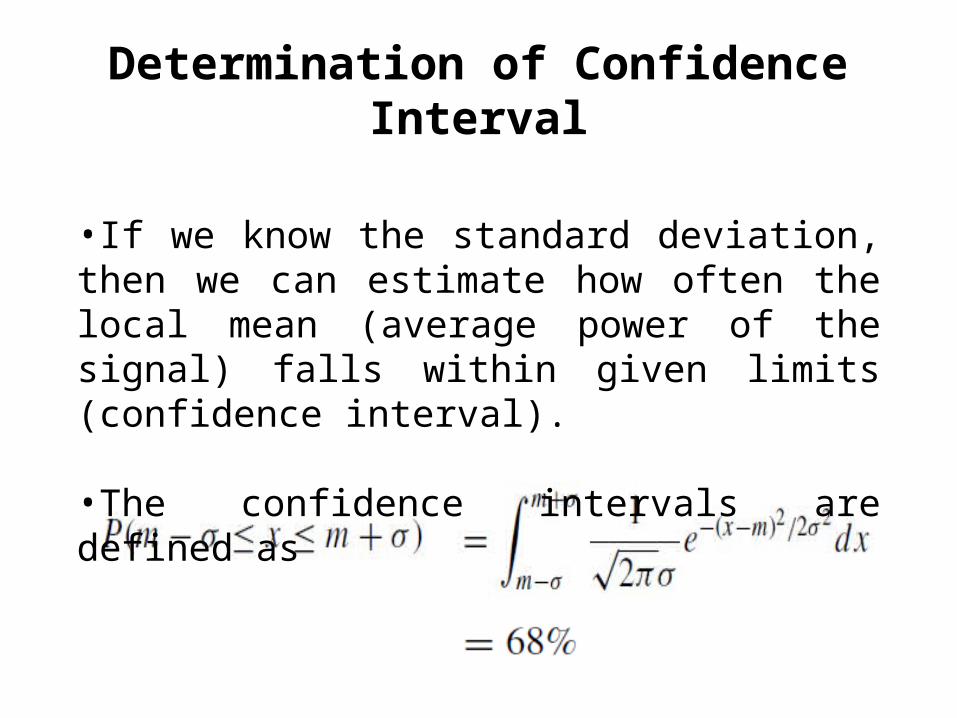
Determination of Confidence Interval
•If we know the standard deviation, then we can estimate how often the local mean (average power of the signal) falls within given limits (confidence interval).
•The confidence intervals are defined as

Determination of Confidence Interval
The standard deviation can be found from the table

A General Formula for Mobile Radio Propagation

A General Formula for Mobile Radio Propagation
• Sub-urban area• The 1-mi intercept level in a sub-urban area is
−61.7 dBm under the standard conditions• From the theoretical prediction model the
received power Pr at the suburban area is

A General Formula for Mobile Radio Propagation
• The above equation is simplified as
• To change the above equation to a general formula by using Pr at 10 mi as a reference which is −100 dBm
• Also the 40 dB/oct slope used is generous

A General Formula for Mobile Radio Propagation
• The most general formula is expressed as follows
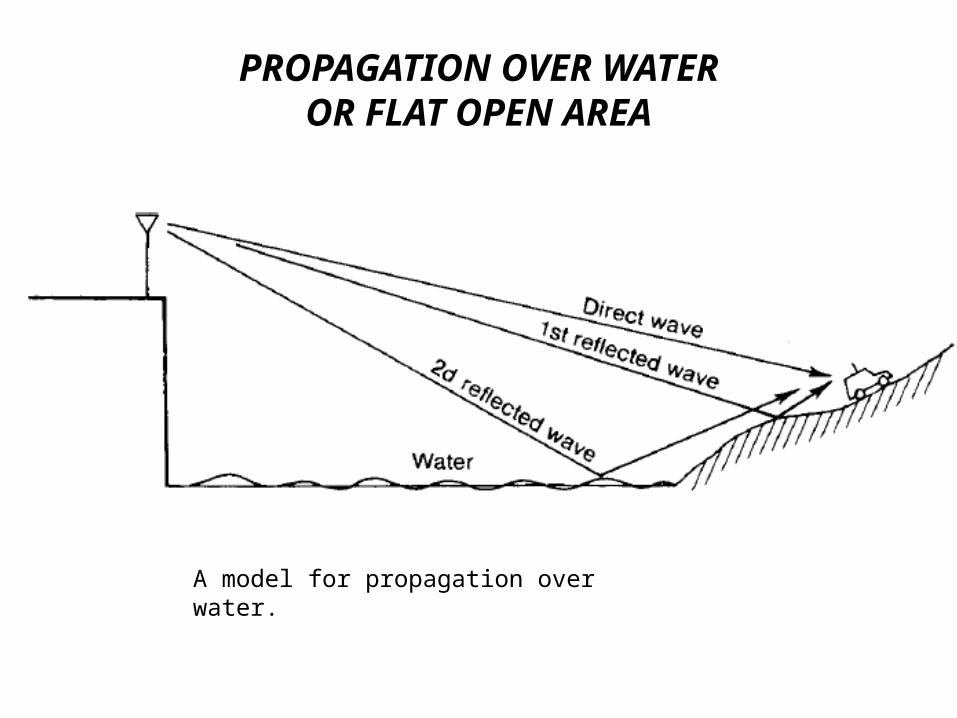
PROPAGATION OVER WATEROR FLAT OPEN AREA
A model for propagation over water.
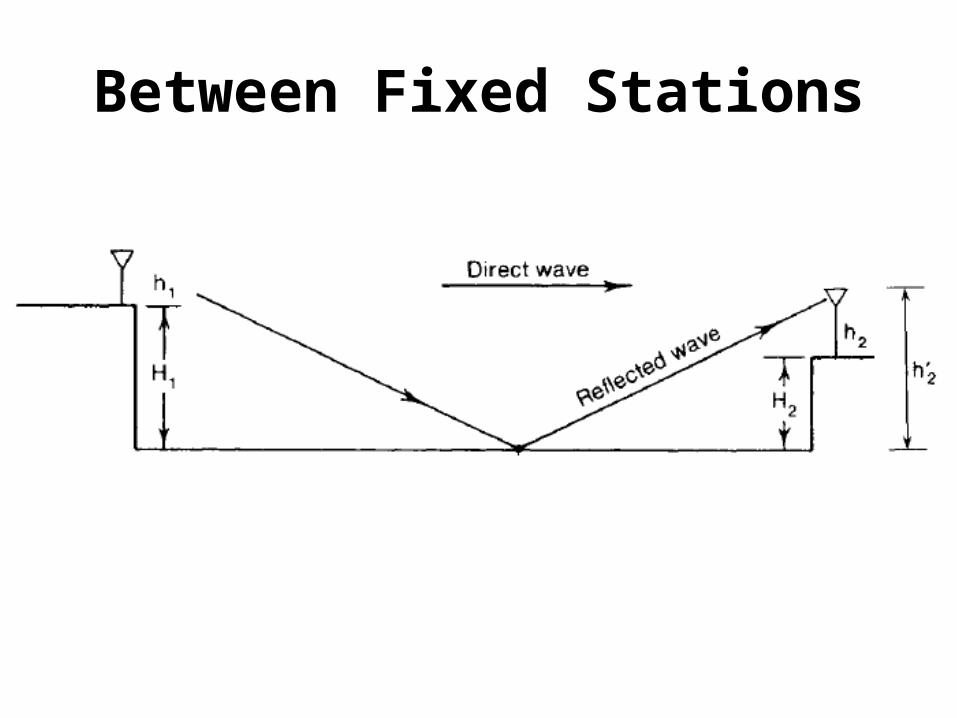
Between Fixed Stations

A characteristic of Foliage Environment

Foliage Loss
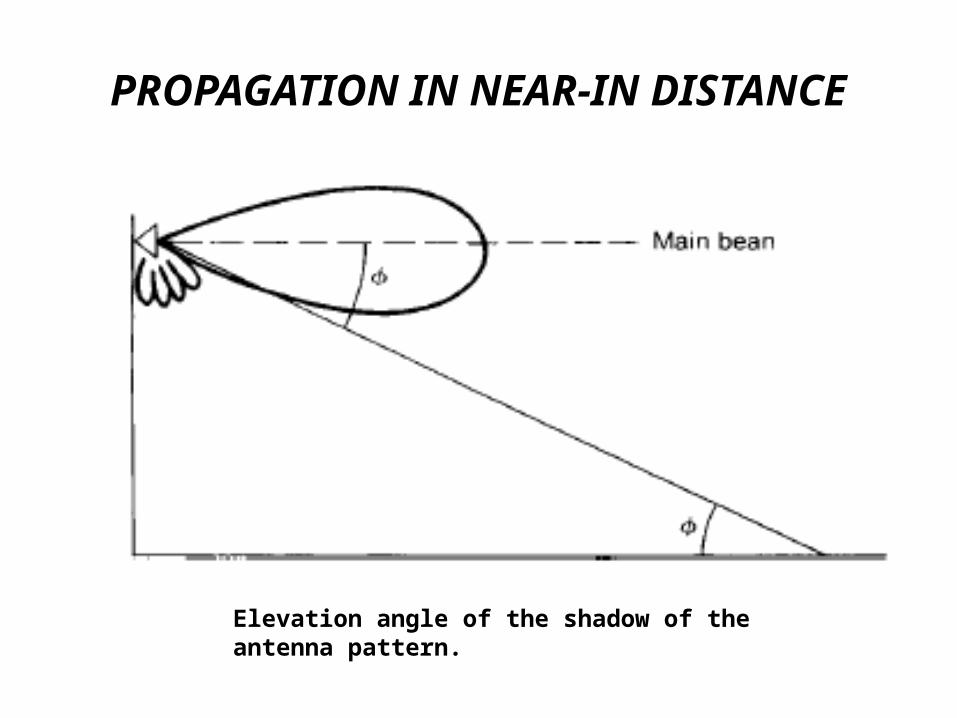
PROPAGATION IN NEAR-IN DISTANCE
Elevation angle of the shadow of the antenna pattern.
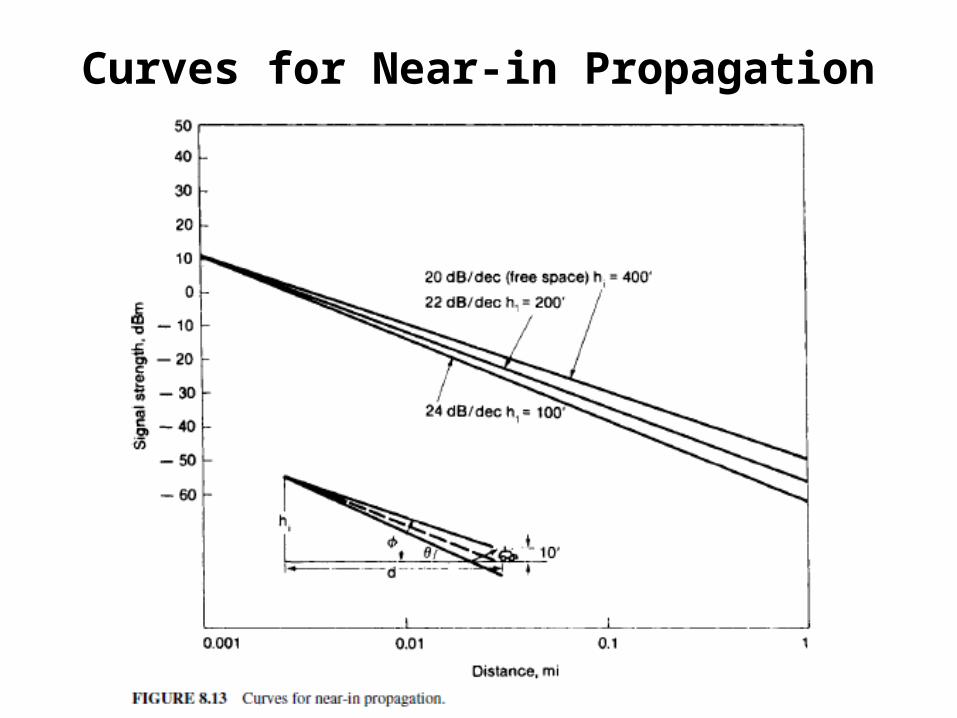
Curves for Near-in Propagation
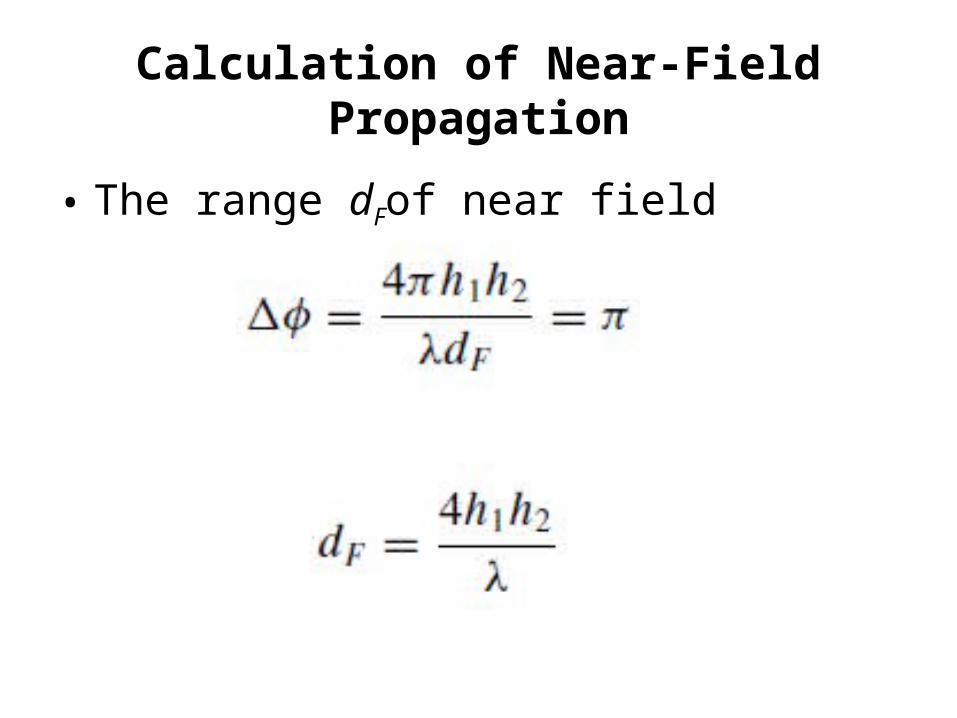
Calculation of Near-Field Propagation
• The range dFof near field

LONG-DISTANCE PROPAGATION• Noise-limited system• Interference-limited system• Tropospheric refraction• Tropospheric reflection.• Moistness• Trapping, or duct propagation• Elevated ducts are due to large air masses
(elevations of 1000 to 5000 ft , thickness from a few feet to a thousand feet.)
• Surface ducts appear over the sea and are about 1.5 m (5 ft) thick. And are produced by the cooling air of the earth.
LEE MODEL IN NON-OBSTRUCTIVE CONDITION

OBTAIN PATH LOSS FROM A POINT-TO-POINT PREDICTION MODEL: A GENERAL APPROACH
• Finding the Antenna-Height Gain
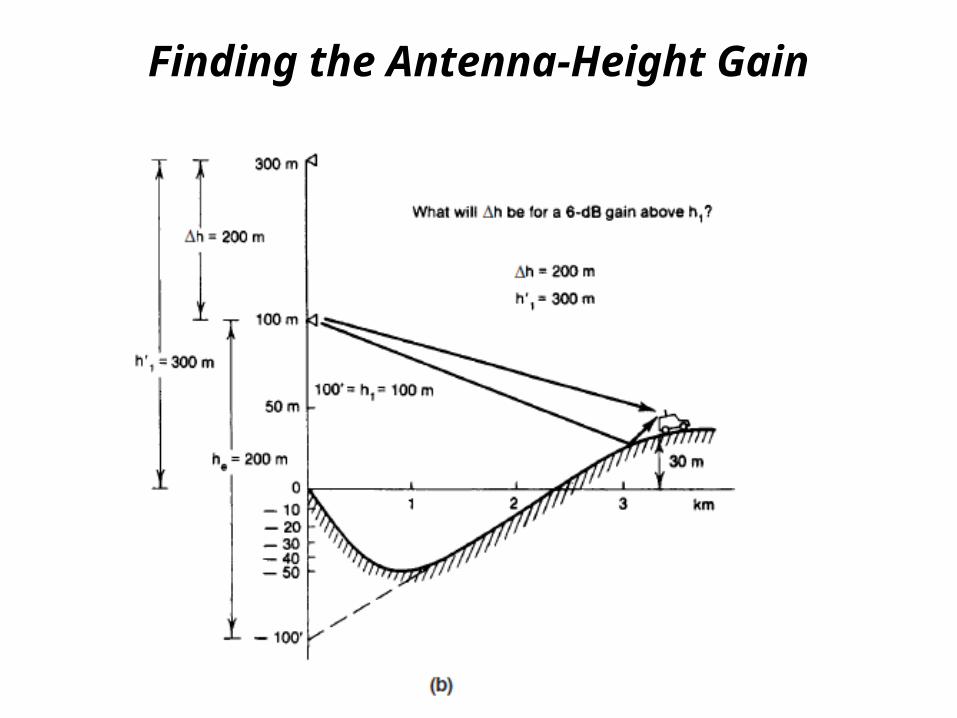
Finding the Antenna-Height Gain

Antenna Height Gain

Another Physical Explanation of Effective Antenna Height
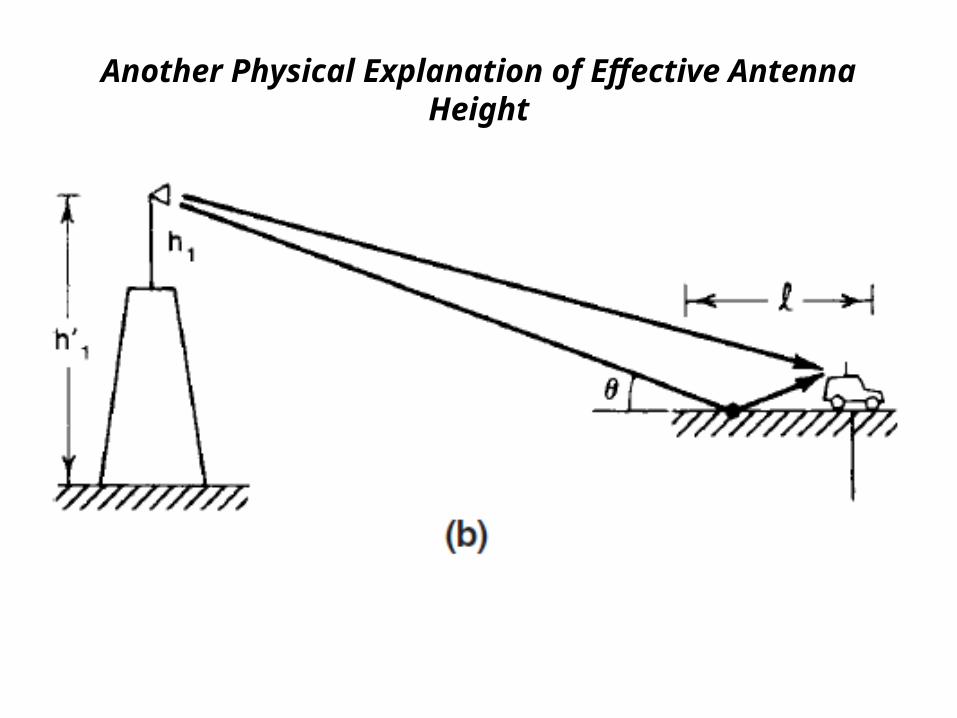
Another Physical Explanation of Effective Antenna Height

Another Physical Explanation of Effective Antenna Height
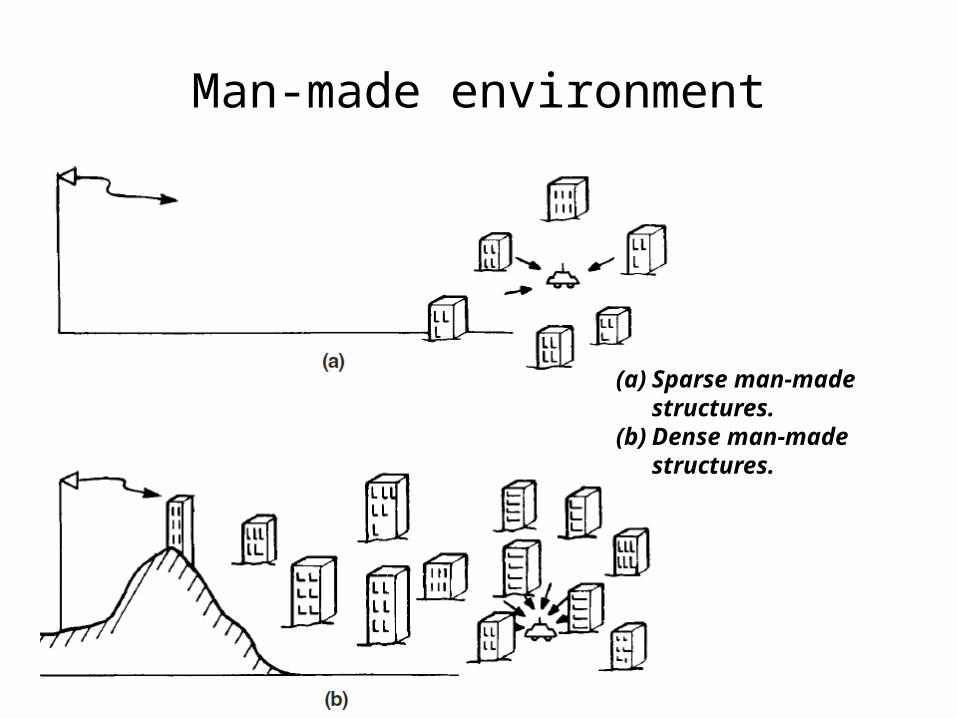
Man-made environment
(a) Sparse man-made structures. (b) Dense man-made structures.
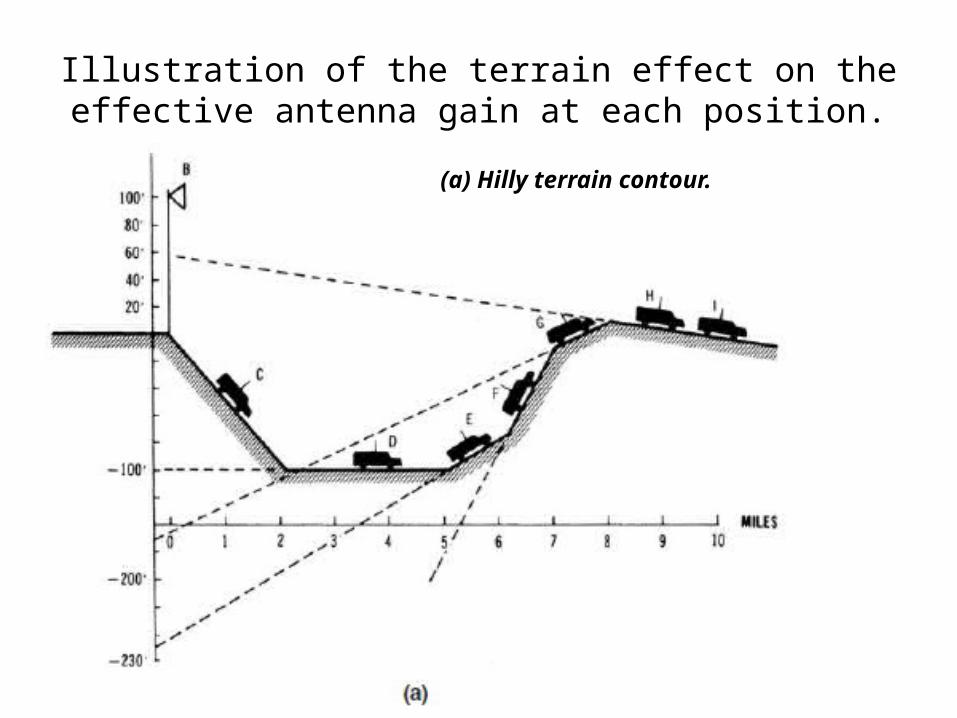
Illustration of the terrain effect on the effective antenna gain at each position.
(a) Hilly terrain contour.
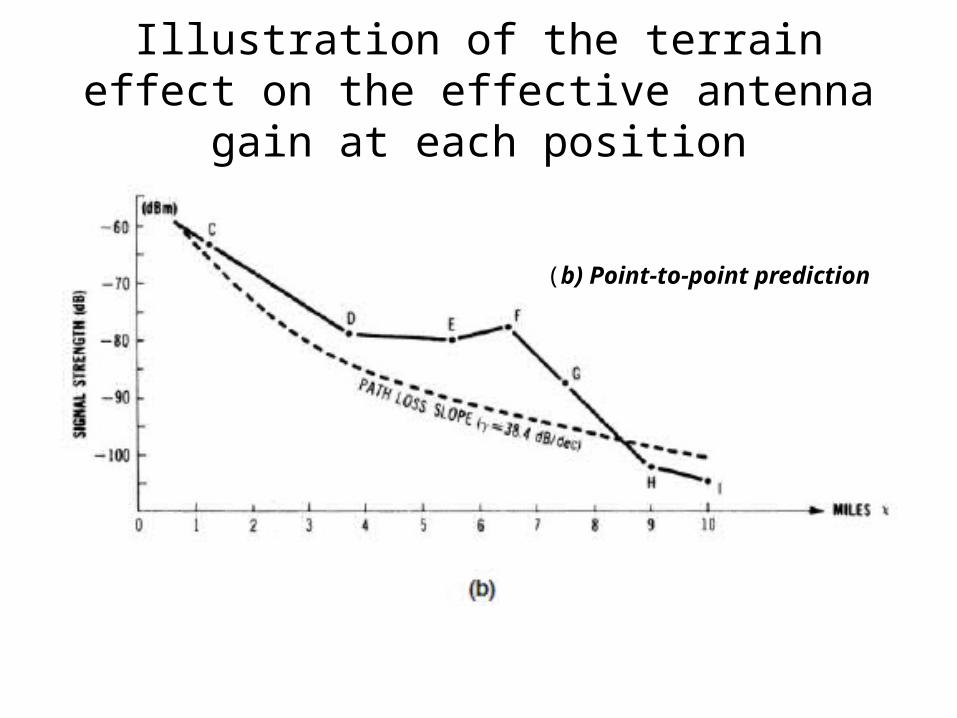
Illustration of the terrain effect on the effective antenna gain at each position
(b) Point-to-point prediction

In Obstructive Condition
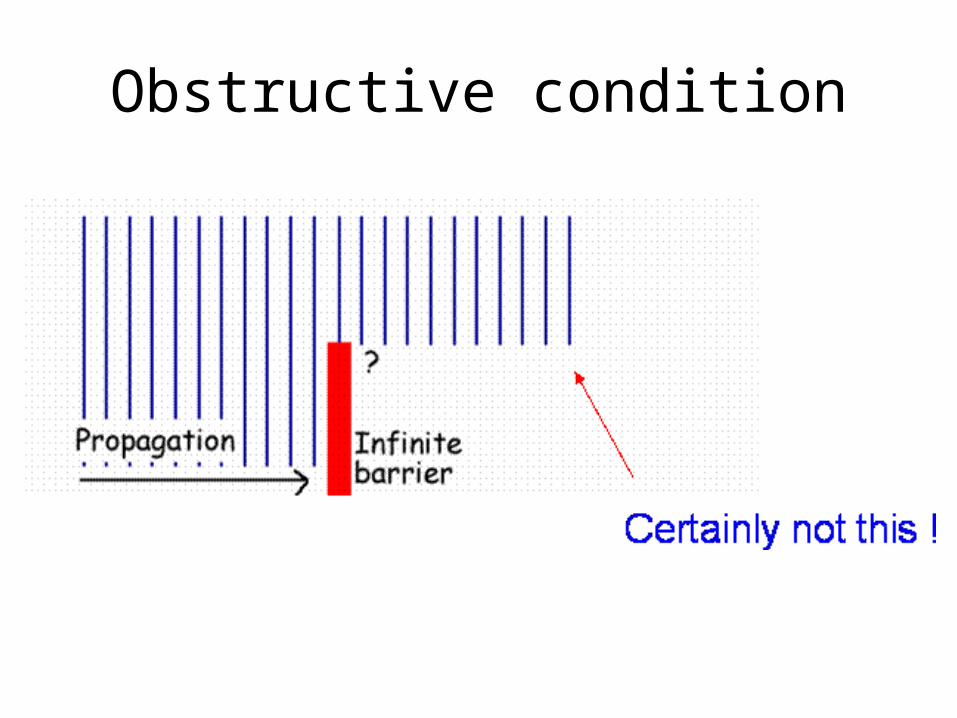
Obstructive condition

Obstructive condition
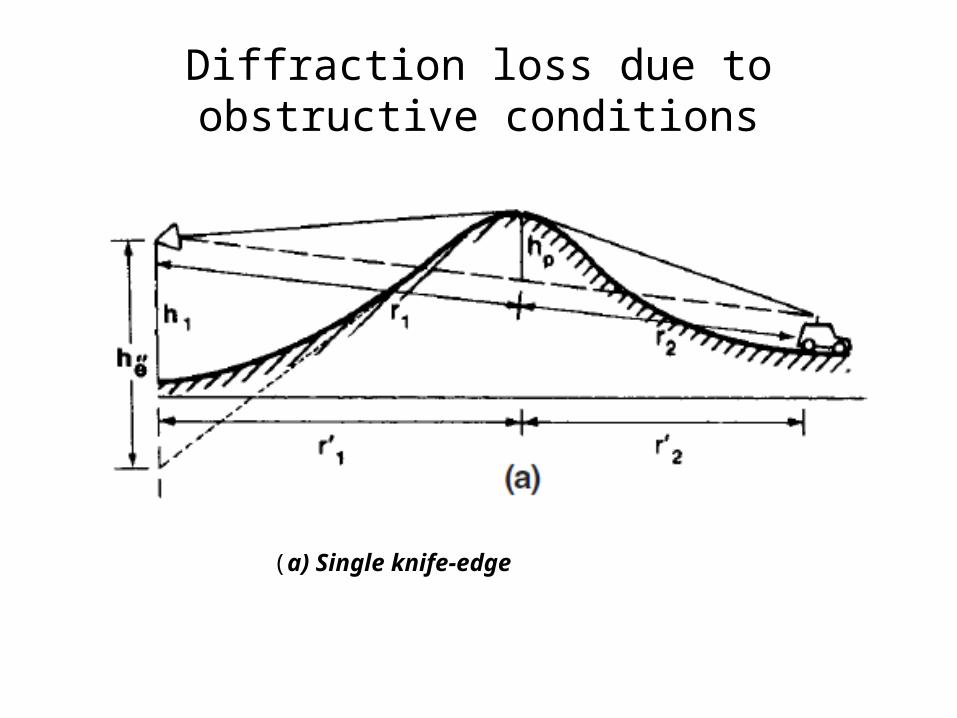
Diffraction loss due to obstructive conditions
(a) Single knife-edge
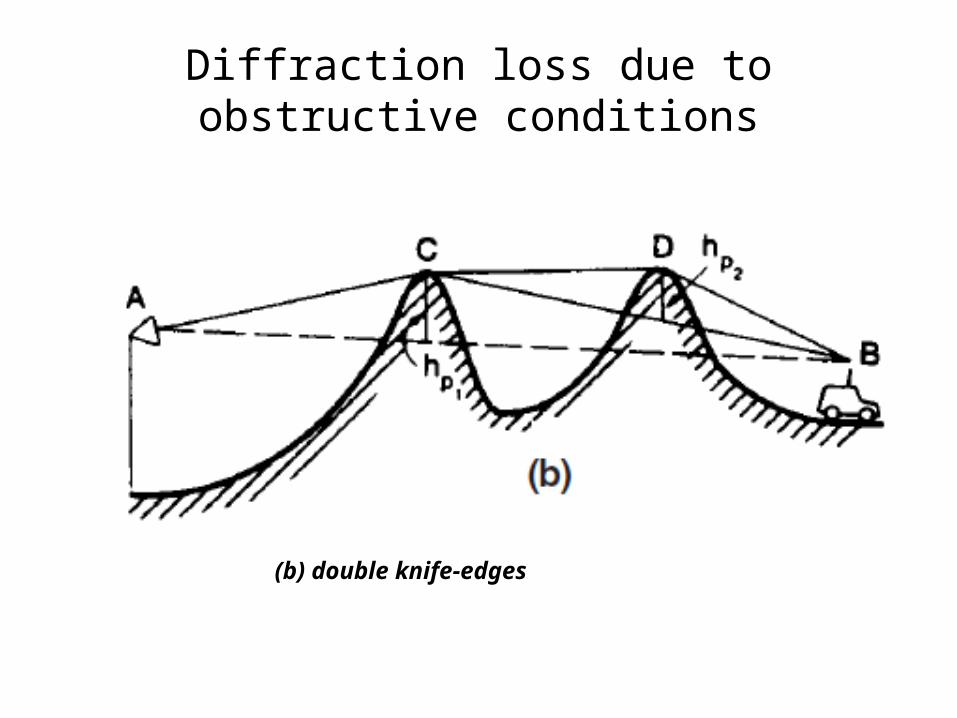
Diffraction loss due to obstructive conditions
(b) double knife-edges
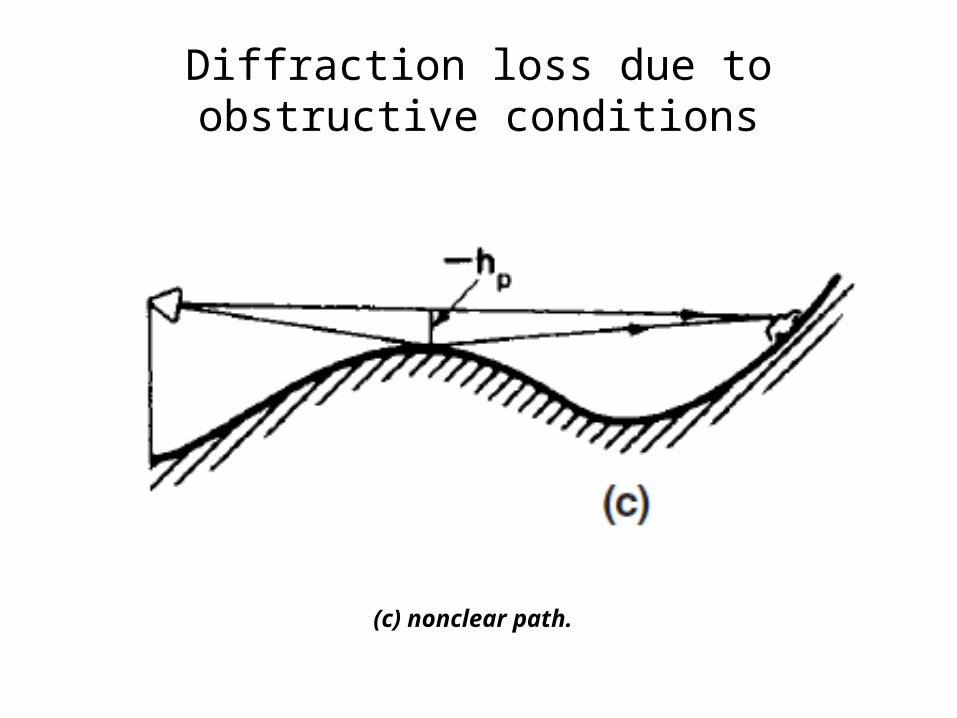
Diffraction loss due to obstructive conditions
(c) nonclear path.
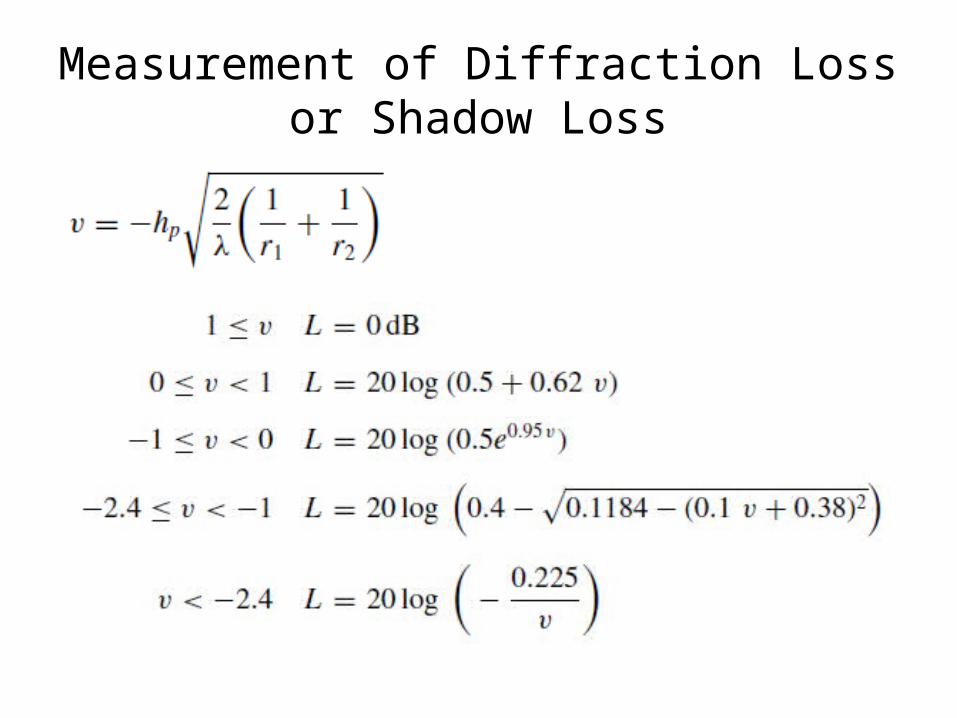
Measurement of Diffraction Loss or Shadow Loss

Shadow loss Prediction

Shadow Loss Prediction

General Formula of Lee Model
• 1. Direct-wave case. – The effective antenna height is a major factor
which varies with the location of the mobile unit while it travels.
• 2. Shadow case.– No effective antenna height exists. The loss is
totally due to the knife-edge diffraction loss.• 3. Over-the-water condition.– The free space path-loss is applied.

General Formula of Lee Model

Merits of Lee Model• The point-to-point model is very useful for designing a mobile cellular
system with a radius for each cell of 10 mi or less.
• This point-to-point prediction can be used to provide overall coverage of all cell sites and to avoid cochannel interference.
• The occurrence of handoff in the cellular system can be predicted more accurately.
• The point-to-point prediction model is a basic tool that is used to generate – a signal coverage map– an interference area map– a handoff occurrence map– or an optimum system design configuration

CELL-SITE ANTENNA HEIGHTS ANDSIGNAL COVERAGE CELLS

Visualization of effective antenna height & Coverage Cells
Different coverage concept. (a) Signal coverage due to effective antenna
heights.
Signal coverage served by two cell sites.