celebrating culture business - ancsa...
TRANSCRIPT

2017 ECONOMIC REPORT
C E L E B R A T I N G
C U L T U R E
B U S I N E S S

Message from ANCSA Regional Association 04Board of Directors 06ANCSA Economic Impact 07
BUILDING SUSTAINABLE FUTURES
Economic Impact of Alaska Native Regional Corporations 08 What Everyone Should Know About ANCSA Corporations 10 Weathering Alaska’s Recession 12 Financial Results for 2012–2016 14
ALASKA REGIONAL CORPORATIONS MISSION AND BUSINESS ACTIVITIES
Ahtna, Incorporated 19Aleut Corporation 20Arctic Slope Regional Corporation 21Bering Straits Native Corporation 22Bristol Bay Native Corporation 23Calista Corporation 24Chugach Alaska Corporation 25CIRI 26Doyon, Limited 27Koniag, Incorporated 28NANA Regional Corporation 29Sealaska Corporation 30
TABLE OF CONTENTS
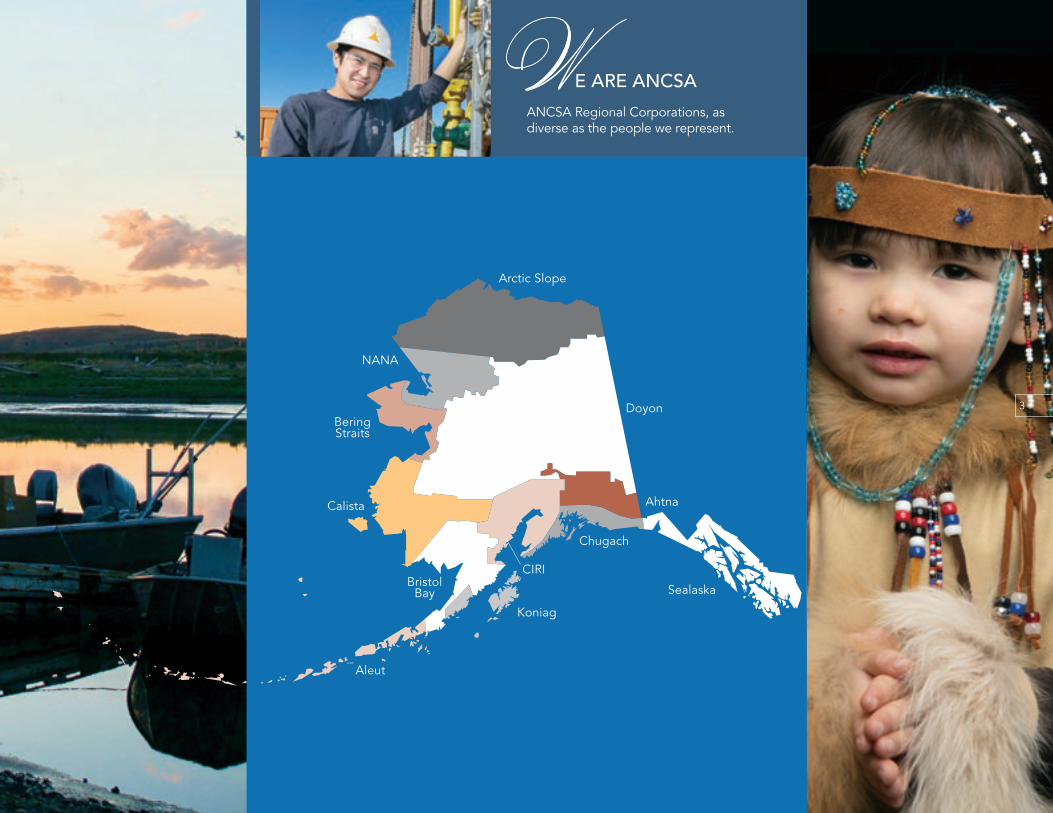
Doyon
Arctic Slope
NANA
BeringStraits
CIRI
Ahtna
Sealaska
Koniag
Chugach
Calista
Bristol Bay
Aleut
E ARE ANCSAWANCSA Regional Corporations, as diverse as the people we represent.
3

MESSAGE FROM ANCSA REGIONAL ASSOCIATION
We are pleased to present to you the 2017 ANCSA Regional Association Economic Impact Report. The purpose of our report is to demonstrate the economic impact that ANCSA Regional Corporations are having on our shareholders and on the economies in which we work. This year’s report underscores an often-misunderstood fact about ANCSA Regional Corporations – that ANCSA Corporations are somehow supported by the federal or state governments through tax breaks or other financial support. We are not. We are for-profit companies that operate within the exact same economic and market forces as any company in America today. We take risks like any other company. And we pay taxes like any other company.
When our business efforts go well, we grow as companies, and occasionally, like other companies, we experience economic setbacks. Our approach to our annual Economic Impact Report has always been to report as a group of twelve companies united in purpose under the Alaska Native Claims Settlement Act (ANCSA). This year, in the middle of an Alaska economic recession, is no exception. This year’s report reflects a year of challenges and tough decisions for some of our members.
ANCSA Regional Corporations are also companies with a strongly held financial and socio/cultural mission of bringing real benefits to our shareholders and descendants. Since our corporate shares are not publicly traded, our companies are not held to the quarterly demands of Wall Street. We are able to take the long view with our investments, and we are similarly able to take the long view in providing stable benefits to our shareholders.
Ours is a story of long-term equity growth and of providing stable and very real economic benefit to our shareholders through the dividends we provide, the scholarships we invest in to develop our shareholders’ futures, and the investments we make in a wide variety of cultural and social non-profit organizations that benefit our shareholders. In 2016, we invested more than $207 million into these direct benefits to our shareholders. Since we strive for stability in delivering these benefits even when the business environment isn’t stable, this year we invested 193.6% of net income in shareholder benefits.
The twelve ANCSA Regional Corporations brought in $8.2 billion in revenue in the 2016 reporting period. Only 24.5% of that revenue was derived from Federal 8(a) contracting for a total of $2 billion – ANCSA Regional Corporations have reduced the portion of revenue coming from 8(a) contracting by more than one third over the last five years as companies have graduated and moved on to compete successfully in the private sector.
Net income for 2016 was $107.3 million. However, due to the recessionary challenges we faced in 2016, the financial results are significantly different from last year’s performance and from a five-year perspective. Revenue dropped by 5.6% from the previous year and is off 8.3% for the five-year period (2012). Net income was off 55.4% from 2015. The 2016 impact on net income did slightly affect shareholder equity (-0.65%) when compared to 2015. So admittedly, the large losses experienced by one of our star performers makes 2016 pale in comparison to our companies’ previous performance.
The five-year performance of our twelve Regional Corporations is still something we are very proud of. Shareholder equity in 2016 was $4 billion, which is 5.7% greater than it was five years earlier. The ANCSA Regional Corporations have for the last five years averaged a payout to shareholders of more than 110.9% of net income in the form of shareholder dividends, scholarships, and contributions to Native non-profit organizations. We fully recognize that this level of shareholder distribution limits equity growth, but ANCSA Regional Corporations maintain both the goal of competing profitably in the private sector, and bringing substantive and stable benefits to our shareholders – we have both financial and socio/cultural goals to meet.
On average for each of the last five years, ANCSA Regional Corporations produced $8.6 billion in revenue and $215.6 million in profits. To give this context, the annual revenue brought in by the twelve Regional Corporations is 16.7% of Alaska’s Gross Domestic Product (GDP). If we include all of the revenue earned by all Alaska Native Corporations (ANC) on the Alaska Business Monthly (ABM) Top 49ers ranking, $11.1 billion, ANCs make up 21.8% – almost one quarter of Alaska’s GDP.
4

And we don’t just contribute to the State’s and the Nation’s GDP through the revenue we earn, there is also an economic multiplier effect from what we do; we employ tens of thousands, both Native and non-Native, in Alaska, the U.S., and internationally. While Alaska is certainly our largest payroll, it is only 35% of our total labor expense. The states in our top-ten list for payroll includes Alaska, Maryland, Virginia, Alabama, California, Texas, Louisiana, Florida, New Jersey, and Maine accounting for 36,763 employees and $2.1 billion in payroll.
Regional Corporations employ 17,549 Alaskans and 49,771 people (including Alaska employees) world-wide. This helps translate the revenue we earn into economic activity in every community in which we work.
When considering our employment among Alaska’s top companies, ANCSA Regional Corporations provide almost two-thirds of the jobs, 61.9% of the Alaska jobs, and 62.3% of all jobs provided by Alaska companies listed on the ABM Top 49ers ranking. Perhaps more remarkable is that ANCSA Regional Corporations make up only 24.5% of the companies on the list. If we take into consideration all Alaska Native Corporations on the list (42.9% of the companies listed), we account for 68.8% of the Alaska jobs and 86.0% of all jobs provided by the top 49 Alaska companies. From a gross revenue perspective, ANCSA Regional Corporations account for 57% of the Top 49er gross revenue and when considering all Native Corporations on the list, our gross revenue represents three quarters of the revenue (74.5%).
Our investment in our shareholders is paying off. Our goal is to train and hire as many qualified Alaska Native people as we can. For decades now, ANCSA Regional Corporations have been investing in scholarships and
training. In fact, in 2016 we awarded 3,518 scholarships for a total value of $7.6 million. Today, almost 35% of our employees in Alaska are Native, which is a number to celebrate since Alaska Native people are only 19% of the Alaska population.
We also impact Alaska’s economy through the real estate we have developed. Today that number stands at nearly $1 billion – almost all of which is in Alaska. Oftentimes, a construction worker, or long-haul trucker might not link their job to a Native Corporation; but the steel that was brought to Alaska and the construction jobs involved were often Native companies. And if an Anchorage shopper goes to Tikahtnu Commons in Anchorage, a Fairbanks resident enjoys picnics next to the Doyon Building along the Chena River waterfront, or a Juneau resident enjoys the beautiful Sealaska Heritage Center—these were all built by Alaska Native Corporations.
So, while 2016 presented many opportunities and a few challenges for our ANCSA Regional Corporations, we still consider the year a success for our corporations and the Alaska Native people we serve. And the economic impact we are making continues. We hope you find this report and the analysis that follows interesting and that it helps you better understand the unique companies that make up the twelve ANCSA Regional Corporations.
Sincerely,
Gabriel KompkoffBoard Chair
Kim ReitmeierExecutive Director
35

6
BOARD OF DIRECTORS
Michelle AndersonPresidentAhtna, Incorporated
Wayne WestlakePresident & CEONANA Regional Corporation
Andrew GuyPresident & CEOCalista Corporation
Julie KitkaPresidentAlaska Federation of Natives
Gabriel KompkoffCEOChugach Alaska Corporation
Thomas MackPresidentAleut Corporation
Anthony MallotPresident & CEOSealaska Corporation
Jason MetrokinPresident & CEOBristol Bay Native Corporation
Sophie MinichPresident & CEOCIRI
Elizabeth PerryCEOKoniag, Incorporated
Rex Rock, Sr.President & CEOArctic Slope Regional Corporation
Gail R. SchubertPresident & CEOBering Straits Native Corporation
Aaron M. SchuttPresident & CEODoyon, Limited

ANCSA ECONOMIC IMPACT
$39,650,270Donations to Native Non-Profits:
17,549Alaska Employees:
Scholarships Awarded:
3,518Scholarship Funds Awarded:
$7,654,450
49,771Employees:
We are an Association of Alaska Native Regional Corporation CEOs. Our corporations are owned by more than 127,000 Alaska Native people and were formed under the Alaska Native Claims Settlement Act of 1971 (ANCSA).
Resource Development Revenue Sharing (7i):
$67,653,072
Shareholders: 127,449$160,460,401Dividends Paid to Shareholders:
$1,264,057Donations to Non-Native Charities:
7
Payroll:$174MEmployees:
2,888
Alabama
Payroll:$1B
Employees:17,459
Alaska
Payroll:$202MEmployees:
1,936
Maryland
Payroll:$194MEmployees:
2,009
Virginia
Payroll:$150M
Employees:2,527
California
Payroll:$87M
Employees:4,422
Texas
Payroll:$85M
Employees:1,742
Louisiana
Payroll:$65M
Employees:860
Maine
Payroll:$66M
Employees:696
New JerseyPayroll:
$66MEmployees:
1,188
Florida
TOTAL REVENUE: $8.2 BILLION 8(A) REVENUE: $2.4 BILLION

74.5%
57.0%
86.0%
62.3%
Top 49ers Gross Revenue$14.8 billiion
Top 49ers All Jobs72,639
AK
Nat
ive
Cor
por
atio
ns
AK
Nat
ive
Cor
por
atio
ns
AK
Reg
iona
l C
orp
orat
ions
68.8%
61.9%
Top 49ers AK Jobs22,271
AK
Nat
ive
Cor
por
atio
ns
AK
Reg
iona
l C
orp
orat
ions
AK
Reg
iona
l C
orp
orat
ions
2016
IMPACT OF ANCSA CORPORATIONS
For over 45 years, ANCSA Regional Corporations have been quietly building their businesses, and in the process, diversifying the Alaska economy. We invite you to review the following section in this report where summaries of the businesses owned and operated by each ANCSA Regional Corporation are presented. These outline a diverse range of industries, companies, and regions of the world. It is this diversification that has allowed ANCSA Regional Corporations to grow and thrive. Through these operating investments, our corporations play a vital role in the Alaska economy and an important role in many other U.S. states.
IMPACT ON SHAREHOLDERS & DESCENDANTSANCSA Regional Corporations take the responsibility to deliver real economic, educational, social, and cultural value to our shareholders very seriously. In 2016, the companies paid out $160.5 million in dividends to shareholders. Since a vast majority of our shareholders live in Alaska, this spending represents a significant cash distribution within the Alaska economy. In addition to the dividends we pay to shareholders, in 2016 we paid out $234.8 million in payroll just to Alaska Native employees. When we combine dividends paid out with our Alaska Native payroll, this means Alaska Native people were able to spend nearly $400 million in the Alaska economy in 2016.
We invest in the future of shareholders by awarding a broad range of scholarships helping them attain the education and training necessary to be successful in today’s modern economy. In 2016, we awarded over 3,500 scholarships at a total investment of $7.7 million. And we support our communities’ social and cultural needs through our contributions to Native non-profit corporations who deliver these services. In 2016, ANCSA Regional Corporations contributed $39.7 million to Native non-profits.
Our commitment to our shareholders’ financial, educational, social, and cultural needs is long-term.
On average for each of the last five years, ANCSA Regional Corporations have contributed $170.9 million to dividends, $7.0 million to scholarships, and $23.0 million to Native non-profit corporations.
IMPACT ON THE ALASKA ECONOMYFrom an historical view, Alaska has traditionally been a resource extraction state. Generally, when a resource is extracted, tax revenues and other on-the-ground spending benefit the state, but most profits are quickly exported from Alaska to home offices or to other investments outside of Alaska.
Since Alaska Native Corporations are all headquartered in Alaska, but do business around the world, ANCSA Corporation profits are quickly brought back to Alaska for further investment – Alaska benefits from the economic multiplier of profits imported to Alaska. ANCSA Corporations have a very material impact on the State of Alaska’s economy.
CONOMIC IMPACT OF ALASKA NATIVE REGIONAL CORPORATIONSE
8

In the most recent Alaska Business Monthly (ABM) ranking of the top Alaskan companies, the “Top 49ers,” all twelve ANCSA Regional Corporations were on the list as they have been every year covered in this report. Regional Corporations earned $8.4 billion (as reported to the ABM) representing 57% of the $14.8 billion brought in by 49 companies on the list. While gross revenue is a sometimes-criticized measure, it has now been reported to ABM consistently for decades and is a good measure of economic activity.
Nine ANCSA Village Corporations also made the Top 49ers, reporting $2.6 billion in revenue. When combined with Regional Corporation revenue, ANCs made up 74.5%, three quarters of all the revenue earned by all the companies on the list. Considering all Top 49er-ANCs account for only 42.9% of the companies on the list, they have a significant impact on job generation in Alaska.
To put these revenue figures in perspective, the Alaska Gross Domestic Product (GDP) in 2016 was $50.7 billion. Based on the $8.4 billion in revenue reported to the ABM Top 49ers report, ANCSA Regional Corporations accounted for 16.7% of the Alaska GDP. When the nine ANCSA Village Corporations on the Top 49er list are included, the ANCs on the ABM list account for over one-fifth (21.8%) of the Alaska GDP.
From a jobs perspective, Alaska Native Corporations on the list also accounted for 68.8% of Alaska-based jobs and 86% of all the jobs created by the 49 companies on the list. Taken separately, ANCSA Regional Corporations accounted for 61.9% of the Alaska-based jobs and
62.3% of all jobs created. The twelve ANCSA Regional Corporations make up just 24.5% of the companies on the list of 49.
Considering only the Alaska jobs created by ANCSA Regional Corporations, we paid out over $1.0 billion in payroll into the Alaska economy in 2016.
ANCSA Corporations also invest in Alaska. Today, ANCs often represent a market for successful Alaska companies – capital financing that previously was not present in the Alaska economy. From a real estate perspective, many of Alaska’s most significant real estate developments have occurred through Native Corporation investment. ANCSA Regional Corporations have invested nearly $1 billion in Alaska real estate development, another very key indicator of our commitment to Alaska.
IMPACT ON THE U.S. ECONOMYANCSA Regional Corporations also benefit the U.S. economy by creating jobs and business activity in many other states and territories. In fact, when considering the next nine states in which our companies operate, ANCSA Regional Corporations account for $3 billion in revenues, employing 19,312 non-Alaska-based employees, with an annual payroll of over $1 billion. While Alaska’s Regional Native Corporations play a vital role in Alaska’s economy, they play an important role in the economy of many other states as well. Please refer to page 7 to view a more in-depth analysis of the role Alaska Regional Native Corporations play throughout the U.S. economy.
9

Total Revenue(in billions)
8(a) Contract Revenue(in billions)
0
2
4
6
8
10
2015 2016201420132012
71.5%
28.5%
75.1%
24.9%75.5%
24.5%
65.0%
35.0%69.2%
30.8%
TOTAL REVENUES(in billions)
The land is part of who we are. Most ANCSA shareholders see gaining fee simple title to 44 million acres, 12% of Alaska, as the most important accomplishment of ANCSA. Therefore, unless developed, ANCSA Corporations do not carry the value of the land on their company’s balance sheets. However, this also significantly limits the borrowing power of ANCSA Corporations. If each acre was valued at a low $1,000, the total value of the land would be roughly worth $44 billion. For any corporation to intentionally reduce its assets by billions is a very strong commitment to protecting the real accomplishment of ANCSA, resolving bonafide Alaska Native land claims.
Stock in ANCSA Corporations cannot be traded, and ownership in an ANCSA Corporation cannot be bought or sold. When ANCSA was passed in 1971, shares were intentionally restricted to Alaska Native people of one-quarter Alaska Native blood quantum and alive on December 18, 1971. On a preset review of ANCSA in 1991, stockholders voted to continue the prohibition on trading ANCSA Corporations shares. While the key concern was to prevent control of the companies from being eroded away from Alaska Native people, the rule has had another important consequence – ANCSA Corporations can take a long-term view to their businesses as opposed to the quarterly or three to five year view many publicly-traded companies are forced to take.
Alaska Native Corporations have been in business for 46 years, but have not always been the success story they are today. ANCSA was an entirely new concept. It took time for Alaska Native people to adapt to a new corporate model, and the new law had to be fine-tuned as the companies moved forward. Two programs were implemented to help ANCs become sustainable enterprises. Between 1986 and 1988, ANCs were allowed to sell company net operating losses (as all companies had been allowed to do prior
HAT EVERYONE SHOULD KNOW ABOUT ANCSA CORPORATIONSW
10

WHO OWNS ALASKA
Private
Native Corporations
State
Other Federal
National Conservation Systems
12%
28%
19%
40%
1%
0
40%
80%
120%
160%
2015201420132012 2016
BUILDING SHAREHOLDER CAPACITY
Dividends Paid to Shareholders as percent of Net Income
Scholarship Funds Awarded as percent of Net Income
Donations to Native Non-Profit Efforts as percent of Net Income
Average Capacity Payments to Shareholders as percent of Net IncomeAverage Dividends Paid to Shareholders as percent of Net Income
to 1986) to enable profitable companies to reduce tax liabilities as a way to provide about $450 million in new cash injections into the ANCs.
In the 1990s, minority federal contracting was opened to ANCs under modified rules, called 8(a), which recognized the unique nature of its shareholders. Alaska Native Corporations have been successful in this endeavor. As was intended by the 8(a) program, many Native Corporation-owned companies have graduated from the 8(a) program to become vital and competitive companies in their own right. In 2012, 8(a) revenues were $3.1 billion and by 2016, this figure had been reduced to $2.0 billion, without significantly impacting total revenue, representing a 36% reduction in 8(a) revenues in the last five years.
No casinos here. ANCSA Regional Corporations don’t own Indian casinos. ANCs have owned a resort complex in Las Vegas that included gaming, but this was done under the same rules and regulations all companies would be required to meet.
11

“Halfway through 2017, it is evident that Anchorage’s economy, as measured by total employment, continues to retreat from its 2015 peak. The latest available estimates place Anchorage employment down about three percent over the past two years, with the Professional and Business Services, Oil & Gas, Construction, and State Government sectors continuing to bear the brunt of local job losses.” (Source: Anchorage Economic Development Corporation 3-Year Outlook Report, 2017) Similar to Texas and Louisiana, Alaska’s economy is often counter-cyclical to the U.S. economy due to its dependence on the oil and gas industry—when oil prices are high, oil states do well; when oil prices are low, energy-dependent states and industries do well.
An additional negative force acting on ANCSA Corporation revenues is a significantly scaling back in Alaska State spending, particularly capital spending, due to a drastic drop in oil tax revenues to the State of Alaska. Since the State of Alaska has well over $50.0 billion in financial reserves, these reductions in state spending are due more to a political standoff on how to resolve Alaska’s fiscal challenges going forward than due to an inability to pay for government spending.
In particular, downturns in the mining (oil and gas) sector of the economy often lead to a reduction in oil and gas jobs, professional and business services, and construction jobs. ANCSA Regional Corporations are invested significantly in providing these capabilities to the oil and gas industry. Since many ANCSA Regional Corporations provide construction and professional services to state capital projects, this has also contributed to the 2016 reduction in total revenues. As a result, our 2016 revenues taken in the aggregate across all twelve Regional Corporations are down 5.6% from 2015, and down 8.3% over the five years of data presented in this report.
EATHERING ALASKA’S RECESSIONW
12

13

2011 - 2015 Financial Analysis 2011 2012 2013 2014 2015Percentage Change
from 2014Averages 2011 -
20152015 as percentage
of AveragePercentage Change
over 5 years
Total Revenue $ 8,455,926,848 $ 8,972,864,816 $ 8,498,897,183 $ 8,575,078,089 $ 8,714,490,866 1.6% $ 8,643,451,560 100.8% 3.1%
8(a) Contract Revenue $ 3,020,641,783 $ 3,139,378,700 $ 2,614,078,317 $ 2,443,185,620 $ 2,176,928,741 -10.9% $ 2,678,842,632 81.3% -27.9%
8(a) Revenue as per cent of Total Revenue 35.7% 35.0% 30.8% 28.5% 25.0% -12.3% 31.0% 80.6% -30.1%
Total Net Income $ 250,811,171 $ 270,879,859 $ 153,695,975 $ 304,953,947 $ 240,795,534 -21.0% $ 244,227,297 98.6% -4.0%
Profit Margin 3.0% 3.0% 1.8% 3.6% 2.8% -22.3% 2.8% 97.8% -6.8%
Total Assets $ 6,108,481,052 $ 6,426,656,335 $ 6,175,478,080 $ 6,680,563,275 $ 6,716,964,325 0.5% $ 6,421,628,613 104.6% 10.0%
Return on Assets 4.1% 4.2% 2.5% 4.6% 3.6% -21.5% 3.8% 94.3% -12.7%
Total Asset Turnover 1.4 1.4 1.4 1.3 1.3 1.1% 1.4 96.4% -6.3%
Total Shareholder Equity $ 3,613,403,930 $ 3,845,123,091 $ 3,790,890,072 $ 4,116,887,086 $ 4,090,718,403 -0.6% $ 3,891,404,516 105.1% 13.2%
Shareholder Equity as per cent of Total Assets 59.2% 59.8% 61.4% 61.6% 60.9% -1.2% 60.6% 100.5% 3.0%
Return on Equity 6.9% 7.0% 4.1% 7.4% 5.9% -20.5% 6.3% 93.8% -15.2%
Total Debt Ratio 40.9% 40.2% 38.6% 38.4% 39.1% 1.9% 39.4% 99.2% -4.3%
Debt to Equity Ratio 69.1% 67.1% 62.9% 62.3% 64.2% 3.1% 65.0% 98.7% -7.0%
Equity Multiplier 1.7 1.7 1.6 1.6 1.6 1.2% 1.7 99.5% -2.9%
Total 7 (i) Distributions Paid $ 93,587,000 $ 131,770,000 40.8% $ 112,678,500 116.9%
Total Dividends Paid to Shareholders $ 162,597,825 $ 165,862,349 $ 204,997,354 $ 155,779,801 $ 167,344,927 7.4% $ 171,316,451 97.7% 2.9%
Total Dividends as per cent of Net Income 64.8% 61.2% 133.4% 51.1% 69.5% 36.1% 70.2% 99.1% 7.2%
Total Scholarship Funds Awarded $ 6,619,757 $ 7,652,528 $ 7,656,962 $ 6,365,679 $ 7,098,919 11.5% $ 7,078,769 100.3% 7.2%
Scholarships as a per cent of Net Income 2.6% 2.8% 5.0% 2.1% 3.0% 41.2% 2.9% 101.7% 11.7%
Donations to Native non profit efforts $ 18,692,168 $ 22,871,882 $ 20,436,642 $ 16,281,172 $ 15,652,533 -3.90% $ 18,786,879 83.3% -16.3%
Donations to Native non profit efforts as per cent of Net Income 7.5% 8.4% 13.3% 5.3% 6.5% 21.8% 7.7% 84.5% -12.8%
Donations to non-Native Charities $ 1,904,229 $ 1,837,829 $ 1,491,683 $ 1,946,658 $ 1,571,833 -19.3% $ 1,750,446 89.8% -17.5%
non-Native Charitable Giving as per cent of Net Income 0.8% 0.7% 1.0% 0.6% 0.7% 2.3% 0.7% 91.1% -14.0%
Percent of Net Income Paid Out in Dividends, Scholarships and Non-Profit Contributions 75.7% 73.2% 152.6% 59.2% 79.6% 34.6% 80.7% 97.9% 5.2%
INANCIAL RESULTSFTotal revenues for 2016 were $8.2 billion, down 5.6% from the previous year, off 8.3% from five years earlier, and representing 95.7% of the five-year average for total revenue earned by the twelve ANCSA Regional Corporations.
8(a) revenues for 2016 were $2.0 billion off 7.6% from 2015, representing 81.2% of the five-year average. However, these reductions in revenue are not due to the downturn in the Alaska economy from low oil prices. Rather, this reduction of 36% in 8(a) revenues over the last five years represents two key factors. First, ANCSA Regional Corporations have been graduating from the 8(a) programs as was intended. ANCs have become viable companies competing successfully against other well-established government contractors. A second factor is a conscious effort by many ANCs to reduce their portfolios on these revenues due to the politically volatile nature of this business space.
Net income also took a significant hit in 2016. The aggregate net income for the twelve ANCSA Regional Corporations was $107.3 million off 55.4% from 2015, representing just 49.8% of the five-year average. This significant reduction was due in large part from impacts from one of the historically star performers among the twelve Regional Corporations heavily invested in the oil and gas industry.
Assets have continued to grow. In 2016, total assets were $7.0 billion, a 4.8% increase from the previous year and a 9.5% increase across the five years of this report. Return on assets, due to significant reductions in net income, declined 57.6% from the previous year and was only 46.4% of the five-year average.
Profit margin for 2016 was 1.3%, off significantly from our
five-year average of 2.5%. It is important to remember that ANCSA Regional Corporations hold as their highest obligation to assure benefits to shareholders are as stable as possible. In 2016, ANCSA Regional Corporations paid out 193.6% of net income in dividends, scholarships, and contributions to non-profit organizations.
Shareholder equity has continued to grow over the five years of this report. In 2016, shareholder equity was $4.1 billion, 102.1% of the five-year average and representing a 5.7% increase since 2012. ANCSA Regional Corporation management works hard to balance long-term growth in equity with near term dividend payments to shareholders. While management recognizes that large dividends, and continued investment in scholarships and Native non-profits slows corporation growth, shareholders have expressed a strong need for benefits in the short term. Many shareholders live in rural Alaska where cash dividends are vital to support subsistence hunting activities or other cash needs like utility payments. And investment in scholarships and Native non-profits help prepare the ANCSA work force of the future.
7(i) Distributions Provision 7(i) of the Alaska Native Claims Settlement Act is a unique agreement among all ANCSA Corporations to share in the earnings from natural resource development. 7(i) revenues measure the amount of income stemming from natural resource development that is redistributed among the other Regional Corporations. And, since Regional Corporations hold the subsurface rights to all Village Corporation land, 50% of these 7(i) distributions are provided to the Village Corporations within each region. Distributions related to the 7(i) provision in 2016 were $67.7 million. These distributions often represent a very important source of revenue for many of the ANCSA Village Corporations.
14

2011 - 2015 Financial Analysis 2011 2012 2013 2014 2015Percentage Change
from 2014Averages 2011 -
20152015 as percentage
of AveragePercentage Change
over 5 years
Total Revenue $ 8,455,926,848 $ 8,972,864,816 $ 8,498,897,183 $ 8,575,078,089 $ 8,714,490,866 1.6% $ 8,643,451,560 100.8% 3.1%
8(a) Contract Revenue $ 3,020,641,783 $ 3,139,378,700 $ 2,614,078,317 $ 2,443,185,620 $ 2,176,928,741 -10.9% $ 2,678,842,632 81.3% -27.9%
8(a) Revenue as per cent of Total Revenue 35.7% 35.0% 30.8% 28.5% 25.0% -12.3% 31.0% 80.6% -30.1%
Total Net Income $ 250,811,171 $ 270,879,859 $ 153,695,975 $ 304,953,947 $ 240,795,534 -21.0% $ 244,227,297 98.6% -4.0%
Profit Margin 3.0% 3.0% 1.8% 3.6% 2.8% -22.3% 2.8% 97.8% -6.8%
Total Assets $ 6,108,481,052 $ 6,426,656,335 $ 6,175,478,080 $ 6,680,563,275 $ 6,716,964,325 0.5% $ 6,421,628,613 104.6% 10.0%
Return on Assets 4.1% 4.2% 2.5% 4.6% 3.6% -21.5% 3.8% 94.3% -12.7%
Total Asset Turnover 1.4 1.4 1.4 1.3 1.3 1.1% 1.4 96.4% -6.3%
Total Shareholder Equity $ 3,613,403,930 $ 3,845,123,091 $ 3,790,890,072 $ 4,116,887,086 $ 4,090,718,403 -0.6% $ 3,891,404,516 105.1% 13.2%
Shareholder Equity as per cent of Total Assets 59.2% 59.8% 61.4% 61.6% 60.9% -1.2% 60.6% 100.5% 3.0%
Return on Equity 6.9% 7.0% 4.1% 7.4% 5.9% -20.5% 6.3% 93.8% -15.2%
Total Debt Ratio 40.9% 40.2% 38.6% 38.4% 39.1% 1.9% 39.4% 99.2% -4.3%
Debt to Equity Ratio 69.1% 67.1% 62.9% 62.3% 64.2% 3.1% 65.0% 98.7% -7.0%
Equity Multiplier 1.7 1.7 1.6 1.6 1.6 1.2% 1.7 99.5% -2.9%
Total 7 (i) Distributions Paid $ 93,587,000 $ 131,770,000 40.8% $ 112,678,500 116.9%
Total Dividends Paid to Shareholders $ 162,597,825 $ 165,862,349 $ 204,997,354 $ 155,779,801 $ 167,344,927 7.4% $ 171,316,451 97.7% 2.9%
Total Dividends as per cent of Net Income 64.8% 61.2% 133.4% 51.1% 69.5% 36.1% 70.2% 99.1% 7.2%
Total Scholarship Funds Awarded $ 6,619,757 $ 7,652,528 $ 7,656,962 $ 6,365,679 $ 7,098,919 11.5% $ 7,078,769 100.3% 7.2%
Scholarships as a per cent of Net Income 2.6% 2.8% 5.0% 2.1% 3.0% 41.2% 2.9% 101.7% 11.7%
Donations to Native non profit efforts $ 18,692,168 $ 22,871,882 $ 20,436,642 $ 16,281,172 $ 15,652,533 -3.90% $ 18,786,879 83.3% -16.3%
Donations to Native non profit efforts as per cent of Net Income 7.5% 8.4% 13.3% 5.3% 6.5% 21.8% 7.7% 84.5% -12.8%
Donations to non-Native Charities $ 1,904,229 $ 1,837,829 $ 1,491,683 $ 1,946,658 $ 1,571,833 -19.3% $ 1,750,446 89.8% -17.5%
non-Native Charitable Giving as per cent of Net Income 0.8% 0.7% 1.0% 0.6% 0.7% 2.3% 0.7% 91.1% -14.0%
Percent of Net Income Paid Out in Dividends, Scholarships and Non-Profit Contributions 75.7% 73.2% 152.6% 59.2% 79.6% 34.6% 80.7% 97.9% 5.2%
TOTAL SHAREHOLDER EQUITY AND ASSETS(in billions)
2015201420132012 2016
3
0
4
5
6
7
8
Shareholder Equity
Shareholder Assets
Return to ANCSA Shareholders and Descendants is a unique measure of ANCSA Regional Corporations that considers the percentage of net income each year that goes directly into funding dividends to shareholders, scholarships, and contributions to Native non-profit corporations. These returns are measured in both real dollar terms and as a percentage of net income. On average for the last five years, ANCSA Regional Corporations have paid out 110.9% of net income to shareholders and descendants in the form of direct dividends, scholarships and contributions to Native non-profit corporations, which deliver the bulk of social services in their regions. In 2016, $207.8 million, 193.6% of net income, went to these three categories, roughly 268% of the five-year average. Arguably, no other corporation, or group of corporations anywhere in the world, returns as large a percentage of net income directly back to its shareholders as do ANCSA Regional Corporations.
15
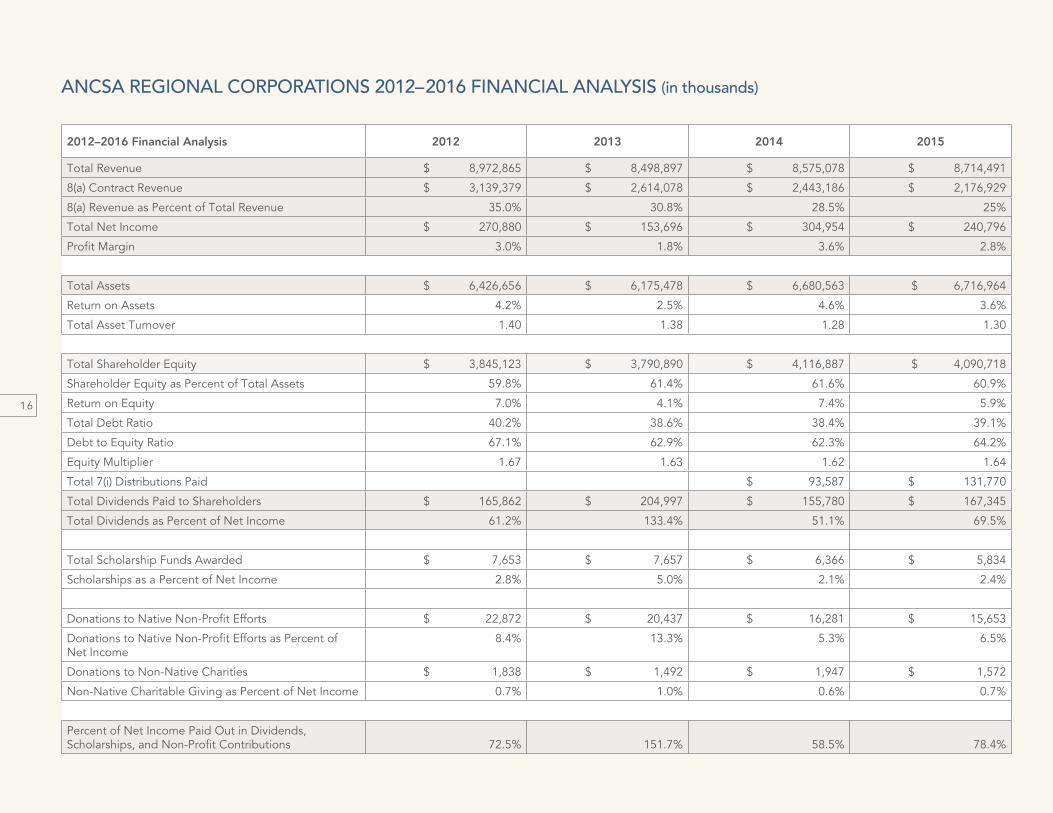
ANCSA REGIONAL CORPORATIONS 2012–2016 FINANCIAL ANALYSIS (in thousands)
2012–2016 Financial Analysis 2012 2013 2014 2015 2016Percentage Change
from 2015Averages 2012–2016
2016 as Percentage of Average
Percentage Change Over 5 Years
Total Revenue $ 8,972,865 $ 8,498,897 $ 8,575,078 $ 8,714,491 $ 8,224,808 -5.6% $ 8,597,228 95.7% -8.3%
8(a) Contract Revenue $ 3,139,379 $ 2,614,078 $ 2,443,186 $ 2,176,929 $ 2,010,565 -7.6% $ 2,476,827 81.2% -36.0%
8(a) Revenue as Percent of Total Revenue 35.0% 30.8% 28.5% 25% 24.5% -2.1% 28.7% 85.1% -30.1%
Total Net Income $ 270,880 $ 153,696 $ 304,954 $ 240,796 $ 107,323 -55.4% $ 215,530 49.8% -60.4%
Profit Margin 3.0% 1.8% 3.6% 2.8% 1.3% -53.0% 2.5% 52.2% -56.9%
Total Assets $ 6,426,656 $ 6,175,478 $ 6,680,563 $ 6,716,964 $ 7,040,061 4.8% $ 6,607,945 106.5% 9.5%
Return on Assets 4.2% 2.5% 4.6% 3.6% 1.5% -57.6% 3.3% 46.4% -63.9%
Total Asset Turnover 1.40 1.38 1.28 1.30 1.17 -10.0% 1.30 89.6% -16.3%
Total Shareholder Equity $ 3,845,123 $ 3,790,890 $ 4,116,887 $ 4,090,718 $ 4,064,072 -0.7% $ 3,981,538 102.1% 5.7%
Shareholder Equity as Percent of Total Assets 59.8% 61.4% 61.6% 60.9% 57.7% -5.2% 60.3% 95.7% -3.5%
Return on Equity 7.0% 4.1% 7.4% 5.9% 2.6% -55.2% 5.4% 48.8% -62.5%
Total Debt Ratio 40.2% 38.6% 38.4% 39.1% 42.3% 8.1% 39.7% 106.5% 5.2%
Debt to Equity Ratio 67.1% 62.9% 62.3% 64.2% 73.2% 14.1% 65.9% 111.0% 9.1%
Equity Multiplier 1.67 1.63 1.62 1.64 1.73 5.5% 1.66 104.4% 3.6%
Total 7(i) Distributions Paid $ 93,587 $ 131,770 $ 67,653 -48.7% $ 58,602 115.4%
Total Dividends Paid to Shareholders $ 165,862 $ 204,997 $ 155,780 $ 167,345 $ 160,460 -4.1% $ 170,889 93.9% -3.3%
Total Dividends as Percent of Net Income 61.2% 133.4% 51.1% 69.5% 149.5% 115.1% 92.9% 160.9% 144.2%
Total Scholarship Funds Awarded $ 7,653 $ 7,657 $ 6,366 $ 5,834 $ 7,654 31.2% $ 7,033 108.8% 0.03%
Scholarships as a Percent of Net Income 2.8% 5.0% 2.1% 2.4% 7.1% 194.4% 3.9% 183.4% 152.5%
Donations to Native Non-Profit Efforts $ 22,872 $ 20,437 $ 16,281 $ 15,653 $ 39,650 153.3% $ 22,978 172.6% 73.4%
Donations to Native Non-Profit Efforts as Percent of Net Income
8.4% 13.3% 5.3% 6.5% 36.9% 468.4% 14.1% 261.9% 337.6%
Donations to Non-Native Charities $ 1,838 $ 1,492 $ 1,947 $ 1,572 $ 1,264 -19.6% $ 1,370 92.3% -31.2%
Non-Native Charitable Giving as Percent of Net Income 0.7% 1.0% 0.6% 0.7% 1.2% 80.4% 0.6% 200.3% 73.6%
Percent of Net Income Paid Out in Dividends, Scholarships, and Non-Profit Contributions 72.5% 151.7% 58.5% 78.4% 193.6% 146.9% 110.9% 174.5% 167.0%
16

2012–2016 Financial Analysis 2012 2013 2014 2015 2016Percentage Change
from 2015Averages 2012–2016
2016 as Percentage of Average
Percentage Change Over 5 Years
Total Revenue $ 8,972,865 $ 8,498,897 $ 8,575,078 $ 8,714,491 $ 8,224,808 -5.6% $ 8,597,228 95.7% -8.3%
8(a) Contract Revenue $ 3,139,379 $ 2,614,078 $ 2,443,186 $ 2,176,929 $ 2,010,565 -7.6% $ 2,476,827 81.2% -36.0%
8(a) Revenue as Percent of Total Revenue 35.0% 30.8% 28.5% 25% 24.5% -2.1% 28.7% 85.1% -30.1%
Total Net Income $ 270,880 $ 153,696 $ 304,954 $ 240,796 $ 107,323 -55.4% $ 215,530 49.8% -60.4%
Profit Margin 3.0% 1.8% 3.6% 2.8% 1.3% -53.0% 2.5% 52.2% -56.9%
Total Assets $ 6,426,656 $ 6,175,478 $ 6,680,563 $ 6,716,964 $ 7,040,061 4.8% $ 6,607,945 106.5% 9.5%
Return on Assets 4.2% 2.5% 4.6% 3.6% 1.5% -57.6% 3.3% 46.4% -63.9%
Total Asset Turnover 1.40 1.38 1.28 1.30 1.17 -10.0% 1.30 89.6% -16.3%
Total Shareholder Equity $ 3,845,123 $ 3,790,890 $ 4,116,887 $ 4,090,718 $ 4,064,072 -0.7% $ 3,981,538 102.1% 5.7%
Shareholder Equity as Percent of Total Assets 59.8% 61.4% 61.6% 60.9% 57.7% -5.2% 60.3% 95.7% -3.5%
Return on Equity 7.0% 4.1% 7.4% 5.9% 2.6% -55.2% 5.4% 48.8% -62.5%
Total Debt Ratio 40.2% 38.6% 38.4% 39.1% 42.3% 8.1% 39.7% 106.5% 5.2%
Debt to Equity Ratio 67.1% 62.9% 62.3% 64.2% 73.2% 14.1% 65.9% 111.0% 9.1%
Equity Multiplier 1.67 1.63 1.62 1.64 1.73 5.5% 1.66 104.4% 3.6%
Total 7(i) Distributions Paid $ 93,587 $ 131,770 $ 67,653 -48.7% $ 58,602 115.4%
Total Dividends Paid to Shareholders $ 165,862 $ 204,997 $ 155,780 $ 167,345 $ 160,460 -4.1% $ 170,889 93.9% -3.3%
Total Dividends as Percent of Net Income 61.2% 133.4% 51.1% 69.5% 149.5% 115.1% 92.9% 160.9% 144.2%
Total Scholarship Funds Awarded $ 7,653 $ 7,657 $ 6,366 $ 5,834 $ 7,654 31.2% $ 7,033 108.8% 0.03%
Scholarships as a Percent of Net Income 2.8% 5.0% 2.1% 2.4% 7.1% 194.4% 3.9% 183.4% 152.5%
Donations to Native Non-Profit Efforts $ 22,872 $ 20,437 $ 16,281 $ 15,653 $ 39,650 153.3% $ 22,978 172.6% 73.4%
Donations to Native Non-Profit Efforts as Percent of Net Income
8.4% 13.3% 5.3% 6.5% 36.9% 468.4% 14.1% 261.9% 337.6%
Donations to Non-Native Charities $ 1,838 $ 1,492 $ 1,947 $ 1,572 $ 1,264 -19.6% $ 1,370 92.3% -31.2%
Non-Native Charitable Giving as Percent of Net Income 0.7% 1.0% 0.6% 0.7% 1.2% 80.4% 0.6% 200.3% 73.6%
Percent of Net Income Paid Out in Dividends, Scholarships, and Non-Profit Contributions 72.5% 151.7% 58.5% 78.4% 193.6% 146.9% 110.9% 174.5% 167.0%
17

N T R O D U C I N G
T H E A N C S A
R E G I O N A L
C O R P O R A T I O N S
I
18

19
VISIONOur Culture Unites Us; Our Land Sustains Us; Our People are Prosperous..
MISSIONWise stewardship of Ahtna lands and responsible economic growth for future generations of Ahtna people.
NUMBER OF SHAREHOLDERS 1,991
LANDHOLDINGSAlong with regional entitlements, Ahtna manages a total land area of approximately 1.5 million acres. In addition, Ahtna, Inc. owns 622,000 acres within Denali National Park and the Wrangell-St. Elias National Park and Preserve.
GEOGRAPHY OF REGIONThe Ahtna region encompasses the Copper River Basin and the Wrangell Mountains and is bordered by the Mentasta and Nutzotin Mountains to the northeast, the Alaska Range to the north, the Talkeetna Mountains to the west, and the Chugach Mountains to the south. The Ahtna region is considered to be one of the most beautiful places in Alaska. The region includes eight villages: Cantwell, Chistochina, Chitina, Copper Center (Kluti-Kaah), Gakona, Gulkana, Mentasta, and Tazlina.
BUSINESS ACTIVITIESConstruction and Engineering Services • Facilities Support Services •
Environmental Remediation • Janitorial Services • Detention and Security Guard Services • Oil and Gas Services • Marine/Dredging • Food Services •
Property Management • Natural Resource Development • Records Management • Training Range Operations • Logistics
Ahtna, Incorporated
ahtna-inc.com

Choices
aleutcorp.com
VISIONThe Corporation is committed to promoting economic, cultural, and social growth for its shareholders through its subsidiaries, partnerships, and foundation.
MISSIONThe Aleut Corporation’s mission is to maximize dividends and opportunities for our shareholders.
NUMBER OF SHAREHOLDERS 4,009
LANDHOLDINGSThe Aleut Region starts in the east at Sand Point and stretches over a thousand miles along the Aleutian Chain to Attu in the west and to the Pribilofs to the north. The Aleut Corporation manages 66,000 acres of surface lands and 1.572 million acres of subsurface estate.
GEOGRAPHY OF REGIONThe Aleut people live and subsist in one of the harshest and most beautiful parts of the world. Centered in the Ring of Fire with over 45 volcanoes, the region encompasses over 167 named islands in the five major island groups, which are the Fox Islands, Islands of Four Mountains, Andreanof Islands, Rat Islands, Near Islands, and the Eastern Islands, south of the Alaska Peninsula. Unimak Island is the eighth largest island in the United States, with Unalaska Island being the 13th largest.
BUSINESS ACTIVITIESGovernment Contracting • Fuel/Energy Sales and Operations • Real Estate Investment • Commercial Property Rentals • Finance, Investments, and Joint Ventures • Environmental Laboratory Services • Water Testing • Hazardous Waste Remediation • Mechanical Engineering • Oil Drilling Testing
20

21
MISSIONASRC’s mission is to actively manage our businesses, our lands and resources, our investments, and our relationships to enhance Iñupiaq cultural and economic freedom - with continuity, responsibility, and integrity.
NUMBER OF SHAREHOLDERS 12,493
LANDHOLDINGSASRC owns title to nearly 5 million acres of land on Alaska’s North Slope. A majority of the Corporation’s Iñupiat Eskimo shareholders live in the villages of Point Hope, Point Lay, Wainwright, Atqasuk, Barrow, Nuiqsut, Kaktovik, and Anaktuvuk Pass.
GEOGRAPHY OF REGIONASRC shareholders live primarily in eight villages on Alaska’s North Slope, above the Arctic Circle. This is one of the most isolated and challenging environments in the United States.
BUSINESS ACTIVITIESGovernment Services • Petroleum Refining and Marketing • Energy Support Services • Industrial Services • Construction • Resource Development •
Financial and Lending Services • Local Services • Tourism
asrc.com

beringstraits.com
VISIONOn the edge of tomorrow, we cast our vision to the future. We strive to empower our people as leaders in the development and protection of the Arctic region.
MISSIONOur mission is to improve the quality of life of our people through economic development while protecting our land and preserving our culture and heritage.
NUMBER OF SHAREHOLDERS 7,703
LANDHOLDINGSBSNC’s lands are comprised of nearly two million acres of tundra and alpine tundra. Within the region, 17 Alaska Native Village Corporations own the surface estate of BSNC’s subsurface interest and BSNC holds an additional 145,000 acres of fee simple (surface and subsurface) land throughout the area.
GEOGRAPHY OF REGIONThe Bering Straits region encompasses the majority of Alaska’s Seward Peninsula and the coastal lands of eastern Norton Sound. This region forms the eastern border of Bering Strait, the 50-mile-wide body of water separating North America from eastern Eurasia and is the gateway to the Northern Sea Route and the Northwest Passage. Just miles from the International Date Line, BSNC is geographically situated on the edge of tomorrow.
BUSINESS ACTIVITIESBase Operations Support • Environmental Remediation • Logistics and Procurement • Information Technology • Professional Support • Security Training • Government Services • Arctic Development and Commerce •
Construction and Construction Hardware • Tourism
22

bbnc.com
23
VISIONTo protect the land in the Bristol Bay region, celebrate the legacy of its people, and enhance the lives of BBNC Shareholders.
MISSIONEnriching our Native way of life.
NUMBER OF SHAREHOLDERS 10,350
LANDHOLDINGSThe Bristol Bay region is equal in size to the state of Oklahoma. BBNC manages more than three million acres of surface and subsurface estate on behalf of its shareholders.
GEOGRAPHY OF REGIONThe region is home to three Native cultures – Eskimo, Indian and Aleut – each with its own distinct cultural traditions. The geography features spectacular landscapes, a fascinating and complex history, volcanoes, unspoiled wilderness, and diverse state and national parks and refuges. In addition to approximately 7,400 residents, Bristol Bay is home to abundant wildlife: 10,000 brown bears, 25,000 walrus, and 25 million salmon, plus fresh water seals, ospreys, eagles, and many other species.
Among the wide-open spaces are black sand beaches, mountain ranges, lowland tundra, wetlands, abundant flora and fauna, and many wild and scenic rivers. Iliamna Lake, located in the north of the region, is the largest freshwater lake in Alaska. The Bristol Bay villages are situated in the watersheds of the world-renowned Bristol Bay salmon fishery.
BUSINESS ACTIVITIESIndustrial Services • Construction • Government Services • Tourism
calistacorp.com
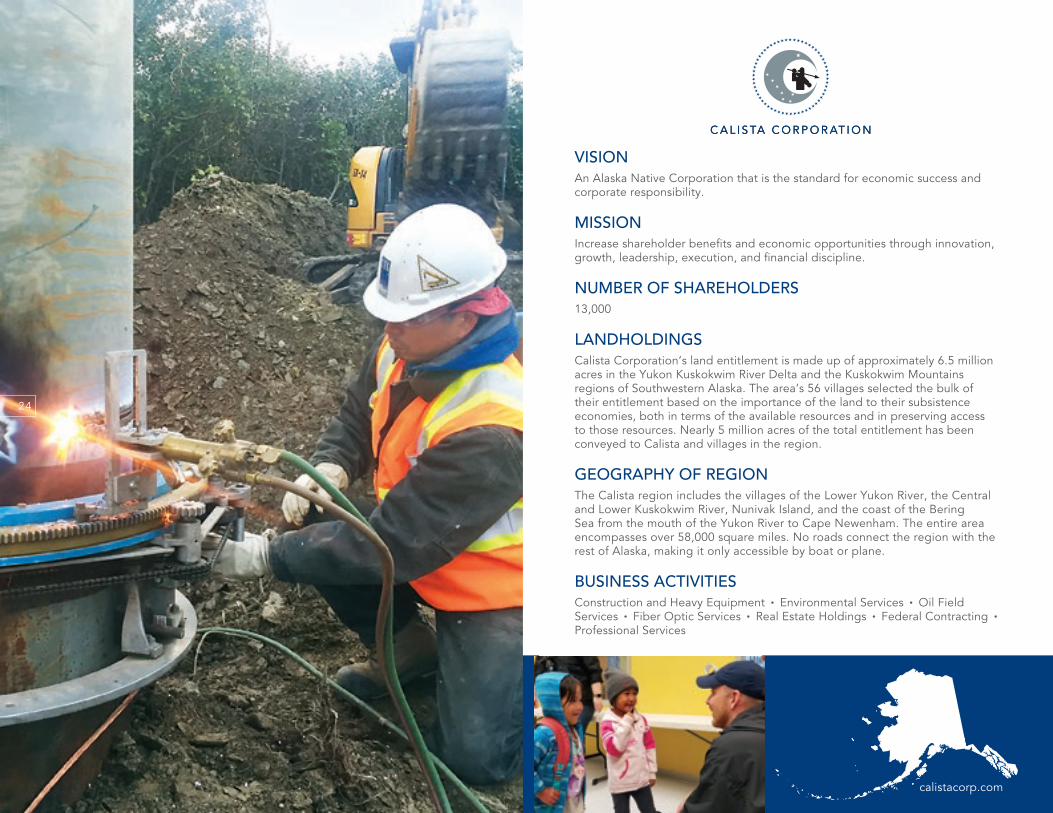
VISIONAn Alaska Native Corporation that is the standard for economic success and corporate responsibility.
MISSIONIncrease shareholder benefits and economic opportunities through innovation, growth, leadership, execution, and financial discipline.
NUMBER OF SHAREHOLDERS 13,000
LANDHOLDINGSCalista Corporation’s land entitlement is made up of approximately 6.5 million acres in the Yukon Kuskokwim River Delta and the Kuskokwim Mountains regions of Southwestern Alaska. The area’s 56 villages selected the bulk of their entitlement based on the importance of the land to their subsistence economies, both in terms of the available resources and in preserving access to those resources. Nearly 5 million acres of the total entitlement has been conveyed to Calista and villages in the region.
GEOGRAPHY OF REGIONThe Calista region includes the villages of the Lower Yukon River, the Central and Lower Kuskokwim River, Nunivak Island, and the coast of the Bering Sea from the mouth of the Yukon River to Cape Newenham. The entire area encompasses over 58,000 square miles. No roads connect the region with the rest of Alaska, making it only accessible by boat or plane.
BUSINESS ACTIVITIESConstruction and Heavy Equipment • Environmental Services • Oil Field Services • Fiber Optic Services • Real Estate Holdings • Federal Contracting •
Professional Services
24

chugach.com
25
MISSIONCommitted to profitability, celebration of our heritage, and ownership of our lands.
NUMBER OF SHAREHOLDERS 2,600
LANDHOLDINGSThe Chugach region comprises one million acres in southcentral Alaska. Chugach is entitled to 928,000 acres, of which 378,000 acres are full fee entitlement, and 550,000 acres are subsurface estate.
GEOGRAPHY OF REGIONThe Chugach region includes the communities of Cordova (Eyak), Seward, Valdez, Port Graham, Chenega Bay, Nanwalek (English Bay), and Tatitlek. Our region includes more than 5,000 miles of coastline along the southern tip of the Kenai Peninsula, through the Kenai Fjords, Prince William Sound, and Gulf of Alaska.
The lands of our region are rich in timber, minerals, and wildlife. The majestic fjords, bays, and waterways are home to a diverse population of fish, birds, and marine mammals, and the diverse landscape ranges from mountains and glaciers to dense forests of hemlock and spruce. Spectacular scenery and recreational activities are the focus of tourism opportunities.
BUSINESS ACTIVITIESGovernment Services • Facilities Services • Energy Services • Investments •
Land & Resource Development

ciri.com
VISIONA corporation rooted in the heritage and cultures of our shareholders, working toward a future where Alaska Native people thrive.
MISSIONThe mission of CIRI is to promote the economic and social well-being and Alaska Native heritage of our shareholders, now and into the future, through prudent stewardship of the company’s resources, while furthering self-sufficiency among CIRI shareholders and their families.
NUMBER OF SHAREHOLDERS 8,880
LANDHOLDINGSAs the largest private landowner in Southcentral Alaska with 600,000 surface acres and approximately 1.3 million acres of subsurface estate, CIRI seeks to responsibly harness the economic benefits of the region’s resources while ensuring those benefits help enrich future generations of CIRI shareholders. Much of CIRI’s prospective oil and gas acreage is currently under lease or exploration agreements, and CIRI works with companies exploring potential mineral resources throughout the region.
GEOGRAPHY OF REGIONThe Cook Inlet region approximates the traditional homeland of the Dena’ina Athabascan people who lived along the shores of Cook Inlet, or Tikahtnu as the Dena’ina knew it, taking advantage of the abundant salmon runs and other resources offered by the land, river, and sea. The region includes the following villages: Chickaloon, Eklutna, Knik, Ninilchik, Salamatof, Seldovia, and Tyonek.
BUSINESS ACTIVITIESReal Estate • Oilfield and Construction Services • Land and Natural Resources •
Energy and Infrastructure • Environmental Services • Government Contracting •
Private Equity and Marketable Securities
26

doyon.com
27
VISIONLeader in All We Do
MISSIONDoyon’s mission is to continually enhance our position as a financially strong Native corporation in order to promote the economic and social well-being of our shareholders and future shareholders, to strengthen our Native way of life, and to protect and enhance our land and resources.
NUMBER OF SHAREHOLDERS 19,700
LANDHOLDINGSWith a land entitlement of 12.5 million acres, Doyon, Limited is the largest private landowner in Alaska and one of the largest private landowners in North America.
GEOGRAPHY OF REGIONThe Doyon region encompasses a vast region in Interior Alaska, from the Brooks Range in the north to the Alaska Range, and from Alaska’s border with Canada in the east extending westward nearly to the shores of Norton Sound. As of October 2013, about 11.5 million acres have been conveyed, including 7.9 million acres in surface and subsurface estate (fee Owned) and 3.6 million acres of subsurface estate corresponding to surface estate owned by village corporations in the Doyon region.
BUSINESS ACTIVITIESOilfield Services • Utility Management • Telecommunications • Information Technology • Commercial Laundry • Engineering Management • Land and Natural Resource Development • Facility Management • Construction •
Tourism

koniag.com
VISIONCultural Pride, Corporate Excellence.
MISSIONTo maintain a financially strong and increasingly profitable Corporation that honors our culture by protecting our lands, advocating for our communities, and enriching the lives of our Shareholders and Descendants.
NUMBER OF SHAREHOLDERS 3,850
LANDHOLDINGSKoniag holds title to approximately 144,000 acres of surfaces estate and 990,000 acres of subsurface estate. Most of Koniag’s surface estate is on the west side of Kodiak Island, near the Sturgeon and Karluk Rivers. The Kodiak Island village corporations also received title to surface estate through ANCSA, scattered throughout Kodiak and Afognak Islands, and much of Koniag’s subsurface holdings are for those lands.
GEOGRAPHY OF REGIONThe Koniag region encompasses Kodiak Island, the Kodiak Archipelago, and an area of land on the southern coast on the Alaska Peninsula. Kodiak, nicknamed the “Emerald Isle,” is the second largest island in the United States. The lands of the Koniag region offer a stunning abundance of natural resources that have sustained the Alutiiq people for centuries.
BUSINESS ACTIVITIESGovernment Services • Information Technology Services • Energy and Water Services • Oilfield Services • Natural Resources • Tourism • Real Estate
28

nana.com
29
MISSIONWe improve the quality of life for our people by maximizing economic growth, protecting and enhancing our lands, and promoting healthy communities with decisions, actions, and behaviors inspired by our Iñupiat Ilitqusiat values consistent with our core principles.
NUMBER OF SHAREHOLDERS Approximately 14,000
LANDHOLDINGSVast and beautiful, the NANA region is roughly the size of Indiana and encompasses eleven villages: Ambler, Buckland, Deering, Kiana, Kivalina, Kobuk, Kotzebue, Noatak, Noorvik, Selawik, and Shungnak. NANA owns 2.28 million acres, or approximately 9.4 percent of the 24.3 million acres that comprise the region.
GEOGRAPHY OF REGIONThe NANA region encompasses 38,000 square miles located in Northwest Alaska, most of which is above the Arctic Circle and is considered “arctic desert.” Winter lasts nine months of the year, and temperatures often stay well below freezing for months. Rivers wind through the landscape and the terrain varies dramatically from mountains and sand dunes to tundra and boreal forests. Much of the region is designated as National Park land.
BUSINESS ACTIVITIESLand Management • Natural Resource Development • Engineering and Construction • IT and Telecom • Facilities Management and Logistics •
Real Estate and Hotel Development

sealaska.com
VISIONAn Alaska Native enterprise of excellence built on our cultural values
PURPOSETo strengthen our people, culture, and homelands
SEALASKA WAYUtilizing our Values In Action to increase profitability and build Alaska Native capacity
NUMBER OF SHAREHOLDERS 22,000
LANDHOLDINGSSealaska owns approximately 360,000 acres of surface estate and subsurface estate. In addition, Sealaska owns an additional 280,000 acres of only subsurface estate beneath village and urban corporation land.
GEOGRAPHY OF REGIONThe traditional homelands of the Tlingit, Haida, and Tsimshian people are the forests and coastline of Southeast Alaska, extending from Yakutat on the north to the Queen Charlotte Islands of British Columbia on the south. These traditional homelands represent approximately 22 million acres.
BUSINESS ACTIVITIESWater and Maritime Services: Sealaska Government Services • Sealaska Environmental Services • Sealaska Technical Services • Sealaska Constructors •
Sealaska Construction Solutions • Managed Business Solutions
Natural Resources: Aggregate Supply • Timber • Minerals • Haa Aaní Economic Development
Seafood and Natural Foods: Independent Packers Corporation (IPC) • Odyssey
30

ACKNOWLEDGMENTSThe ANCSA Regional Association exists to promote and foster the continued growth and economic strength of the Alaska Native Regional Corporations on behalf of their shareholders. The Board of Directors includes one representative from each of the 12 Alaska-based Native Regional Corporations as well as the Alaska Federation of Natives. These members represent the highest level of each corporation’s management.
AUTHORBob Poe is a partner at ICS Universal Consulting, a business leader and assistant professor of business strategy at the University of Alaska Anchorage. Poe was a consulting manager for global financial firms, led large economic development organizations, negotiated mergers and acquisitions and held top leadership roles in state government in his 30-year career in the private-public sectors. His focus is building a sustainable future for Alaska, its people and the corporations that do business in the 49th state. Poe holds a BS and an MBA in finance from the University of Missouri-St. Louis.
DATA The ANCSA Economic Report attempts to give an accurate picture of the economic performance of the twelve ANCSA Regional Native Corporations. We believe this annual report is the most comprehensive and factually correct that is available. This report involves aggregating self-reported financial data from twelve independent corporations. Factors like different annual reporting years (e.g., calendar vs. fiscal year), and variations in the recording and classification of financial activity results in some variance between data reported for the purpose of this report and similar data reported to the Alaska Business Monthly for their Top 49ers report. In general, the differences are not material.
PHOTOGRAPHYWe would like to thank the 12 Regional Corporations that provided photographs for this report. Cover photo by Nick Hall.
DESIGNArt direction and graphic design by

P. O . B O X 2 4 0 7 6 6
A N C H O R A G E , A L A S K A 9 9 5 2 4
9 0 7 . 3 7 5 . 4 2 1 2
A N C S A R E G I O N A L . C O M