cef & etf monthly newsletter -...
TRANSCRIPT
Capital Link’s CEF & ETF Monthly Newsletter
August 2013 Volume 1 | Issue 3
CEF Sector Review Lipper
• The Month in CEFs: July 2013........... • CEF Events & Corporate Actions......... • CEF Performance Statistics................. • Top 5 Performing CEFs........................
Wells Fargo Advisors • Closed-end Fund IPOs.........................
First Trust • Closed-End Fund Review: Second
Quarter 2013 by Jeff Margolin...........
ETP Sector Review BlackRock
• Global ETP Monthly Review................ • Global ETP Data & Statistics............... • Dividend Deluge, ETP Flows
Quarterly: July 2013...........................
CEF Commentaries Fitch Ratings
• NAV Declines Show Interest Rate Impact on Leveraged Municipal Closed-End Funds............................
First Trust • Discounts to NAV Indicate Real
Value, by Jeff Margolin....................... Wells Fargo Advisors
• Closed-End Funds with Finite Lives. Closed-End Fund Advisors, Inc.
• Understanding Volatility and Value in Closed-End Fund Based Portfolio, by John Cole Scott............
…your link with the Global Investment Community
ETF Commentaries ETF Securities
• Silver – Time to Shine from US$20? by Mike McGlone, CFA, FRM...............
S&P Capital IQ • Fidelity’s Move Into the ETF Market
by Todd Rosenbluth.......................... • Mid-Caps: Active vs. Index by Todd
Rosenbluth....................................... • Newer Equity ETFs Attract Investor
Interest by Tom Graves, CFA............
Market/Fund/Investment Commentaries Legg Mason
• Western Asset High Income Opportunity Fund Inc. (HIO)............
Aberdeen Asset Management • Implications of China’s cash crunch,
Monthly Commentary, July 2013..... Fund Updates...............................................
CEFs & ETPs Event Calendar Upcoming CEFs & Global ETF Webinars......... ETP Analyst Webinar
• October 1, 2013 at 11AM ET.............. CEFs & Global ETFs Webinar Library...............
Table of Contents
2 5 7 8 9 13
16 18 23
26 27 28 31
33
35 36 38
40
43 45
46 47 48
…your link with the Global Investment Community 2
Closed-End Fund Report
The Month in Closed-End Funds: July 2013 PERFORMANCE
At the beginning of July investors cheered a better-than-expected nonfarm payrolls
report that showed the economy adding 195,000 jobs in June, sending the market
higher and tanking Treasury prices. But the month wasn’t all smooth sailing for
equities. Interest-related issues came under fire on continued concerns of Federal
Reserve “tapering,” and oil prices jumped after the military ousted Egypt’s president
from office. Nonetheless, Lipper’s equity CEF macro-group posted plus- side returns
on both a NAV basis and a market basis, returning 2.91% and 2.04%, respectively.
Pulled down by continued rising-interest-rate fears and a bankruptcy filing by one of
the largest cities in the U.S. (Detroit), it wasn’t surprising to see fixed income CEFs
post their third consecutive month of negative returns, losing 0.74% on a NAV basis
and 3.99% on a market basis for July.
During the month investors turned their focus to second quarter earnings reports
after being somewhat placated by Fed Chairman Ben Bernanke’s assurances that
despite all the talk of “tapering,” the Fed would keep interest rates low for an
extended period. At month-end Thomson Reuters Proprietary Research team
reported that, of the 303 S&P 500 constituents that had reported second quarter
earnings so far, 69% had beaten their analyst forecasts. Despite Google, Intel, and
Microsoft each reporting earnings below analyst expectations, investors pushed the
major indices to all-time highs during the month, with the Dow Jones Industrial
Average (DJIA) reaching its twenty-eighth record close of the year, the S&P 500
posting its twenty-third record close for the year, and the NASDAQ (+6.56%) posting
its strongest monthly return since January 2012. Toward month-end the markets
were given a further boost by stronger-than-expected earnings from Apple and
Facebook. The DJIA returned 3.96% for July, while the S&P 500 produced a 4.95%
return for the month.
Mixed earnings and economic news put a cap on market returns toward month- end.
Investors kept an eye on the global market, with a special focus on signs of China’s
slowing factory output, Egypt’s growing unrest (and the impact on oil prices), and the
Eurozone’s impressive preliminary PMI data.
During the first half of the month Treasury prices remained on a roller-coaster ride,
whipsawed by news and Fed-tapering concerns. After coming off highs midmonth
Treasury yields softened a bit, but longer-dated issues still closed above their June
month-end close. Imminent tapering concerns sent the benchmark ten-year
Treasury yield to its highest close since August 2, 2011—jumping to 2.70% on July
10—before closing the month up 8 basis points (bps) at 2.60%. The 117-bp increase
in yield since its low on July 26, 2012 (1.43%) represents an amazing 82% increase
in yield in just a year. At maturities of seven years or greater the Treasury yield curve
shifted up , with the twenty- and thirty-year yields rising the most—12 bps to 3.34%
and 3.64%, respectively, on July 31. Much as in June, the selloff in Treasuries also
led to a significant selloff in municipal debt funds as investors contemplated the
Fed’s next move, future tax reforms, and the credit risk of municipalities—especially
after Detroit filed for Chapter 9 bankruptcy protection on July 15—for the nation’s
largest municipal bankruptcy case.
The Month in Closed-End Funds: July 2013
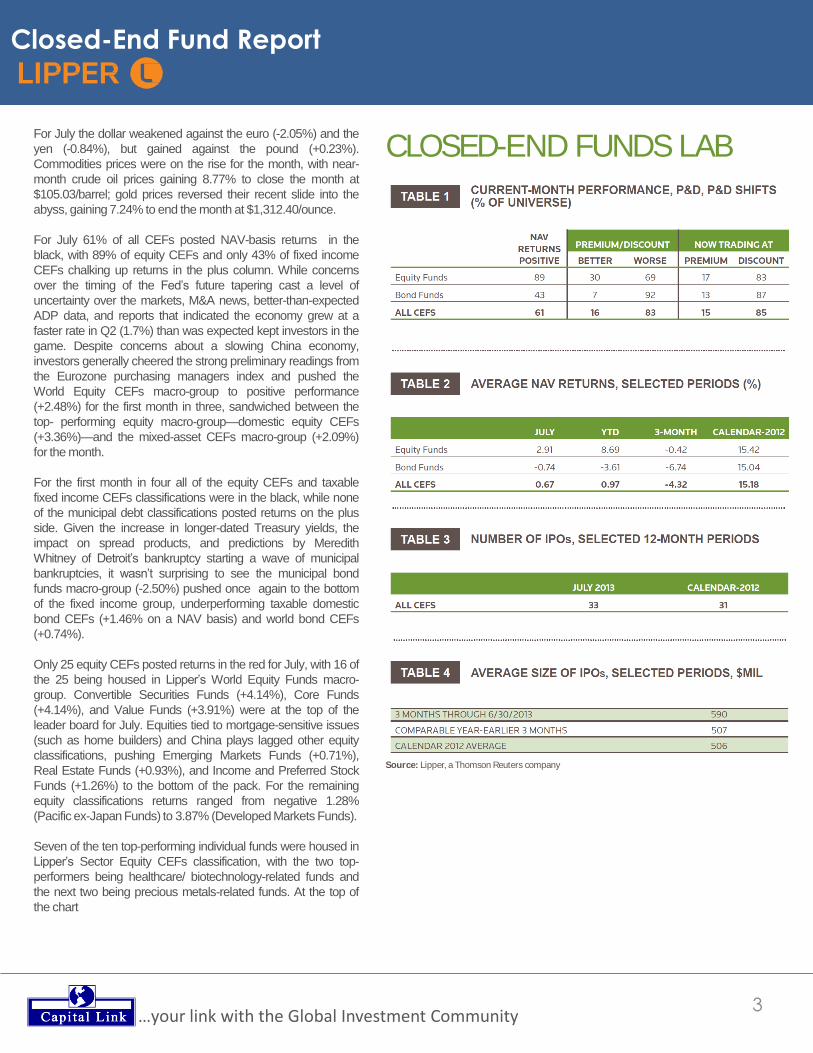
•For July only 15% of all closed-end funds (CEFs)
traded at a premium, with 17% of equity funds
and 13% of fixed income funds trading in
premium territory to their NAVs. None of the
Lipper CEF macro-groups witnessed a narrowing
of discounts in July.
•For the first month in four all of Lipper’s equity
CEF and taxable fixed income CEF
classifications were in the black.
•For the third consecutive month all of the
municipal bond fund groups posted returns in the
red, with national municipal bond funds (-2.48%)
mitigating losses slightly better than their single-
state municipal debt fund brethren (-2.52%).
•With China continuing to show some economic
weakness and with interest rate-sensitive issues
struggling, it wasn’t surprising to see Emerging
Market Funds (+0.71%), Real Estate Funds
(+0.93%), and Income & Preferred Stock Funds
(+1.26%) at the bottom of the equity universe in
July.
Authored by:
TOM ROSEEN HEAD OF RESEARCH
SERVICES
LIPPER, DENVER
3
Closed-End Fund Report
For July the dollar weakened against the euro (-2.05%) and the
yen (-0.84%), but gained against the pound (+0.23%).
Commodities prices were on the rise for the month, with near-
month crude oil prices gaining 8.77% to close the month at
$105.03/barrel; gold prices reversed their recent slide into the
abyss, gaining 7.24% to end the month at $1,312.40/ounce.
For July 61% of all CEFs posted NAV-basis returns in the
black, with 89% of equity CEFs and only 43% of fixed income
CEFs chalking up returns in the plus column. While concerns
over the timing of the Fed’s future tapering cast a level of
uncertainty over the markets, M&A news, better-than-expected
ADP data, and reports that indicated the economy grew at a
faster rate in Q2 (1.7%) than was expected kept investors in the
game. Despite concerns about a slowing China economy,
investors generally cheered the strong preliminary readings from
the Eurozone purchasing managers index and pushed the
World Equity CEFs macro-group to positive performance
(+2.48%) for the first month in three, sandwiched between the
top- performing equity macro-group—domestic equity CEFs
(+3.36%)—and the mixed-asset CEFs macro-group (+2.09%)
for the month.
For the first month in four all of the equity CEFs and taxable
fixed income CEFs classifications were in the black, while none
of the municipal debt classifications posted returns on the plus
side. Given the increase in longer-dated Treasury yields, the
impact on spread products, and predictions by Meredith
Whitney of Detroit’s bankruptcy starting a wave of municipal
bankruptcies, it wasn’t surprising to see the municipal bond
funds macro-group (-2.50%) pushed once again to the bottom
of the fixed income group, underperforming taxable domestic
bond CEFs (+1.46% on a NAV basis) and world bond CEFs
(+0.74%).
Only 25 equity CEFs posted returns in the red for July, with 16 of
the 25 being housed in Lipper’s World Equity Funds macro-
group. Convertible Securities Funds (+4.14%), Core Funds
(+4.14%), and Value Funds (+3.91%) were at the top of the
leader board for July. Equities tied to mortgage-sensitive issues
(such as home builders) and China plays lagged other equity
classifications, pushing Emerging Markets Funds (+0.71%),
Real Estate Funds (+0.93%), and Income and Preferred Stock
Funds (+1.26%) to the bottom of the pack. For the remaining
equity classifications returns ranged from negative 1.28%
(Pacific ex-Japan Funds) to 3.87% (Developed Markets Funds).
Seven of the ten top-performing individual funds were housed in
Lipper’s Sector Equity CEFs classification, with the two top-
performers being healthcare/ biotechnology-related funds and
the next two being precious metals-related funds. At the top of
the chart
CLOSED-END FUNDS LAB
Source: Lipper, a Thomson Reuters company
April 2013
…your link with the Global Investment Community
4
Closed-End Fund Report
was H&Q Healthcare Investors (NYSE: HQH), gaining 12.52%
on a NAV basis and traded at a 0.44% discount at month-end.
Following HQH were H&Q Life Sciences Investors (NYSE:
HQL), posting a 12.05% return and traded at a 1.62% discount
on July 31; ASA Gold & Precious Metals Limited (NYSE:
ASA, June’s laggard), rising 10.18% on a NAV basis and traded
at an 5.21% discount at month-end; Central GoldTrust
(AMEX: GTU), chalking up a 10.07% return and traded at a
3.01% discount at month-end; and BlackRock Health
Sciences Trust (NYSE: BME), rising 8.26% and traded at a
1.42% discount on July 31.
For the month the dispersion of performance in individual equity
CEFs—ranging from minus 8.21% to positive 12.52%—was
narrower than June’s spread and more positively skewed. The
20 top-performing equity funds posted returns in excess of
6.03%, while the 20 lagging funds were at or below minus
0.27%.
Given the concerns about the global economy, it wasn’t
surprising to see RENN Global Entrepreneurs Fund, Inc.
(AMEX: RCG), housed in Lipper’s Global Funds classification,
at the bottom of the equity CEF group. RCG shed 8.21% of its
June month-end value and traded at a 43.19% discount on July
31. The next poorest performing equity fund was warehoused in
Lipper’s Emerging Markets Funds classification: Aberdeen
Chile Fund, Inc. (AMEX: CH) declined 7.60% and traded at a
15.35% premium at month-end.
For the third consecutive month all of Lipper’s municipal debt
CEF classifications posted negative NAV-based returns, with—
as one might imagine given Detroit’s bankruptcy—Michigan
Municipal Debt Funds (-3.42%) and General & Insured
Municipal Debt Funds (Leveraged) (-2.84%) once again taking
the worst of the beatings. However, for July one of June’s
leaders once again mitigated losses better than the other
classifications; General & Insured Municipal Debt Funds
(Unleveraged) (-1.41%) was one of the top performers, while
Intermediate Municipal Debt Funds (-0.90%) was the top-
performing classification in the group. The municipal debt funds
macro-group (-2.50%) significantly underperformed by 396 bps
its taxable domestic CEFs counterpart (+1.46%). National
municipal debt funds (-2.48%) mitigated losses slightly better
than their single-state municipal debt fund counterparts (-
2.52%).
As conditions improved slightly for the world markets, the two
classifications making up Lipper’s World Income Funds macro-
group (+0.73%) just managed to remain in the plus column:
Emerging Markets Debt Funds (+0.71%) and Global Income
Funds (+0.74%). With investors still looking for higher yields,
High Yield Funds (Leveraged) (+2.44%), High Yields Funds
(+2.04%), and Loan Participation Funds (+1.60%, June’s
leader) rose to the top of the domestic bond funds group.
U.S. Mortgage Funds (+0.09%, also June’s group laggard) and
General Bond Funds were the laggards of the group. Even after
hearing assurances by Fed Chairman Bernanke that interest
rates would remain low in the near future, the two-/ ten-year
Treasury spread still widened 13 bps from June’s month-end
216 bps. In the domestic taxable fixed income CEFs universe
(+1.46%) the remaining classification returns ranged from
0.75% (Corporate BBB-Rated Debt Funds [Leveraged]) to
1.36% (Flexible Income Funds).
At the head of the fixed income CEFs class were three funds
housed in Lipper’s High Yield (Leveraged) Funds classification:
Avenue Income Credit Strategies Fund (NYSE: ACP), rising
3.47% and trading at a 2.82% discount on July 31; Franklin
Universal Trust (NYSE:FT), tacking 3.37% onto its June
month-end value and traded at a 10.47 discount at month end;
and Neuberger Berman High Yield Strategies Fund
Inc.(NYSE: NHS), posting a 3.30% return and traded at an
8.16% discount on July 31.
For the remaining funds in the fixed income CEFs universe
monthly NAV-basis performance ranged from minus 5.04%
(BlackRock Municipal Target Term Trust [NYSE: BTT], at
the bottom of the group for the second consecutive month),
housed in Lipper’s General & Insured Municipal Debt Funds
(Leveraged) classification and traded at a 1.76% discount) to
3.28% for BlackRock Corporate High Yield Fund III, Inc.
(NYSE: CYE), housed in Lipper’s High Yield (Leveraged) Funds
classification and traded at a 7.88% discount on July 31. The 20
top-performing fixed income CEFs posted returns at or above
2.55%, while the 20 lagging funds were at or below negative
3.38%.
PREMIUM AND DISCOUNT BEHAVIOR
For July the median discount of all CEFs widened 319 bps to
8.06%—much lower than the 12-month moving average
discount (2.34%). Equity CEFs’ median discount widened 97
bps to 8.41%, while fixed income CEFs’ median discount
widened 385 bps to 7.87%. Municipal bond funds’ median
discount widened 379 bps to 7.85%. National municipal debt
funds witnessed the largest widening of discounts for the
month, widening 430 basis points to 7.58%, while World Equity
Funds’ median discount witnessed the smallest widening—0.44
bps to 10.60%. None of the macro- groups experienced
narrowing of their discounts during July.
For the month 16% of all funds’ discounts or premiums
improved, while 83% worsened. In particular, 30% of equity
funds and only 7% of fixed income funds saw their individual
discounts narrow, premiums widen, or premiums replace
discounts. The number of funds traded at premiums on July 31
(94) was 40 more than on June 28.
…your link with the Global Investment Community

5
CEF Events and Corporate Actions
IPOs The initial public offering for Principal Real Estate
Income Fund (NYSE: PGZ) raised approximately
$126 million in gross proceeds. Underwriters have
the option to purchase additional common shares at
the public offering price (less the sales load) within 45
days of the IPO to cover any overallotments.
RIGHTS, REPURCHASES, TENDER OFFERS A tender offer for up to 7.5% of the outstanding
common shares of Liberty All-Star Equity Fund
(NYSE: USA) at 96% of NAV is expected to begin at
the end of August. If more than 7.5% of its
outstanding shares are tendered, the fund will
purchase shares on a pro rata basis.
. Tender offers for up to 5% of the outstanding shares
of each of The Central Europe, Russia and Turkey
Fund (NYSE: CEE) and The New Germany Fund
(NYSE: GF) will expire on August 28, 2013, unless
extended. If more than 5% of either fund’s shares are
tendered, that fund will purchase shares from
tendering shareholders on a pro rata basis.
The next tender offer measurement period will begin
September 16, 2013, and expire December 6, 2013,
for The Central Europe, Russia and Turkey Fund
(NYSE: CEE), The New Germany Fund (NYSE:
GF), and The European Equity Fund (NYSE: EEA).
If any fund’s shares trade at an average discount of
more than 10% during the 12-week measurement
period, that fund will commence a tender offer for up
to 5% of its outstanding common shares at 98% of
NAV.
The three-for-one transferable rights offering for The
Gabelli Healthcare & Wellness(Rx) Trust (NYSE:
GRX) was oversubscribed. The fund issued 3.7
million common shares, which raised over $33.6
million. The fund received total subscriptions
(including oversubscription requests) for over 9.4
million common shares.
The semiannual repurchase offer for up to 5% of the
common shares of The Asia Tigers Fund (NYSE:
GRR) was oversubscribed. Approximately 905,000
shares were tendered for an offer on less than
200,000 shares outstanding. On a pro rata basis 22%
of the shares tendered were accepted for payment.
The Thai Fund (NYSE: TTF) terminated the
contractual investment plan in Thailand through
which the fund previously held all of its Thai assets
and will now invest directly in the securities of Thai
companies. In addition, a tender offer will commence
around August 12, 2013, for up to 15% of the fund’s
common shares at 98.5% NAV. If more than 15% of
the fund’s outstanding shares are tendered, it will
purchase them on a pro rata basis.
MERGERS AND REORGANIZATIONS Royce Value Trust (NYSE: RVT) filed a proxy
statement seeking shareholder approval to allow the
fund to contribute about $100 million of its cash and/or
securities to a newly formed CEF spin-off, Royce
Global Value Trust. All of Royce Global Value Trust’s
common shares would then be distributed to the
common shareholders of the spin-off fund. RVT
shareholders will be asked to approve a change to an
investment restriction to facilitate completion of the
spin-off at a special meeting on September 5, 2013.
OTHER Invesco Advantage Municipal Income Trust II
(VKI), Invesco Bond Fund (VBF), Invesco
California Value Municipal Income Trust (VCV),
Invesco Municipal Trust (VKQ), Invesco Municipal
Income Opportunities Trust (OIA), Invesco
Municipal Opportunity Trust (VMO), Invesco
Pennsylvania Value Municipal Income Trust
(VPV), Invesco Quality Municipal Income Trust
(IQI), Invesco Senior Income Trust (VVR), Invesco
Trust for Investment Grade Municipals (VGM),
Invesco Trust for Investment Grade New York
Municipals (VTN), and Invesco Value Municipal
Income Trust (IIM) are amending their dividend
reinvestment plans to adopt “opt-out” plans. If a fund’s
common shares are trading at a premium,
shareholders will pay the greater of NAV or 95% of
the market price; if a fund’s shares are trading at a
discount, investors will pay the market price for their
reinvested shares. If at any time shareholders do not
want to participate in the plan and would prefer to
receive dividends and capital gains distributions in
cash, they’ll need to contact Invesco to withdraw from
the plan. The amendments to the dividend
reinvestment plans will become effective September
3, 2013.
Directors of The Taiwan Fund (NYSE: TWN) voted
to discontinue the fund’s discount management
program effective July 30 and instead to implement a
managed distribution program with a quarterly
distribution target of 5% (annually) of market price.
The new plan remains subject to regulatory
approvals.
Authored by:
JEFF TJORNEHOJ HEAD OF LIPPER AMERICAS RESEARCH LIPPER, DENVER
…your link with the Global Investment Community
6
CEF Events and Corporate Actions
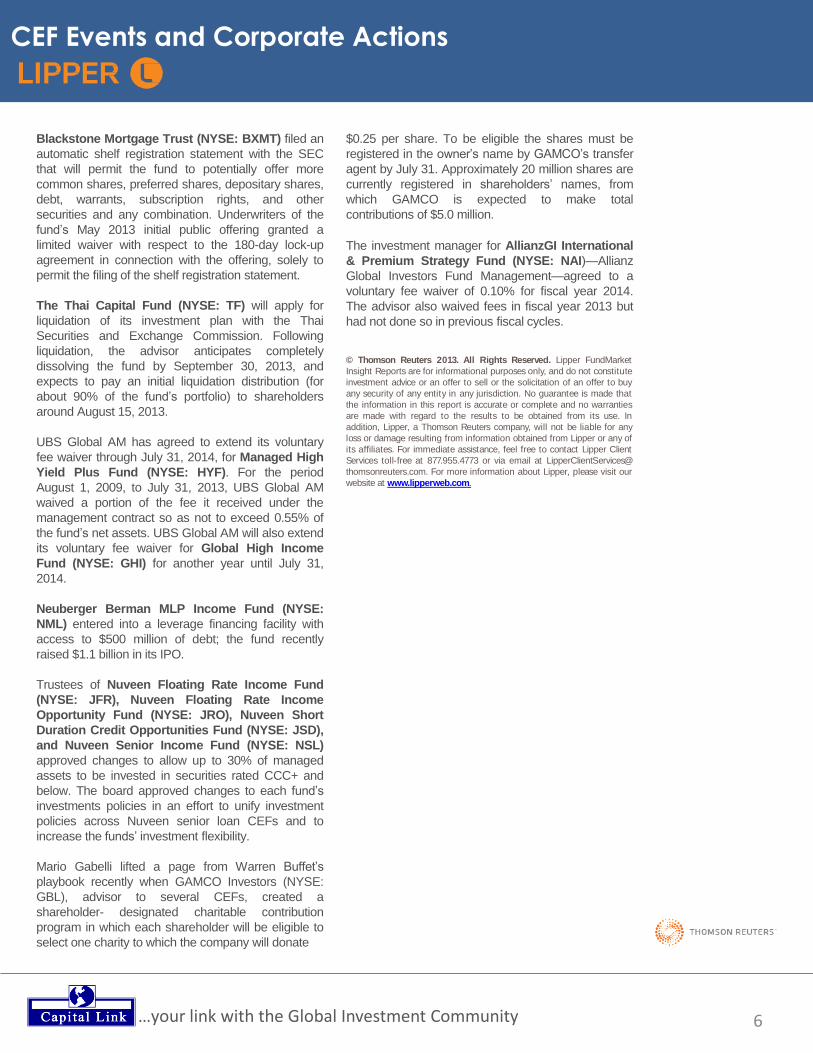
Blackstone Mortgage Trust (NYSE: BXMT) filed an
automatic shelf registration statement with the SEC
that will permit the fund to potentially offer more
common shares, preferred shares, depositary shares,
debt, warrants, subscription rights, and other
securities and any combination. Underwriters of the
fund’s May 2013 initial public offering granted a
limited waiver with respect to the 180-day lock-up
agreement in connection with the offering, solely to
permit the filing of the shelf registration statement.
The Thai Capital Fund (NYSE: TF) will apply for
liquidation of its investment plan with the Thai
Securities and Exchange Commission. Following
liquidation, the advisor anticipates completely
dissolving the fund by September 30, 2013, and
expects to pay an initial liquidation distribution (for
about 90% of the fund’s portfolio) to shareholders
around August 15, 2013.
UBS Global AM has agreed to extend its voluntary
fee waiver through July 31, 2014, for Managed High
Yield Plus Fund (NYSE: HYF). For the period
August 1, 2009, to July 31, 2013, UBS Global AM
waived a portion of the fee it received under the
management contract so as not to exceed 0.55% of
the fund’s net assets. UBS Global AM will also extend
its voluntary fee waiver for Global High Income
Fund (NYSE: GHI) for another year until July 31,
2014.
Neuberger Berman MLP Income Fund (NYSE:
NML) entered into a leverage financing facility with
access to $500 million of debt; the fund recently
raised $1.1 billion in its IPO.
Trustees of Nuveen Floating Rate Income Fund
(NYSE: JFR), Nuveen Floating Rate Income
Opportunity Fund (NYSE: JRO), Nuveen Short
Duration Credit Opportunities Fund (NYSE: JSD),
and Nuveen Senior Income Fund (NYSE: NSL)
approved changes to allow up to 30% of managed
assets to be invested in securities rated CCC+ and
below. The board approved changes to each fund’s
investments policies in an effort to unify investment
policies across Nuveen senior loan CEFs and to
increase the funds’ investment flexibility.
Mario Gabelli lifted a page from Warren Buffet’s
playbook recently when GAMCO Investors (NYSE:
GBL), advisor to several CEFs, created a
shareholder- designated charitable contribution
program in which each shareholder will be eligible to
select one charity to which the company will donate
$0.25 per share. To be eligible the shares must be
registered in the owner’s name by GAMCO’s transfer
agent by July 31. Approximately 20 million shares are
currently registered in shareholders’ names, from
which GAMCO is expected to make total
contributions of $5.0 million.
The investment manager for AllianzGI International
& Premium Strategy Fund (NYSE: NAI)—Allianz
Global Investors Fund Management—agreed to a
voluntary fee waiver of 0.10% for fiscal year 2014.
The advisor also waived fees in fiscal year 2013 but
had not done so in previous fiscal cycles.
…your link with the Global Investment Community
© Thomson Reuters 2013. All Rights Reserved. Lipper FundMarket
Insight Reports are for informational purposes only, and do not constitute
investment advice or an offer to sell or the solicitation of an offer to buy
any security of any entity in any jurisdiction. No guarantee is made that
the information in this report is accurate or complete and no warranties
are made with regard to the results to be obtained from its use. In
addition, Lipper, a Thomson Reuters company, will not be liable for any
loss or damage resulting from information obtained from Lipper or any of
its affiliates. For immediate assistance, feel free to contact Lipper Client
Services toll-free at 877.955.4773 or via email at LipperClientServices@
thomsonreuters.com. For more information about Lipper, please visit our
website at www.lipperweb.com.
7
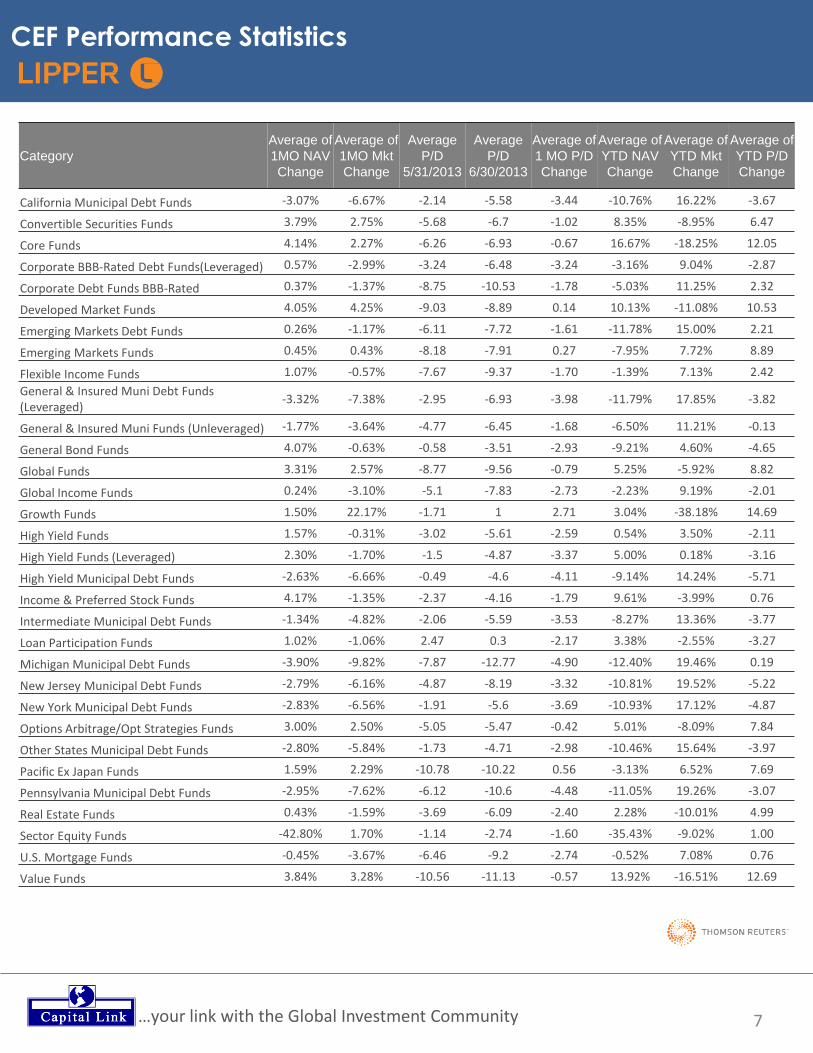
CEF Performance Statistics
…your link with the Global Investment Community
Category
Average of
1MO NAV
Change
Average of
1MO Mkt
Change
Average
P/D
5/31/2013
Average
P/D
6/30/2013
Average of
1 MO P/D
Change
Average of
YTD NAV
Change
Average of
YTD Mkt
Change
Average of
YTD P/D
Change
California Municipal Debt Funds -3.07% -6.67% -2.14 -5.58 -3.44 -10.76% 16.22% -3.67
Convertible Securities Funds 3.79% 2.75% -5.68 -6.7 -1.02 8.35% -8.95% 6.47
Core Funds 4.14% 2.27% -6.26 -6.93 -0.67 16.67% -18.25% 12.05
Corporate BBB-Rated Debt Funds(Leveraged) 0.57% -2.99% -3.24 -6.48 -3.24 -3.16% 9.04% -2.87
Corporate Debt Funds BBB-Rated 0.37% -1.37% -8.75 -10.53 -1.78 -5.03% 11.25% 2.32
Developed Market Funds 4.05% 4.25% -9.03 -8.89 0.14 10.13% -11.08% 10.53
Emerging Markets Debt Funds 0.26% -1.17% -6.11 -7.72 -1.61 -11.78% 15.00% 2.21
Emerging Markets Funds 0.45% 0.43% -8.18 -7.91 0.27 -7.95% 7.72% 8.89
Flexible Income Funds 1.07% -0.57% -7.67 -9.37 -1.70 -1.39% 7.13% 2.42
General & Insured Muni Debt Funds (Leveraged)
-3.32% -7.38% -2.95 -6.93 -3.98 -11.79% 17.85% -3.82
General & Insured Muni Funds (Unleveraged) -1.77% -3.64% -4.77 -6.45 -1.68 -6.50% 11.21% -0.13
General Bond Funds 4.07% -0.63% -0.58 -3.51 -2.93 -9.21% 4.60% -4.65
Global Funds 3.31% 2.57% -8.77 -9.56 -0.79 5.25% -5.92% 8.82
Global Income Funds 0.24% -3.10% -5.1 -7.83 -2.73 -2.23% 9.19% -2.01
Growth Funds 1.50% 22.17% -1.71 1 2.71 3.04% -38.18% 14.69
High Yield Funds 1.57% -0.31% -3.02 -5.61 -2.59 0.54% 3.50% -2.11
High Yield Funds (Leveraged) 2.30% -1.70% -1.5 -4.87 -3.37 5.00% 0.18% -3.16
High Yield Municipal Debt Funds -2.63% -6.66% -0.49 -4.6 -4.11 -9.14% 14.24% -5.71
Income & Preferred Stock Funds 4.17% -1.35% -2.37 -4.16 -1.79 9.61% -3.99% 0.76
Intermediate Municipal Debt Funds -1.34% -4.82% -2.06 -5.59 -3.53 -8.27% 13.36% -3.77
Loan Participation Funds 1.02% -1.06% 2.47 0.3 -2.17 3.38% -2.55% -3.27
Michigan Municipal Debt Funds -3.90% -9.82% -7.87 -12.77 -4.90 -12.40% 19.46% 0.19
New Jersey Municipal Debt Funds -2.79% -6.16% -4.87 -8.19 -3.32 -10.81% 19.52% -5.22
New York Municipal Debt Funds -2.83% -6.56% -1.91 -5.6 -3.69 -10.93% 17.12% -4.87
Options Arbitrage/Opt Strategies Funds 3.00% 2.50% -5.05 -5.47 -0.42 5.01% -8.09% 7.84
Other States Municipal Debt Funds -2.80% -5.84% -1.73 -4.71 -2.98 -10.46% 15.64% -3.97
Pacific Ex Japan Funds 1.59% 2.29% -10.78 -10.22 0.56 -3.13% 6.52% 7.69
Pennsylvania Municipal Debt Funds -2.95% -7.62% -6.12 -10.6 -4.48 -11.05% 19.26% -3.07
Real Estate Funds 0.43% -1.59% -3.69 -6.09 -2.40 2.28% -10.01% 4.99
Sector Equity Funds -42.80% 1.70% -1.14 -2.74 -1.60 -35.43% -9.02% 1.00
U.S. Mortgage Funds -0.45% -3.67% -6.46 -9.2 -2.74 -0.52% 7.08% 0.76
Value Funds 3.84% 3.28% -10.56 -11.13 -0.57 13.92% -16.51% 12.69
8
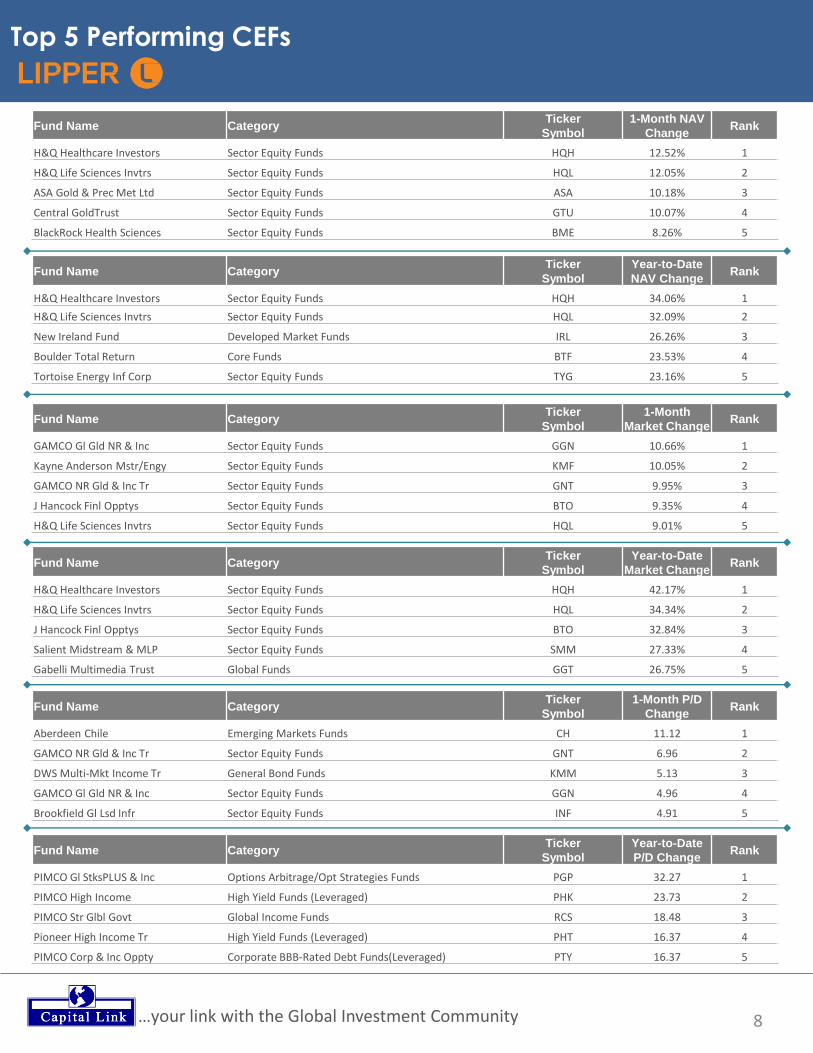
Top 5 Performing CEFs
…your link with the Global Investment Community
Fund Name Category Ticker
Symbol
1-Month NAV
Change Rank
H&Q Healthcare Investors Sector Equity Funds HQH 12.52% 1
H&Q Life Sciences Invtrs Sector Equity Funds HQL 12.05% 2
ASA Gold & Prec Met Ltd Sector Equity Funds ASA 10.18% 3
Central GoldTrust Sector Equity Funds GTU 10.07% 4
BlackRock Health Sciences Sector Equity Funds BME 8.26% 5
Fund Name Category Ticker
Symbol
1-Month
Market Change Rank
GAMCO Gl Gld NR & Inc Sector Equity Funds GGN 10.66% 1
Kayne Anderson Mstr/Engy Sector Equity Funds KMF 10.05% 2
GAMCO NR Gld & Inc Tr Sector Equity Funds GNT 9.95% 3
J Hancock Finl Opptys Sector Equity Funds BTO 9.35% 4
H&Q Life Sciences Invtrs Sector Equity Funds HQL 9.01% 5
Fund Name Category Ticker
Symbol
Year-to-Date
Market Change Rank
H&Q Healthcare Investors Sector Equity Funds HQH 42.17% 1
H&Q Life Sciences Invtrs Sector Equity Funds HQL 34.34% 2
J Hancock Finl Opptys Sector Equity Funds BTO 32.84% 3
Salient Midstream & MLP Sector Equity Funds SMM 27.33% 4
Gabelli Multimedia Trust Global Funds GGT 26.75% 5
Fund Name Category Ticker
Symbol
Year-to-Date
NAV Change Rank
H&Q Healthcare Investors Sector Equity Funds HQH 34.06% 1
H&Q Life Sciences Invtrs Sector Equity Funds HQL 32.09% 2
New Ireland Fund Developed Market Funds IRL 26.26% 3
Boulder Total Return Core Funds BTF 23.53% 4
Tortoise Energy Inf Corp Sector Equity Funds TYG 23.16% 5
Fund Name Category Ticker
Symbol
1-Month P/D
Change Rank
Aberdeen Chile Emerging Markets Funds CH 11.12 1
GAMCO NR Gld & Inc Tr Sector Equity Funds GNT 6.96 2
DWS Multi-Mkt Income Tr General Bond Funds KMM 5.13 3
GAMCO Gl Gld NR & Inc Sector Equity Funds GGN 4.96 4
Brookfield Gl Lsd Infr Sector Equity Funds INF 4.91 5
Fund Name Category Ticker
Symbol
Year-to-Date
P/D Change Rank
PIMCO Gl StksPLUS & Inc Options Arbitrage/Opt Strategies Funds PGP 32.27 1
PIMCO High Income High Yield Funds (Leveraged) PHK 23.73 2
PIMCO Str Glbl Govt Global Income Funds RCS 18.48 3
Pioneer High Income Tr High Yield Funds (Leveraged) PHT 16.37 4
PIMCO Corp & Inc Oppty Corporate BBB-Rated Debt Funds(Leveraged) PTY 16.37 5
9 …your link with the Global Investment Community
CEF Sector Review
July 26, 2013
Closed-End Funds IPOs
Authored by:
Dan Brown, CFA Analyst, Wells Fargo Advisors
Mariana F. Bush, CFA Senior Analyst,
Wells Fargo Advisors
W. Jeffrey Lee Analyst, Wells Fargo Advisors
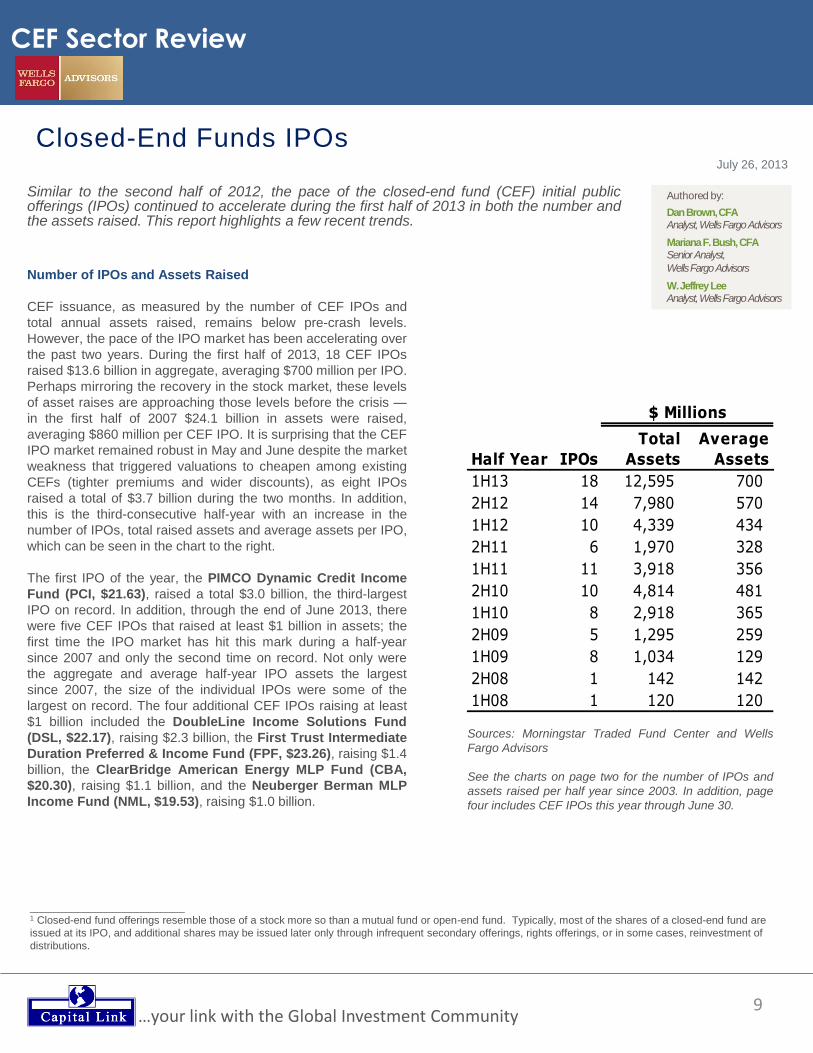
Similar to the second half of 2012, the pace of the closed-end fund (CEF) initial public offerings (IPOs) continued to accelerate during the first half of 2013 in both the number and the assets raised. This report highlights a few recent trends.
Half Year IPOs
1H13 18 12,595 700
2H12 14 7,980 570
1H12 10 4,339 434
2H11 6 1,970 328
1H11 11 3,918 356
2H10 10 4,814 481
1H10 8 2,918 365
2H09 5 1,295 259
1H09 8 1,034 129
2H08 1 142 142
1H08 1 120 120
Total
Assets
Average
Assets
$ Millions
Number of IPOs and Assets Raised
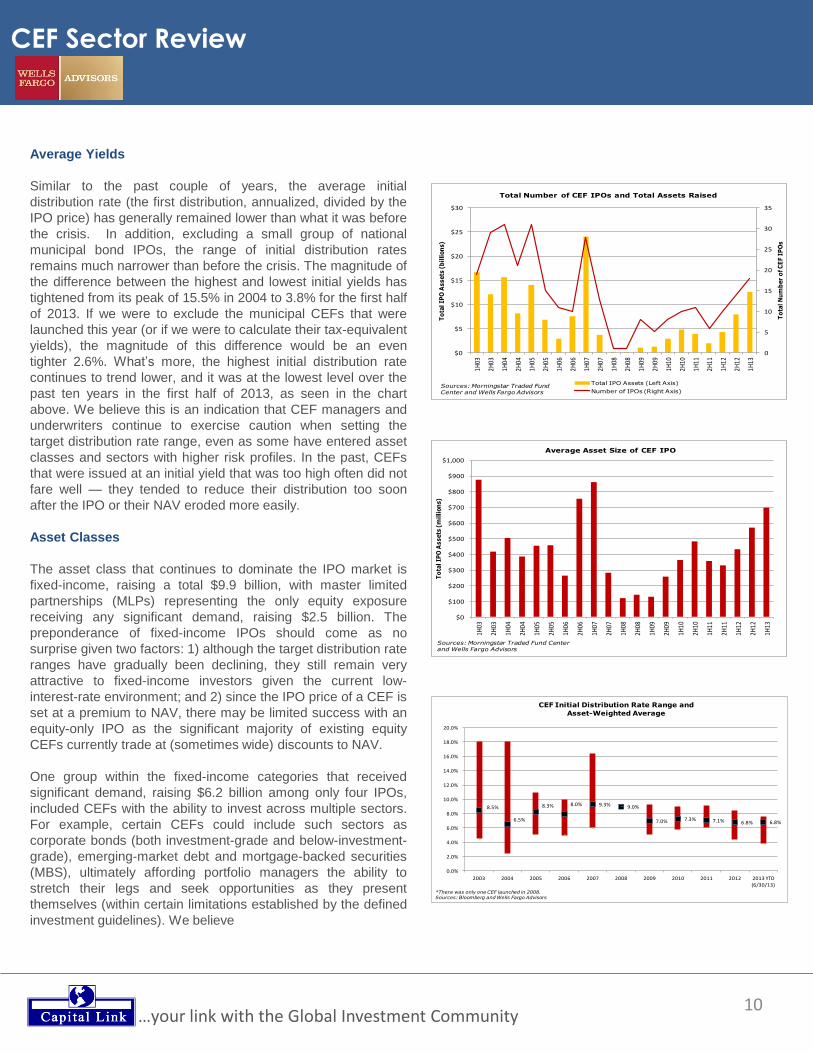
CEF issuance, as measured by the number of CEF IPOs and
total annual assets raised, remains below pre-crash levels.
However, the pace of the IPO market has been accelerating over
the past two years. During the first half of 2013, 18 CEF IPOs
raised $13.6 billion in aggregate, averaging $700 million per IPO.
Perhaps mirroring the recovery in the stock market, these levels
of asset raises are approaching those levels before the crisis —
in the first half of 2007 $24.1 billion in assets were raised,
averaging $860 million per CEF IPO. It is surprising that the CEF
IPO market remained robust in May and June despite the market
weakness that triggered valuations to cheapen among existing
CEFs (tighter premiums and wider discounts), as eight IPOs
raised a total of $3.7 billion during the two months. In addition,
this is the third-consecutive half-year with an increase in the
number of IPOs, total raised assets and average assets per IPO,
which can be seen in the chart to the right.
The first IPO of the year, the PIMCO Dynamic Credit Income
Fund (PCI, $21.63), raised a total $3.0 billion, the third-largest
IPO on record. In addition, through the end of June 2013, there
were five CEF IPOs that raised at least $1 billion in assets; the
first time the IPO market has hit this mark during a half-year
since 2007 and only the second time on record. Not only were
the aggregate and average half-year IPO assets the largest
since 2007, the size of the individual IPOs were some of the
largest on record. The four additional CEF IPOs raising at least
$1 billion included the DoubleLine Income Solutions Fund
(DSL, $22.17), raising $2.3 billion, the First Trust Intermediate
Duration Preferred & Income Fund (FPF, $23.26), raising $1.4
billion, the ClearBridge American Energy MLP Fund (CBA,
$20.30), raising $1.1 billion, and the Neuberger Berman MLP
Income Fund (NML, $19.53), raising $1.0 billion.
Sources: Morningstar Traded Fund Center and Wells
Fargo Advisors
See the charts on page two for the number of IPOs and
assets raised per half year since 2003. In addition, page
four includes CEF IPOs this year through June 30.
__________________________ 1 Closed-end fund offerings resemble those of a stock more so than a mutual fund or open-end fund. Typically, most of the shares of a closed-end fund are
issued at its IPO, and additional shares may be issued later only through infrequent secondary offerings, rights offerings, or in some cases, reinvestment of
distributions.
10 …your link with the Global Investment Community
CEF Sector Review
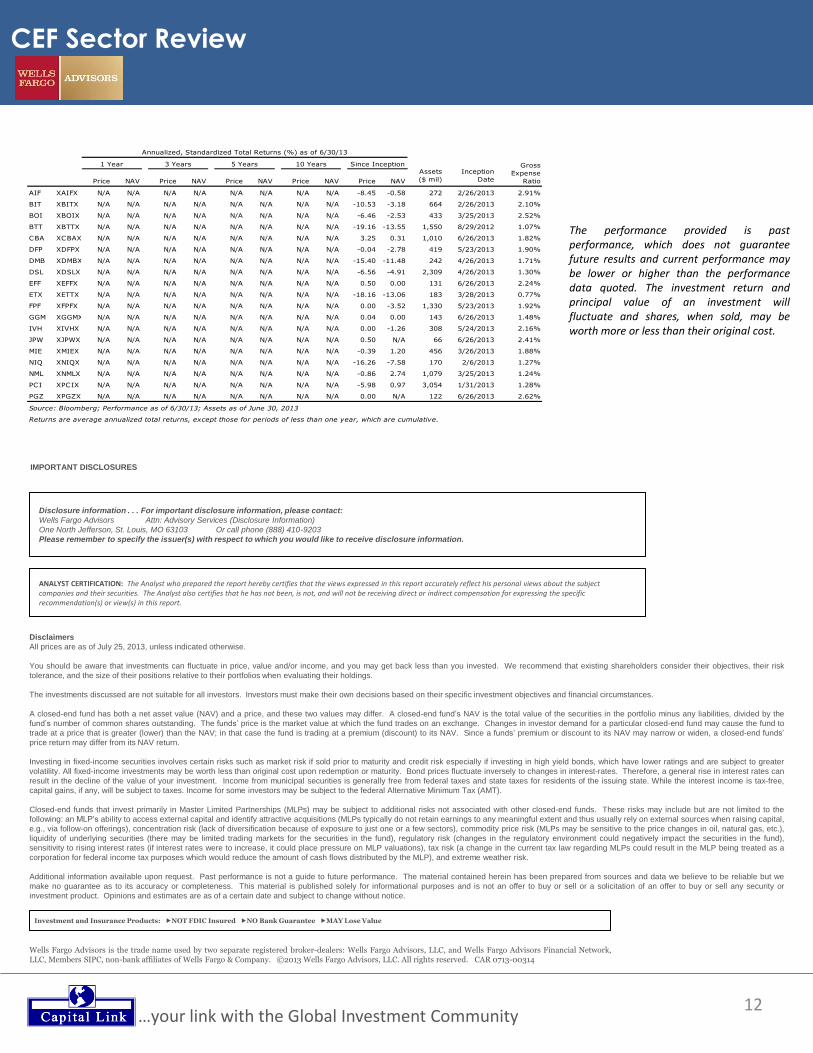
Average Yields
Similar to the past couple of years, the average initial
distribution rate (the first distribution, annualized, divided by the
IPO price) has generally remained lower than what it was before
the crisis. In addition, excluding a small group of national
municipal bond IPOs, the range of initial distribution rates
remains much narrower than before the crisis. The magnitude of
the difference between the highest and lowest initial yields has
tightened from its peak of 15.5% in 2004 to 3.8% for the first half
of 2013. If we were to exclude the municipal CEFs that were
launched this year (or if we were to calculate their tax-equivalent
yields), the magnitude of this difference would be an even
tighter 2.6%. What’s more, the highest initial distribution rate
continues to trend lower, and it was at the lowest level over the
past ten years in the first half of 2013, as seen in the chart
above. We believe this is an indication that CEF managers and
underwriters continue to exercise caution when setting the
target distribution rate range, even as some have entered asset
classes and sectors with higher risk profiles. In the past, CEFs
that were issued at an initial yield that was too high often did not
fare well — they tended to reduce their distribution too soon
after the IPO or their NAV eroded more easily.
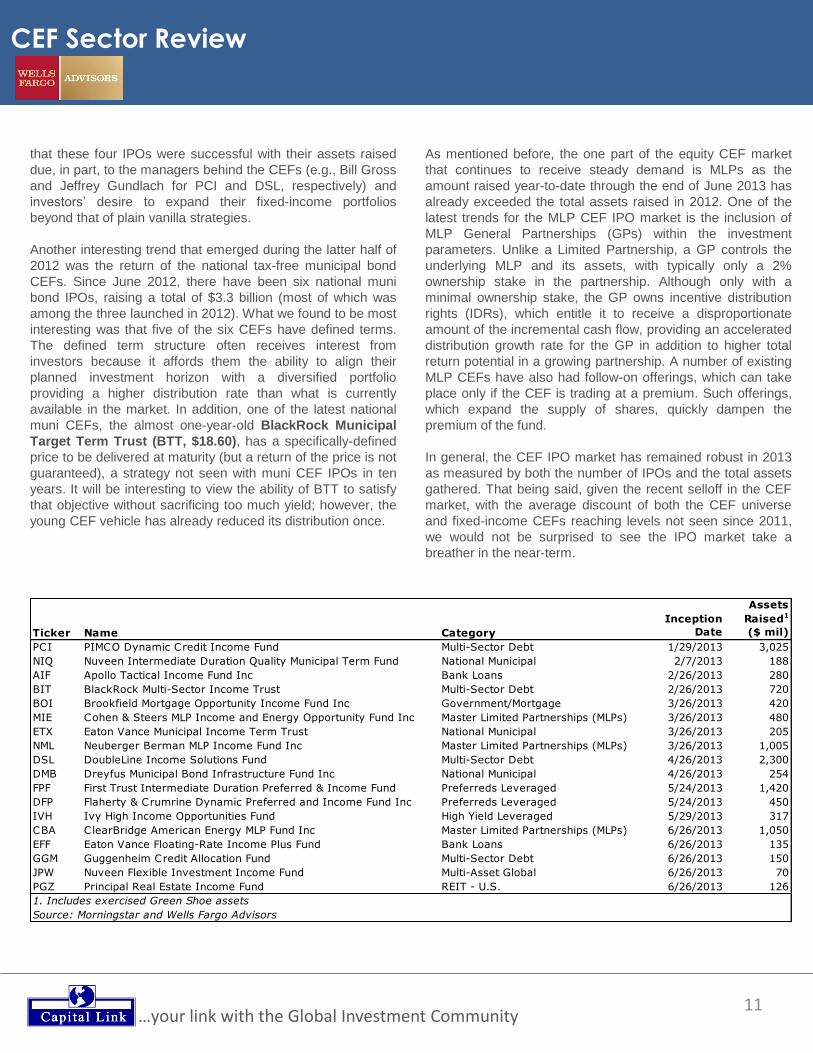
Asset Classes
The asset class that continues to dominate the IPO market is
fixed-income, raising a total $9.9 billion, with master limited
partnerships (MLPs) representing the only equity exposure
receiving any significant demand, raising $2.5 billion. The
preponderance of fixed-income IPOs should come as no
surprise given two factors: 1) although the target distribution rate
ranges have gradually been declining, they still remain very
attractive to fixed-income investors given the current low-
interest-rate environment; and 2) since the IPO price of a CEF is
set at a premium to NAV, there may be limited success with an
equity-only IPO as the significant majority of existing equity
CEFs currently trade at (sometimes wide) discounts to NAV.
One group within the fixed-income categories that received
significant demand, raising $6.2 billion among only four IPOs,
included CEFs with the ability to invest across multiple sectors.
For example, certain CEFs could include such sectors as
corporate bonds (both investment-grade and below-investment-
grade), emerging-market debt and mortgage-backed securities
(MBS), ultimately affording portfolio managers the ability to
stretch their legs and seek opportunities as they present
themselves (within certain limitations established by the defined
investment guidelines). We believe
$0
$100
$200
$300
$400
$500
$600
$700
$800
$900
$1,000
1H03
2H03
1H04
2H04
1H05
2H05
1H06
2H06
1H07
2H07
1H08
2H08
1H09
2H09
1H10
2H10
1H11
2H11
1H12
2H12
1H13
To
tal IP
O A
ssets
(m
illi
on
s)
Average Asset Size of CEF IPO
Sources: Morningstar Traded Fund Center and Wells Fargo Advisors
0
5
10
15
20
25
30
35
$0
$5
$10
$15
$20
$25
$30
1H03
2H03
1H04
2H04
1H05
2H05
1H06
2H06
1H07
2H07
1H08
2H08
1H09
2H09
1H10
2H10
1H11
2H11
1H12
2H12
1H13
To
tal N
um
ber
of C
EF I
PO
s
To
tal IP
O A
ssets
(b
illion
s)
Total Number of CEF IPOs and Total Assets Raised
Total IPO Assets (Left Axis)
Number of IPOs (Right Axis)Sources: Morningstar Traded Fund Center and Wells Fargo Advisors
8.5%
6.5%
8.3% 8.0% 9.3% 9.0%
7.0% 7.3% 7.1% 6.8% 6.8%
0.0%
2.0%
4.0%
6.0%
8.0%
10.0%
12.0%
14.0%
16.0%
18.0%
20.0%
2003 2004 2005 2006 2007 2008 2009 2010 2011 2012 2013 YTD (6/30/13)
CEF Initial Distribution Rate Range and
Asset-Weighted Average
*There was only one CEF launched in 2008.Sources: Bloomberg and Wells Fargo Advisors
11 …your link with the Global Investment Community
CEF Sector Review
that these four IPOs were successful with their assets raised
due, in part, to the managers behind the CEFs (e.g., Bill Gross
and Jeffrey Gundlach for PCI and DSL, respectively) and
investors’ desire to expand their fixed-income portfolios
beyond that of plain vanilla strategies.
Another interesting trend that emerged during the latter half of
2012 was the return of the national tax-free municipal bond
CEFs. Since June 2012, there have been six national muni
bond IPOs, raising a total of $3.3 billion (most of which was
among the three launched in 2012). What we found to be most
interesting was that five of the six CEFs have defined terms.
The defined term structure often receives interest from
investors because it affords them the ability to align their
planned investment horizon with a diversified portfolio
providing a higher distribution rate than what is currently
available in the market. In addition, one of the latest national
muni CEFs, the almost one-year-old BlackRock Municipal
Target Term Trust (BTT, $18.60), has a specifically-defined
price to be delivered at maturity (but a return of the price is not
guaranteed), a strategy not seen with muni CEF IPOs in ten
years. It will be interesting to view the ability of BTT to satisfy
that objective without sacrificing too much yield; however, the
young CEF vehicle has already reduced its distribution once.
As mentioned before, the one part of the equity CEF market
that continues to receive steady demand is MLPs as the
amount raised year-to-date through the end of June 2013 has
already exceeded the total assets raised in 2012. One of the
latest trends for the MLP CEF IPO market is the inclusion of
MLP General Partnerships (GPs) within the investment
parameters. Unlike a Limited Partnership, a GP controls the
underlying MLP and its assets, with typically only a 2%
ownership stake in the partnership. Although only with a
minimal ownership stake, the GP owns incentive distribution
rights (IDRs), which entitle it to receive a disproportionate
amount of the incremental cash flow, providing an accelerated
distribution growth rate for the GP in addition to higher total
return potential in a growing partnership. A number of existing
MLP CEFs have also had follow-on offerings, which can take
place only if the CEF is trading at a premium. Such offerings,
which expand the supply of shares, quickly dampen the
premium of the fund.
In general, the CEF IPO market has remained robust in 2013
as measured by both the number of IPOs and the total assets
gathered. That being said, given the recent selloff in the CEF
market, with the average discount of both the CEF universe
and fixed-income CEFs reaching levels not seen since 2011,
we would not be surprised to see the IPO market take a
breather in the near-term.
Ticker Name Category
Inception
Date
Assets
Raised1
($ mil)
PCI PIMCO Dynamic Credit Income Fund Multi-Sector Debt 1/29/2013 3,025
NIQ Nuveen Intermediate Duration Quality Municipal Term Fund National Municipal 2/7/2013 188
AIF Apollo Tactical Income Fund Inc Bank Loans 2/26/2013 280
BIT BlackRock Multi-Sector Income Trust Multi-Sector Debt 2/26/2013 720
BOI Brookfield Mortgage Opportunity Income Fund Inc Government/Mortgage 3/26/2013 420
MIE Cohen & Steers MLP Income and Energy Opportunity Fund Inc Master Limited Partnerships (MLPs) 3/26/2013 480
ETX Eaton Vance Municipal Income Term Trust National Municipal 3/26/2013 205
NML Neuberger Berman MLP Income Fund Inc Master Limited Partnerships (MLPs) 3/26/2013 1,005
DSL DoubleLine Income Solutions Fund Multi-Sector Debt 4/26/2013 2,300
DMB Dreyfus Municipal Bond Infrastructure Fund Inc National Municipal 4/26/2013 254
FPF First Trust Intermediate Duration Preferred & Income Fund Preferreds Leveraged 5/24/2013 1,420
DFP Flaherty & Crumrine Dynamic Preferred and Income Fund Inc Preferreds Leveraged 5/24/2013 450
IVH Ivy High Income Opportunities Fund High Yield Leveraged 5/29/2013 317
CBA ClearBridge American Energy MLP Fund Inc Master Limited Partnerships (MLPs) 6/26/2013 1,050
EFF Eaton Vance Floating-Rate Income Plus Fund Bank Loans 6/26/2013 135
GGM Guggenheim Credit Allocation Fund Multi-Sector Debt 6/26/2013 150
JPW Nuveen Flexible Investment Income Fund Multi-Asset Global 6/26/2013 70
PGZ Principal Real Estate Income Fund REIT - U.S. 6/26/2013 126
1. Includes exercised Green Shoe assets
Source: Morningstar and Wells Fargo Advisors
12 …your link with the Global Investment Community
CEF Sector Review
Price NAV Price NAV Price NAV Price NAV Price NAV
Assets
($ mil)
Inception
Date
AIF XAIFX N/A N/A N/A N/A N/A N/A N/A N/A -8.45 -0.58 272 2/26/2013 2.91%
BIT XBITX N/A N/A N/A N/A N/A N/A N/A N/A -10.53 -3.18 664 2/26/2013 2.10%
BOI XBOIX N/A N/A N/A N/A N/A N/A N/A N/A -6.46 -2.53 433 3/25/2013 2.52%
BTT XBTTX N/A N/A N/A N/A N/A N/A N/A N/A -19.16 -13.55 1,550 8/29/2012 1.07%
CBA XCBAX N/A N/A N/A N/A N/A N/A N/A N/A 3.25 0.31 1,010 6/26/2013 1.82%
DFP XDFPX N/A N/A N/A N/A N/A N/A N/A N/A -0.04 -2.78 419 5/23/2013 1.90%
DMB XDMBX N/A N/A N/A N/A N/A N/A N/A N/A -15.40 -11.48 242 4/26/2013 1.71%
DSL XDSLX N/A N/A N/A N/A N/A N/A N/A N/A -6.56 -4.91 2,309 4/26/2013 1.30%
EFF XEFFX N/A N/A N/A N/A N/A N/A N/A N/A 0.50 0.00 131 6/26/2013 2.24%
ETX XETTX N/A N/A N/A N/A N/A N/A N/A N/A -18.16 -13.06 183 3/28/2013 0.77%
FPF XFPFX N/A N/A N/A N/A N/A N/A N/A N/A 0.00 -3.52 1,330 5/23/2013 1.92%
GGM XGGMX N/A N/A N/A N/A N/A N/A N/A N/A 0.04 0.00 143 6/26/2013 1.48%
IVH XIVHX N/A N/A N/A N/A N/A N/A N/A N/A 0.00 -1.26 308 5/24/2013 2.16%
JPW XJPWX N/A N/A N/A N/A N/A N/A N/A N/A 0.50 N/A 66 6/26/2013 2.41%
MIE XMIEX N/A N/A N/A N/A N/A N/A N/A N/A -0.39 1.20 456 3/26/2013 1.88%
NIQ XNIQX N/A N/A N/A N/A N/A N/A N/A N/A -16.26 -7.58 170 2/6/2013 1.27%
NML XNMLX N/A N/A N/A N/A N/A N/A N/A N/A -0.86 2.74 1,079 3/25/2013 1.24%
PCI XPCIX N/A N/A N/A N/A N/A N/A N/A N/A -5.98 0.97 3,054 1/31/2013 1.28%
PGZ XPGZX N/A N/A N/A N/A N/A N/A N/A N/A 0.00 N/A 122 6/26/2013 2.62%
Source: Bloomberg; Performance as of 6/30/13; Assets as of June 30, 2013
Returns are average annualized total returns, except those for periods of less than one year, which are cumulative.
Gross
Expense
Ratio
Annualized, Standardized Total Returns (%) as of 6/30/13
1 Year 3 Years 5 Years 10 Years Since Inception
The performance provided is past performance, which does not guarantee future results and current performance may be lower or higher than the performance data quoted. The investment return and principal value of an investment will fluctuate and shares, when sold, may be worth more or less than their original cost.
Disclaimers
All prices are as of July 25, 2013, unless indicated otherwise.
You should be aware that investments can fluctuate in price, value and/or income, and you may get back less than you invested. We recommend that existing shareholders consider their objectives, their risk
tolerance, and the size of their positions relative to their portfolios when evaluating their holdings.
The investments discussed are not suitable for all investors. Investors must make their own decisions based on their specific investment objectives and financial circumstances.
A closed-end fund has both a net asset value (NAV) and a price, and these two values may differ. A closed-end fund’s NAV is the total value of the securities in the portfolio minus any liabilities, divided by the
fund’s number of common shares outstanding. The funds’ price is the market value at which the fund trades on an exchange. Changes in investor demand for a particular closed-end fund may cause the fund to
trade at a price that is greater (lower) than the NAV; in that case the fund is trading at a premium (discount) to its NAV. Since a funds’ premium or discount to its NAV may narrow or widen, a closed-end funds’
price return may differ from its NAV return.
Investing in fixed-income securities involves certain risks such as market risk if sold prior to maturity and credit risk especially if investing in high yield bonds, which have lower ratings and are subject to greater
volatility. All fixed-income investments may be worth less than original cost upon redemption or maturity. Bond prices fluctuate inversely to changes in interest-rates. Therefore, a general rise in interest rates can
result in the decline of the value of your investment. Income from municipal securities is generally free from federal taxes and state taxes for residents of the issuing state. While the interest income is tax-free,
capital gains, if any, will be subject to taxes. Income for some investors may be subject to the federal Alternative Minimum Tax (AMT).
Closed-end funds that invest primarily in Master Limited Partnerships (MLPs) may be subject to additional risks not associated with other closed-end funds. These risks may include but are not limited to the
following: an MLP’s ability to access external capital and identify attractive acquisitions (MLPs typically do not retain earnings to any meaningful extent and thus usually rely on external sources when raising capital,
e.g., via follow-on offerings), concentration risk (lack of diversification because of exposure to just one or a few sectors), commodity price risk (MLPs may be sensitive to the price changes in oil, natural gas, etc.),
liquidity of underlying securities (there may be limited trading markets for the securities in the fund), regulatory risk (changes in the regulatory environment could negatively impact the securities in the fund),
sensitivity to rising interest rates (if interest rates were to increase, it could place pressure on MLP valuations), tax risk (a change in the current tax law regarding MLPs could result in the MLP being treated as a
corporation for federal income tax purposes which would reduce the amount of cash flows distributed by the MLP), and extreme weather risk.
Additional information available upon request. Past performance is not a guide to future performance. The material contained herein has been prepared from sources and data we believe to be reliable but we
make no guarantee as to its accuracy or completeness. This material is published solely for informational purposes and is not an offer to buy or sell or a solicitation of an offer to buy or sell any security or
investment product. Opinions and estimates are as of a certain date and subject to change without notice.
Investment and Insurance Products: NOT FDIC Insured NO Bank Guarantee MAY Lose Value
Wells Fargo Advisors is the trade name used by two separate registered broker-dealers: Wells Fargo Advisors, LLC, and Wells Fargo Advisors Financial Network, LLC, Members SIPC, non-bank affiliates of Wells Fargo & Company. ©2013 Wells Fargo Advisors, LLC. All rights reserved. CAR 0713-00314
Disclosure information . . . For important disclosure information, please contact:
Wells Fargo Advisors Attn: Advisory Services (Disclosure Information)
One North Jefferson, St. Louis, MO 63103 Or call phone (888) 410-9203
Please remember to specify the issuer(s) with respect to which you would like to receive disclosure information.
ANALYST CERTIFICATION: The Analyst who prepared the report hereby certifies that the views expressed in this report accurately reflect his personal views about the subject companies and their securities. The Analyst also certifies that he has not been, is not, and will not be receiving direct or indirect compensation for expressing the specific recommendation(s) or view(s) in this report.
IMPORTANT DISCLOSURES
13 …your link with the Global Investment Community
Authored by:
Jeff Margolin
Senior Vice President
Closed-End Fund Strategist
First Trust Advisors, LP.
Closed-End Fund Review Second Quarter 2013
Second Quarter Overview
Following a quarter in which the average
closed-end fund was up 4.31%, the universe of
595 funds was lower by 5.60% on a share price
total return basis during the second quarter
(both figures from Morningstar). For many
funds, most of the weakness occurred during
the month of June (when the average fund was
lower by 6.09% on a share price total return
basis, according to Morningstar). The selling
pressure began in May when the yield on the
10-year U.S. Treasury began a very swift move
from 1.63% on 5/2/13 all the way to 2.48% by
the end of the quarter (Bloomberg). This sharp
rise in long-term interest rates not only put
pressure on the net asset values (NAVs) of
fixed-income funds that have long durations
(particularly municipal funds), but also caused
funds that don’t have long durations to sell off
(such as senior loan funds, high-yield funds and
limited duration multi-sector bond funds). This
was magnified for funds which use leverage.
For many quarters, and years for that matter,
leading up to May/June 2013, many retail
investors were in a “risk off” mode, focusing
primarily on fixed-income and high-yielding
investments. However, with the equity markets
continuing to rise at an impressive pace,
coupled with the surge in long-term interest
rates, there was a palpable shift in May/June
with investors
shifting from “risk off” to “risk on.” This
manifested itself with investors not only selling
yield oriented closed-end funds, but also with
the significant outflows of money from open-end
bond mutual funds. The yield-oriented sectors of
the S&P 500, such as utilities,
telecommunications, REITs (real estate
investment trusts) and MLPs (master limited
partnerships) turned out to be the worst
performers for the quarter.
The result of the weakness during the second
quarter was that average discounts to NAV
widened significantly during the quarter,
creating many compelling values in the
secondary market for closed-end funds, in my
view. Indeed, at the end of the second quarter,
the average fund was at a discount to NAV of
3.8% (Morningstar). This level is wider than the
1-year average discount to NAV of 0.6%, 3-year
average discount to NAV of 1.8% and the 10-
year average discount to NAV of 0.7%. During
these very volatile periods for the share prices
of closed-end funds, there are often 2 key
phenomenons which occur and the May/June
period encompassed both of them as detailed
below:
1. Share price weakness is more
pronounced than NAV weakness and
discounts to NAV widen: One of the unique
characteristics of a CEF is that investors buy
shares of a fund on a stock exchange as they
would any other publicly traded security. This
share price is independent from the underlying
NAV of the fund. The NAV for most funds is
calculated once a day after the market closes.
During periods of enhanced volatility in the CEF
marketplace, oftentimes share prices will sell off
more severely than the actual weakness
occurring in the NAVs of funds and this causes
discounts to NAV to widen. While there is no
single reason this occurs, it is mostly driven by
the fact that CEFs are purchased at a share
price on an exchange and are subject to the
supply and demand relationship for the fund.
When sentiment turns negative (as it did in a
meaningful way in May/June), share prices can
fall more than underlying NAVs. Furthermore,
many CEFs are thinly traded and therefore it
does not take a significant amount of added
selling pressure to meaningfully move the share
prices of many funds. During the second
quarter, while share prices were lower on
average by 5.60% (as mentioned above),
underlying NAVs for the universe of 595 funds
were only lower on an average by 4.55% on a
NAV total return basis. This data point illustrates
that during the quarter, share price weakness
was more pronounced than underlying NAV
weakness and contributed to the widening of
discounts to NAV.
CEF Sector Review
2. CEFs trade as one asset class even though there are
dozens of different CEF categories made up of many
different asset classes: While a CEF is a structure and a
way for investors to gain exposure to many different asset
classes just like an exchange-traded fund (ETF) or unit
investment trust (UIT), there are periods (such as the recent
May/June period) when all CEFs seem to trade as one asset
class and all trade lower (even though there are dozens of
different asset classes spread out throughout the universe of
595 CEFs). This was particularly true during the recent period
of weakness when many categories of the CEF marketplace
were experiencing meaningful share price weakness even
though the underlying asset class and NAVs were relatively
stable. For example, even though limited duration CEFs do
not have meaningful duration risk and were not significantly
impacted by the increase in long-term interest rates, the
average limited duration CEF had share price total return
weakness of 6.4% (Morningstar) during the quarter. NAVs for
limited duration funds were only lower by 2.25%
(Morningstar) on a total return basis. This is an example of a
CEF category selling off in sympathy with other CEF
categories even though the underlying asset class that these
funds invest in performed much better than the share price
weakness would indicate. While it can be frustrating in the
short term for investors to see certain categories of the CEF
marketplace trade lower even though underlying NAV
performance is still holding up well, ultimately I believe over
time the market and investors begin to differentiate between
the categories of funds which are experiencing real NAV
weakness with the categories that are not.
While it is hard to know exactly why sometimes all CEFs
trade as one asset class even though there are many different
asset classes throughout the CEF universe, it might be
related to the fact that when long-term interest rates moved
higher in May/June, investors erroneously assumed that
because long term rates were increasing and many CEFs
employ the use of leverage, it must mean that leverage costs
were rising for all leveraged funds. However, this is not the
case (as most funds’ leverage costs are tied to short-term
interest rates such as the Federal Funds rate which remains
very low) and therefore these funds were not impacted by the
increase in long-term rates.
Outlook & Favored Categories
While the recent period of broad weakness and discount
widening across the closed-end fund universe might be
frustrating and surprising for newer investors to this
investment structure, it is not the first time CEFs have
experienced this sort of volatility in the 100-plus year history
they have been trading in the United States. In fact, I believe
for patient, long-term investors, some of the best values and
opportunities are created during these types of discount-
widening periods. Indeed, the last time the broad CEF
marketplace experienced this type of weakness and discount
widening was in the summer of 2011 when the U.S. debt was
downgraded to AA+ from AAA by S&P and investors were
also concerned about Greece (see report from 8/10/2011
entitled “Discounts Continue to Widen...Opportunities Abound
for Long-Term Investors”). Investors who dollar-cost
averaged into the weakness were ultimately rewarded.
I also think it is vital during these periods of volatility to be
reminded of the importance of the significant and compelling
distributions CEFs make as it relates to the total return
performance of funds over time. Indeed, according to
Morningstar over the past 10 years ended 6/28/2013, the
average cumulative share price capital return (which excludes
distributions) for the universe of CEFs was only 5.95% (or an
annualized 0.58%). However, when you factor in the
distributions CEFs distribute and look at the average
cumulative share price total return, the number is a much
more impressive 79.19% (or an annualized 6.01%). These
data points illustrate the importance of distributions
compounding year after year and how significantly they
contribute to the share price total return performance of
CEFs. After all, the majority of CEFs have as their primary
investment objective the goal of distributing current income.
As the second half of the year commences, I continue to
believe the overall back drop for diversified CEF investors
remains a good one. Indeed, I think one of the key comments
from the recent Federal Reserve meeting that appears to
have been overlooked by investors is that the Fed intends to
continue to keep the Federal Funds rate at the extremely low
level of 0-0.25% for an extended period of time. This is
particularly important as it relates to the CEF structure as
roughly 70% of all CEFs employ the use of leverage. Most
funds’ leverage costs are pegged off of short-term interest
rates and therefore, with the Fed likely keeping rates at 0-
0.25% for an extended period of time, many funds will
continue to have low leverage/borrowing costs, which is a
positive factor, in my opinion. Furthermore, with the average
CEF trading at a wider discount to NAV than historical
averages, coupled with the very attractive average yield of
6.57% (Morningstar, 6/28/13), I believe investors will look to
take advantage of these compelling valuations and yields.
Even though long-term interest rates did trend up in the
second quarter, we are still in an overall low interest rate
environment and an average yield of 6.57% is still attractive
on both an absolute and relative basis, particularly in light of
the very low inflation we continue to experience.
14 …your link with the Global Investment Community
CEF Sector Review
Another positive for credit-sensitive funds (such as high-yield
and senior loan funds) remains the very low default rate. In
fact, Moody’s reported that the global speculative-grade
default rate stood at 2.8% in June, no change from May.
Moody’s is forecasting a default rate of 3.2% for December
2013. The rate stood at 3.1% a year ago. The historical
average for the default rate on speculative-grade debt has
been approximately 4.7% since 1983. The U.S. speculative-
grade default rate stood at 2.9% in June, no change from
May. The rate stood at 3.3% a year ago. The default rate on
senior loans stood at 1.49% in June, down slightly from
1.50% in May, according to Standard & Poor's LCD.
Leveraged loan managers expect the default rate to be in the
vicinity of 1.8% in December. The historical average is 3.3%.
While I believe the overall backdrop remains a favorable one
for diversified CEF investors and the recent weakness has
created many compelling opportunities in the secondary
market, the volatility (particularly in longer duration fixed-
income funds such as municipal funds) does illustrate the
interest rate risk which does exist in certain funds. While I
believe municipal CEFs do have compelling characteristics
such as average tax-free yields of 5.98% from primarily
investment-grade bonds (Morningstar), average discounts to
NAV of 3.0% (Morningstar), and continue to benefit from low
leverage cost, I also continue to actively advocate investors
diversify into less interest-rate sensitive areas such as
domestic equity funds and credit-sensitive funds (such as
senior loan, high-yield and limited duration multi-sector
funds), along with maintaining some exposure to municipal
funds given the compelling tax-free yields they provide.
Since January of 2012 (see CEF commentary from
1/18/2012) I have had the highest conviction level in domestic
equity funds and senior loan funds and that is still the case as
the second half of 2013 begins. Based on the First Trust
Economic team’s view that the U.S. economy will continue to
grow this year at a moderate rate, coupled with our Chief
Market Strategist’s view that domestic equities remain
undervalued based on the potential for continued earnings
growth in the S&P 500 over the next 12- months (as well as
the fact that the S&P 500 continues to trade at a market
multiple which is below its historical average), I continue to
favor the underlying asset class of domestic equities.
Furthermore, the Morningstar universe of 113 domestic equity
funds trades at an average discount to NAV of 3.0%, which is
wider than its 10-year average of a 0.05% premium to NAV.
On the fixed-income side of the equation, I continue to have
the highest conviction level in senior loan CEFs. While the
Morningstar universe of 24 senior loan CEFs was lower by
2.59% on a share price total return basis during the second
quarter, the category is still up 15.01% on a share price total
return basis over the past one year (Morningstar). Underlying
NAVs for senior loan funds were only lower by 0.03% on a
NAV total return basis (Morningstar). My positive thesis for
advocating investors have exposure to senior loan CEFs is as
follows:
1. Defaults continue to remain low: The default rate on
senior loans stood at 1.49% in June, down slightly from
1.50% in May, according to Standard & Poor's LCD. This
is significantly below the historical average of 3.3%.
2. Senior loans remain one of few fixed-income asset
classes below par: As of 6/28/13, the S&P LSTA U.S.
Leveraged Loan 100 Index was at 97.13 (par is 100)
(Bloomberg). While not a huge discount to par, it is at a
discount nonetheless when most other fixed-income
oriented asset classes are at premiums to par.
Furthermore, historically when interest rates trend higher,
senior loans trade right around this par level as there is
not a lot of duration risk due to the floating-rate nature of
the interest on the loans. Indeed, the last time interest
rates trended higher from 2004-2006 was when the
Federal Reserve increased interest rates from 1% to
5.25% and long-term rates trended up as well. This index
stayed in an extremely tight range with a low of 99.82 on
1/2/04 and a high of 101.32 on 3/18/05, according to
Bloomberg.
3. Yields remain compelling: Average senior loan CEF has a
distribution yield of 7.01% (as of 6/28/13, according to
Morningstar). This average yield is particularly compelling
in light of the limited duration risk the underlying asset
class of senior loans have.
As always, due to the fact that closed-end funds can exhibit
periods of high volatility, investors are encouraged to maintain
a long-term time horizon and exposure to different types of
funds.
15 …your link with the Global Investment Community
All opinions expressed constitute judgments as of the date of release, and are subject to change without notice. There can be no assurance any forecasts will
be achieved. The information is taken from sources that we believe to be reliable but we do not guarantee its accuracy or completeness.
CEF Sector Review
16
Global ETP Monthly Overview
Source: BlackRock
…your link with the Global Investment Community
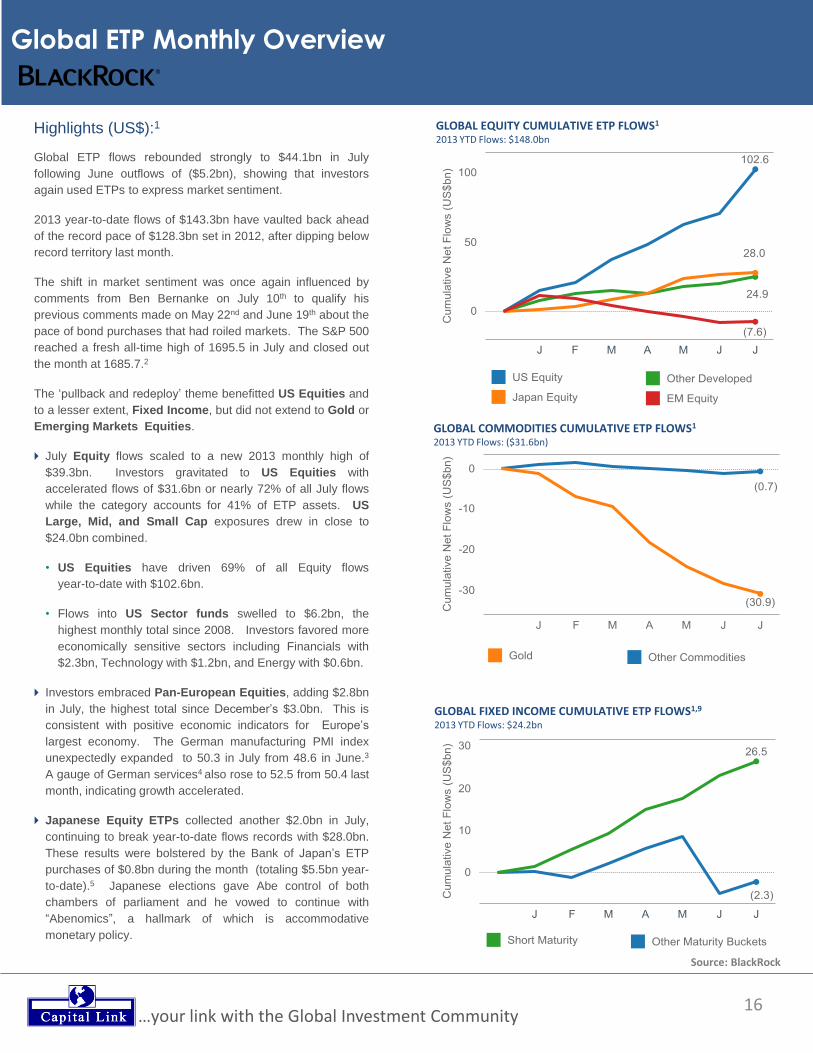
Highlights (US$):1
Global ETP flows rebounded strongly to $44.1bn in July
following June outflows of ($5.2bn), showing that investors
again used ETPs to express market sentiment.
2013 year-to-date flows of $143.3bn have vaulted back ahead
of the record pace of $128.3bn set in 2012, after dipping below
record territory last month.
The shift in market sentiment was once again influenced by
comments from Ben Bernanke on July 10th to qualify his
previous comments made on May 22nd and June 19th about the
pace of bond purchases that had roiled markets. The S&P 500
reached a fresh all-time high of 1695.5 in July and closed out
the month at 1685.7.2
The ‘pullback and redeploy’ theme benefitted US Equities and
to a lesser extent, Fixed Income, but did not extend to Gold or
Emerging Markets Equities.
July Equity flows scaled to a new 2013 monthly high of
$39.3bn. Investors gravitated to US Equities with
accelerated flows of $31.6bn or nearly 72% of all July flows
while the category accounts for 41% of ETP assets. US
Large, Mid, and Small Cap exposures drew in close to
$24.0bn combined.
• US Equities have driven 69% of all Equity flows
year-to-date with $102.6bn.
• Flows into US Sector funds swelled to $6.2bn, the
highest monthly total since 2008. Investors favored more
economically sensitive sectors including Financials with
$2.3bn, Technology with $1.2bn, and Energy with $0.6bn.
Investors embraced Pan-European Equities, adding $2.8bn
in July, the highest total since December’s $3.0bn. This is
consistent with positive economic indicators for Europe’s
largest economy. The German manufacturing PMI index
unexpectedly expanded to 50.3 in July from 48.6 in June.3
A gauge of German services4 also rose to 52.5 from 50.4 last
month, indicating growth accelerated.
Japanese Equity ETPs collected another $2.0bn in July,
continuing to break year-to-date flows records with $28.0bn.
These results were bolstered by the Bank of Japan’s ETP
purchases of $0.8bn during the month (totaling $5.5bn year-
to-date).5 Japanese elections gave Abe control of both
chambers of parliament and he vowed to continue with
“Abenomics”, a hallmark of which is accommodative
monetary policy.
GLOBAL COMMODITIES CUMULATIVE ETP FLOWS1 2013 YTD Flows: ($31.6bn)
GLOBAL FIXED INCOME CUMULATIVE ETP FLOWS1,9 2013 YTD Flows: $24.2bn
GLOBAL EQUITY CUMULATIVE ETP FLOWS1 2013 YTD Flows: $148.0bn
17
Global ETP Monthly Overview (continued)
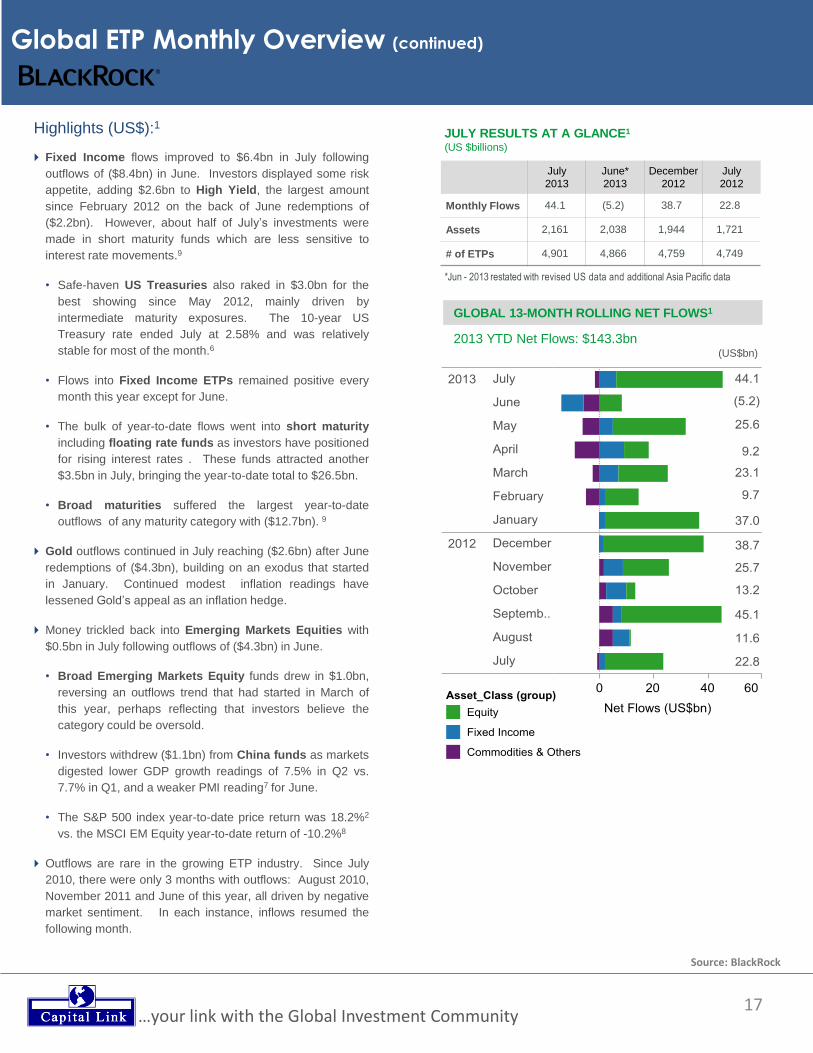
GLOBAL 13-MONTH ROLLING NET FLOWS1
2013 YTD Net Flows: $143.3bn
Source: BlackRock
…your link with the Global Investment Community
JULY RESULTS AT A GLANCE1
(US $billions)
*Jun - 2013 restated with revised US data and additional Asia Pacific data
July
2013
June*
2013
December
2012
July
2012
Monthly Flows 44.1 (5.2) 38.7 22.8
Assets 2,161 2,038 1,944 1,721
# of ETPs 4,901 4,866 4,759 4,749
(US$bn)
Highlights (US$):1
Fixed Income flows improved to $6.4bn in July following
outflows of ($8.4bn) in June. Investors displayed some risk
appetite, adding $2.6bn to High Yield, the largest amount
since February 2012 on the back of June redemptions of
($2.2bn). However, about half of July’s investments were
made in short maturity funds which are less sensitive to
interest rate movements.9
• Safe-haven US Treasuries also raked in $3.0bn for the
best showing since May 2012, mainly driven by
intermediate maturity exposures. The 10-year US
Treasury rate ended July at 2.58% and was relatively
stable for most of the month.6
• Flows into Fixed Income ETPs remained positive every
month this year except for June.
• The bulk of year-to-date flows went into short maturity
including floating rate funds as investors have positioned
for rising interest rates . These funds attracted another
$3.5bn in July, bringing the year-to-date total to $26.5bn.
• Broad maturities suffered the largest year-to-date
outflows of any maturity category with ($12.7bn). 9
Gold outflows continued in July reaching ($2.6bn) after June
redemptions of ($4.3bn), building on an exodus that started
in January. Continued modest inflation readings have
lessened Gold’s appeal as an inflation hedge.
Money trickled back into Emerging Markets Equities with
$0.5bn in July following outflows of ($4.3bn) in June.
• Broad Emerging Markets Equity funds drew in $1.0bn,
reversing an outflows trend that had started in March of
this year, perhaps reflecting that investors believe the
category could be oversold.
• Investors withdrew ($1.1bn) from China funds as markets
digested lower GDP growth readings of 7.5% in Q2 vs.
7.7% in Q1, and a weaker PMI reading7 for June.
• The S&P 500 index year-to-date price return was 18.2%2
vs. the MSCI EM Equity year-to-date return of -10.2%8
Outflows are rare in the growing ETP industry. Since July
2010, there were only 3 months with outflows: August 2010,
November 2011 and June of this year, all driven by negative
market sentiment. In each instance, inflows resumed the
following month.
18
Global ETP Year-To-Date Overview
Source: BlackRock
…your link with the Global Investment Community
OUTFLOWS ARE RARE IN THE GLOBAL ETP INDUSTRY1
Monthly Global ETP Flows
GLOBAL ETP CUMULATIVE NET FLOWS1
Record YTD Flows in 2013: $143.3bn
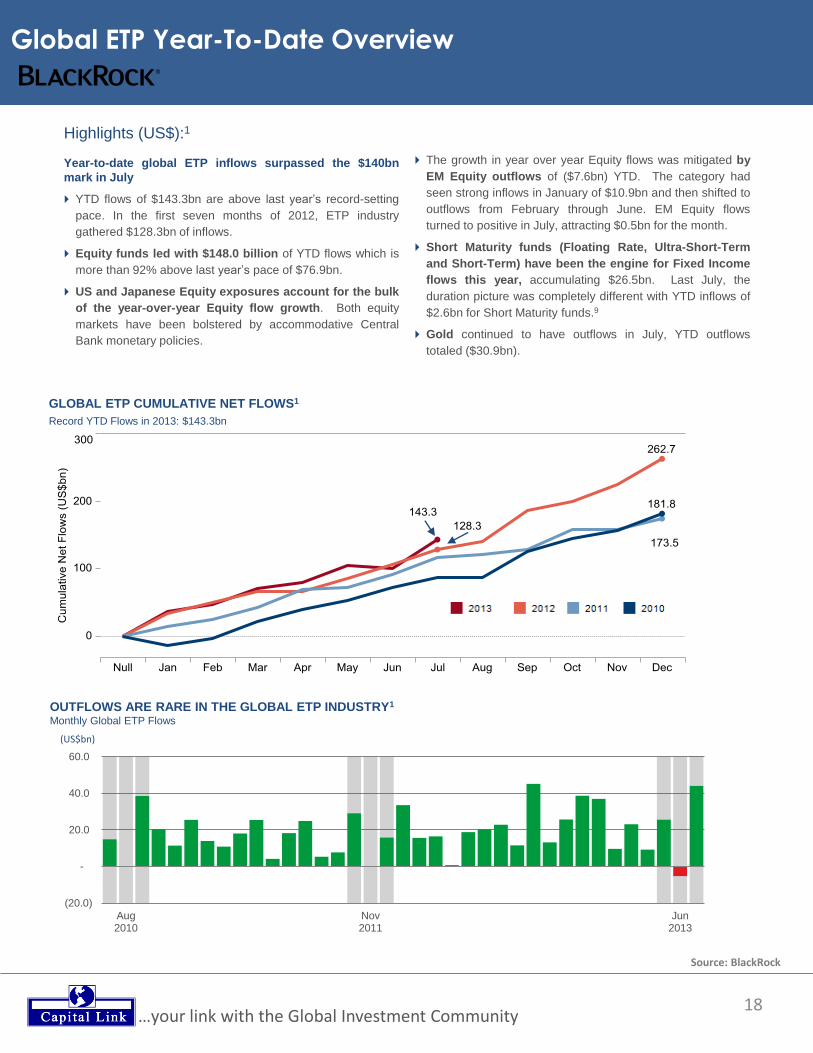
Highlights (US$):1
Year-to-date global ETP inflows surpassed the $140bn
mark in July
YTD flows of $143.3bn are above last year’s record-setting
pace. In the first seven months of 2012, ETP industry
gathered $128.3bn of inflows.
Equity funds led with $148.0 billion of YTD flows which is
more than 92% above last year’s pace of $76.9bn.
US and Japanese Equity exposures account for the bulk
of the year-over-year Equity flow growth. Both equity
markets have been bolstered by accommodative Central
Bank monetary policies.
The growth in year over year Equity flows was mitigated by
EM Equity outflows of ($7.6bn) YTD. The category had
seen strong inflows in January of $10.9bn and then shifted to
outflows from February through June. EM Equity flows
turned to positive in July, attracting $0.5bn for the month.
Short Maturity funds (Floating Rate, Ultra-Short-Term
and Short-Term) have been the engine for Fixed Income
flows this year, accumulating $26.5bn. Last July, the
duration picture was completely different with YTD inflows of
$2.6bn for Short Maturity funds.9
Gold continued to have outflows in July, YTD outflows
totaled ($30.9bn).
(20.0)
-
20.0
40.0
60.0
Aug2010
Nov2011
Jun2013
(US$bn)
19
Largest Asset Gathering ETPs Launched in 2013
Source: BlackRock
…your link with the Global Investment Community
Product Name (US$mn)1
Bloomberg
Ticker Exposure
Listing
Region
Launch
Date
Assets as of
July 2013
Highlights (US$):1
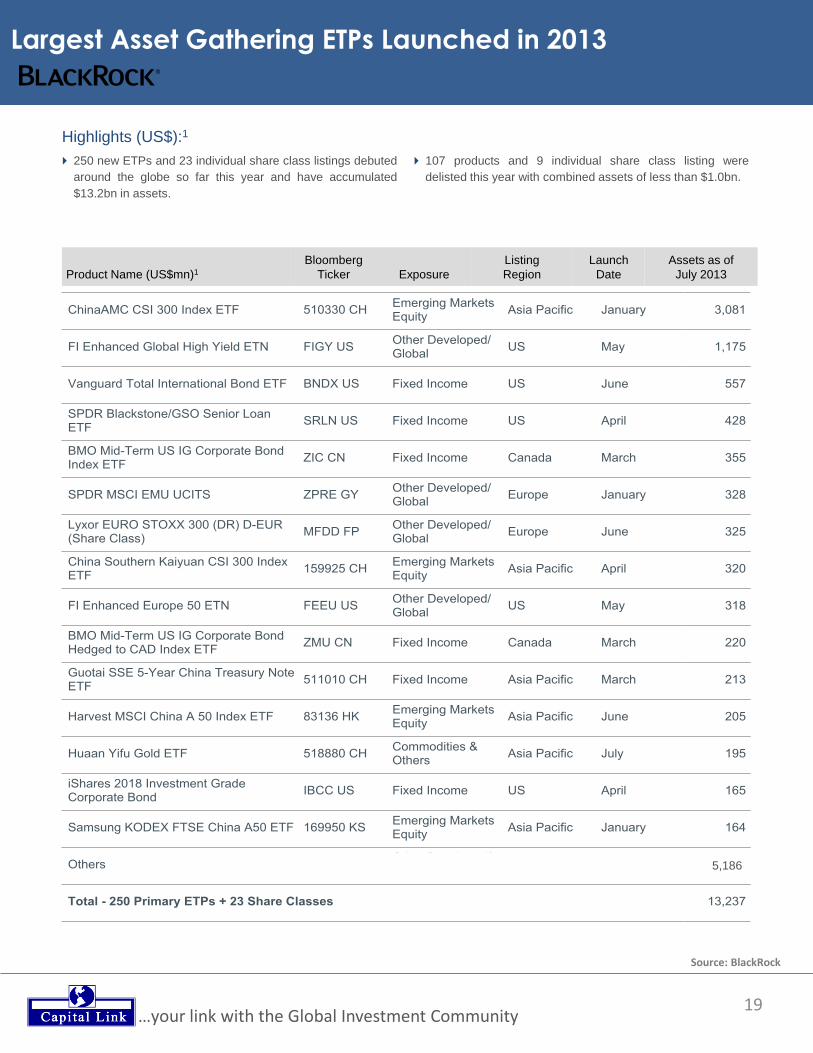
250 new ETPs and 23 individual share class listings debuted
around the globe so far this year and have accumulated
$13.2bn in assets.
107 products and 9 individual share class listing were
delisted this year with combined assets of less than $1.0bn.
5,186
20
Largest Year-to-Date Fund Inflows and Outflows
Source: BlackRock
…your link with the Global Investment Community
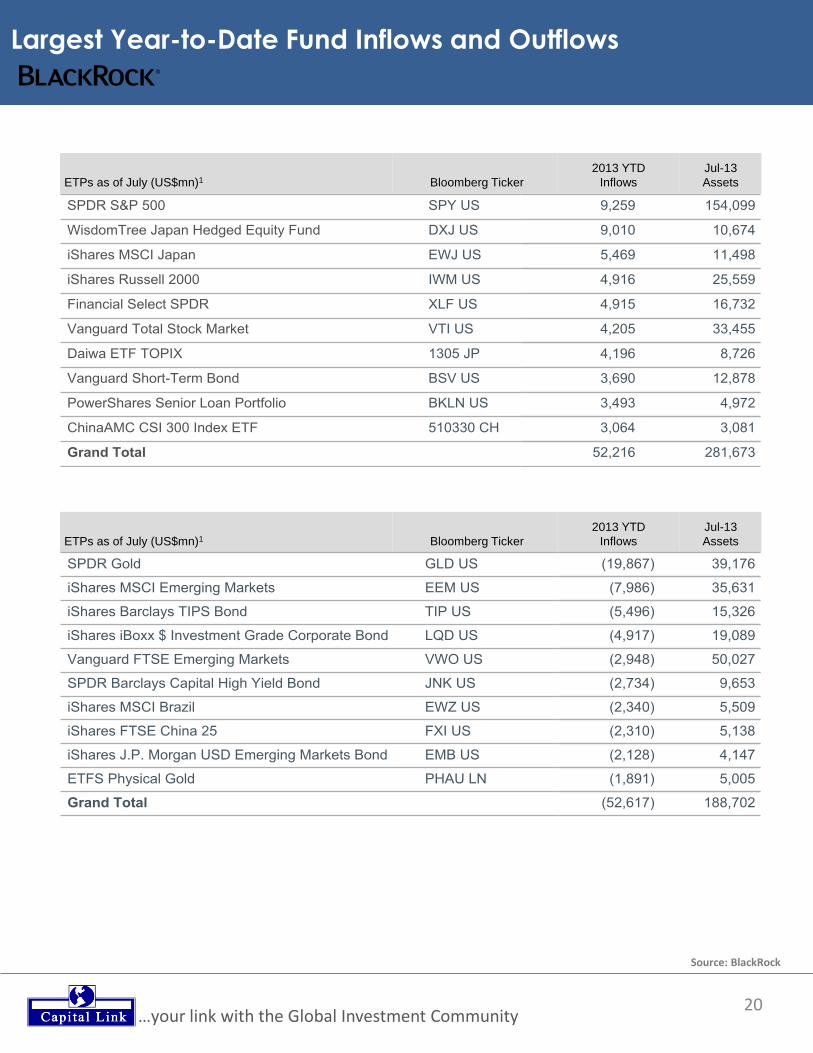
ETPs as of July (US$mn)1 Bloomberg Ticker
2013 YTD
Inflows
Jul-13
Assets
ETPs as of July (US$mn)1 Bloomberg Ticker
2013 YTD
Inflows
Jul-13
Assets
21
Global ETP Flows by Exposure – Developed Equity
Source: BlackRock
…your link with the Global Investment Community
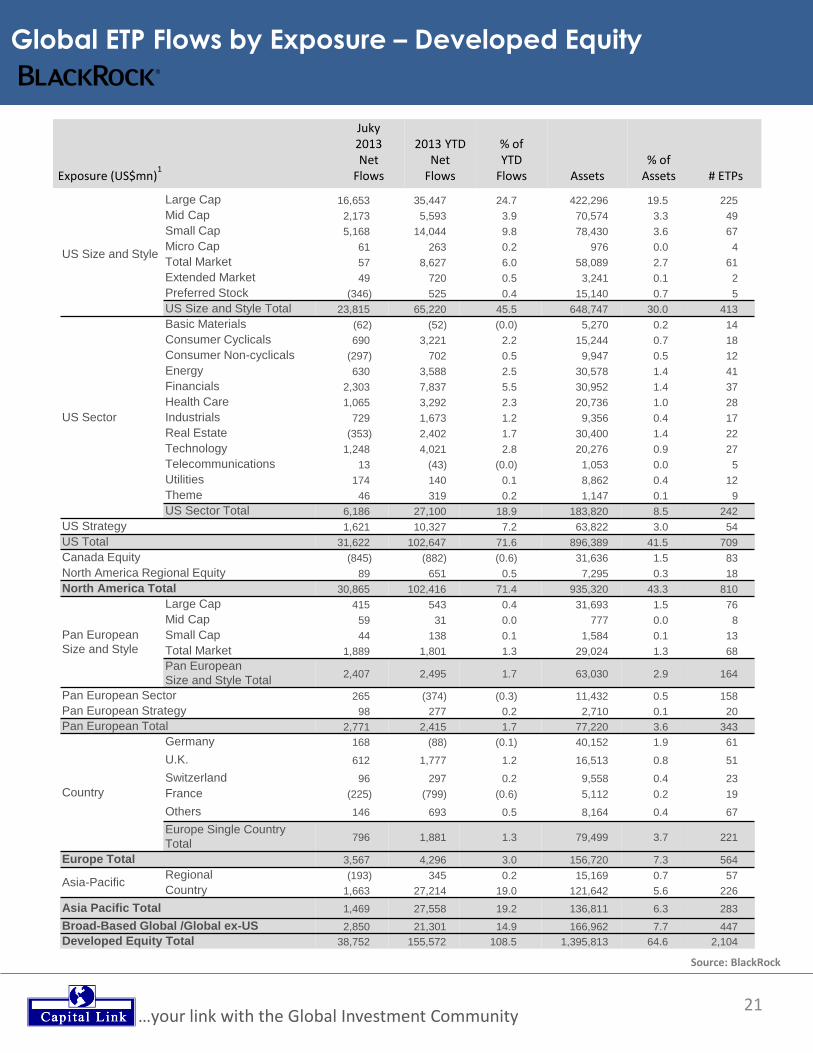
US Size and Style
Large Cap 16,653 35,447 24.7 422,296 19.5 225
Mid Cap 2,173 5,593 3.9 70,574 3.3 49
Small Cap 5,168 14,044 9.8 78,430 3.6 67
Micro Cap 61 263 0.2 976 0.0 4
Total Market 57 8,627 6.0 58,089 2.7 61
Extended Market 49 720 0.5 3,241 0.1 2
Preferred Stock (346) 525 0.4 15,140 0.7 5
US Size and Style Total 23,815 65,220 45.5 648,747 30.0 413
US Sector
Basic Materials (62) (52) (0.0) 5,270 0.2 14
Consumer Cyclicals 690 3,221 2.2 15,244 0.7 18
Consumer Non-cyclicals (297) 702 0.5 9,947 0.5 12
Energy 630 3,588 2.5 30,578 1.4 41
Financials 2,303 7,837 5.5 30,952 1.4 37
Health Care 1,065 3,292 2.3 20,736 1.0 28
Industrials 729 1,673 1.2 9,356 0.4 17
Real Estate (353) 2,402 1.7 30,400 1.4 22
Technology 1,248 4,021 2.8 20,276 0.9 27
Telecommunications 13 (43) (0.0) 1,053 0.0 5
Utilities 174 140 0.1 8,862 0.4 12
Theme 46 319 0.2 1,147 0.1 9
US Sector Total 6,186 27,100 18.9 183,820 8.5 242
US Strategy 1,621 10,327 7.2 63,822 3.0 54
US Total 31,622 102,647 71.6 896,389 41.5 709
Canada Equity (845) (882) (0.6) 31,636 1.5 83
North America Regional Equity 89 651 0.5 7,295 0.3 18
North America Total 30,865 102,416 71.4 935,320 43.3 810
Pan European
Size and Style
Large Cap 415 543 0.4 31,693 1.5 76
Mid Cap 59 31 0.0 777 0.0 8
Small Cap 44 138 0.1 1,584 0.1 13
Total Market 1,889 1,801 1.3 29,024 1.3 68
Pan European
Size and Style Total 2,407 2,495 1.7 63,030 2.9 164
Pan European Sector 265 (374) (0.3) 11,432 0.5 158
Pan European Strategy 98 277 0.2 2,710 0.1 20
Pan European Total 2,771 2,415 1.7 77,220 3.6 343
Country
Germany 168 (88) (0.1) 40,152 1.9 61
U.K. 612 1,777 1.2 16,513 0.8 51
Switzerland 96 297 0.2 9,558 0.4 23
France (225) (799) (0.6) 5,112 0.2 19
Others 146 693 0.5 8,164 0.4 67
Europe Single Country
Total 796 1,881 1.3 79,499 3.7 221
Europe Total 3,567 4,296 3.0 156,720 7.3 564
Asia-Pacific Regional (193) 345 0.2 15,169 0.7 57
Country 1,663 27,214 19.0 121,642 5.6 226
Asia Pacific Total 1,469 27,558 19.2 136,811 6.3 283
Broad-Based Global /Global ex-US 2,850 21,301 14.9 166,962 7.7 447
Developed Equity Total 38,752 155,572 108.5 1,395,813 64.6 2,104
Exposure (US$mn)1
Juky 2013 Net
Flows
2013 YTD Net
Flows
% of YTD
Flows Assets % of
Assets # ETPs
22
Endnotes
…your link with the Global Investment Community
Endnotes: BlackRock’s ETP Landscape: Monthly Highlights report
"ETP" (or exchange traded product) as referred to above means any portfolio exposure security that trades intraday on a US exchange. ETPs include exchange traded funds
(ETFs) registered with the SEC under the Investment Company Act of 1940 (open-end funds and unit investment trusts or UITs) and certain trusts, commodity pools and exchange
traded notes (ETNs) registered with the SEC under the Securities Act of 1933.
The data for this report are captured from a number of sources by the BlackRock Investment Institute including provider websites, fund prospectuses, provider press releases,
provider surveys, Bloomberg, the National Stock Exchange, Strategic Insight Simfund, Wind and the Bank of Israel. All amounts are reported in US dollars. Net flows are derived
using daily net asset values and shares outstanding using the most recent data we can capture at month-end. For products with cross-listings, we attribute net flows and assets to
the primary listings. Where price is not available, we use an approximation.
1. Data is as of July 30, 2013 for Europe and July 31, 2013 for the US, Canada, Latin America, Israel, and some Asia ETPs. Some Asia ETP data is as of June 30, 2013.
Global ETP flows and assets are sourced using shares outstanding and net asset values from Bloomberg for the US, Canada, Europe, Latin America and some ETPs in Asia.
Middle East ETP assets are sourced from the Bank of Israel. ETP flows and assets in China are sourced from Wind. Inflows for years prior to 2010 are sourced from
Strategic Insights Simfund. Asset classifications are assigned by the BlackRock based on product definitions from provider websites and product prospectuses. Other static
product information is obtained from provider websites , product prospectuses, provider press releases, and provider surveys. Market returns are source from Bloomberg.
2. Source: Bloomberg, S&P 500 Index (SPX Index), as of July 31st 2013
3. Source: Bloomberg, Germany Manufacturing PMI Markit Survey Index (PMITMGE Index), as of July 2013.
4. Source: Bloomberg, Germany Services PMI Markit Survey Index (PMITSGE Index), as of July 2013.
5. Source: Bank of Japan, as of July 31st 2013.
6. Source: Bloomberg, US Generic Government 10 Year Yield Index (USGG10YR Index), as of July 31st 2013.
7. Source: Bloomberg, HSBC China Manufacturing PMI Index (EC11CHPM Index), July preliminary reading.
8. Source: Bloomberg, MSCI Emerging Markets Index (MXEF Index), as of July 31st 2013.
9. We classify maturity buckets of a Fixed Income ETP if the fund invests at least 70% of its assets in the corresponding maturity/exposure range: Short maturity includes:
underlying security maturities < 3 years and floating rate where the fund holds floating rate securities and/or bank loans. Intermediate includes: 3 years < underlying security
maturities < 10 years. The “other” category includes Long-Term: underlying security maturities > 10 years; Broad Maturities: The fund invests in more than two maturity
buckets without emphasizing one; Selected Maturities: The fund holds securities with multiple selected range of maturity buckets, i.e. barbell strategy which focus on the
specific short-term and long-term buckets with even weights; and Fixed Maturity: The fund itself has a target maturity date and arranged holdings correspondingly
10. Source: BlackRock, Bloomberg
Disclosures: (c) 2013 BlackRock, Inc. All rights reserved. Reprinted with permission. The ETF Sector Review is for informational purposes only, and does not constitute investment advice or
an offer to sell or the solicitation of an offer to buy any security of any entity in any jurisdiction. The ETF Sector Review represents an assessment of the market environment at a
specific time and is not intended to be relied upon by the reader as research, a forecast of future events or a guarantee of future results.
The ETF Sector Review does not provide financial, investment or tax advice or information relating to the securities of any particular fund or other issuer. The information and
opinions included are based on publicly available information, are subject to change and should not be relied upon for any purpose other than general information and education.
This Review has been prepared without regard to the individual financial circumstances and objectives of those who receive it and the types of securities discussed in this
publication may not be suitable for all investors.
The information included in the ETF Sector Review has been taken from trade and other sources considered to be reliable. This document is published in good faith but no
representation or warranty, express or implied, is made by BlackRock or by any person as to its accuracy or completeness and it should not be relied on as such. BlackRock or any
of its directors, officers, employees or agents shall have no liability for any loss or damage arising out of the use or reliance on the material provided including without limitation, any
loss of profit or any other damage, direct or consequential. Any opinions expressed in this document reflect our analysis at this date and are subject to change.
Date | Time: Aug. 20, 2013 at 11AM – 12 PM ET
Overview: Doug Bond, Portfolio Manager of the Cohen & Steers Closed-End Opportunity Fund
(NYSE: FOF) will discuss changes that have happened in the closed-end fund
market in 2013. He will identify opportunities that have emerged and offer his
thoughts on where to find value in closed-end funds and what to expect for the rest
of 2013. Douglas Bond
Executive VP,
Portfolio Manager
Cohen & Steers
Complimentary Webcast Featuring Cohen & Steers
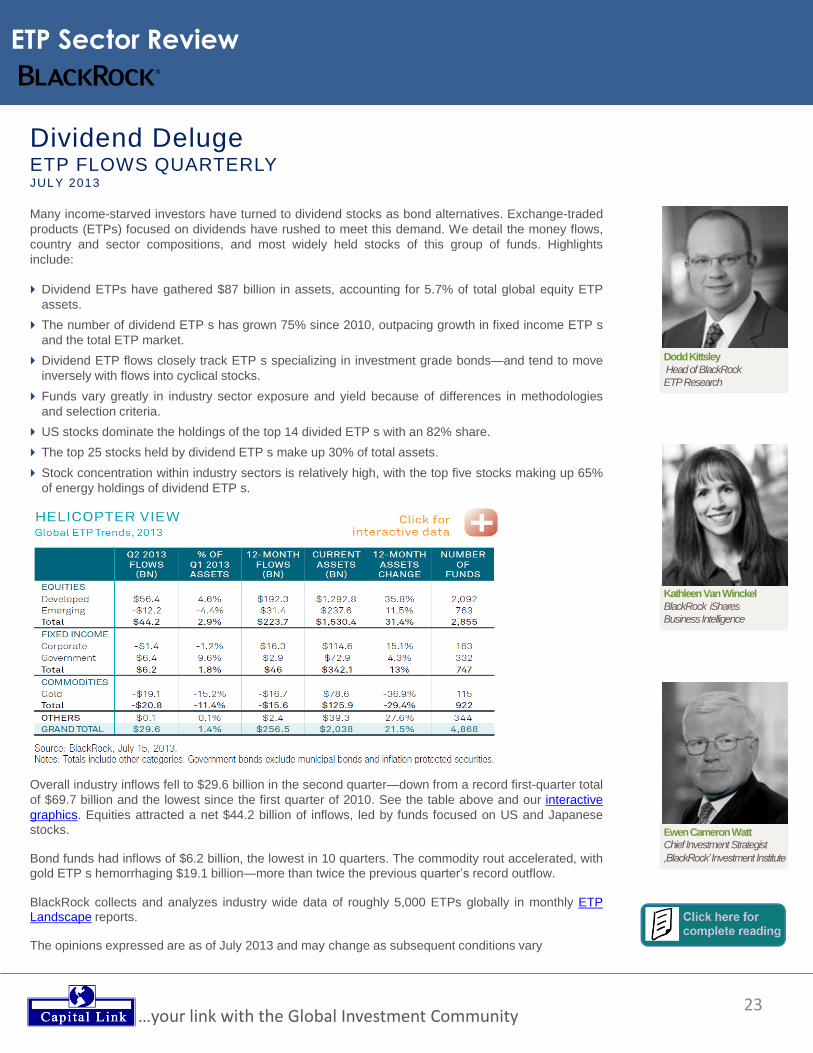
23 …your link with the Global Investment Community
ETP Sector Review
Dodd Kittsley
Head of BlackRock
ETP Research
Kathleen Van Winckel
BlackRock iShares
Business Intelligence
Ewen Cameron Watt Chief Investment Strategist
,BlackRock’ Investment Institute
Many income-starved investors have turned to dividend stocks as bond alternatives. Exchange-traded
products (ETPs) focused on dividends have rushed to meet this demand. We detail the money flows,
country and sector compositions, and most widely held stocks of this group of funds. Highlights
include:
Dividend ETPs have gathered $87 billion in assets, accounting for 5.7% of total global equity ETP
assets.
The number of dividend ETP s has grown 75% since 2010, outpacing growth in fixed income ETP s
and the total ETP market.
Dividend ETP flows closely track ETP s specializing in investment grade bonds—and tend to move
inversely with flows into cyclical stocks.
Funds vary greatly in industry sector exposure and yield because of differences in methodologies
and selection criteria.
US stocks dominate the holdings of the top 14 divided ETP s with an 82% share.
The top 25 stocks held by dividend ETP s make up 30% of total assets.
Stock concentration within industry sectors is relatively high, with the top five stocks making up 65%
of energy holdings of dividend ETP s.
Dividend Deluge ETP FLOWS QUARTERLY JULY 2013
Overall industry inflows fell to $29.6 billion in the second quarter—down from a record first-quarter total
of $69.7 billion and the lowest since the first quarter of 2010. See the table above and our interactive
graphics. Equities attracted a net $44.2 billion of inflows, led by funds focused on US and Japanese
stocks.
Bond funds had inflows of $6.2 billion, the lowest in 10 quarters. The commodity rout accelerated, with
gold ETP s hemorrhaging $19.1 billion—more than twice the previous quarter’s record outflow.
BlackRock collects and analyzes industry wide data of roughly 5,000 ETPs globally in monthly ETP Landscape reports.
The opinions expressed are as of July 2013 and may change as subsequent conditions vary
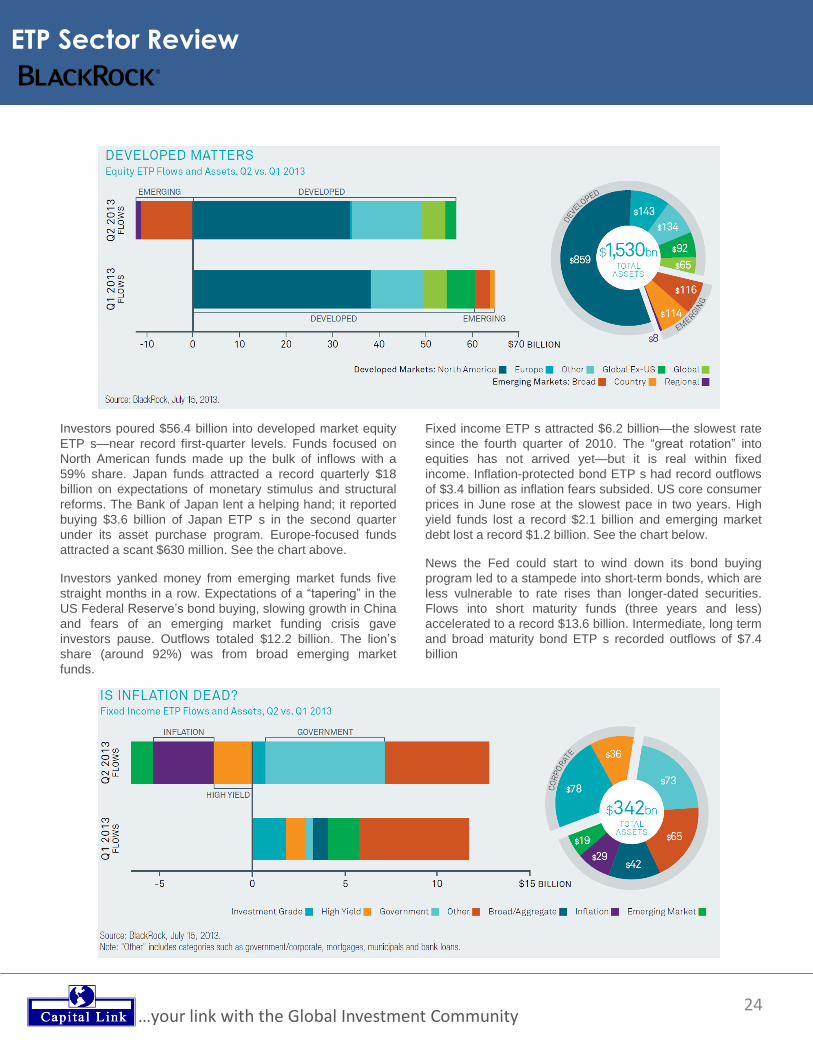
24 …your link with the Global Investment Community
ETP Sector Review
Investors poured $56.4 billion into developed market equity
ETP s—near record first-quarter levels. Funds focused on
North American funds made up the bulk of inflows with a
59% share. Japan funds attracted a record quarterly $18
billion on expectations of monetary stimulus and structural
reforms. The Bank of Japan lent a helping hand; it reported
buying $3.6 billion of Japan ETP s in the second quarter
under its asset purchase program. Europe-focused funds
attracted a scant $630 million. See the chart above.
Investors yanked money from emerging market funds five
straight months in a row. Expectations of a “tapering” in the
US Federal Reserve’s bond buying, slowing growth in China
and fears of an emerging market funding crisis gave
investors pause. Outflows totaled $12.2 billion. The lion’s
share (around 92%) was from broad emerging market
funds.
Fixed income ETP s attracted $6.2 billion—the slowest rate
since the fourth quarter of 2010. The “great rotation” into
equities has not arrived yet—but it is real within fixed
income. Inflation-protected bond ETP s had record outflows
of $3.4 billion as inflation fears subsided. US core consumer
prices in June rose at the slowest pace in two years. High
yield funds lost a record $2.1 billion and emerging market
debt lost a record $1.2 billion. See the chart below.
News the Fed could start to wind down its bond buying
program led to a stampede into short-term bonds, which are
less vulnerable to rate rises than longer-dated securities.
Flows into short maturity funds (three years and less)
accelerated to a record $13.6 billion. Intermediate, long term
and broad maturity bond ETP s recorded outflows of $7.4
billion
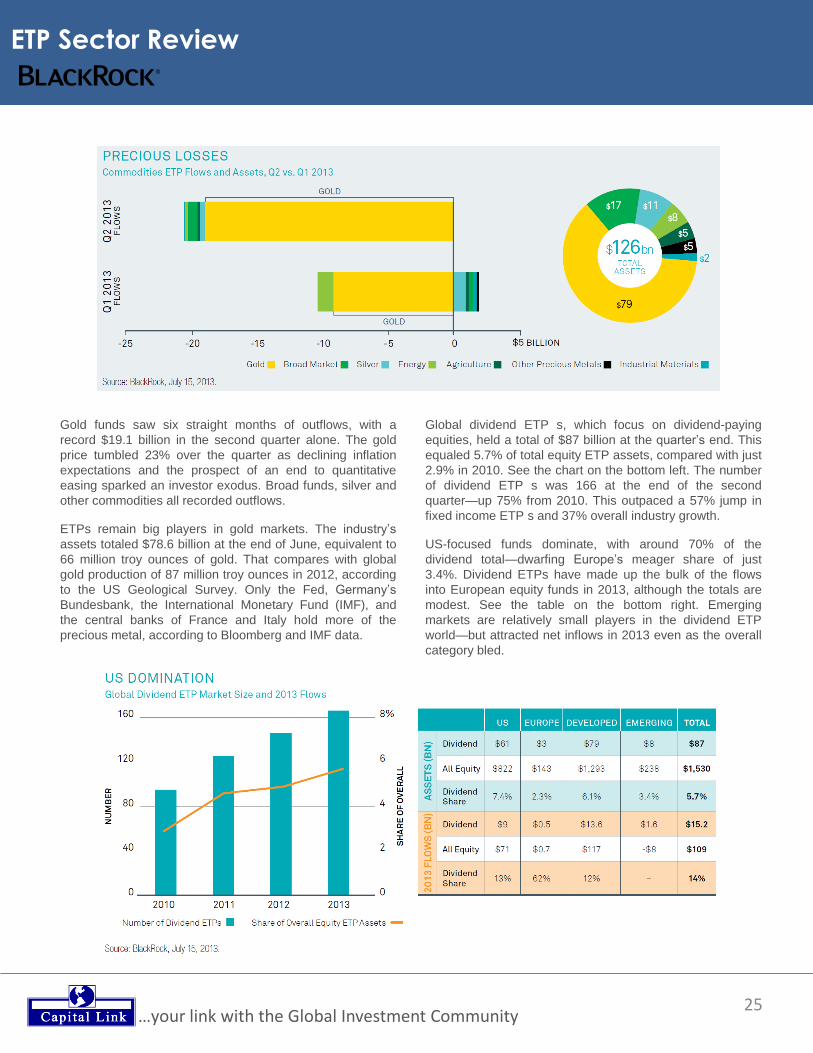
25 …your link with the Global Investment Community
ETP Sector Review
Gold funds saw six straight months of outflows, with a
record $19.1 billion in the second quarter alone. The gold
price tumbled 23% over the quarter as declining inflation
expectations and the prospect of an end to quantitative
easing sparked an investor exodus. Broad funds, silver and
other commodities all recorded outflows.
ETPs remain big players in gold markets. The industry’s
assets totaled $78.6 billion at the end of June, equivalent to
66 million troy ounces of gold. That compares with global
gold production of 87 million troy ounces in 2012, according
to the US Geological Survey. Only the Fed, Germany’s
Bundesbank, the International Monetary Fund (IMF), and
the central banks of France and Italy hold more of the
precious metal, according to Bloomberg and IMF data.
Global dividend ETP s, which focus on dividend-paying
equities, held a total of $87 billion at the quarter’s end. This
equaled 5.7% of total equity ETP assets, compared with just
2.9% in 2010. See the chart on the bottom left. The number
of dividend ETP s was 166 at the end of the second
quarter—up 75% from 2010. This outpaced a 57% jump in
fixed income ETP s and 37% overall industry growth.
US-focused funds dominate, with around 70% of the
dividend total—dwarfing Europe’s meager share of just
3.4%. Dividend ETPs have made up the bulk of the flows
into European equity funds in 2013, although the totals are
modest. See the table on the bottom right. Emerging
markets are relatively small players in the dividend ETP
world—but attracted net inflows in 2013 even as the overall
category bled.
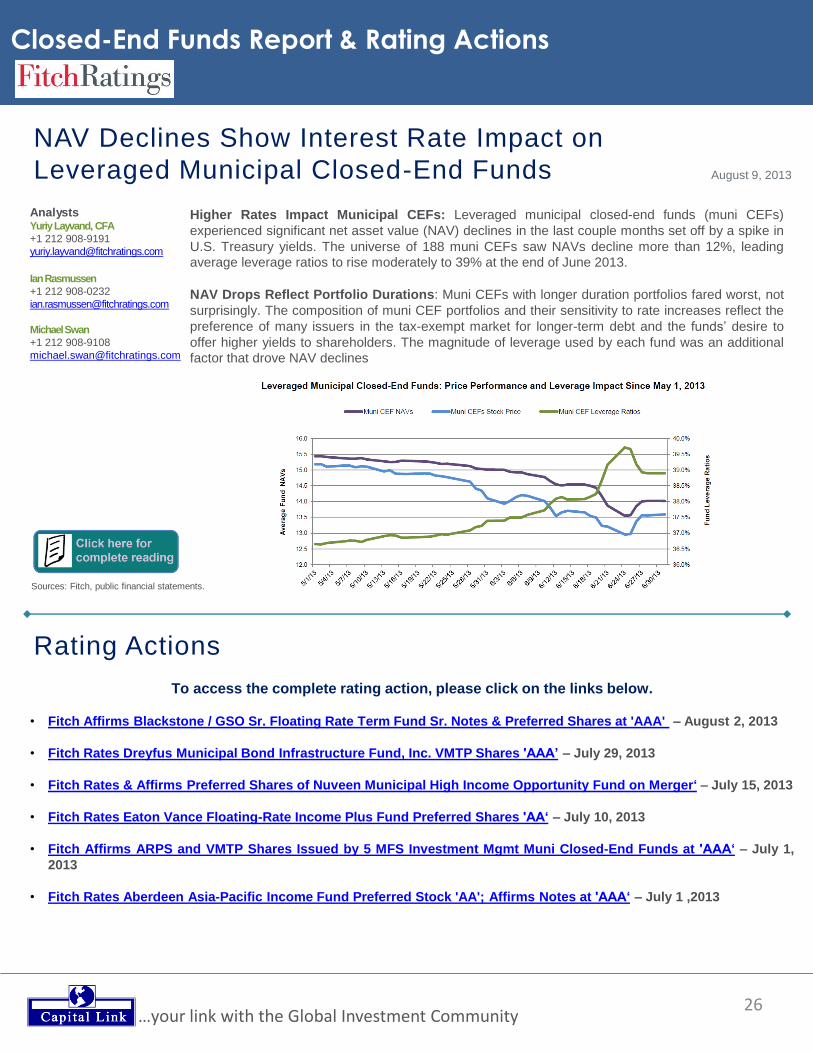
NAV Declines Show Interest Rate Impact on
Leveraged Municipal Closed-End Funds
26
Closed-End Funds Report & Rating Actions
…your link with the Global Investment Community
August 9, 2013
Analysts Yuriy Layvand, CFA
+1 212 908-9191
Ian Rasmussen
+1 212 908-0232
Michael Swan
+1 212 908-9108
Higher Rates Impact Municipal CEFs: Leveraged municipal closed-end funds (muni CEFs)
experienced significant net asset value (NAV) declines in the last couple months set off by a spike in
U.S. Treasury yields. The universe of 188 muni CEFs saw NAVs decline more than 12%, leading
average leverage ratios to rise moderately to 39% at the end of June 2013. NAV Drops Reflect Portfolio Durations: Muni CEFs with longer duration portfolios fared worst, not
surprisingly. The composition of muni CEF portfolios and their sensitivity to rate increases reflect the
preference of many issuers in the tax-exempt market for longer-term debt and the funds’ desire to
offer higher yields to shareholders. The magnitude of leverage used by each fund was an additional
factor that drove NAV declines
Sources: Fitch, public financial statements.
Rating Actions
To access the complete rating action, please click on the links below.
• Fitch Affirms Blackstone / GSO Sr. Floating Rate Term Fund Sr. Notes & Preferred Shares at 'AAA' – August 2, 2013
• Fitch Rates Dreyfus Municipal Bond Infrastructure Fund, Inc. VMTP Shares 'AAA’ – July 29, 2013
• Fitch Rates & Affirms Preferred Shares of Nuveen Municipal High Income Opportunity Fund on Merger‘ – July 15, 2013
• Fitch Rates Eaton Vance Floating-Rate Income Plus Fund Preferred Shares 'AA‘ – July 10, 2013
• Fitch Affirms ARPS and VMTP Shares Issued by 5 MFS Investment Mgmt Muni Closed-End Funds at 'AAA‘ – July 1,
2013
• Fitch Rates Aberdeen Asia-Pacific Income Fund Preferred Stock 'AA'; Affirms Notes at 'AAA‘ – July 1 ,2013
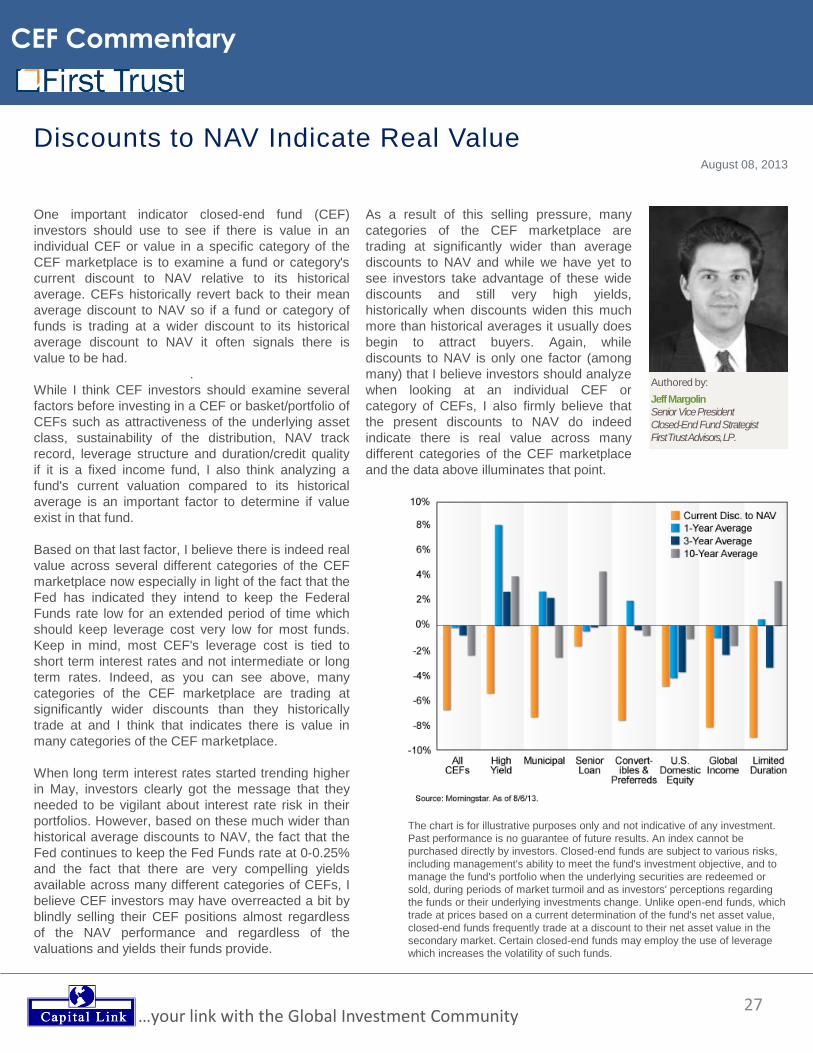
27 …your link with the Global Investment Community
Authored by:
Jeff Margolin
Senior Vice President
Closed-End Fund Strategist
First Trust Advisors, LP.
Discounts to NAV Indicate Real Value
One important indicator closed-end fund (CEF)
investors should use to see if there is value in an
individual CEF or value in a specific category of the
CEF marketplace is to examine a fund or category's
current discount to NAV relative to its historical
average. CEFs historically revert back to their mean
average discount to NAV so if a fund or category of
funds is trading at a wider discount to its historical
average discount to NAV it often signals there is
value to be had.
.
While I think CEF investors should examine several
factors before investing in a CEF or basket/portfolio of
CEFs such as attractiveness of the underlying asset
class, sustainability of the distribution, NAV track
record, leverage structure and duration/credit quality
if it is a fixed income fund, I also think analyzing a
fund's current valuation compared to its historical
average is an important factor to determine if value
exist in that fund.
Based on that last factor, I believe there is indeed real
value across several different categories of the CEF
marketplace now especially in light of the fact that the
Fed has indicated they intend to keep the Federal
Funds rate low for an extended period of time which
should keep leverage cost very low for most funds.
Keep in mind, most CEF's leverage cost is tied to
short term interest rates and not intermediate or long
term rates. Indeed, as you can see above, many
categories of the CEF marketplace are trading at
significantly wider discounts than they historically
trade at and I think that indicates there is value in
many categories of the CEF marketplace.
When long term interest rates started trending higher
in May, investors clearly got the message that they
needed to be vigilant about interest rate risk in their
portfolios. However, based on these much wider than
historical average discounts to NAV, the fact that the
Fed continues to keep the Fed Funds rate at 0-0.25%
and the fact that there are very compelling yields
available across many different categories of CEFs, I
believe CEF investors may have overreacted a bit by
blindly selling their CEF positions almost regardless
of the NAV performance and regardless of the
valuations and yields their funds provide.
CEF Commentary
August 08, 2013
As a result of this selling pressure, many
categories of the CEF marketplace are
trading at significantly wider than average
discounts to NAV and while we have yet to
see investors take advantage of these wide
discounts and still very high yields,
historically when discounts widen this much
more than historical averages it usually does
begin to attract buyers. Again, while
discounts to NAV is only one factor (among
many) that I believe investors should analyze
when looking at an individual CEF or
category of CEFs, I also firmly believe that
the present discounts to NAV do indeed
indicate there is real value across many
different categories of the CEF marketplace
and the data above illuminates that point.
The chart is for illustrative purposes only and not indicative of any investment.
Past performance is no guarantee of future results. An index cannot be
purchased directly by investors. Closed-end funds are subject to various risks,
including management's ability to meet the fund's investment objective, and to
manage the fund's portfolio when the underlying securities are redeemed or
sold, during periods of market turmoil and as investors' perceptions regarding
the funds or their underlying investments change. Unlike open-end funds, which
trade at prices based on a current determination of the fund's net asset value,
closed-end funds frequently trade at a discount to their net asset value in the
secondary market. Certain closed-end funds may employ the use of leverage
which increases the volatility of such funds.
28 …your link with the Global Investment Community
CEF Commentary
August 02, 2013
Closed-End Funds
Authored by:
W. Jeffrey Lee Analyst, Wells Fargo Advisors
Mariana F. Bush, CFA Senior Analyst,
Wells Fargo Advisors
Dan Brown, CFA Analyst, Wells Fargo Advisors
Closed-end Funds with Finite Lives
A primer on target-price term trusts and term trusts
Most investment funds, including closed-end funds (CEFs), are structured so that they have perpetual
lives. In other words, there is no maturity date and the investor will need to liquidate his/her holdings if
exposure to a particular fund is no longer desired. There are a few CEFs, however, that do have
maturities. The purpose of this report is to serve as a primer on two structures of such CEFs, the
target-price term trusts and the term trusts, and to discuss what we view as the pros and cons of
each.
Target-Price Term Trusts
Target-price term trusts are the first generation of term trusts.
This type of CEF not only has a finite life; it also attempts to
return the IPO price at maturity. For example, if a CEF is
launched at a price of $25 it would be the goal of the sponsor
to return a price of at least $25 per share at its maturity. Note
that while the sponsor strives to return the IPO price, the
ending distribution is not guaranteed to equal or exceed the
IPO price, nor is the sponsor obligated to pay the
shareholders an amount equal to any potential shortfall. At
this point, BlackRock is the only CEF sponsor that continues
to use the first generation of term trust, of which there are
three. Other sponsors have launched second-generation term
trusts, which will be discussed shortly.
How does it work?
Because CEFs, more or less, have a fixed number of shares
(excluding the effects of some forms of distribution
reinvestment or other corporate actions), the task of returning
a specific price is somewhat simpler than it would be for an
investment product that has share creations/redemptions.
Moreover, historically most of these target-price term trusts,
and all of the existing ones, have invested in munis because
they can retain some of the muni interest to enhance their
ability to return the original IPO price (without any taxation at
the fund level). However, creating target-price term trusts is
not without complications and the track record for this type of
CEF is not perfect as a few have failed to return the full IPO
price and others have sacrificed income towards the latter
years of their lives in order to return the IPO price. Some of
the challenges that such CEFs may face are discussed in the
following sections.
One should realize that when a CEF is launched at a price of
say, $25 per share, it does not have a net asset value (NAV)
of $25 per share at commencement. There are fees that are
associated with launching a CEF that are taken out of the
initial NAV. For example, if launched at $25 per share, its
initial NAV would likely be in the neighborhood of $23.85 (if a
typical offering with typical selling concessions, etc.). Thus,
the CEF, which holds $23.85 of municipal bonds net of
leverage, is already in the position of needing to add an extra
$1.15 per share (or $25.00 minus $23.85) to achieve its goal
of returning $25 per share. This is often accomplished by
investing a small portion of the portfolio in zero-coupon bonds
with the same maturity as that of the target-price term trust,
which, once they appreciate to par, should cover that initial
NAV deficit. So, a small portion of the portfolio has to be
invested in securities to make the investors “whole,” rather
than earning an incremental return.
Another possible complication is that the bonds held in the
portfolio will likely come due at different times, and few, if any,
will have due dates that correspond exactly with the maturity
date of the CEF itself. As such, some of these bond-
redemption proceeds will need to be reinvested several years
before the term trust’s maturity. Additionally, if a bond comes
due or is called, for example, seven years before the term
trust matures, chances are that the sponsor is not going to
invest the proceeds in longer term bonds given that it is
striving to return a specific price seven years later. With a
normal yield curve, short-term bonds have lower yields than
do long-term bonds and this problem can be exacerbated if
the CEF is reinvesting the proceeds from redeemed bonds in
a relatively lower interest-rate environment. Because of this,
the CEF’s income may decline as its maturity nears,
depending on the interest-rate environment at the time and
other factors.
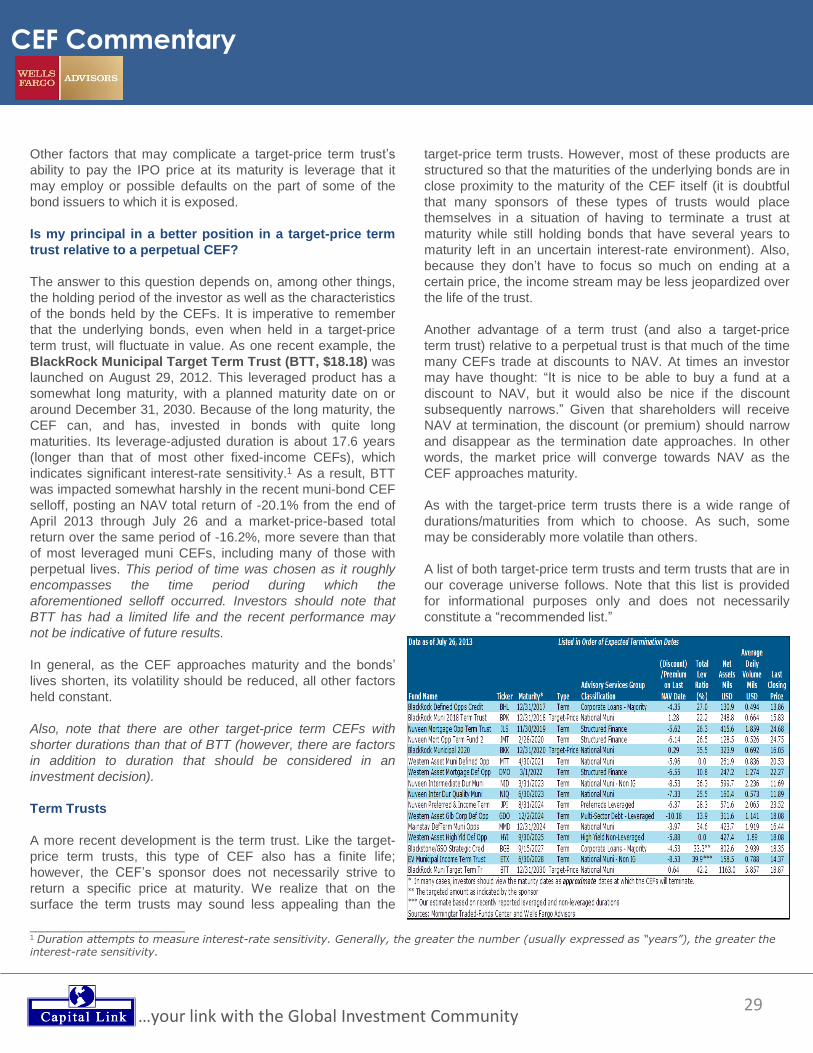
29 …your link with the Global Investment Community
CEF Commentary
Other factors that may complicate a target-price term trust’s
ability to pay the IPO price at its maturity is leverage that it
may employ or possible defaults on the part of some of the
bond issuers to which it is exposed.
Is my principal in a better position in a target-price term
trust relative to a perpetual CEF?
The answer to this question depends on, among other things,
the holding period of the investor as well as the characteristics
of the bonds held by the CEFs. It is imperative to remember
that the underlying bonds, even when held in a target-price
term trust, will fluctuate in value. As one recent example, the
BlackRock Municipal Target Term Trust (BTT, $18.18) was
launched on August 29, 2012. This leveraged product has a
somewhat long maturity, with a planned maturity date on or
around December 31, 2030. Because of the long maturity, the
CEF can, and has, invested in bonds with quite long
maturities. Its leverage-adjusted duration is about 17.6 years
(longer than that of most other fixed-income CEFs), which
indicates significant interest-rate sensitivity.1 As a result, BTT
was impacted somewhat harshly in the recent muni-bond CEF
selloff, posting an NAV total return of -20.1% from the end of
April 2013 through July 26 and a market-price-based total
return over the same period of -16.2%, more severe than that
of most leveraged muni CEFs, including many of those with
perpetual lives. This period of time was chosen as it roughly
encompasses the time period during which the
aforementioned selloff occurred. Investors should note that
BTT has had a limited life and the recent performance may
not be indicative of future results.
In general, as the CEF approaches maturity and the bonds’
lives shorten, its volatility should be reduced, all other factors
held constant.
Also, note that there are other target-price term CEFs with
shorter durations than that of BTT (however, there are factors
in addition to duration that should be considered in an
investment decision).
Term Trusts
A more recent development is the term trust. Like the target-
price term trusts, this type of CEF also has a finite life;
however, the CEF’s sponsor does not necessarily strive to
return a specific price at maturity. We realize that on the
surface the term trusts may sound less appealing than the
target-price term trusts. However, most of these products are
structured so that the maturities of the underlying bonds are in
close proximity to the maturity of the CEF itself (it is doubtful
that many sponsors of these types of trusts would place
themselves in a situation of having to terminate a trust at
maturity while still holding bonds that have several years to
maturity left in an uncertain interest-rate environment). Also,
because they don’t have to focus so much on ending at a
certain price, the income stream may be less jeopardized over
the life of the trust.
Another advantage of a term trust (and also a target-price
term trust) relative to a perpetual trust is that much of the time
many CEFs trade at discounts to NAV. At times an investor
may have thought: “It is nice to be able to buy a fund at a
discount to NAV, but it would also be nice if the discount
subsequently narrows.” Given that shareholders will receive
NAV at termination, the discount (or premium) should narrow
and disappear as the termination date approaches. In other
words, the market price will converge towards NAV as the
CEF approaches maturity.
As with the target-price term trusts there is a wide range of
durations/maturities from which to choose. As such, some
may be considerably more volatile than others.
A list of both target-price term trusts and term trusts that are in
our coverage universe follows. Note that this list is provided
for informational purposes only and does not necessarily
constitute a “recommended list.”
__________________________ 1 Duration attempts to measure interest-rate sensitivity. Generally, the greater the number (usually expressed as “years”), the greater the interest-rate sensitivity.
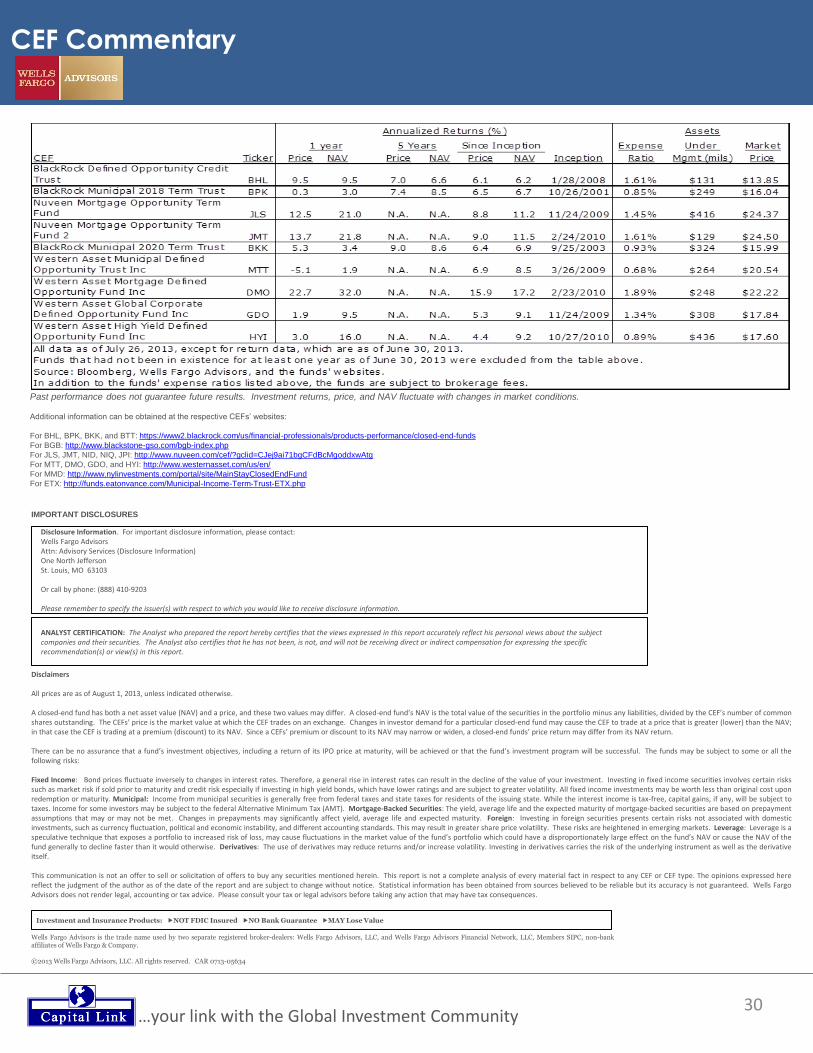
30 …your link with the Global Investment Community
CEF Commentary
Past performance does not guarantee future results. Investment returns, price, and NAV fluctuate with changes in market conditions.
Additional information can be obtained at the respective CEFs’ websites:
For BHL, BPK, BKK, and BTT: https://www2.blackrock.com/us/financial-professionals/products-performance/closed-end-funds
For BGB: http://www.blackstone-gso.com/bgb-index.php
For JLS, JMT, NID, NIQ, JPI: http://www.nuveen.com/cef/?gclid=CJej9ai71bgCFdBcMgoddxwAtg
For MTT, DMO, GDO, and HYI: http://www.westernasset.com/us/en/
For MMD: http://www.nylinvestments.com/portal/site/MainStayClosedEndFund
For ETX: http://funds.eatonvance.com/Municipal-Income-Term-Trust-ETX.php
Disclaimers All prices are as of August 1, 2013, unless indicated otherwise. A closed-end fund has both a net asset value (NAV) and a price, and these two values may differ. A closed-end fund’s NAV is the total value of the securities in the portfolio minus any liabilities, divided by the CEF’s number of common shares outstanding. The CEFs’ price is the market value at which the CEF trades on an exchange. Changes in investor demand for a particular closed-end fund may cause the CEF to trade at a price that is greater (lower) than the NAV; in that case the CEF is trading at a premium (discount) to its NAV. Since a CEFs’ premium or discount to its NAV may narrow or widen, a closed-end funds’ price return may differ from its NAV return. There can be no assurance that a fund’s investment objectives, including a return of its IPO price at maturity, will be achieved or that the fund’s investment program will be successful. The funds may be subject to some or all the following risks: Fixed Income: Bond prices fluctuate inversely to changes in interest rates. Therefore, a general rise in interest rates can result in the decline of the value of your investment. Investing in fixed income securities involves certain risks such as market risk if sold prior to maturity and credit risk especially if investing in high yield bonds, which have lower ratings and are subject to greater volatility. All fixed income investments may be worth less than original cost upon redemption or maturity. Municipal: Income from municipal securities is generally free from federal taxes and state taxes for residents of the issuing state. While the interest income is tax-free, capital gains, if any, will be subject to taxes. Income for some investors may be subject to the federal Alternative Minimum Tax (AMT). Mortgage-Backed Securities: The yield, average life and the expected maturity of mortgage-backed securities are based on prepayment assumptions that may or may not be met. Changes in prepayments may significantly affect yield, average life and expected maturity. Foreign: Investing in foreign securities presents certain risks not associated with domestic investments, such as currency fluctuation, political and economic instability, and different accounting standards. This may result in greater share price volatility. These risks are heightened in emerging markets. Leverage: Leverage is a speculative technique that exposes a portfolio to increased risk of loss, may cause fluctuations in the market value of the fund’s portfolio which could have a disproportionately large effect on the fund’s NAV or cause the NAV of the fund generally to decline faster than it would otherwise. Derivatives: The use of derivatives may reduce returns and/or increase volatility. Investing in derivatives carries the risk of the underlying instrument as well as the derivative itself. This communication is not an offer to sell or solicitation of offers to buy any securities mentioned herein. This report is not a complete analysis of every material fact in respect to any CEF or CEF type. The opinions expressed here reflect the judgment of the author as of the date of the report and are subject to change without notice. Statistical information has been obtained from sources believed to be reliable but its accuracy is not guaranteed. Wells Fargo Advisors does not render legal, accounting or tax advice. Please consult your tax or legal advisors before taking any action that may have tax consequences.
Investment and Insurance Products: NOT FDIC Insured NO Bank Guarantee MAY Lose Value
Wells Fargo Advisors is the trade name used by two separate registered broker-dealers: Wells Fargo Advisors, LLC, and Wells Fargo Advisors Financial Network, LLC, Members SIPC, non-bank affiliates of Wells Fargo & Company. ©2013 Wells Fargo Advisors, LLC. All rights reserved. CAR 0713-05634
Disclosure Information. For important disclosure information, please contact: Wells Fargo Advisors Attn: Advisory Services (Disclosure Information) One North Jefferson St. Louis, MO 63103 Or call by phone: (888) 410-9203 Please remember to specify the issuer(s) with respect to which you would like to receive disclosure information.
ANALYST CERTIFICATION: The Analyst who prepared the report hereby certifies that the views expressed in this report accurately reflect his personal views about the subject companies and their securities. The Analyst also certifies that he has not been, is not, and will not be receiving direct or indirect compensation for expressing the specific recommendation(s) or view(s) in this report.
IMPORTANT DISCLOSURES
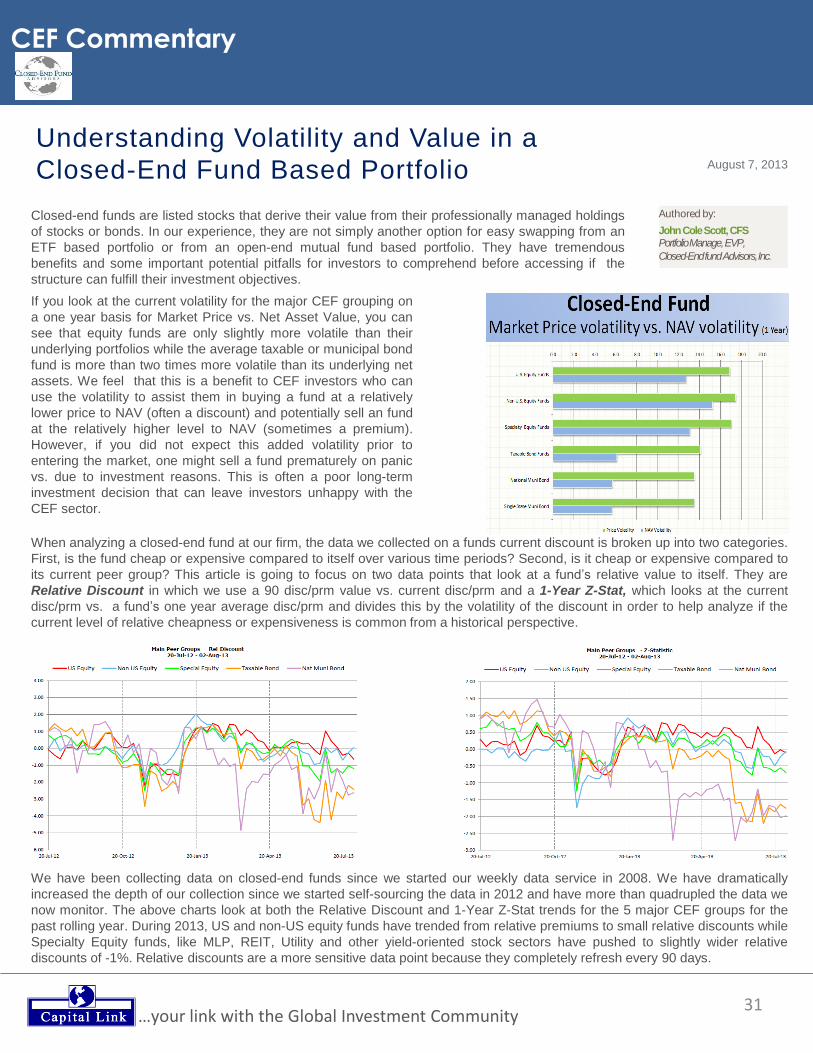
31 …your link with the Global Investment Community
CEF Commentary
August 7, 2013
Understanding Volatility and Value in a
Closed-End Fund Based Portfolio
Closed-end funds are listed stocks that derive their value from their professionally managed holdings
of stocks or bonds. In our experience, they are not simply another option for easy swapping from an
ETF based portfolio or from an open-end mutual fund based portfolio. They have tremendous
benefits and some important potential pitfalls for investors to comprehend before accessing if the
structure can fulfill their investment objectives. If you look at the current volatility for the major CEF grouping on
a one year basis for Market Price vs. Net Asset Value, you can
see that equity funds are only slightly more volatile than their
underlying portfolios while the average taxable or municipal bond
fund is more than two times more volatile than its underlying net
assets. We feel that this is a benefit to CEF investors who can
use the volatility to assist them in buying a fund at a relatively
lower price to NAV (often a discount) and potentially sell an fund
at the relatively higher level to NAV (sometimes a premium).
However, if you did not expect this added volatility prior to
entering the market, one might sell a fund prematurely on panic
vs. due to investment reasons. This is often a poor long-term
investment decision that can leave investors unhappy with the
CEF sector.
Authored by:
John Cole Scott, CFS Portfolio Manage, EVP,
Closed-End fund Advisors, Inc.
When analyzing a closed-end fund at our firm, the data we collected on a funds current discount is broken up into two categories.
First, is the fund cheap or expensive compared to itself over various time periods? Second, is it cheap or expensive compared to
its current peer group? This article is going to focus on two data points that look at a fund’s relative value to itself. They are
Relative Discount in which we use a 90 disc/prm value vs. current disc/prm and a 1-Year Z-Stat, which looks at the current
disc/prm vs. a fund’s one year average disc/prm and divides this by the volatility of the discount in order to help analyze if the
current level of relative cheapness or expensiveness is common from a historical perspective.
We have been collecting data on closed-end funds since we started our weekly data service in 2008. We have dramatically
increased the depth of our collection since we started self-sourcing the data in 2012 and have more than quadrupled the data we
now monitor. The above charts look at both the Relative Discount and 1-Year Z-Stat trends for the 5 major CEF groups for the
past rolling year. During 2013, US and non-US equity funds have trended from relative premiums to small relative discounts while
Specialty Equity funds, like MLP, REIT, Utility and other yield-oriented stock sectors have pushed to slightly wider relative
discounts of -1%. Relative discounts are a more sensitive data point because they completely refresh every 90 days.
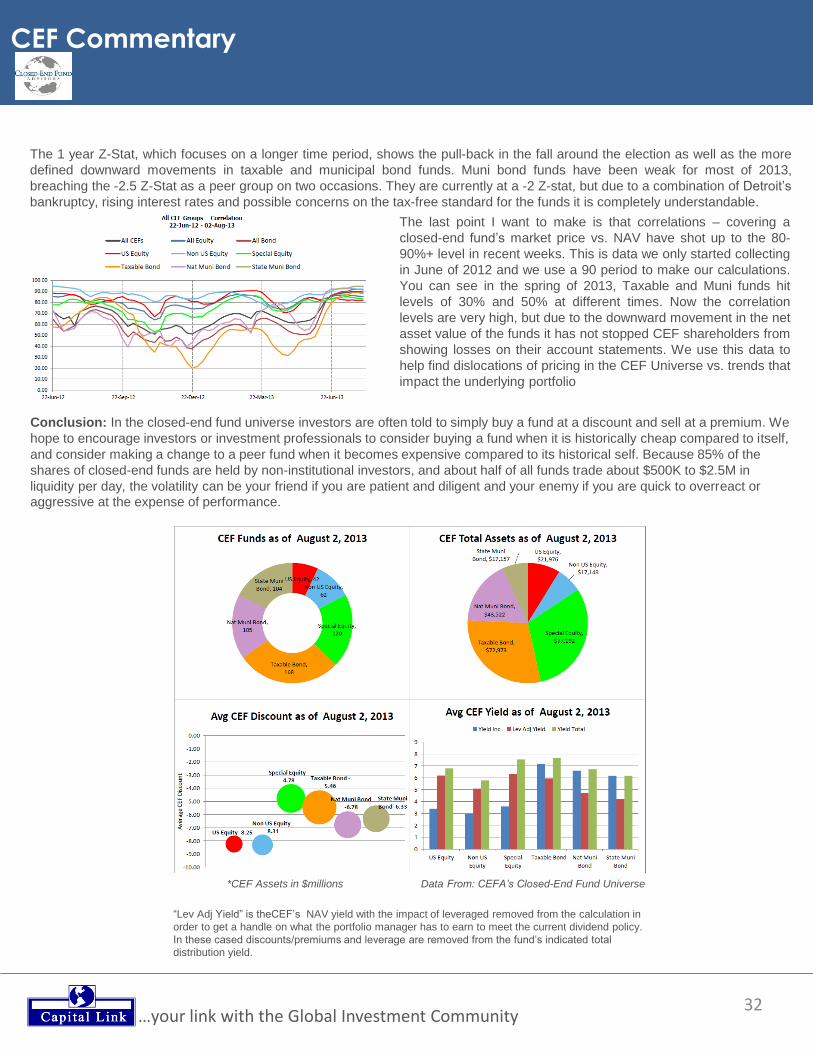
32 …your link with the Global Investment Community
CEF Commentary
The 1 year Z-Stat, which focuses on a longer time period, shows the pull-back in the fall around the election as well as the more
defined downward movements in taxable and municipal bond funds. Muni bond funds have been weak for most of 2013,
breaching the -2.5 Z-Stat as a peer group on two occasions. They are currently at a -2 Z-stat, but due to a combination of Detroit’s
bankruptcy, rising interest rates and possible concerns on the tax-free standard for the funds it is completely understandable.
The last point I want to make is that correlations – covering a
closed-end fund’s market price vs. NAV have shot up to the 80-
90%+ level in recent weeks. This is data we only started collecting
in June of 2012 and we use a 90 period to make our calculations.
You can see in the spring of 2013, Taxable and Muni funds hit
levels of 30% and 50% at different times. Now the correlation
levels are very high, but due to the downward movement in the net
asset value of the funds it has not stopped CEF shareholders from
showing losses on their account statements. We use this data to
help find dislocations of pricing in the CEF Universe vs. trends that
impact the underlying portfolio
Conclusion: In the closed-end fund universe investors are often told to simply buy a fund at a discount and sell at a premium. We
hope to encourage investors or investment professionals to consider buying a fund when it is historically cheap compared to itself,
and consider making a change to a peer fund when it becomes expensive compared to its historical self. Because 85% of the
shares of closed-end funds are held by non-institutional investors, and about half of all funds trade about $500K to $2.5M in
liquidity per day, the volatility can be your friend if you are patient and diligent and your enemy if you are quick to overreact or
aggressive at the expense of performance.
*CEF Assets in $millions Data From: CEFA’s Closed-End Fund Universe
“Lev Adj Yield” is theCEF’s NAV yield with the impact of leveraged removed from the calculation in
order to get a handle on what the portfolio manager has to earn to meet the current dividend policy.
In these cased discounts/premiums and leverage are removed from the fund’s indicated total
distribution yield.

33 …your link with the Global Investment Community
ETF Commentary
Authored by:
Mike McGlone, CFA, FRM Director Research US,
ETF Securities
August 6, 2013
Silver – Time to Shine from US$20?
All that glitters is not gold – or palladium.
Consider – silver. For investors willing to look
ahead, and not just avert their eyes from the
29% decline of the metal in the past 12-months,
silver right now may be worth a good, hard
second look.
At first glance investing in silver might feel like
buying fool’s gold, but a harder look at the
market reveals that silver may have corrected
too far and it is poised for future growth. Unlike
gold, about 50% of silver consumption is driven
by industrial use. Known for being the best
conductor of electricity and integral to the
electronics industry, demand is likely to remain
steady, while new interest from the solar
industry also indicates the potential for upward
price pressure. That’s a very solid foundation to
build on. Gold, on the other hand, for which
industrial demand only averages 10%, appears
to have bottomed, at least in the near term, near
$1,200. Looking at Palladium, another precious
metal driven by industrial demand, has seen a
27% increase in the past 12-months on the back
of strong auto sales in China and the U.S. is
certainly impressive, but numbers already that
high don’t anticipate significantly accelerated
returns.
Silver has a nice glow on it.
Here’s a bit more evidence that investors willing
to look around the corner a bit at silver may like
what they see:
Demand Attraction, Record Physical
Demand - Physical demand for silver is running
at a record pace, as evidenced by US Mint
sales. The US Mint has sold 29Mn ounces of
silver coins in 2013 through July, just shy of
total sales for 2012. US Mint silver coin sales
are on pace in 2013 for 50Mn ounces - the most
recent record was 40Mn ounces in 2011.
Recent Price Divergence – As suggested
above, it’s all about taking a good close look at
silver right now. In the past one month period
ending August 2nd, silver was the only precious
metal to decline, losing 0.8% despite a 4.5%
gain in gold (using London fix levels). Typically,
silver prices are closely linked to gold with a
correlation near .80, meaning 80% of the price
moves in silver can normally be explained by
gold. Gold and silver do no often diverge in
price, but recently they have, possible due to
the just salvaged WWII shipwreck containing 61
tons of silver.
Worst Annual Plunge since the Aftermath of
the Hunt Brothers in 1981 - On a year-to-date
basis, silver has declined 35% in 2013, as of
August 2nd. If silver ends 2013 at current levels,
it would be the worst annual plunge since the
47% decline in 1981, which was in the
aftermath of the 434% rally in 1979 as the Hunt
brothers attempted to corner the market (see
charts on following page). The bottom line,
from an investor and trader stand point is if
silver does not recover from the recently
reached US$20 level, it is likely it would be
signalling more weakness with repercussions
for the entire precious metals sector, which
includes: gold, silver platinum and palladium.
The US$20oz level in silver has acted as a key
pivot level since reaching US$20 early in 2008,
for the first time since 1980. Many market
technicians say that old resistance becomes
support and the silver market has returned to
key support at US$20oz.
Silver, in short, has returned to attractive value
near US$20oz, and it likely needs to sustain
above $20oz to indicate a recovery in the
precious metals market.
For savvy investors, silver, at the very least, is
worth keeping an eye on.
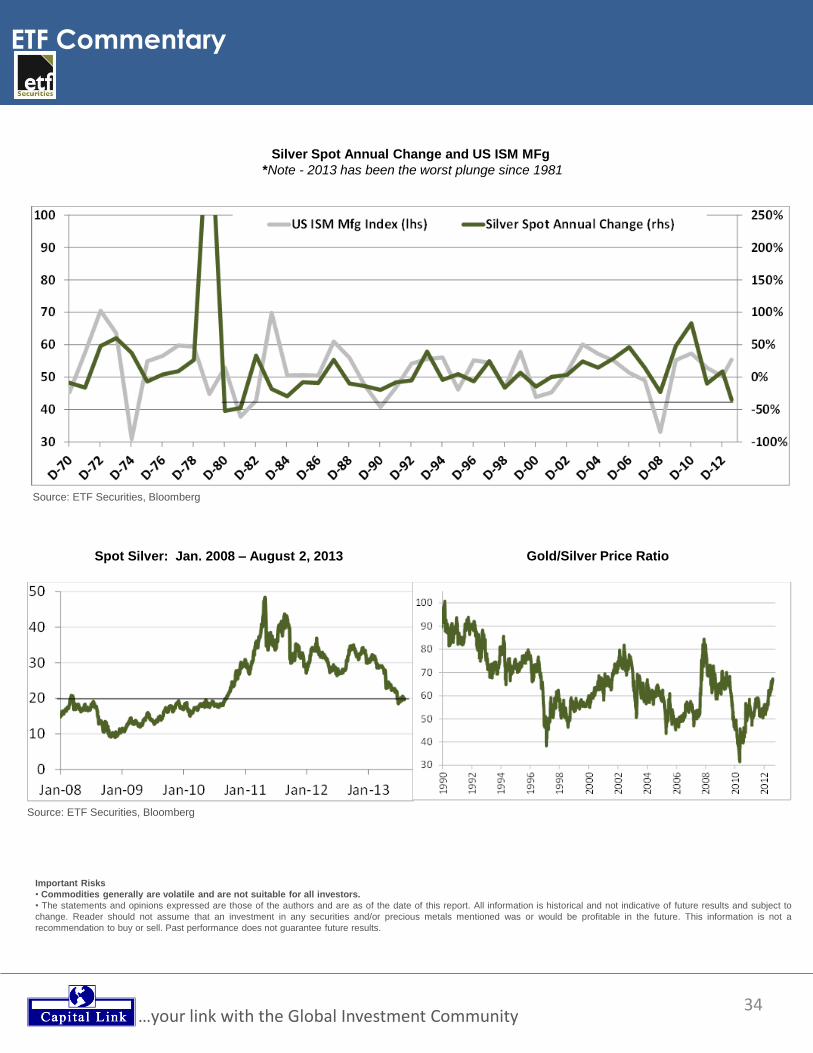
34 …your link with the Global Investment Community
ETF Commentary
Important Risks
• Commodities generally are volatile and are not suitable for all investors.
• The statements and opinions expressed are those of the authors and are as of the date of this report. All information is historical and not indicative of future results and subject to
change. Reader should not assume that an investment in any securities and/or precious metals mentioned was or would be profitable in the future. This information is not a
recommendation to buy or sell. Past performance does not guarantee future results.
Silver Spot Annual Change and US ISM MFg
*Note - 2013 has been the worst plunge since 1981
Source: ETF Securities, Bloomberg
Spot Silver: Jan. 2008 – August 2, 2013 Gold/Silver Price Ratio
Source: ETF Securities, Bloomberg
35 …your link with the Global Investment Community
ETF Commentary
Authored by:
Todd Rosenbluth Senior Director,
S&P Capital IQ Equity Research
@TRosen_SPCAPIQ
July 26, 2013
After months of speculation in the investment community, Fidelity, long known for
providing a large number of strong, actively managed mutual funds, today registered
a series of U.S. sector ETFs that it hopes to launch. Below we briefly look at what we
think this means for the ETF and mutual fund industries and for investors.
According to the filing, Fidelity aims to
launch 10 sector ETFs and will use
BlackRock Fund Advisors as the sub-advisor
on the funds. This is indeed the same
BlackRock Fund Advisors that supports
iShares, the ETF industry’s leading provider.
In March, Fidelity and BlackRock announced
a partnership that included a number of
components. In addition to increasing the
number of iShares ETFs that would be made
available commission free on Fidelity.com’s
website, Fidelity established a strategic
relationship with BlackRock to help Fidelity’s
“future passive sector investment
management efforts”. We had expected
Fidelity to offer more actively managed or
rules-based ETFs leveraging its mutual fund
team’s Select series, which has a strong
record, in our view. This is what PIMCO did
in the fixed income space, when it launched
PIMCO Total Return ETF (BOND 106
Marketweight) in 2012. Rather, Fidelity will
be taking the passive route and seek to track
the performance and holdings of certain
sector-specific MSCI indices.
To us, this is a “me-too” approach and might
make it hard for Fidelity, despite its scale
and strong brand in the investment
community, to gain share in a crowded
market. At the end of June 2013, there was
$169 billion invested in 209 sector- based
exchange-traded products, according to
BlackRock data. While this is 12% of the
U.S. industry, inflows in the first half of 2013
have been quite strong. Just over $20 billion,
equal to 27% of the inflows, were to these
sector-based products, with Financials and
Energy offerings leading the charge. State
Street, with its Select Sector SPDR series, is
the dominant provider of sector ETFs.
Financial Select Sector SPDR (XLF 21
Overweight) has $17 billion in assets and
Energy Select Sector SPDR (XLE 83
Overweight) has $9 billion in assets, making
them the largest products in their respective
sectors. Meanwhile, Vanguard Financial
Index (VFH 42 Overweight) and Vanguard
Energy Index (VDE 119Overweight) have
assets of $1.5 billion and $2.3 billion,
respectively. iShares does offer sector-
based ETFs that seek to track a traditional
benchmark like State Street and Vanguard
do, though we believe these offerings play a
less meaningful role for the provider than the
more diversified equity and fixed income
offerings.
Fidelity’s Move Into the ETF Market
Key Takeaways Fidelity’s likely launch of traditional sector ETFs could impact established mutual funds and ETFs.
POSITIVE IMPLICATIONS
FIRST TRUST
FINAN- CIAL
ALPHADEX FUND
MARKETWEIG
HT
[FXO]
REVENUESHARE
S FINANCIALS
SECTOR FUND
MARKETWEIG
HT
[RWW]
NEGATIVE IMPLICATIONS
FIDELITY
SELECT
FINANCIAL
SERVICES
PORTFOLIO
[FIDSX]
The recommendations contained in this Takeaway box are current, and may have changed since the original story was published. Continued on next page..
Mid-Caps: Active vs. Index
36 …your link with the Global Investment Community
ETF Commentary
Meanwhile, there are other smaller, sector-based products
that follow a fundamental approach, such as First Trust
Financial AlphaDEX (FXO 20 Marketweight) or
RevenueShares Financials Sector Fund (RWW 42
Marketweight). Unlike the three largest providers, whose
ETFs seek to replicate a widely known benchmark, these
ETFs aim to find stocks that offer specific fundamental
characteristics. This is the approach we had expected Fidelity
to take with its previously planned offerings. As a result, even
though we think Fidelity will enter the market with advantages
over small ETF providers, we think its purely passive
approach alleviates some of the pressure we had expected for
the fundamental ETFs. Of course, Fidelity could decide to
launch other sector-based products over time.
At this early stage, little is known about the Fidelity sector
ETFs. There were no details in the registration filing about the
expense ratio, which is a key factor for investors in
sorting through the various sector ETF alternatives. XLF costs
just 0.18%, while FXO is much more expensive at 0.74%. In
contrast, Fidelity Select Financial Services Portfolio (FIDSX
75 **), which has approximately $700 million in assets incurs
a net expense ratio of 0.96%. Assuming that Fidelity’s new
Financial ETF costs less than 0.96%, this could cause some
outflows to FIDSX, in our view.
While the Fidelity ETFs still need to make it through the
registration process, we believe the likelihood of them
launching successfully is high as they are seeking to track
traditional benchmarks. Historically, these types of ETFs
move through the regulatory process more easily than ETFs
that involve more esoteric strategies. Months after the ETFs
launch, S&P Capital IQ looks forward to providing research
and ranking inputs to help investors compare and contrast
their holdings and costs relative to other sector offerings.
July 31, 2013
Mid-cap investments offer an appealing combination strong growth profiles and modest debt leverage. However,
actively managed mutual funds have failed to outperform a key S&P benchmark, opening, we think, the door for low-
cost ETFs.
As you would expect, the S&P MidCap 400 Index is comprised
of smaller companies than you’d find in the S&P 500 Index. At
the end of June 2013, the median market capitalization was
just $3 billion, compared to the $14 billion for the S&P 500
Index. Although the S&P MidCap 400 Index makes up 8.3% of
the market cap of the S&P 1500, while the S&P SmallCap 600
makes up 3.5%, we found there are fewer mutual funds
dedicated to mid- cap stocks than there are dedicated to
small-cap stocks. On Marketscope Advisor, we show $405
billion in assets spread across over 1,500 small- cap mutual
funds, compared to $394 billion invested in just over 900 mid-
cap mutual funds
In a recent article entitled “Mid-Cap Indexing: Try Equity’s
Sweet Spot”, Philip Murphy, Vice President of S&P Dow Jones
Indices, explored the benefits of mid-cap stocks and
compared them to their larger and smaller market peers. (S&P
Capital IQ operates independently from S&P Dow Jones
Indices.) Murphy explained that, “Many mid-cap companies
are like teenagers still growing but also possessing greater
maturity than many of their small-cap cousins. These
companies may offer investors the best of the large and
Key Takeaways
Active mid-cap funds have a weak record compared to benchmarks, creating opportunity for low-cost passive ETFs. POSITIVE IMPLICATIONS
ISHARES CORE S&P MID-CAP ETF
MARKETWEIGHT
[IJH]
SPDR S&P MIDCAP 400 ETF
MARKETWEIGHT
[MDY]
VANGUARD S&P MID-CAP 400 INDEX FUND; ETF SHARES
MARKETWEIGHT
[IVOO]
The recommendations contained in this Takeaway box are current, and may have changed since the original story was published.
Authored by:
Todd Rosenbluth Senior Director,
S&P Capital IQ Equity Research
37 …your link with the Global Investment Community
ETF Commentary
small-cap worlds before potentially reaching large-cap status.
Fundamentally, mid-caps typically enjoy higher growth rates
than large-caps, and greater access to capital than small-
caps. Mid-cap stocks present an opportunity for distinct
fundamental exposure given the unique life-cycle
characteristics of mid- cap companies.”
Murphy, using S&P Capital IQ and Compustat data, found that
when examining the three-year revenue growth, S&P MidCap
400 stocks’ 13% median growth rate was stronger than the
S&P 500 median revenue growth rate of 10.5%. Meanwhile,
the S&P MidCap 400 companies also tend to have less debt
than larger firms. The median debt to capital ratio for mid-
caps was 35.8%, vs. 40.9% for the S&P 500.
Conventional wisdom suggests that because mid- cap
companies are followed less by sell-side or independent
equity analysts, active management by a mutual fund should
be more effective. Indeed, S&P Capital IQ’s equity analytical
team covers just 59.5% of the S&P MidCap 400 Index
constituents, compared to 99.6% of the S&P 500 Index’s.
However, according to the S&P Dow Jones 2012 Year End
SPIVA scorecard in the past 10 years, 64.6% of actively
managed mid-cap funds underperformed the respective S&P
index, higher than the 62.4% and 59.6% for small-cap and
large-cap. S&P Capital IQ believes the high cost for these
active mutual funds plays a meaningful role in the
underperformance, as the average expense ratio is 1.3% for
mid-cap core funds. Further, while management has more
opportunities to identify appealing, underfollowed companies
than in the large-cap space, they have not been successful in
doing so.
While the S&P 500 Index is the most widely known of the
market-cap weighted indices, the S&P MidCap 400 Index was
the better performer in the first half of 2013 and has been so
longer term. Year to date through June, the 400 rose 14.6%,
compared to 13.8%, and looking back at the past three and 10
years, the 400’s 19.5% and 10.7% annualized returns are
admirable compared to the 500’s 18.5% and 7.3%,
respectively. Not surprisingly, the mid-cap index incurs higher
volatility, with a three-year standard deviation of 16.6, versus
13.6. As currently constructed, the S&P MidCap 400 Index
has higher weightings in economically sensitive Financials
and Industrials stocks, but less in Consumer Staples and
Energy stocks than the S&P 500.
The largest ETF tracking the S&P MidCap 400 Index is the
iShares Core Mid-Cap ETF (IJH 122 Marketweight), with $17
billion in assets. It holds several stocks viewed favorably for
their S&P Capital IQ STARS and S&P Capital IQ Quality
Rank. Some of the top holdings are Vertex Pharmaceuticals
(VRTX 82 ****), HollyFrontier Corp (HFC 46 ****), and Church
& Dwight (CHD 64 ****). CHD, Ametek (AME 46 NR) and
Green Mountain Coffee Roasters (GMCR 76 NR) have
Quality Ranks of A+, A, and B+ respectively. IJH also has a
relatively cheap expense ratio of just 0.15% and a tight
bid/ask spread, offering investors low cost exposure to an
appealing style.
Other ETFs that track the S&P MidCap 400 include the SPDR
S&P Midcap 400 ETF (MDY 223 Marketweight) and the
Vanguard S&P Mid-Cap 400 ETF (IVOO 83 Marketweight).
MDY has an expense ratio of 0.25% and IVOO has an
expense ratio of 0.16%.
To see reports on these ETFs, visit the ETF tab of
MarketScope Advisor. To see a Stock Screen of the Week
concerning mid-cap stocks with a focus on those that are
deemed attractive and with limited debt leverage, please click
on "Stock Screen of the Week” within the “Stocks” tab in
MarketScope Advisor.
Join our “Closed-End Fund and
ETF Forum” group on LinkedIn
for the latest discussions on
trends, developments and
challenges in the CEF and ETF
industries.
Click here to join
Follow us on Twitter.
Your source to the CEF & ETF industries.
38 …your link with the Global Investment Community
ETF Commentary
Authored by:
Tom Graves, CFA Equity Research ETF Analyst,
S&P Capital IQ
At S&P Capital IQ Equity Research, with our holdings-based approach, we are able to
provide rankings on a new ETF within months of its debut. For example, we already
have an Overall Ranking on 83 equity ETFs that were launched since the end of
2011, including 18 that debuted this year.
Newer Equity ETFs Attract Investor Interest
August 2, 2013
Some of the newer ETFs have been
relatively quick to attract investor interest.
For example, we see at least 23 equity
ETFs launched since the start of 2012 that
recently had a market capitalization of more
than $100 million. Of these 23 ETFs, S&P
Capital IQ Equity Research has an Overall
Ranking of Overweight on one of them --
iShares MSCI USA Value Factor ETF (VLUE
55, Overweight) -- while there is a
Marketweight appraisal on 14 of the ETFs,
and an Underweight ranking on six. For the
remaining two, there was no ranking
available.
The largest of the 23 equity ETFs is iShares
Core MSCI Emerging Markets ETF (IEMG
47, Marketweight),with a market cap of $1.9
billion, followed by iShares Core MSCI
EAFE ETF (IEFA 55, Marketweight), at $897
million. Of the 19 ETFs for which a year-to-
date performance (through August 1) was
available (i.e., ETFs launched before the
start of 2013), the top total return came from
PowerShares DWA SmallCap Technical
Leaders Portfolio (DWAS 36, Underweight),
up 36%, followed by Global X Top Guru
Holdings Index ETF (GURU 22,
Underweight) at 28%, and FlexShares
Quality Dividend Index Fund (QDF 31,
Marketweight) at 27%. The worst total return
was a negative 20% for iShares MSCI
Global Metals & Mining Producers ETF
(PICK 18, Marketweight). The first seven
months of 2013 were generally favorable for
equity ETFs, especially for those with more
of a U.S. stock emphasis. With the S&P 500
showing a total return of 19.6% through the
end of July, we saw equity ETFs mostly in
positive return territory for the year.
Among equity ETFs launched in 2013, S&P
Capital IQ Equity Research has an Overall
Ranking on 18, including two that debuted as
recently as June-- Horizons S&P 500
Covered Call ETF (HSPX 42, Marketweight)
and Barron’s 400 ETF (BFOR 27,
Underweight). Of the 2013 launches, there
are at least five with a recent market
capitalization of more than $50 million, led
by iShares MSCI USA Momentum Factor
ETF (MTUM 55, Marketweight) at about
$143 million, Cambria Shareholder Yield
ETF (SYLD 27, Marketweight) at $117
million, VLUE at $113 million, and iShares
MSCI USA Size Factor ETF (SIZE 54,
Marketweight) at about $111 million.
S&P Capital IQ Equity Research’s
proprietary equity ETF rankings utilize up to
10 analytical inputs in comparing and
appraising equity ETFs. The more than 750
reports that S&P Capital IQ provides on
Key Takeaways
S&P Capital IQ Equity Research has rank- ings available on many of the ETFs that have launched since the start of 2012.
POSITIVE IMPLICATIONS
ISHARES MSCI USA ETF
OVERWEIGHT [EUSA]
ISHARES MSCI USA VALUE FACTOR ETF
OVERWEIGHT
[VLUE]
VANGUARD S&P 500 VALUE INDEX FUND; ETF SHARES
OVERWEIGHT
[VOOV]
The recommendations contained in this Takeaway box are current, and may have changed since the original story was published.
39 …your link with the Global Investment Community
ETF Commentary
equity ETFs offer details on how much coverage is available
on the five holdings-based analytics utilized in the ranking
system. The other five analytical inputs relate to the ETF
security itself. In arriving at an Overall Ranking for equity
ETFs, S&P Capital IQ utilizes up to 10 analytical elements in
the Performance Analytics, Risk Considerations and Cost
Factors categories.
S&P Capital IQ Equity Research’s ETF analytical product
offers a quantitative ranking methodology that combines input
from holdings- based analyses and multivariate analysis of
the security. The ETF analysis bubbles up to an Overall S&P
ETF Ranking (Overweight, Marketweight, or Underweight) of
an ETF security relative to all other equity ETFs on which we
have an Overall Ranking. S&P Capital IQ’s analytics include
assessments of both an ETF’s holdings and of characteristics
pertaining to the ETF security. Six of the 10 analytical metrics
are proprietary to S&P Capital IQ or McGraw Hill Financial.
The 10 analytical elements for equity ETFs include three for
Performance Analytics that are all proprietary, including S&P
Capital Q equity analyst STARS opinions on stocks of
companies owned by the ETFs.
As of August 2, 2013, S&P Capital IQ was providing an
Overall Ranking on 667 equity ETFs, with 167 of them
receiving an overall appraisal of Overweight. Among equity
ETFs with a current Overall Ranking of Overweight, there are
112 that are classified as U.S. ETFs and 55 that are
categorized as international or global. Also, 56 (34%) of all the
Overweights are considered to be sector ETFs. At least 25 of
the 167 ETFs receiving an Overall Ranking of Overweight
recently had a 12-month yield of more than 3%. (Note: Yield is
not one of the 10 analytical inputs utilized in the rankings.)
In terms of age, 154 of the top-ranked ETFs were launched
prior to 2011, and the remaining 13 were introduced since
then. Twenty-eight of the 167 top-ranked ETFs also had an
Overall ranking of Overweight in each of S&P’s three primary
analytical categories -- Performance Analytics, Risk
Considerations and Cost Factors. Of these 28, the newest
were two ETFs that launched in 2010 -- Vanguard S&P 500
Value Index Fund; ETF Shares (VOOV 77, Overweight) and
iShares MSCI USA ETF (EUSA 37, Overweight). The oldest
(1993 launch) and largest ($155 billion market cap) of the 28
is SPDR S&P 500 ETF Trust (SPY 170, Overweight).
As with all investments, S&P Capital IQ U.S. Equity Research
believes that investors should look to make selections that are
suitable for their objectives and risk profiles. ETFs that have
similar overall rankings may have very different
characteristics, including differences in the analytical inputs
that go into our rankings, and factors such as what the ETFs
own, their size, and their trading volume. Also, note that S&P
Capital IQ’s analytical inputs for assessing ETFs are
constantly being updated.
Annually, Capital Link holds 8-10
annual Investment Conferences in
New York, London and Athens on
maritime transportation and marine
services, corporate social
responsibility, Closed-End Funds
and Global ETFs, a Greek Investor
Forum in New York, and a Global
Derivatives Forum on
Commodities, Energy and Freight.
To view our upcoming conference,
please click here.
40
Market Review & Fund Commentary
…your link with the Global Investment Community
August 1, 2013
Western Asset High Income Opportunity Fund Inc. (HIO)
It was, according to Western Asset, an interesting quarter for
the fixed-income market, and corporate credit was not
immune to the volatility. The managers of Western Asset
High Income Opportunity Fund, Inc. (HIO), however,
believe the selloff will open up new investing opportunities for
the portfolio. The Fund, which seeks high current income and
capital appreciation, provides a non-leveraged high-yield
portfolio of corporate debt securities, with more than 80% of
holdings invested in high-yield corporate debt (with 9.1% in
investment grade, with the balance of holdings across bank
loans, emerging markets, cash and other securities)1.
Market recap
The fixed-income downturn started in the middle of the
second quarter, after Federal Reserve Board (Fed) Chairman
Ben Bernanke’s comments about a potential exit from the
central bank’s extremely accommodative monetary policy.
This sent Treasury yields higher and their prices lower. The
10-year Treasury, for example, rose from 1.84% at the start of
the quarter to 2.49% at the end of June.
The overall high-yield market, as measured by the Barclays
2% High Yield Constrained Index, declined 1.44% during the
second quarter. An interesting phenomenon was that lower
quality CCC-rated bonds were only down 0.47% for the
quarter and outperformed their higher-quality counterparts.
This is unusual, because in a risk-off environment lower
quality securities usually underperform. We believe this is
partially explained by the fact that CCC-rated bonds tend to
have much lower durations than higher quality bonds and the
fixed income market in general. On the other end of the
spectrum, BB-rated bonds were down 1.87%. For comparison
purposes, investment-grade bonds, as measured by the
Barclays U. S. Credit Investment Grade Index, returned -
3.44% during the second quarter. These bonds tend to have
even longer durations than BB-rated securities.
Within the high-yield market for the quarter, metals and
mining came under pressure, as was the case with a lot of
commodities. Energy and utilities also had difficult quarters,
falling 2.09% and 2.28%, respectively. In contrast,
communications outperformed on a relative basis, falling just
1.06%. This sector is seen as being more defensive and there
has been some merger and acquisition (M&A) activity,
whereby investment-grade companies come in and buy high-
yield companies. Elsewhere, consumer non-cyclicals, another
defensive sector, was down only 1.03% during the quarter.
Fundamentals remained strong, as companies continued to
have pretty decent earnings, growth and free cash flow
generation. There have been challenges in terms of top-line
growth, but nothing As of 6/30/13 alarming. During the quarter
there were some strong results from the banking sector,
which is a focus in our investment-grade corporate portfolios.
In general, we are pretty comfortable with the fundamentals.
We think management teams are still running a little scared
from the last downturn. As such, they're holding more cash
and really focused on their costs, which are likely positives
from a bondholder’s perspective.
Supply trends remain favorable. According to J.P. Morgan,
there was $98.6 billion in below investment-grade global
supply during the quarter. Most of that was issued earlier in
the period, as you’d expect given the increase in volatility as
the quarter progressed. That puts year-to-date supply at
$219.7 billion. To put that into perspective, during all of 2012,
which was a record year for new issuance, there was $368
billion of new issuance. So we're still on pace for a record
year of issuance in the high-yield market.
The supply and demand picture gives us three important
clues about the high-yield market. First, this demonstrates
that high-yield companies have access to capital. That's very
important from our perspective in terms of realized and
unrealized losses, as well as keeping defaults low. Second,
according to JPMorgan of the new issuance over the first six
months of 2013, 62.8% was used for refinancing, or debt for
debt purposes. If you go back to 2007, there was $147.9
billion of issuance, so much less supply. But that was a
leveraging period in the capital markets and only 35% of
issuance was used for refinancing. So almost double the
issuance today is being used to take out maturities and
extend the maturity profile in companies. And that can lower
the probability of defaults, which again is good for debt
holders. Third, we're not seeing private equity firms levering
up companies.
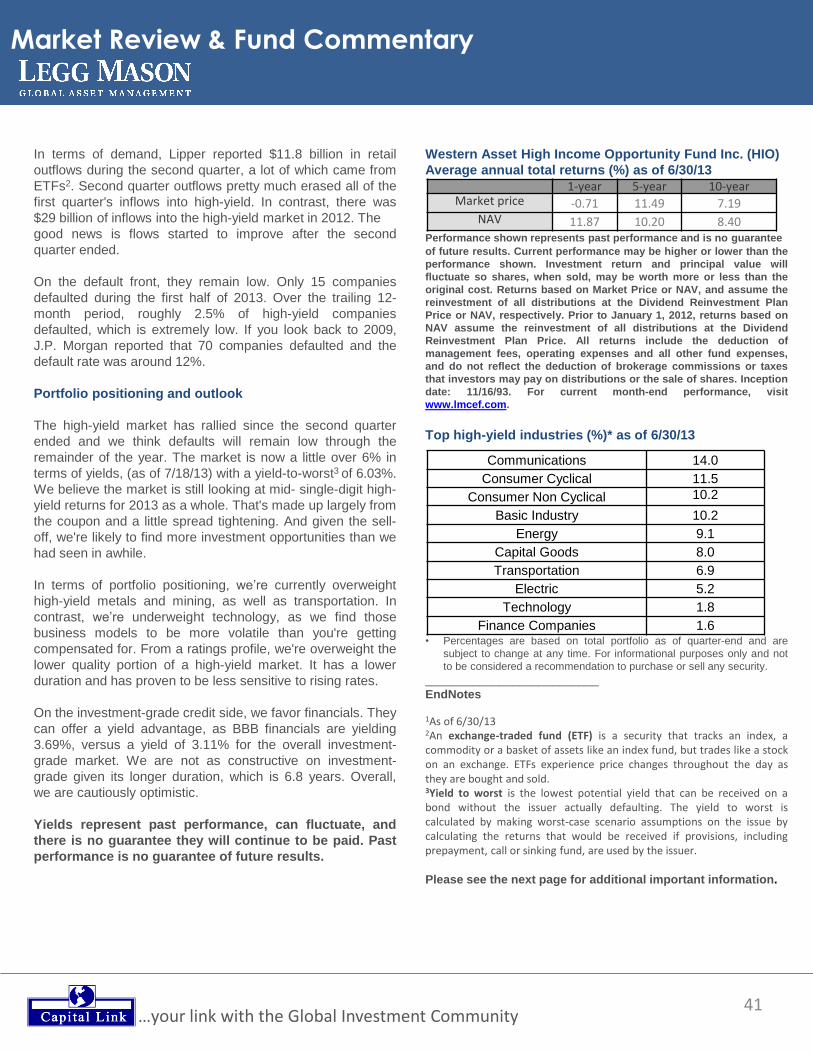
41
Market Review & Fund Commentary
…your link with the Global Investment Community
In terms of demand, Lipper reported $11.8 billion in retail
outflows during the second quarter, a lot of which came from
ETFs2. Second quarter outflows pretty much erased all of the
first quarter's inflows into high-yield. In contrast, there was
$29 billion of inflows into the high-yield market in 2012. The
good news is flows started to improve after the second
quarter ended.
On the default front, they remain low. Only 15 companies
defaulted during the first half of 2013. Over the trailing 12-
month period, roughly 2.5% of high-yield companies
defaulted, which is extremely low. If you look back to 2009,
J.P. Morgan reported that 70 companies defaulted and the
default rate was around 12%.
Portfolio positioning and outlook
The high-yield market has rallied since the second quarter
ended and we think defaults will remain low through the
remainder of the year. The market is now a little over 6% in
terms of yields, (as of 7/18/13) with a yield-to-worst3 of 6.03%.
We believe the market is still looking at mid- single-digit high-
yield returns for 2013 as a whole. That's made up largely from
the coupon and a little spread tightening. And given the sell-
off, we're likely to find more investment opportunities than we
had seen in awhile.
In terms of portfolio positioning, we’re currently overweight
high-yield metals and mining, as well as transportation. In
contrast, we’re underweight technology, as we find those
business models to be more volatile than you're getting
compensated for. From a ratings profile, we're overweight the
lower quality portion of a high-yield market. It has a lower
duration and has proven to be less sensitive to rising rates.
On the investment-grade credit side, we favor financials. They
can offer a yield advantage, as BBB financials are yielding
3.69%, versus a yield of 3.11% for the overall investment-
grade market. We are not as constructive on investment-
grade given its longer duration, which is 6.8 years. Overall,
we are cautiously optimistic.
Yields represent past performance, can fluctuate, and
there is no guarantee they will continue to be paid. Past
performance is no guarantee of future results.
Western Asset High Income Opportunity Fund Inc. (HIO)
Average annual total returns (%) as of 6/30/13
Performance shown represents past performance and is no guarantee
of future results. Current performance may be higher or lower than the
performance shown. Investment return and principal value will
fluctuate so shares, when sold, may be worth more or less than the
original cost. Returns based on Market Price or NAV, and assume the
reinvestment of all distributions at the Dividend Reinvestment Plan
Price or NAV, respectively. Prior to January 1, 2012, returns based on
NAV assume the reinvestment of all distributions at the Dividend
Reinvestment Plan Price. All returns include the deduction of
management fees, operating expenses and all other fund expenses,
and do not reflect the deduction of brokerage commissions or taxes
that investors may pay on distributions or the sale of shares. Inception
date: 11/16/93. For current month-end performance, visit
www.lmcef.com.
Top high-yield industries (%)* as of 6/30/13
• Percentages are based on total portfolio as of quarter-end and are
subject to change at any time. For informational purposes only and not
to be considered a recommendation to purchase or sell any security.
__________________________
EndNotes 1As of 6/30/13 2An exchange-traded fund (ETF) is a security that tracks an index, a commodity or a basket of assets like an index fund, but trades like a stock on an exchange. ETFs experience price changes throughout the day as they are bought and sold. 3Yield to worst is the lowest potential yield that can be received on a bond without the issuer actually defaulting. The yield to worst is calculated by making worst-case scenario assumptions on the issue by calculating the returns that would be received if provisions, including prepayment, call or sinking fund, are used by the issuer.
Please see the next page for additional important information.
1-year 5-year 10-year Market price -0.71 11.49 7.19
NAV 11.87 10.20 8.40
Communications 14.0
Consumer Cyclical 11.5
Consumer Non Cyclical 10.2
Basic Industry 10.2
Energy 9.1
Capital Goods 8.0
Transportation 6.9
Electric 5.2
Technology 1.8
Finance Companies 1.6

42
Market Review & Fund Commentary
…your link with the Global Investment Community
For more information about any of our closed-end funds,
including long-term performance, risks, expenses and fund
objectives, please visit www.lmcef.com.
Important Information
All investments are subject to risks, including the possible loss of
principal. The Fund's investments are subject to credit risk, inflation
risk, and interest rate risk. As interest rates rise, bond prices fall,
reducing the value of the Fund's share price. The Fund may invest
in lower-rated high yield bonds which are subject to greater credit
risk (risk of default) than higher-rated obligations. Investments in
foreign securities involve risks, including the possibility of losses due
to changes in currency exchange rates and negative developments
in the political, economic, or regulatory structure of specific countries
or regions. These risks are greater in emerging markets. The Fund
may make significant investments in derivative instruments.
Derivative instruments can be illiquid, may disproportionately
increase losses, and have a potentially large impact on Fund
performance. Distributions are not guaranteed and are subject to
change.
The Closed-End Funds are not sold or distributed by Legg
Mason Investor Services, LLC ("LMIS") or any affiliate of Legg
Mason, Inc. Unlike open-end funds, shares are not continually
offered. Like other public companies, closed-end funds have a one-
time initial public offering, and once their shares are first issued, are
generally bought and sold through non-affiliated broker/dealers and
trade on nationally recognized stock exchanges. Share prices will
fluctuate with market conditions and, at the time of sale, may be
worth more or less than your original investment. Shares of
exchange-traded closed-end funds may trade at a discount or
premium to their original offering price, and often trade at a discount
to their net asset value. Net Asset Value (NAV) is total assets less
total liabilities divided by the number of shares outstanding. Market
Price, determined by supply and demand, is the price an investor
purchases or sells the fund. Investment return, market price and net
asset value will fluctuate with changes in market conditions. The
Funds are subject to investment risks, including the possible loss of
principal invested.
Glossary
Credit spread is the difference between the yield of a particular
corporate security and the yield of a benchmark security with the
same maturity.
Credit quality is a measure of a bond issuer's ability to repay
interest and principal in a timely manner. The credit ratings
discussed are based on each portfolio security's rating as provided
by Standard and Poor's, Moody's Investors Service and/or Fitch
Ratings, Ltd. and typically range from AAA (highest) to D (lowest), or
an equivalent and/or similar rating. For this purpose, if two or more
of the agencies have assigned differing ratings to a security, the
highest rating is used. The credit quality of the investments in the
Fund's portfolio does not apply to the stability or safety of the Fund.
These ratings are updated monthly and may change over time.
Please note, the Fund itself has not been rated by an
independent rating agency.
The Federal Reserve Board (“Fed”) is responsible for the
formulation of policies designed to promote economic growth, full
employment, stable prices, and a sustainable pattern of international
trade and payments.
Free cash flow (FCF) is a measure of financial performance
calculated as operating cash flow minus capital expenditures. It
represents the cash that a company is able to generate after laying
out the money required to maintain or expand its asset base.
High-yield bonds, generally rated below BBB or unrated, are
commonly referred to as “junk bonds. Investment grade bonds are
generally rated BBB and above.
U.S. Treasuries are direct debt obligations issued and backed by
the "full faith and credit" of the U.S. government. The U.S.
government guarantees the principal and interest payments on U.S.
Treasuries when the securities are held to maturity.
The Barclays U.S. Corporate High Yield 2% Issuer Cap Index is
an index of the 2% Issuer Cap component of the Barclays Capital
U.S. Corporate High Yield Index, which covers the U.S. dollar-
denominated, non-investment grade fixed-rate, taxable corporate
bond market.
The Barclays U.S. Credit Index is an index composed of corporate
and non-corporate debt issues that are investment grade.
An investor cannot invest directly in an index. Unmanaged
index returns do not reflect any fees, expenses or sales
charges.
Opinions shared in this commentary are current as of July 18, 2013 and are
subject to change based on markets and other conditions. These opinions
do not constitute, and should not be construed as, investment advice or
recommendations. The opinions expressed are those of the portfolio
managers indicated and may differ from the views of other managers or the
firm as a whole. And they are not intended to be a forecast of future events
or a guarantee of future results.
Discussions of individual securities are intended to inform shareholders as
to the basis (in whole or in part) for previously made decisions by a portfolio
manager to buy, sell or hold a security in a portfolio. References to specific
securities are not intended, and should not be relied upon, as the basis for
anyone to buy, sell or hold any security. Investors seeking financial advice
regarding the appropriateness of investing in any securities or investment
strategies should consult their financial professional.
Western Asset Management and Legg Mason Investor Services, LLC, are
subsidiaries of Legg Mason, Inc. Other entities mentioned are not affiliated
with Legg Mason, Inc.
© 2013 Legg Mason Investor Services, LLC. Member FINRA, SIPC. 8/13
FN1312646
INVESTMENT PRODUCTS: NOT FDIC INSURED | NO BANK
GUARENTEE | MAY LOSE VALUE
The recent fall of the Shanghai stock market to its lowest
level since 2008, coupled with reports of spiking interbank
rates, have sparked fears that China is slowing abruptly
and that financial meltdown might follow. How serious is
this? The slowing economy is nothing new. Years of over-
investment, rising wages and weak export markets have
made it inevitable that China would soon have to accept
Gross Domestic Product (GDP) growth lower than the 8-
9% per annum it has managed for the past two decades. China’s new leadership has telegraphed as much. It has
talked about quality of growth and the need to shift emphasis
to domestic demand while at the same time boosting
productivity. Behind this is a desire to avoid a ‘middle income
trap’ – declining competitiveness abroad coupled with
stagnant wage growth. But there are obstacles in this transition. Past over-
investment is a symptom of weak credit control. That has
translated into rising bad debt that banks have tried to hide.
It has also spawned the vast ‘shadow banking’1 system.
Nearly every financial institution is involved, from the local
village bank upwards. So-called entrusted loans are at the heart of this system.
They are typically issued by finance companies and credit
guarantee firms affiliated to state-owned enterprises (SOEs)
with easy access to credit. Instead of using the funds to
expand production capacity, which would be a loss-making
move, SOEs lend the money to smaller companies at much
higher interest rates. In turn, these entrusted loans find their
way into real estate speculation. Since early this month until June 26th, money market rates
had remained at elevated levels, resulting in a severe
credit squeeze. The central bank , the People’s Bank of
China (PBOC), could have injected liquidity into the
system but chose not to. It has now cited ‘seasonal factors’
as the reason for the abnormality. Money market rates are
expected to fall. Outwardly this looks like a warning shot to the financial
system as a whole. The PBOC probably relented this time
only because investors had begun dumping stocks, which
infected sentiment in the bond market, leading to new issues
being aborted. As the bond market is one area where banks
hope to fund the returns offered on wealth management
products – a popular alternative to savings
– disruption could have had considerable knockon effects. Publicly, the PBOC is backstopping the banks. But it surely
doesn’t end there. China may have a closed economy (in
the sense of a closed capital account) and much of the
banking system may lie in state ownership. Still, we believe
it is a stretch to imagine that China has found the secret to
good credit allocation, especially in the absence of true
market price signals.
In the event of a true crunch, it would be interesting to see
whether smaller lending institutions are allowed to go to the
wall. Most likely the bigger state-run institutions would take
them over. However, the immediate question thrown up by
this episode is whether further pre-emptive action will follow;
or whether there will be pressure to keep the credit machine
going because of the slowing economy. We would view any credit tightening (better lending
standards, tighter surveillance, a clampdown on unregulated
activity...) as potentially positive, not only for the banking
system, but also the property market. Despite repeated
efforts to reduce the bubble, new home prices in May still
rose at their fastest pace in more than two years. This continued boom points to the struggle authorities face in
trying to manage the competing interests of banks,
consumers and the businesses. Yet it should become
increasingly clear to all that China’s slowdown is not only
inevitable but desirable. The banking system needs cleaning
up and addressing it now will avoid a more expensive
recapitalization later. None of this sits well with regional trade partners who have
come to depend on Chinese demand for everything from
coal to capital goods to keep their economies going. We
believe Australia is most exposed. Weaker imports for iron
ore and copper have hit metal prices. Iron ore is selling at
US$110 a ton, a fraction of the US$180 a ton Australian
exporters commanded only a couple of years ago. For
China’s steel mills over-capacity could persist for some
time if construction is now being reined in.
43 …your link with the Global Investment Community
Market Commentary
Implications of China’s Cash Crunch July, 2013
44 …your link with the Global Investment Community
Market Commentary
Across Asian stock markets, we believe investors are trying
to work out how a slowdown will affect profits. It is so long
since China faced a slowdown of the present magnitude, and
its economic base so changed (to say nothing of its
integration into the global economy) that the answers aren’t
necessarily clear. The hope is that this will prove just a
change of gears. But it’s too glib to think China’s growing
middle class and huge domestic market will provide a ready
cushion. We believe this is more of a long-term story. So, we expect more volatility in markets if not in economic
data. The important consolation is a slowdown in China may
seem like a recession but it will be nothing like the real ones
afflicting parts of the developed world. The fundamentals of
other Asian countries also remain sound, even if the pace of
expansion is slowing.
Share valuations are becoming attractive, too, certainly if one
compares price-to-earnings (p/e) ratios* to those in key
developed markets. If more investors pull money from these
markets amid a hullabaloo that the emerging markets story is
over, they will create a potential buying opportunity. For the moment we are sitting tight. The PBOC’s actions
may have rattled some, but we see only a limited impact in
the short term on our equity holdings in China. We prefer to
gain exposure via well-established Hong-Kong domiciled
companies that operate in the mainland. We believe our
holdings are fundamentally sound and well-capitalised.
Endnotes 1 Shadow banking refers to the financial intermediaries involved in facilitating the creation of credit across the global financial system, but whose members are not subject to regulatory oversight. The shadow banking system also refers to unregulated activities by regulated institutions.
* Price-to-earnings is a valuation ratio of a company’s current share price compared to its per-share earnings.
About Aberdeen Asset Management Inc.
Aberdeen has been investing in Asia since 1985 and established our Asian headquarters in 1992 with an office in Singapore. In addition to being one of the largest pure stand-alone asset management
houses investing in the Asia-Pacific region, Aberdeen Group is the largest manager of emerging market closed-end funds offered around the world by both value and number.*
For more information on The Greater India Fund, Inc.:
Investor Relations (800) 522-465 InvestorRelations@aberdeen-
asset.com www.aberdeengch.com
*Fund Consultants LLC, February 2013. Based on analysis of emerging market closed-end funds offered in multiple jurisdictions as of December 31, 2012; data provided by Morningstar Inc. Closed-end funds
are defined as investment companies that are 1) listed on a recognized exchange; 2) possess fixed share capital and; 3) were formed via subscriptions from the public via an open offer or placement.
Criteria for inclusion in the emerging markets category is based on the World Bank’s definition of emerging countries as measured by lower and middle income per capita. Criteria for fund inclusion is 1) at
least 75% of gross assets invested in emerging markets; 2) funds with under 25% exposure to Asian developed markets.
IMPORTANT INFORMATION
PAST PERFORMANCE IS NOT AN INDICATION OF FUTURE RESULTS Foreign securities are more volatile, harder to price and less liquid than U.S. securities. They are subject to different accounting and regulatory standards, and political and economic risks. These risks may be
enhanced in emerging markets countries. Concentrating investments in the China and Hong Kong subjects the portfolio to more volatility and greater risk of loss than geographically diverse investments.
The above is for informational purposes only and should not be considered as an offer, or solicitation, to deal in any of the investments mentioned herein. Aberdeen Asset Management (AAM) does not
warrant the accuracy, adequacy or completeness of the information and materials contained in this document and expressly disclaims liability for errors or omissions in such information and materials.
Some of the information in this document may contain projections or other forward looking statements regarding future events or future financial performance of countries, markets or companies. These
statements are only predictions and actual events or results may differ materially. The reader must make his/her own assessment of the relevance, accuracy and adequacy of the information contained in this
document, and make such independent investigations, as he/she may consider necessary or appropriate for the purpose of such assessment.
Any opinion or estimate contained in this document is made on a general basis and is not to be relied on by the reader as advice. Neither AAM nor any of its agents have given any consideration to nor have
they made any investigation of the investment objectives, financial situation or particular need of the reader, any specific person or group of persons. Accordingly, no warranty whatsoever is given and no
liability whatsoever is accepted for any loss arising whether directly or indirectly as a result of the reader, any person or group of persons acting on any information, opinion or estimate contained in this
document.
AAM reserves the right to make changes and corrections to its opinions expressed in this document at any time, without notice.
Closed-end funds are traded on the secondary market through one of the stock exchanges. The Fund’s investment return and principal value will fluctuate so that an investor’s shares may be worth more
or less than the original cost. Shares of closed-end funds may trade above (a premium) or below (a discount) the net asset value (NAV) of the fund’s portfolio. There is no assurance that the Fund will
achieve its investment objective.
In the United Sates, AAM the marketing name for the following affiliated, registered investment advisers: Aberdeen Asset Management Inc., Aberdeen Asset Managers Ltd, Aberdeen Asset Management Ltd
and Aberdeen Asset Management Asia Ltd, each of which is wholly owned by Aberdeen Asset Management PLC. “Aberdeen” is a U.S. registered service mark of Aberdeen Asset Management PLC.
Aberdeen Asset Management Inc. 1735
Market Street, 32nd Floor Philadelphia,
PA 19103
Telephone: (800) 485-2294
aberdeen-asset.us Ref: 16057-100713-1 009079-0713-
PHL
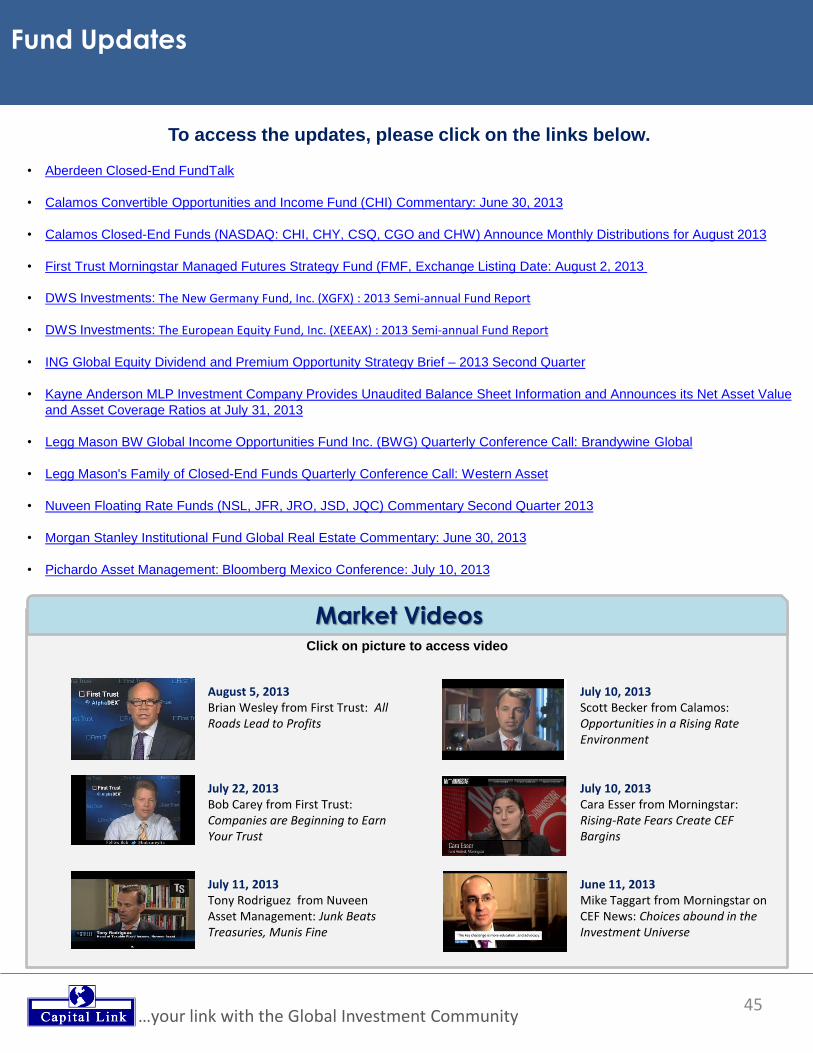
45
Fund Updates
…your link with the Global Investment Community
To access the updates, please click on the links below. • Aberdeen Closed-End FundTalk
• Calamos Convertible Opportunities and Income Fund (CHI) Commentary: June 30, 2013
• Calamos Closed-End Funds (NASDAQ: CHI, CHY, CSQ, CGO and CHW) Announce Monthly Distributions for August 2013
• First Trust Morningstar Managed Futures Strategy Fund (FMF, Exchange Listing Date: August 2, 2013
• DWS Investments: The New Germany Fund, Inc. (XGFX) : 2013 Semi-annual Fund Report
• DWS Investments: The European Equity Fund, Inc. (XEEAX) : 2013 Semi-annual Fund Report
• ING Global Equity Dividend and Premium Opportunity Strategy Brief – 2013 Second Quarter
• Kayne Anderson MLP Investment Company Provides Unaudited Balance Sheet Information and Announces its Net Asset Value
and Asset Coverage Ratios at July 31, 2013
• Legg Mason BW Global Income Opportunities Fund Inc. (BWG) Quarterly Conference Call: Brandywine Global
• Legg Mason's Family of Closed-End Funds Quarterly Conference Call: Western Asset
• Nuveen Floating Rate Funds (NSL, JFR, JRO, JSD, JQC) Commentary Second Quarter 2013
• Morgan Stanley Institutional Fund Global Real Estate Commentary: June 30, 2013
• Pichardo Asset Management: Bloomberg Mexico Conference: July 10, 2013
• Pichardo Asset Management: 1st Annual Conference: Capitalizing on Mexico’s Long-Term Commitment: June, 26, 2013
Market Videos Click on picture to access video
June 11, 2013 Mike Taggart from Morningstar on CEF News: Choices abound in the Investment Universe
July 22, 2013 Bob Carey from First Trust: Companies are Beginning to Earn Your Trust
July 11, 2013 Tony Rodriguez from Nuveen Asset Management: Junk Beats Treasuries, Munis Fine
July 10, 2013 Scott Becker from Calamos: Opportunities in a Rising Rate Environment
July 10, 2013 Cara Esser from Morningstar: Rising-Rate Fears Create CEF Bargins
August 5, 2013 Brian Wesley from First Trust: All Roads Lead to Profits

46 …your link with the Global Investment Community
CEFs & ETPs Event Calendar
Upcoming CEFs & ETFs Webinars
To join our COMPLIMENTARY webinars, sign up at: http://webinars.capitallink.com/sectors/cef-etf.htm
All webinars are accessible through a live audio webcast and then as an audio archive through www.capitallinkwebinars.com.
Disclaimer-Terms of Use: The information herein is not an offer to buy or sell any kind of securities nor does it constitute advice of any kind. The material
featured in this Newsletter is for educational and information purposes only. Material featured in this Newsletter is taken from sources considered to be
reliable but Capital Link does not represent or warrant the accuracy of the information. The opinions expressed in this Newsletter do not necessarily reflect
those of Capital Link who takes no responsibility at all for them and cannot be held liable for any matter in any way.
DATE: AUGUST 20, 2013 | TUESDAY
TIME: 11 AM ET
TOPIC: Investment Opportunities and Outlook in Closed-End Funds
SPEAKER: Douglas Bond, Executive VP, Portfolio Manager
Cohen & Steers
DATE: SEPTEMBER 10, 2013 | TUESDAY
TIME: 11 AM ET
TOPIC: TBD
SPEAKER: Fitch Ratings
DATE: OCTOBER 1, 2013 | TUESDAY
TIME: 11 AM ET
TOPIC: ETP Analyst Webinar
SPEAKERS: BlackRock, BofA Merrill Lynch, Credit Suisse, Morgan
Stanley, Wells Fargo Advisors
DATE: OCTOBER 15, 2013 | TUESDAY
TIME: 11 AM ET
TOPIC: Factor Investing
SPEAKER: Mark Carver, Director, Multi-Asset Strategies Group
BlackRock
DATE: NOVEMEBER 19, 2013 | TUESDAY
TIME: 11 AM ET
TOPIC: ETF Landscape
SPEAKER: Dodd Kittsley, Director, Global Head of ETP Research
BlackRock
DATE: DECEMBER 10, 2013 | TUESDAY
TIME: 11 AM ET
TOPIC: TBD
SPEAKER: BlackRock
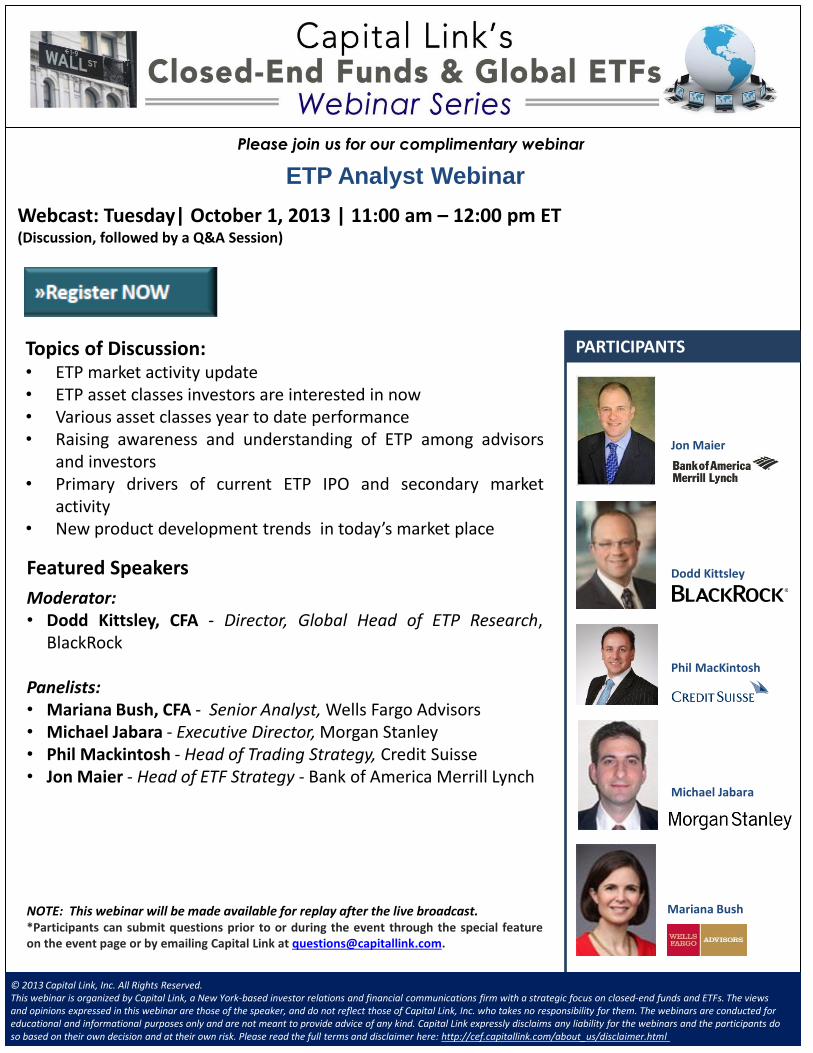
ETP Analyst Webinar
Webcast: Tuesday| October 1, 2013 | 11:00 am – 12:00 pm ET (Discussion, followed by a Q&A Session)
© 2013 Capital Link, Inc. All Rights Reserved. This webinar is organized by Capital Link, a New York-based investor relations and financial communications firm with a strategic focus on closed-end funds and ETFs. The views and opinions expressed in this webinar are those of the speaker, and do not reflect those of Capital Link, Inc. who takes no responsibility for them. The webinars are conducted for educational and informational purposes only and are not meant to provide advice of any kind. Capital Link expressly disclaims any liability for the webinars and the participants do so based on their own decision and at their own risk. Please read the full terms and disclaimer here: http://cef.capitallink.com/about_us/disclaimer.html
Please join us for our complimentary webinar
Featured Speakers
Moderator: • Dodd Kittsley, CFA - Director, Global Head of ETP Research,
BlackRock
Panelists: • Mariana Bush, CFA - Senior Analyst, Wells Fargo Advisors • Michael Jabara - Executive Director, Morgan Stanley • Phil Mackintosh - Head of Trading Strategy, Credit Suisse • Jon Maier - Head of ETF Strategy - Bank of America Merrill Lynch
NOTE: This webinar will be made available for replay after the live broadcast. *Participants can submit questions prior to or during the event through the special feature on the event page or by emailing Capital Link at [email protected].
PARTICIPANTS Topics of Discussion: • ETP market activity update • ETP asset classes investors are interested in now • Various asset classes year to date performance • Raising awareness and understanding of ETP among advisors
and investors • Primary drivers of current ETP IPO and secondary market
activity • New product development trends in today’s market place
Jon Maier
Dodd Kittsley
Phil MacKintosh
Michael Jabara
Mariana Bush
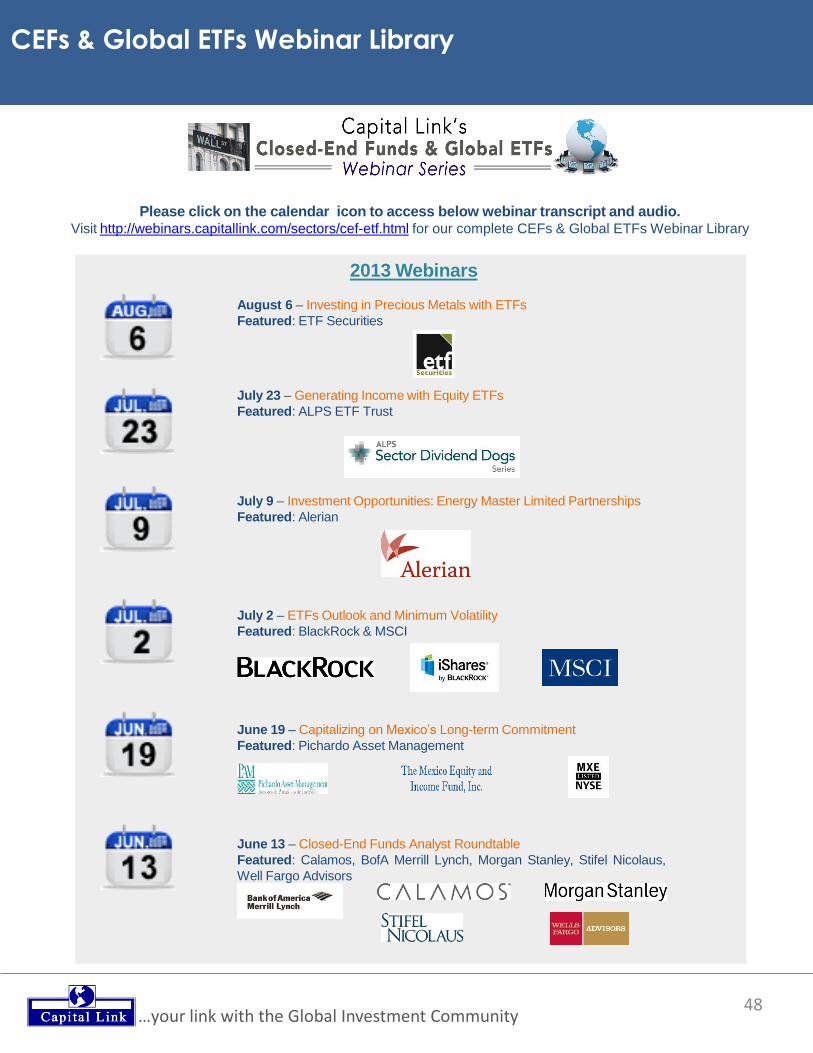
48 …your link with the Global Investment Community
CEFs & Global ETFs Webinar Library
July 9 – Investment Opportunities: Energy Master Limited Partnerships
Featured: Alerian
Please click on the calendar icon to access below webinar transcript and audio. Visit http://webinars.capitallink.com/sectors/cef-etf.html for our complete CEFs & Global ETFs Webinar Library
July 2 – ETFs Outlook and Minimum Volatility
Featured: BlackRock & MSCI
June 13 – Closed-End Funds Analyst Roundtable
Featured: Calamos, BofA Merrill Lynch, Morgan Stanley, Stifel Nicolaus,
Well Fargo Advisors
June 19 – Capitalizing on Mexico’s Long-term Commitment
Featured: Pichardo Asset Management
2013 Webinars
July 23 – Generating Income with Equity ETFs
Featured: ALPS ETF Trust
August 6 – Investing in Precious Metals with ETFs
Featured: ETF Securities