cee issue1 05 25 - bank austria · srbija i crna gora slovensko slovenija ^ structural indicators...
TRANSCRIPT
CEE Economic DataOutlook for 2006Issue 1
X P L I C I T
A Member of HVB Group
Business Information http://economicresearch-e.ba-ca.com
Banking for success.
Economics Department
Hohenstaufengasse 6A-1010 ViennaAustriaTel. +43 (0) 50505-41952Fax +43 (0) 50505-41050e-mail: [email protected]
Public Relations, Media
Lassallestrasse 1A-1020 ViennaAustriaTel. +43 (0) 50505-56141Fax +43 (0) 50505-56945e-mail: [email protected]
ImprintPublished by Bank Austria Creditanstalt AG, Vienna,A-1030 Vienna, Vordere Zollamtsstrasse 13A-1010 Vienna, Am Hof 2Edited by Bernhard Sinhuber (Economics Department)Telephone: +43 (0) 50505 41964,e-mail: [email protected]: Public Relations, Patrizia ReidlGraphic design and front page image: Miriam Weigel Front page: Christian HorvathPrinted by GutenbergSources: National statistics, Bank Austria Creditanstalt Economics DepartmentClosing date: April 26th, 2005

4
6
8
10
12
14
16
18
20
22
24
26
28
30
32
34
CONTENTS
Bosnia and Herzegovina
Bulgaria
Croatia
Czech Republic
Estonia
Hungary
Latvia
Lithuania
Macedonia
Poland
Romania
Russia
Serbia and Montenegro
Slovakia
Slovenia
Ukraine
Bosna i Hercegovina
��������
Hrvatska
âeská republika
Eesti
Magyarország
Latvija
Lietuva
��� ����
Polska
Romania
� ����
Srbija i Crna Gora
Slovensko
Slovenija
������
^

Structural IndicatorsStrukturni pokazatelji
51,129
3.8
Borislav Paravac
Adnan Terzic
6.6
1,730
35.4
HVB CENTRAL PROFIT BANKA D.D.ZELENIH BERETKI 24BA-71000 SARAJEVOBOSNIA AND HERZEGOVINA
BOSNIA AND HERZEGOVINA
Gross domestic product by economic sectors (in %) 2003Bruto nacionalni prozvod po privrednim sektorima 2003
WWW.HVB-CPB.BATEL. (+387 33) 533 688FAX (+387 33) 238 340
PovrÂina (km2)
StanovniÂtvo (u milionima)
Predsjednik
Premijer
BDP (za 2004. godinu, u milijardama EUR)
BDP po glavi stanovnika (BDP za 2004. godinu, u EUR)
Izvoz u % BDP-a (2004)
Area (km2)
Population in mn
President
Prime Minister
GDP (2004 in EUR bn)
Per capita GDP (2004 in EUR)
Exports in % of GDP (2004)
4
Agriculture and forestry Poljoprivreda i Âumarstvo 10.6
Industry Industrija 22.2
Construction Gradevinarstvo 5.6
Services Usluge 61.6
´
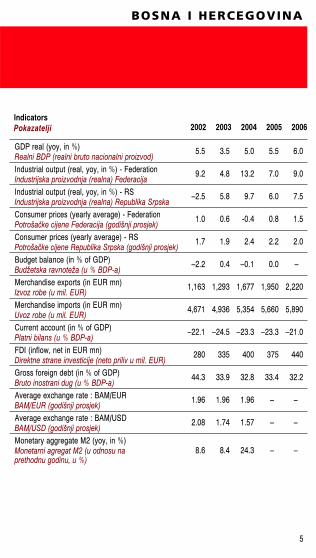
2002 2003 2004 2005 2006
5.5 3.5 5.0 5.5 6.0
9.2 4.8 13.2 7.0 9.0
–2.5 5.8 9.7 6.0 7.5
1.0 0.6 -0.4 0.8 1.5
1.7 1.9 2.4 2.2 2.0
–2.2 0.4 –0.1 0.0 –
1,163 1,293 1,677 1,950 2,220
4,671 4,936 5,354 5,660 5,890
–22.1 –24.5 –23.3 –23.3 –21.0
280 335 400 375 440
44.3 33.9 32.8 33.4 32.2
1.96 1.96 1.96 – –
2.08 1.74 1.57 – –
8.6 8.4 24.3 – –
IndicatorsPokazatelji
BOSNA I HERCEGOVINA
Realni BDP (realni bruto nacionalni proizvod)
Industrijska proizvodnja (realna) Federacija
Industrijska proizvodnja (realna) Republika Srpska
PotroÂaãke cijene Federacija (godiÂnji prosjek)
PotroÂaãke cijene Republika Srpska (godiÂnji prosjek)
BudÏetska ravnoteÏa (u % BDP-a)
Izvoz robe (u mil. EUR)
Uvoz robe (u mil. EUR)
Platni bilans (u % BDP-a)
Direktne strane investicije (neto priliv u mil. EUR)
Bruto inostrani dug (u % BDP-a)
BAM/EUR (godiÂnji prosjek)
BAM/USD (godiÂnji prosjek)
Monetarni agregat M2 (u odnosu naprethodnu godinu, u %)
GDP real (yoy, in %)
Industrial output (real, yoy, in %) - Federation
Industrial output (real, yoy, in %) - RS
Consumer prices (yearly average) - Federation
Consumer prices (yearly average) - RS
Budget balance (in % of GDP)
Merchandise exports (in EUR mn)
Merchandise imports (in EUR mn)
Current account (in % of GDP)
FDI (inflow, net in EUR mn)
Gross foreign debt (in % of GDP)
Average exchange rate : BAM/EUR
Average exchange rate : BAM/USD
Monetary aggregate M2 (yoy, in %)
5
HVB BANK BIOCHIM AD1, IVAN VAZOV STR.BG-1026 SOFIABULGARIA
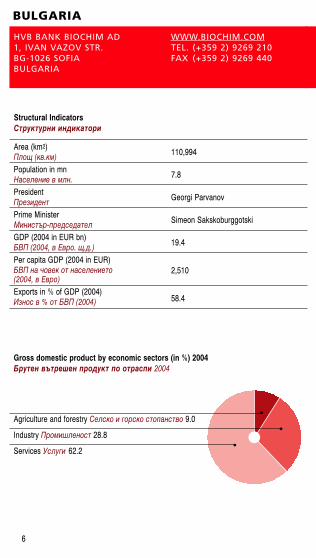
BULGARIA
WWW.BIOCHIM.COMTEL. (+359 2) 9269 210FAX (+359 2) 9269 440
Agriculture and forestry ���� � � �� �� ������ 9.0
Industry �� ������ �� 28.8
Services ������ 62.2
6
Structural Indicators���������� ��������
110,994
7.8
Georgi Parvanov
Simeon Sakskoburggotski
19.4
2,510
58.4
Gross domestic product by economic sectors (in %) 2004������ ������� ������ � ����� 2004
Area (km2)
Population in mn
President
Prime Minister
GDP (2004 in EUR bn)
Per capita GDP (2004 in EUR)
Exports in % of GDP (2004)
�� � (�.�)
��������� � ���.
���������
�������-�����������
��� (2004, � !�� . �.�.)
��� �� " �� � ���������� (2004, � !�� )
#�� � � % � ��� (2004)

��������
7
HEBROS BANK37, TZAR BORIS III OBEDINITEL BLVD.BG-4018 PLOVDIVBULGARIA
WWW.HEBROS.BGTEL. (+359 32) 90 57 73FAX (+359 32) 90 22 11
2002 2003 2004 2005 2006
4.9 4.5 5.6 5.3 6.0
4.7 14.1 17.7 11.9 15.2
8.5 13.9 12.0 12.5 13.8
5.8 2.3 6.2 4.0 3.8
17.4 14.3 12.7 12.0 11.5
–0.6 0.0 1.7 1.0 0.5
6,063 6,668 7,994 9,200 10,500
7,755 8,868 10,712 12,400 14,500
–5.6 –9.2 –7.4 –8.2 –9.4
951 1,827 1,640 2,000 2,000
65.1 60.2 63.0 63.4 64.1
1.96 1.96 1.96 – –
2.07 1.73 1.57 – –
11.7 18.8 23.3 – –
3.3 2.5 2.7 – –
Indicators��������
GDP real (yoy, in %)
Industrial output (real, yoy, in %)
Gross fixed capital formation (real, yoy, in %)
Consumer prices (yearly average)
Unemployment (yearly average)
Budget balance (in % of GDP)
Merchandise exports (in EUR mn)
Merchandise imports (in EUR mn)
Current account (in % of GDP)
FDI (inflow, net in EUR mn)
Gross foreign debt (in % of GDP)
Average exchange rate: BGN/EUR
Average exchange rate: BGN/USD
Monetary aggregate M2 (yoy, in %)
3-month yield on government bonds (end of period, in %)
������ ��� (����� ����x ����� � ����, � %)
�� ������ �� ��� ���� (����� ����x ����� � ����, � %)
������ �������$�� (����� ����x ����� � ����, � %)
#���� �� � ���&�������� $��� (����� � ���� )
�����& ��$� (����� � ���� )
�'�*���� ��+�$�� (� % � ���)
�� � ��� � (� !�� �.�.)
�� � �� � (� !�� �.�.)
/���� ����� (� % � ���)
1�*��������� ������� �������$��(���� , ���� � !�� �.�.)
������ ������ ���� (� % � ���)
������ ������� ���: BGN/EUR
������ ������� ���: BGN/USD
����"�� ������� 2 (����� ����x ����� � ����, � %)
3 x �� �� � 3-����"�� ��� ����� & � �� (� ��� �� ���� ��, � %)
Structural IndicatorsStrukturni pokazatelji
56,538
4.4
Stjepan Mesic
Ivo Sanader
27.6
6,280
47.5
CROATIA
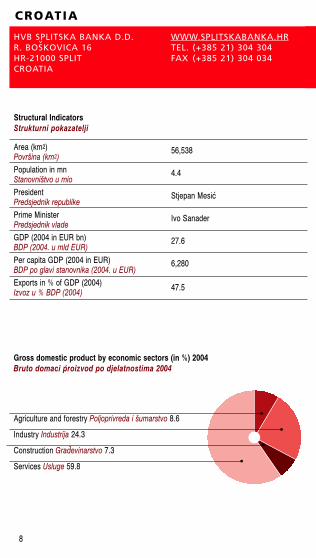
Gross domestic product by economic sectors (in %) 2004Bruto domaci proizvod po djelatnostima 2004
Agriculture and forestry Poljoprivreda i Âumarstvo 8.6
Industry Industrija 24.3
Construction Gradevinarstvo 7.3
Services Usluge 59.8
Area (km2)
Population in mn
President
Prime Minister
GDP (2004 in EUR bn)
Per capita GDP (2004 in EUR)
Exports in % of GDP (2004)
8
HVB SPLITSKA BANKA D.D.R. BOSKOVICA 16HR-21000 SPLITCROATIA
WWW.SPLITSKABANKA.HRTEL. (+385 21) 304 304FAX (+385 21) 304 034
¯
PovrÂina (km2)
StanovniÂtvo u mio
Predsjednik republike
Predsjednik vlade
BDP (2004. u mld EUR)
BDP po glavi stanovnika (2004. u EUR)
Izvoz u % BDP (2004)
´
´
^

2002 2003 2004 2005 2006
5.2 4.3 3.8 3.5 3.6
5.4 4.1 3.3 3.1 3.7
10.1 16.8 4.4 5.0 5.5
2.3 1.8 2.1 2.8 2.6
22.5 19.5 18.2 18.5 18.0
-5.2 -6.3 -4.9 -5.0 -4.5
5,312 5,572 6,602 7,200 7,850
11,309 12,546 13,327 14,250 15,000
-8.4 -7.2 -4.6 -5.1 -4.3
1,193 1,686 616 1,150 1,330
67.6 82.1 88.1 86.1 88.3
7.4 7.6 7.5 – –
7.9 6.7 6.0 – –
29.4 19.1 9.2 – –
2.0 4.8 3.8 – –
IndicatorsPokazatelji
HRVATSKA
9
GDP real (yoy, in %)
Industrial output (real, yoy, in %)
Gross fixed capital formation (real, yoy, in %)
Consumer prices (yearly average)
Unemployment (yearly average)
Budget balance (in % of GDP)
Merchandise exports (in EUR mn)
Merchandise imports (in EUR mn)
Current account (in % of GDP)
FDI (inflow, net in EUR mn)
Gross foreign debt (in % of GDP)
Average exchange rate: HRK/EUR
Average exchange rate: HRK/USD
Monetary aggregate M2 (yoy, in %)
3-month yield on government bonds (end of period, in %)
Realni BDP (u odnosu na prethodnu godinu, u %)
Industrijska proizvodnja (realno, u odnosu na prethodnu godinu, u %)
Investicije u osnovna sredstva (realno, u odnosu na prethodnu godinu, u %)
TroÂkovi Ïivota (godiÂnji prosjek)
Nezaposlenost (godiÂnji prosjek)
Proraãunska ravnoteÏa (u % BDP)
Izvoz robe (u mio EUR)
Uvoz robe (u mio EUR)
Tekuci raãun (u % BDP)
Izravna inozemna ulaganja (neto priljev, u mio EUR)
Bruto inozemni dug (u % BDP)
Prosjeãni devizni teãaj: HRK/EUR
Prosjeãni devizni teãaj: HRK/USD
Monetarni agregat M2 (u odnosu na prethodnu godinu, u %)
Tromjeseãna dobit od drÏavnih obveznica (kraj razdoblja, u %)
´

Structural IndicatorsStrukturální ukazatele
78,866
10.2
Václav Klaus
Jiri Paroubek
86.2
8,430
71.3
CZECH REPUBLIC
Gross domestic product by economic sectors (in %) 2004Hrub˘ dmácí produkt podle hospodáfisk˘ch sektorÛ 2004
Agriculture and forestry Zemûdûlství a lesnictví 2.5
Industry PrÛmysl 29.2
Construction Stavebnictví 5.7
Services SluÏby 62.6
Area (km2)
Population in mn
President
Prime Minister
GDP (2004 in EUR bn)
Per capita GDP (2004 in EUR)
Exports in % of GDP (2004)
10
HVB BANK CZECH REPUBLIC A.S.NAM. REPUBLIKY 3ACZ-110 00 PRAHA 1CZECH REPUBLIC
WWW.HVB.CZTEL. (+420) 221 112 111 FAX (+420) 221 112 132
Rozloha (km2)
Poãet obyvatel v mil.
Prezident
Pfiedseda vlády
HDP (2004, v mld. EUR)
HDP na jednoho obyvatele (2004, v EUR)
V˘voz v % HDP (2004)
2002 2003 2004 2005 2006
1.5 3.7 4.0 3.7 3.8
4.8 5.8 9.8 6.0 6.0
3.4 4.8 9.1 6.0 5.0
1.8 0.1 2.8 1.9 2.5
9.2 9.9 10.2 9.9 9.7
–6.8 –11.7 –3.0 –4.5 –4.0
40,701 43,138 53,715 64,360 74,750
43,014 45,321 54,415 64,190 74,240
–5.6 –6.2 –5.2 –4.8 –4.5
8,791 2,086 3,595 5,450 3,730
36.4 38.4 38.6 36.5 34.4
30.8 31.8 31.9 – –
32.6 28.1 25.6 – –
3.2 7.2 4.4 – –
3.6 2.3 2.2 – –
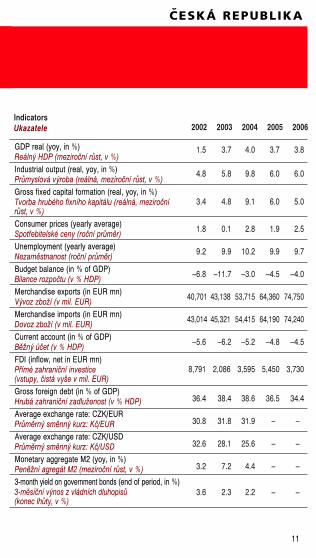
IndicatorsUkazatele
CESKÁ REPUBLIKA
GDP real (yoy, in %)
Industrial output (real, yoy, in %)
Gross fixed capital formation (real, yoy, in %)
Consumer prices (yearly average)
Unemployment (yearly average)
Budget balance (in % of GDP)
Merchandise exports (in EUR mn)
Merchandise imports (in EUR mn)
Current account (in % of GDP)
FDI (inflow, net in EUR mn)
Gross foreign debt (in % of GDP)
Average exchange rate: CZK/EUR
Average exchange rate: CZK/USD
Monetary aggregate M2 (yoy, in %)
3-month yield on government bonds (end of period, in %)
11
Reáln˘ HDP (meziroãní rÛst, v %)
PrÛmyslová v˘roba (reálná, meziroãní rÛst, v %)
Tvorba hrubého fixního kapitálu (reálná, meziroãní rÛst, v %)
Spotfiebitelské ceny (roãní prÛmûr)
Nezamûstnanost (roãní prÛmûr)
Bilance rozpoãtu (v % HDP)
V˘voz zboÏí (v mil. EUR)
Dovoz zboÏí (v mil. EUR)
BûÏn˘ úãet (v % HDP)
Pfiímé zahraniãní investice (vstupy, ãistá vyÂe v mil. EUR)
Hrubá zahraniãní zadluÏenost (v % HDP)
PrÛmûrn˘ smûnn˘ kurz: Kã/EUR
PrÛmûrn˘ smûnn˘ kurz: Kã/USD
PenûÏní agregát M2 (meziroãní rÛst, v %)
3-mûsíãní v˘nos z vládních dluhopisÛ(konec lhÛty, v %)
ˇ

Structural IndicatorsStruktuurilised tegurid
45,227
1.4
Arnold Rüütel
Andrus Ansip
8.9
6,590
79.7
ESTONIA
Gross domestic product by economic sectors (in %) 2004RKP majandussektorite lõikes 2004
Agriculture and forestry Põllumajandus ja metsandus 4.5
Industry Majandusharu 25.7
Construction Ehitus 6.8
Services Teenindus 63.0
Area (km2)
Population in mn
President
Prime Minister
GDP (2004 in EUR bn)
Per capita GDP (2004 in EUR)
Exports in % of GDP (2004)
12
BAYERISCHE HYPO- UNDVEREINSBANK AGTALLINN BRANCHLIIVALAIA STREET 13/15EST-10118 TALLINN, ESTONIA
WWW.HVB.EETEL. (+372) 668 8300FAX (+372) 668 8309
Pindala (km2)
Rahvastik, mln
President
Peaminister
Rahvuslik koguprodukt (RKP) (2004 a. mlr EUR)
Rahvuslik koguprodukt (RKP) elaniku kohta (2004 a. EUR-es)
Eksport % RKP (2004)

2002 2003 2004 2005 2006
7.2 5.1 6.2 6.0 5.8
8.3 9.9 8.3 8.8 8.0
17.2 5.4 6.9 8.3 9.0
3.6 1.3 3.0 3.5 2.5
10.3 10.0 9.8 9.5 9.2
1.0 3.1 1.8 0.9 0.5
3,728 4,061 4,796 5,500 6,200
4,878 5,457 6,372 7,250 8,080
–10.2 –13.2 –12.6 –11.1 –10.0
167 667 534 480 450
60.1 69.0 84.1 85.2 86.4
15.6 15.6 15.6 – –
16.6 13.8 12.6 – –
11.2 10.9 15.8 – –
3.5 2.6 2.4 – –
IndicatorsTegurid
EESTI
GDP real (yoy, in %)
Industrial output (real, yoy, in %)
Gross fixed capital formation (real, yoy, in %)
Consumer prices (yearly average)
Unemployment (yearly average)
Budget balance (in % of GDP)
Merchandise exports (in EUR mn)
Merchandise imports (in EUR mn)
Current account (in % of GDP)
FDI (inflow, net in EUR mn)
Gross foreign debt (in % of GDP)
Average exchange rate: EEK/EUR
Average exchange rate: EEK/USD
Monetary aggregate M2 (yoy, in %)
3-month yield on government bonds (end of period, in %)
13
Reaalne RKP (võrreldes eelmise aastaga, %)
Majandustoodang (tegelik, võrreldes eelmise aastaga, %)
Bruto põhikapital (tegelik, võrreldes eelmise aastaga, %)
Tarbija hinnad (aasta keskmine)
Töötus (aasta keskmine)
Eelarve bilanss (% RKP)
Kauba eksport (EUR mln)
Kauba import (EUR mln)
Jooksev maksebilanss (% RKP)
Välismaised otseinvesteeringud (neto mln EUR)
Brutto välisvõlg (% RKP)
Keskmine vahetuskurss: EEK/EUR
Keskmine vahetuskurss: EEK/USD
Raha ringlus (võrreldes eelmise aastaga, %)
Riigi obligatsioonide kolme kuu tootlus(perioodi lõpp, %)
Structural IndicatorsAlapadatok
93,033
10.1
Ferenc Mádl
Ferenc Gyurcsány
80.3
7,960
64.9
HUNGARY
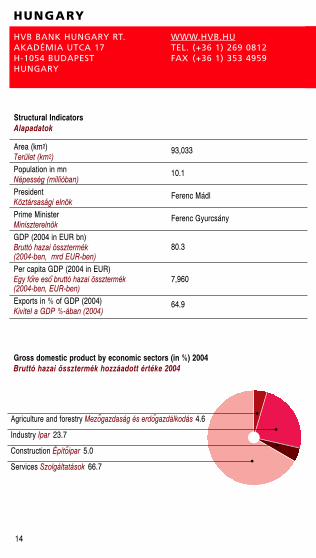
Gross domestic product by economic sectors (in %) 2004Bruttó hazai össztermék hozzáadott értéke 2004
Agriculture and forestry Mezogazdaság és erdogazdálkodás 4.6
Industry Ipar 23.7
Construction Építoipar 5.0
Services Szolgáltatások 66.7
Area (km2)
Population in mn
President
Prime Minister
GDP (2004 in EUR bn)
Per capita GDP (2004 in EUR)
Exports in % of GDP (2004)
14
HVB BANK HUNGARY RT.AKADÉMIA UTCA 17H-1054 BUDAPESTHUNGARY
WWW.HVB.HUTEL. (+36 1) 269 0812FAX (+36 1) 353 4959
´́
´́´́
´́ ´́
Terület (km2)
Népesség (millióban)
Köztársasági elnök
Miniszterelnök
Bruttó hazai össztermék (2004-ben, mrd EUR-ben)
Egy fore eso bruttó hazai össztermék(2004-ben, EUR-ben)
Kivitel a GDP %-ában (2004)

2002 2003 2004 2005 2006
3.5 2.9 4.0 3.7 3.9
2.8 6.4 8.3 5.0 6.5
8.0 3.0 8.3 6.0 6.5
5.3 4.7 6.8 3.6 3.5
5.8 5.9 6.1 6.1 6.0
–9.3 –5.5 –4.6 –4.0 –3.1
36,821 38,377 44,516 48,350 54,350
39,024 41,275 46,907 50,600 56,850
–7.1 –9.0 –8.9 –8.0 –7.6
2,670 –7 3,392 2,800 2,500
56.6 63.5 70.8 68.7 70.5
243.0 253.5 251.7 – –
258.0 224.4 202.6 – –
13.8 13.6 12.0 – –
7.9 11.8 – – –
IndicatorsGazdasági mutatók
MAGYARORSZÁG
GDP real (yoy, in %)
Industrial output (real, yoy, in %)
Gross fixed capital formation (real, yoy, in %)
Consumer prices (yearly average)
Unemployment (yearly average)
Budget balance (in % of GDP)
Merchandise exports (in EUR mn)
Merchandise imports (in EUR mn)
Current account (in % of GDP)
FDI (inflow, net in EUR mn)
Gross foreign debt (in % of GDP)
Average exchange rate: HUF/EUR
Average exchange rate: HUF/USD
Monetary aggregate M2 (yoy, in %)
3-month yield on government bonds (end of period, in %)
15
Reál bruttó hazai össztermék (év/év, %-ban)
Ipari termelés (reál, év/év, %-ban)
Bruttó felhalmozás (reál, év/év, %-ban)
Fogyasztói árindex (éves átlag)
Munkanélküliségi ráta (éves átlag)
Költségvetési egyenleg (a GDP %-ában)
Áruexport (millió EUR–ben)
Áruimport (millió EUR–ben)
Folyó fizetési mérleg egyenlege (a GDP %-ában)
Külföldi muködotoke (beáramlás, nettó, millió EUR–ben)
Bruttó külföldi adósság (a GDP %-ában)
Átlagos árfolyam: HUF/EUR
Átlagos árfolyam: HUF/USD
M2 monetáris aggregátum változása (év/év, %-ban)
3 hónapos államkötvény hozama (a periódus végén %-ban)
´́ ´́ ´́

Structural IndicatorsStrukturas radıtaji
64,589
2.3
Vaira Vike–Freiberga
Aigars Kalvitis
11.0
4,760
43.8
LATVIA
Gross domestic product by economic sectors (in %) 2004IKP pa sektoriem 2004
Agriculture and forestry Lauksaimniecıba un meÏsaimniecıba 4.1
Industry Rupniecıba 17.4
Construction Celtniecıba 5.8
Services Pakalpojumi 72.7
Area (km2)
Population in mn
President
Prime Minister
GDP (2004 in EUR bn)
Per capita GDP (2004 in EUR)
Exports in % of GDP (2004)
16
HVB BANK LATVIA ASELIZABETES STR. 63LV-1050 RIGALATVIA
WWW.HVB.LVTEL. (+371) 708 5500FAX (+371) 708 5505
¯Platıba (km2)
Iedzıvotaju skaits, milj.
Prezidente
Premjerministrs
IKP (2004, miljardos EUR)
IKP uz vienu iedzıvotaju (2004, EUR)
Eksports % no IKP (2004)
¯ ¯
¯ ¯
¯ ¯
¯ ¯
¯
¯ ¯¯ ¯

2002 2003 2004 2005 2006
6.4 7.5 8.5 7.0 6.5
5.8 6.5 6.0 5.1 5.8
13.0 10.9 16.3 12.5 11.5
1.9 2.9 6.2 4.7 3.1
12.0 10.6 10.4 10.0 9.5
–2.3 –1.6 –1.1 –1.5 –1.4
2,693 2,806 3,366 3,700 4,130
4,255 4,577 5,581 6,190 6,970
–6.7 –8.2 –12.3 –10.3 –8.8
265 235 434 390 360
73.6 80.0 93.2 99.5 104.9
0.58 0.64 0.67 – –
0.62 0.57 0.54 – –
21.0 21.1 24.7 – –
3.8 4.2 4.4 – –
IndicatorsRadıtaji
LATVIJA
GDP real (yoy, in %)
Industrial output (real, yoy, in %)
Gross fixed capital formation (real, yoy, in %)
Consumer prices (yearly average)
Unemployment (yearly average)
Budget balance (in % of GDP)
Merchandise exports (in EUR mn)
Merchandise imports (in EUR mn)
Current account (in % of GDP)
FDI (inflow, net in EUR mn)
Gross foreign debt (in % of GDP)
Average exchange rate: LVL/EUR
Average exchange rate: LVL/USD
Monetary aggregate M2 (yoy, in %)
3-month yield on government bonds (end of period, in %)
17
Realais IKP (salıdzinot ar iepriekÂejo gadu, %)
Rupniecıbas produkcija (reala, salıdzinot ar iepriekÂejo gadu, %)
Kopeja pamatkapitala veidoÂanas(reala, salıdzinot ar iepriekÂejo gadu, %)
Paterina cenas (gada videjas)
Bezdarbs (gada videjais)
BudÏeta atlikums (% no IKP)
Preãu eksports (milj. EUR)
Preãu imports (milj. EUR)
TekoÂais konts (% no IKP)
Arvalstu tieÂas investıcijas (iepludums, neto milj. EUR)
Kopejais arejais parads (% no IKP)
Videjais valutas mainas kurss: LVL /EUR
Videjais valutas mainas kurss: LVL /USD
Naudas lıdzeklu kopums M2 (salıdzinot ar iepriekÂejo gadu, %)
3 meneÂu valsts paradzımju ienesıgums (perioda beigas, %)
¯
¯¯ ¯ ¯
¯ ¯
¯ ¯ ¯ ¯ ¯
¯ ¯ ¯ ¯
¯
¯ ¯ ¯¸
¯ ¯ ¸
¯ ¯ ¸
¯ ¯ ¯ ¯¯
¯¯
¯¸
¯ ¯ ¯

Structural IndicatorsBendrieji rodikliai
65,301
3.5
Valdas Adamkus
Algirdas Brazauskas
17.9
5,220
52.7
LITHUANIA
Gross domestic product by economic sectors (in %) 2004Bendras vidaus produktas pagal ekonominius sektorius 2004
Agriculture and forestry ˚emes ukis ir miÂkininkyste 5.2
Industry Pramone 23.2
Construction Statyba 6.4
Services Paslaugos 65.2
Area (km2)
Population in mn
President
Prime Minister
GDP (2004 in EUR bn)
Per capita GDP (2004 in EUR)
Exports in % of GDP (2004)
18
HVB BANKVILNIUS BRANCHVILNIAUS STR. 35/3LT-01119 VILNIUSLITHUANIA
WWW.HVB.LTTEL. (+370 5) 2745 300FAX (+370 5) 2745 307
Plotas (km2)
Gyventoju skaiãius, mln
Prezidentas
Ministras pirmininkas
Bendras vidaus produktas (BVP, 2004, bil. Euras)
BVP tenkantis 1 gyventojui (2004, Euras)
Eksportas % nuo BVP (2004)
¸
˙ ˙
˙

IndicatorsRodikliai
LIETUVA
GDP real (yoy, in %)
Industrial output (real, yoy, in %)
Gross fixed capital formation (real, yoy, in %)
Consumer prices (yearly average)
Unemployment (yearly average)
Budget balance (in % of GDP)
Merchandise exports (in EUR mn)
Merchandise imports (in EUR mn)
Current account (in % of GDP)
FDI (inflow, net in EUR mn)
Gross foreign debt (in % of GDP)
Average exchange rate: LTL/EUR
Average exchange rate: LTL/USD
Monetary aggregate M2 (yoy, in %)
3-month yield on government bonds (end of period, in %)
19
BVP (metinis, %)
Pramones apimtis (grynas, metinis, %)
Bendro pagrindinio kapitalo sudarymas (grynas, metinis, %)
Vartojimo prekiu kainos (vidutines metines)
Nedarbo lygis (vidutinis metinis)
BiudÏeto balansas (% lyginant su BVP)
Prekiu eksportas (mln. Euras)
Prekiu importas (mln. Euras)
Einamoji saskaita (% lyginant su BVP)
Tiesiogines uÏsienio investicijos (TUI) (grynos iplaukos mln. Euras)
Bendra uÏsienio skola (% nuo BVP)
Vidutinis valiutos kursas: LTL/ Euras
Vidutinis valiutos kursas: LTL/ JAV dol.
Gautos iplaukos M2 (metines, %)
Vyriausybes 3–ju metu obligaciju iÂleidimas (laikotarpio pabaigoje, %)
˙
˙˙¸
¸
¸
¸
˙
¸ ˙
¸ ¸ ¸˙
˜
2002 2003 2004 2005 2006
6.8 9.7 6.7 6.5 6.0
3.1 16.1 10.3 8.3 8.7
12.4 11.4 13.5 11.5 10.5
0.3 –1.2 1.2 2.8 2.4
13.8 12.4 11.5 10.5 10.0
–1.5 –1.9 –2.5 –2.4 –1.9
6,375 6,773 7,451 7,965 8,833
7,785 8,262 9,320 10,137 11,295
–5.2 –6.9 –7.2 –7.8 –7.5
754 126 412 579 637
39.7 41.0 42.8 45.3 46.9
3.5 3.5 3.5 – –
3.6 3.0 2.8 – –
16.9 18.2 24.1 – –
3.5 2.7 2.6 – –

Structural Indicators����������� ������ ��
25,713
2.0
Branko Crvenkovski
Vlado Buckovski
4.3
2,080
32,7
MACEDONIA
Gross domestic product by economic sectors (in %) 2003���� ��$� ����� �� ��� � �� ��� �� ������� ��� �� 2003
Area (km2)
Population in mn
President
Prime Minister
GDP (2004 in EUR bn)
Per capita GDP (2004 in EUR)
Exports in % of GDP (2004)
20
BANK AUSTRIA CREDITANSTALTREPRESENTATIVE OFFICEDIMITRIE CUPOVSKI 4-2/6MK-1000 SKOPJEMACEDONIA
TEL. (+389 2) 3215 130FAX (+389 2) 3215 140
� ������ (�2)
��������� (� ���� ��)
�����������
�������
���� ��$� ����� �� ��� �(2004.�. � ��������� !��6)
���� ��$� ����� �� ��� � � *���� (2004.�. � !��6)
#�� �� (� % �� ���)
Agriculture and forestry 7��� ������ � �������� 11.7
Industry #��������� 23.9
Construction 8���������� 6.1
Services ����*�� ���� ��� 58.3
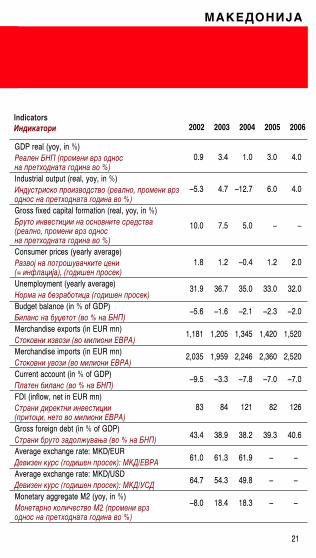
Indicators��������
�� ����
GDP real (yoy, in %)
Industrial output (real, yoy, in %)
Gross fixed capital formation (real, yoy, in %)
Consumer prices (yearly average)
Unemployment (yearly average)
Budget balance (in % of GDP)
Merchandise exports (in EUR mn)
Merchandise imports (in EUR mn)
Current account (in % of GDP)
FDI (inflow, net in EUR mn)
Gross foreign debt (in % of GDP)
Average exchange rate: MKD/EUR
Average exchange rate: MKD/USD
Monetary aggregate M2 (yoy, in %)
21
������ ��� (�� ���� ��� �� ��� ����9 ����� � ���� � %)
#�������� �� ��� ���� (����� , �� ���� ��� �� � �� ����9 ����� � ���� � %)
���� �������$�� �� �� ����� ��������(����� , �� ���� ��� �� ��� ����9 ����� � ���� � %)
���� � �� � �� ����"��� $���(= ��+��$���), (� ����� �� ��)
� ��� �� &����& ��$� (� ����� �� ��)
������ �� &�;�� � (� % �� ���)
�� ��� ��� �� (� ���� �� !��6)
�� ��� �� �� (� ���� �� !��6)
������ &����� (� % �� ���)
������ ������� �������$��(���� $�, ��� � ���� �� !��6)
������ &��� ��� �*���<� (� % �� ���)
3������ ��� (� ����� �� ��): >3/!��6
3������ ��� (� ����� �� ��): >3/��3
������ ��"���� 2 (�� ���� ��� �� � �� ����9 ����� � ���� � %)
2002 2003 2004 2005 2006
0.9 3.4 1.0 3.0 4.0
–5.3 4.7 –12.7 6.0 4.0
10.0 7.5 5.0 – –
1.8 1.2 –0.4 1.2 2.0
31.9 36.7 35.0 33.0 32.0
–5.6 –1.6 –2.1 –2.3 –2.0
1,181 1,205 1,345 1,420 1,520
2,035 1,959 2,246 2,360 2,520
–9.5 –3.3 –7.8 –7.0 –7.0
83 84 121 82 126
43.4 38.9 38.2 39.3 40.6
61.0 61.3 61.9 – –
64.7 54.3 49.8 – –
–8.0 18.4 18.3 – –

Structural IndicatorsWskazniki strukturalne
312,685
38.2
Aleksander Kwasniewski
Marek Belka
194.8
5,100
33.7
POLAND
Gross domestic product by economic sectors (in %) 2003Produkt Krajowy Brutto z podzialem na sektory gospodarki 2003
Agriculture and forestry Rolnictwo i lesnictwo 3.1
Industry Przemysl 24.7
Construction Budownictwo 5.7
Services Uslugi 66.5
Area (km2)
Population in mn
President
Prime Minister
GDP (2004 in EUR bn)
Per capita GDP (2004 in EUR)
Exports in % of GDP (2004)
22
Obszar (km2)
Ludnosã w mln
Prezydent
Premier
Produkt Krajowy Brutto (PKB za rok 2004, w bln EUR)
PKB na jednego mieszkanca (za rok 2004, w EUR)
Udzial eksportu w PKB (2004)–
´
–
–
–
BANK BPHAL. POKOJU 1PL-31548 KRAKÓWPOLAND
WWW.BPH.PLTEL. (+48 12) 618 68 88FAX (+48 12) 618 68 63
´
–
´
ı
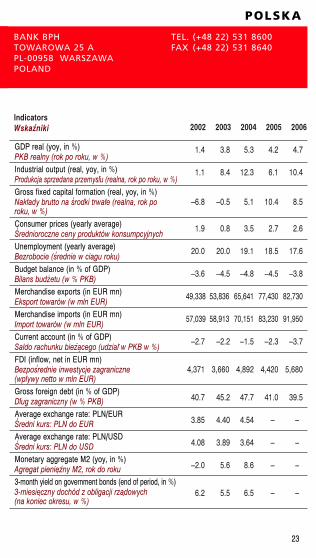
2002 2003 2004 2005 2006
1.4 3.8 5.3 4.2 4.7
1.1 8.4 12.3 6.1 10.4
–6.8 –0.5 5.1 10.4 8.5
1.9 0.8 3.5 2.7 2.6
20.0 20.0 19.1 18.5 17.6
–3.6 –4.5 –4.8 –4.5 –3.8
49,338 53,836 65,641 77,430 82,730
57,039 58,913 70,151 83,230 91,950
–2.7 –2.2 –1.5 –2.3 –3.7
4,371 3,660 4,892 4,420 5,680
40.7 45.2 47.7 41.0 39.5
3.85 4.40 4.54 – –
4.08 3.89 3.64 – –
–2.0 5.6 8.6 – –
6.2 5.5 6.5 – –
IndicatorsWskazniki
POLSKA
23
GDP real (yoy, in %)
Industrial output (real, yoy, in %)
Gross fixed capital formation (real, yoy, in %)
Consumer prices (yearly average)
Unemployment (yearly average)
Budget balance (in % of GDP)
Merchandise exports (in EUR mn)
Merchandise imports (in EUR mn)
Current account (in % of GDP)
FDI (inflow, net in EUR mn)
Gross foreign debt (in % of GDP)
Average exchange rate: PLN/EUR
Average exchange rate: PLN/USD
Monetary aggregate M2 (yoy, in %)
3-month yield on government bonds (end of period, in %)
PKB realny (rok po roku, w %)
Produkcja sprzedana przemyslu (realna, rok po roku, w %)
Naklady brutto na srodki trwale (realna, rok po roku, w %)
Srednioroczne ceny produktów konsumpcyjnych
Bezrobocie (srednie w ciagu roku)
Bilans budzetu (w % PKB)
Eksport towarów (w mln EUR)
Import towarów (w mln EUR)
Saldo rachunku biezacego (udzial w PKB w %)
Bezposrednie inwestycje zagraniczne (wplywy netto w mln EUR)
Dlug zagraniczny (w % PKB)
Sredni kurs: PLN do EUR
Sredni kurs: PLN do USD
Agregat pieniezny M2, rok do roku
3-miesieczny dochód z obligacji rzadowych (na koniec okresu, w %)
–
–
– ––
¸
–
¯
–
––
¸
¸
¸
¸
˙
–
–
˙
˙
´
BANK BPHTOWAROWA 25 APL-00958 WARSZAWAPOLAND
TEL. (+48 22) 531 8600FAX (+48 22) 531 8640

Structural IndicatorsIndicatori de structura
238,391
21.7
Traian Basescu
Calin Popescu-Tariceanu
58.9
2,720
37.1
ROMANIA
Gross domestic product by economic sectors (in %) 2003Produsul Intern Brut si Valoarea Bruta Adaugata pe sectoare 2003
Agriculture and forestry Agricultura si silvicultura 12.9
Industry Industrie 31.4
Construction Constructii 6.3
Services Servicii 49.3
Area (km2)
Population in mn
President
Prime Minister
GDP (2004 in EUR bn)
Per capita GDP (2004 in EUR)
Exports in % of GDP (2004)
24
HVB BANK ROMANIA S.A.CHARLES DE GAULLE SQ. 15 RO-011857 BUCHARESTROMANIA
WWW.HVB.ROTEL. (+40 21) 203 2222FAX (+40 21) 230 8485
ˇ ˇ
ˇ
ˇ ˇ ˇ
Suprafata (km2)
Populatia, ın mil.
Presedinte
Prim Ministru
PIB (2004, ın mrd. EUR)
PIB / cap de locuitor (2004, ın EUR)
Exporturi ın % din PIB (2004)
ˆ
ˆ
ˆ
ˆ
¸
¸
¸
¸
¸
¸

2002 2003 2004 2005 2006
5.0 4.9 8.3 5.7 6.3
6.0 3.2 5.3 6.0 6.5
8.2 9.1 10.1 12.1 13.2
22.5 15.3 11.9 8.5 6.5
10.2 7.6 6.8 6.5 7.0
–2.5 –2.3 –1.1 –1.0 –1.3
14,675 15,614 18,935 21,500 24,500
17,427 19,569 24,258 28,500 33,500
–3.4 –6.1 –7.5 –7.9 –8.5
1,194 1,910 4,042 4,500 5,000
31.2 33.3 33.4 31.6 31.8
31,255 37,556 40,532 – –
33,055 33,200 32,637 – –
38.2 23.3 40.1 – –
20.5 22.5 17.6 – –
IndicatorsIndicatori
ROMANIA
GDP real (yoy, in %)
Industrial output (real, yoy, in %)
Gross fixed capital formation (real, yoy, in %)
Consumer prices (yearly average)
Unemployment (yearly average)
Budget balance (in % of GDP)
Merchandise exports (in EUR mn)
Merchandise imports (in EUR mn)
Current account (in % of GDP)
FDI (inflow, net in EUR mn)
Gross foreign debt (in % of GDP)
Average exchange rate: ROL/EUR
Average exchange rate: ROL/USD
Monetary aggregate M2 (yoy, in %)
3-month yield on government bonds (end of period, in %)
25
PIB real (an curent/an precedent, ın %)
Productia industriala (reala, an curent/an precedent, ın %)
Formarea bruta de capital (reala, an curent/an precedent, ın %)
Preturi de consum (media anuala)
Rata somajului (media anuala)
Soldul balantei (ın % din PIB)
Exportul de bunuri (ın mil. EUR)
Importul de bunuri (ın mil. EUR)
Cont curent (ın % din PIB)
Investitiile straine directe (net ın mil. EUR)
Datoria externa bruta (ın % din PIB)
Cursul mediu de schimb: ROL/EUR
Cursul mediu de schimb: ROL/USD
Masa Monetara M2 (an curent/an precedent, ın %)
Randamentul titlurilor de stat cu maturitate 3 luni (sfarsitul perioadei, ın %)
ˆ
ˆ
ˆ
ˆ
ˆ
ˆ
ˆ
ˆ
ˆ
ˆ
ˇ ˇ
ˇ ˇ
ˇ
ˇ
ˇ
ˇ ˇ
ˇ
ˇ ˆ¸
¸
¸
¸
¸
ˇ
¸
Structural Indicators����������� �������
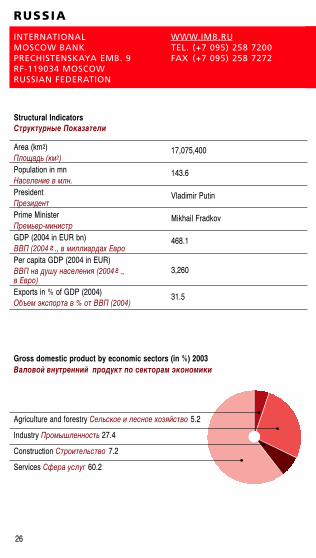
17,075,400
143.6
Vladimir Putin
Mikhail Fradkov
468.1
3,260
31.5
RUSSIA
Gross domestic product by economic sectors (in %) 2003�� � ��������� ������ � ������ �������
Agriculture and forestry ���@� � � ���� � x ��A��� 5.2
Industry �� �B����� ��@ 27.4
Construction ��� ����@��� 7.2
Services �+��� ����� 60.2
Area (km2)
Population in mn
President
Prime Minister
GDP (2004 in EUR bn)
Per capita GDP (2004 in EUR)
Exports in % of GDP (2004)
26
INTERNATIONAL MOSCOW BANKPRECHISTENSKAYA EMB. 9 RF-119034 MOSCOWRUSSIAN FEDERATION
WWW.IMB.RUTEL. (+7 095) 258 7200 FAX (+7 095) 258 7272
�� ���@ (�2)
��������� � ���.
���������
����@��-�������
��� (2004 ., � ���������x !��
��� �� ���� ��������� (2004 .,� !�� )
C&��� D�� ��� � % � ��� (2004)
s
s

2002 2003 2004 2005 2006
4.7 7.3 7.1 6.3 5.4
7.0 7.0 6.1 3.9 4.5
3.0 12.8 10.8 6.5 8.2
15.8 13.6 10.9 12.7 10.9
8.0 8.4 8.0 8.0 8.2
1.0 1.4 4.5 2.0 1.5
113,413 120,012 147,551 176,020 179,610
64,439 66,603 77,460 89,920 106,790
8.4 8.3 10.3 11.3 7.5
3,658 7,026 9,380 7,660 4,560
44.3 42.1 34.9 28.6 24.7
29.7 34.8 35.8 – –
31.4 30.7 28.8 – –
21.1 50.5 38.5 – –
12.7 4.6 4.5 – –
Indicators�������
������
27
GDP real (yoy, in %)
Industrial output (real, yoy, in %)
Gross fixed capital formation (real, yoy, in %)
Consumer prices (yearly average)
Unemployment (yearly average)
Budget balance (in % of GDP)
Merchandise exports (in EUR mn)
Merchandise imports (in EUR mn)
Current account (in % of GDP)
FDI (inflow, net in EUR mn)
Gross foreign debt (in % of GDP)
Average exchange rate: RUB/EUR
Average exchange rate: RUB/USD
Monetary aggregate M2 (yoy, in %)
3-month yield on government bonds (end of period, in %)
����@�BA ��� (� %)
C&��� �� ��� ����� (����@�BA, � %)
#������$�� � �� �� A ������ (����@�BA, � %)
� ���&����@��� $��B (������� �� � �)
�� ���@ &����& ��$B (������A �� � �)
�'�*���BA &����� (� % ���)
C&��� D�� �� � (� ����� ��x !�� )
C&��� ��� �� � (� ����� ��x !�� )
�"�� �����x ����$�A (� % ���)
����B� �� ������B� �������$�� (���� , "���B� � ����� ��x !�� )
C&��� ������� � ��� (� % ���)
������A ��� RUB/EUR
������A ��� RUB/USD
3���*�BA ������� 2 (�� ��$ � ��, � %)
3 x �� ��@ �� 3 ����$� � � �����������B� &����$��� (�� ��� ���� ��, � %)
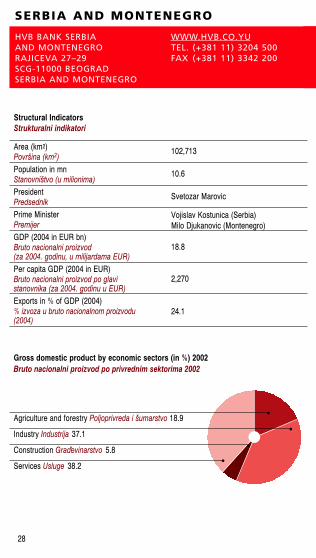
Structural IndicatorsStrukturalni indikatori
102,713
10.6
Svetozar Marovic
Vojislav Kostunica (Serbia)Milo Djukanovic (Montenegro)
18.8
2,270
24.1
HVB BANK SERBIAAND MONTENEGRORAJICEVA 27–29SCG-11000 BEOGRADSERBIA AND MONTENEGRO
SERBIA AND MONTENEGRO
Gross domestic product by economic sectors (in %) 2002Bruto nacionalni proizvod po privrednim sektorima 2002
WWW.HVB.CO.YUTEL. (+381 11) 3204 500 FAX (+381 11) 3342 200
Agriculture and forestry Poljoprivreda i Âumarstvo 18.9
Industry Industrija 37.1
Construction Graêevinarstvo 5.8
Services Usluge 38.2
PovrÂina (km2)
StanovniÂtvo (u milionima)
Predsednik
Premijer
Bruto nacionalni proizvod (za 2004. godinu, u milijardama EUR)
Bruto nacionalni proizvod po glavi stanovnika (za 2004. godinu u EUR)
% izvoza u bruto nacionalnom proizvodu(2004)
Area (km2)
Population in mn
President
Prime Minister
GDP (2004 in EUR bn)
Per capita GDP (2004 in EUR)
Exports in % of GDP (2004)
28

2002 2003 2004 2005 2006
4.0 3.0 7.5 4.0 4.5
1.7 –2.7 7.5 3.5 4.0
– – – – –
21.2 11.3 9.5 14.0 9.0
28.9 34.5 31.7 32.0 31.8
–4.0 –3.4 –2.0 –1.0 –1.0
2,551 2,654 3,296 3,520 4,070
6,684 7,004 9,245 9,150 9,550
–12.9 –12.0 –14.5 –12.4 –11.0
594 1,237 777 1,030 810
76.1 69.7 60.2 54.9 55.0
60.5 65.3 72.8 – –
63.9 57.4 58.6 – –
85.5 12.3 17.4 – –
– 21.9 23.4 – –
IndicatorsIndikatori
SRBIJA I CRNA GORA
Realni bruto nacionalni proizvod (godina za godinu, u %)
Industrijski proizvod (realan, godina za godinom, u %)
Bruto stalna akumulacija kapitala (realna, godina za godinom, u %)
PotroÂaãke cene (godiÂnji prosek)
Nezaposlenost (godiÂnji prosek)
Bilans budÏeta (u % bruto nacionalnog proizvoda)
Izvoz robe (u milionima EUR)
Uvoz robe (u milionima EUR)
Platni bilans (u % bruto nacionalnog proizvoda)
Direktne strane investicije (priliv, neto u milionima EUR)
Bruto inostrani dug (u % bruto nacionalnog proizvoda)
Proseãni kurs razmene: CSD/EUR
Proseãni kurs razmene: CSD/USD
Novãana masa M2 (u %)
Tromeseãni prihod od vladinih obveznica (kraj perioda, u procentima)
GDP real (yoy, in %)
Industrial output (real, yoy, in %)
Gross fixed capital formation
Consumer prices (yearly average)
Unemployment (yearly average)
Budget balance (in % of GDP)
Merchandise exports (in EUR mn)
Merchandise imports (in EUR mn)
Current account (in % of GDP)
FDI (inflow, net in EUR mn)
Gross foreign debt (in % of GDP)
Average exchange rate: CSD/EUR
Average exchange rate: CSD/USD
Monetary aggregate M2 (yoy, in %)
3-month yield on government bonds (end of period, in %)
29
EKSIMBANKATRG NIKOLE PASICA 10SCG-11000 BEOGRADSERBIA AND MONTENEGRO
WWW.EKSIMBANKA.CO.YUTEL. (+381 11) 302 8686 FAX (+381 11) 323 1935

Structural IndicatorsZákladné údaje
49,034
5.4
Ivan GaÂparoviã
Mikulá Dzurinda
33.0
6,140
67.5
SLOVAKIA
Gross domestic product by economic sectors (in %) 2003Hrub˘ domáci produkt a hrubá pridaná hodnota v ekonomick˘ch sektoroch
Agriculture and forestryPol’nohospodárstvo a lesné hospodárstvo 4.0
Industry Priemysel 27.3
Construction Stavebníctvo 5.4
Services SluÏby 63.3
Area (km2)
Population in mn
President
Prime Minister
GDP (2004 in EUR bn)
Per capita GDP (2004 in EUR)
Exports in % of GDP (2004)
30
HVB BANK MOSTOVÁ 6SK-814 16 BRATISLAVA 1SLOVAKIA
WWW.HVB-BANK.SKTEL. (+42 12) 5969 1111FAX (+42 12) 5969 9406
Rozloha (km2)
Obyvatel’stvo (v mil.)
Prezident
Predseda vlády
HDP (2004 v mld. EUR)
HDP (2004 v EUR) na 1 obyvatel’a
V˘voz v % HDP (2004)

2002 2003 2004 2005 2006
4.4 4.2 5.5 4.6 4.8
6.7 5.3 4.2 3.8 6.0
–0.9 –1.2 2.5 9.4 9.1
3.8 8.5 7.5 2.5 2.6
17.8 15.2 14.3 11.8 10.8
–5.7 –3.7 –3.3 –3.2 –2.8
15,184 19,285 22,277 24,680 28,080
17,437 19,848 23,434 26,530 30,630
–8.2 –0.8 –3.5 –3.9 –4.9
4,069 485 890 1,630 2,380
55.7 55.0 55.0 50.0 46.7
42.7 41.5 40.2 – –
45.3 36.8 32.3 – –
4.9 6.0 5.7 – –
5.2 5.7 3.7 – –
IndicatorsUkazovatele
SLOVENSKO
GDP real (yoy, in %)
Industrial output (real, yoy, in %)
Gross fixed capital formation (real, yoy, in %)
Consumer prices (yearly average)
Unemployment (yearly average)
Budget balance (in % of GDP)
Merchandise exports (in EUR mn)
Merchandise imports (in EUR mn)
Current account (in % of GDP)
FDI (inflow, net in EUR mn)
Gross foreign debt (in % of GDP)
Average exchange rate: SKK/EUR
Average exchange rate: SKK/USD
Monetary aggregate M2 (yoy, in %)
3-month yield on government bonds (end of period, in %)
31
Reálny HDP (medziroãne, v %), HDP v stálych cenách
Priemyselná v˘roba (v stálych cenách, medziroãne, v %)
Hrubé hmotné investície (v stálych cenách,medziroãne, v %)
Spotrebitel’ské ceny (roãn˘ priemer)
Nezamestnanost’ (roãn˘ priemer)
Saldo rozpoãtu (v % z HDP)
Export tovarov (v mil. EUR)
Import tovarov (v mil. EUR)
BeÏn˘ úãet platobnej bilancie (v % z HDP)
Priame zahraniãné investície (prílev, netto v mil. EUR)
Celkové zahraniãné zadlÏenie (v % z HDP)
Priemern˘ v˘menn˘ kurz (SKK/EUR)
Priemern˘ v˘menn˘ kurz (SKK/USD)
Menov˘ agregát M2 (medziroãne, v %)
3–mesaãn˘ v˘nos zo Âtátnych dlhopisov (koniec obdobia v %)
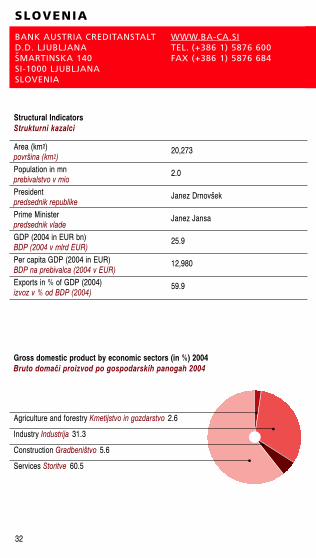
Structural IndicatorsStrukturni kazalci
20,273
2.0
Janez DrnovÂek
Janez Jansa
25.9
12,980
59.9
SLOVENIA
Gross domestic product by economic sectors (in %) 2004Bruto domaãi proizvod po gospodarskih panogah 2004
Agriculture and forestry Kmetijstvo in gozdarstvo 2.6
Industry Industrija 31.3
Construction GradbeniÂtvo 5.6
Services Storitve 60.5
Area (km2)
Population in mn
President
Prime Minister
GDP (2004 in EUR bn)
Per capita GDP (2004 in EUR)
Exports in % of GDP (2004)
32
BANK AUSTRIA CREDITANSTALTD.D. LJUBLJANASMARTINSKA 140SI-1000 LJUBLJANASLOVENIA
WWW.BA-CA.SITEL. (+386 1) 5876 600FAX (+386 1) 5876 684
povrÂina (km2)
prebivalstvo v mio
predsednik republike
predsednik vlade
BDP (2004 v mlrd EUR)
BDP na prebivalca (2004 v EUR)
izvoz v % od BDP (2004)
ˇ
2002 2003 2004 2005 2006
3.4 2.5 4.6 3.8 4.0
2.4 1.4 4.8 4.0 4.5
1.3 5.5 6.8 5.9 5.0
7.5 5.6 3.6 2.7 2.5
6.3 6.7 6.3 6.2 6.1
–2.4 –2.0 –1.9 –1.9 –1.8
11,082 11,414 12,686 13,550 14,650
11,351 11,960 13,403 14,450 15,600
1.5 –0.4 –0.4 –0.7 –0.7
1,582 –115 21 300 300
48.9 52.8 59.2 60.2 59.3
226.2 233.7 238.9 – –
242.7 207.1 192.4 – –
11.0 6.2 8.0 – –
8.7 5.1 3.6 – –
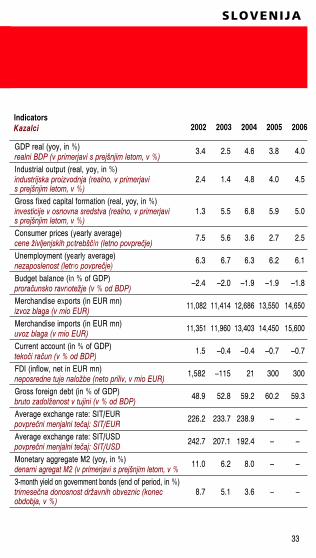
IndicatorsKazalci
SLOVENIJA
GDP real (yoy, in %)
Industrial output (real, yoy, in %)
Gross fixed capital formation (real, yoy, in %)
Consumer prices (yearly average)
Unemployment (yearly average)
Budget balance (in % of GDP)
Merchandise exports (in EUR mn)
Merchandise imports (in EUR mn)
Current account (in % of GDP)
FDI (inflow, net in EUR mn)
Gross foreign debt (in % of GDP)
Average exchange rate: SIT/EUR
Average exchange rate: SIT/USD
Monetary aggregate M2 (yoy, in %)
3-month yield on government bonds (end of period, in %)
33
realni BDP (v primerjavi s prejÂnjim letom, v %)
industrijska proizvodnja (realno, v primerjavi s prejÂnjim letom, v %)
investicije v osnovna sredstva (realno, v primerjavi s prejÂnjim letom, v %)
cene Ïivljenjskih potrebÂãin (letno povpreãje)
nezaposlenost (letno povpreãje)
proraãunsko ravnoteÏje (v % od BDP)
izvoz blaga (v mio EUR)
uvoz blaga (v mio EUR)
tekoãi raãun (v % od BDP)
neposredne tuje naloÏbe (neto priliv, v mio EUR)
bruto zadolÏenost v tujini (v % od BDP)
povpreãni menjalni teãaj: SIT/EUR
povpreãni menjalni teãaj: SIT/USD
denarni agregat M2 (v primerjavi s prejÂnjim letom, v %
trimeseãna donosnost drÏavnih obveznic (konec obdobja, v %)

Structural Indicators���������i �������
603,700
47.6
Victor Yushchenko
Yuliya Tymoshenko
52.4
1,100
51.4
UKRAINE
Gross domestic product by economic sectors (in %) 2003�� �� ���������� ������ � ��������� ������
Agriculture and forestry�E�@�@� � �� ������ �� �E���$�� 12.2
Industry �� ���� �E��@ 31.8
Construction ���E���$�� 4.2
Services � ����� 51.9
Area (km2)
Population in mn
President
Prime Minister
GDP (2004 in EUR bn)
Per capita GDP (2004 in EUR)
Exports in % of GDP (2004)
34
�� �� (�2)
��������� � ���.
���������
�. . ����’F�-E�E���
��� (� 2004 �. � ����. G�� )
��� �� ���� ���������(� 2004 �. � G�� )
!�� ��� � % �E� ��� (2004)
JSCB HVB UKRAINE14-A, YAROSLAVIV VALUA-01034 KYIVUKRAINE
WWW.HVB.COM.UATEL. (+380 44) 230 3300FAX (+380 44) 230 3391

2002 2003 2004 2005 2006
5.2 9.4 12.1 5.0 7.0
7.0 15.7 12.5 6.5 8.0
6.0 15.8 11.4 5.0 13.0
0.8 5.2 9.0 12.0 8.0
10.1 9.1 7.8 7.5 9.0
0.2 0.1 –3.0 –4.5 –4.0
19,732 20,959 26,868 27,570 29,970
18,982 21,197 23,862 25,600 29,090
7.7 5.9 10.4 7.1 4.5
732 1,257 1,378 1,870 3,630
52.4 48.2 47.0 46.8 47.0
5.0 6.0 6.6 – –
5.3 5.3 5.3 – –
42.2 46.9 25.5 – –
9.0 9.0 11.7 – –
Indicators�������
�������
GDP real (yoy, in %)
Industrial output (real, yoy, in %)
Gross fixed capital formation (real, yoy, in %)
Consumer prices (yearly average)
Unemployment (yearly average)
Budget balance (in % of GDP)
Merchandise exports (in EUR mn)
Merchandise imports (in EUR mn)
Current account (in % of GDP)
FDI (inflow, net in EUR mn)
Gross foreign debt (in % of GDP)
Average exchange rate: UAH/EUR
Average exchange rate: UAH/USD
Monetary aggregate M2 (yoy, in %)
3-month yield on government bonds (end of period, in %)
35
��� ������A (��E�� �� �E, � %)
C&��� �� ���� � � �� ��$E� (������A, ��E�� �� �E, � %)
H �������� +E� ��� � ��E����(������A, ��E�� �� �E, � %)
�� *��"E $E�� (������EA �E"��A � ����)
���� &E��� (������EA �E"��A � ����)
������ &'�*��� (� % �E� ���)
!�� �� � ���E� (� ���. G�� )
I�� �� � ���E� (� ���. G�� )
��x�� � � "��x ����$EA (� % �E� ���)
����E E� ����E E������$E� (� ���. G�� )
7 ��E��EA & �� (� % �E� ���)
������EA ��� &�E��: ������/G��
������EA ��� &�E��: ������/� �. �J6
8� � ��A ������� 2 (��E�� �� �E, � %)
�� $����� ����� � 3-�E��"��� ���*����� $E���� ������� (�� E��$@ ���E ��, � %)

36
We invite you to visitBank Austria Creditanstalt’s website:www.ba-ca.com
The economic analyses can also be directly accessed viahttp://economicresearch-e.ba-ca.com
If you would like to receive information on our mostrecent publications by e-mail, please subscribe to thenewsletter BA-CA EconomicNews on the website.