cedar hill isd - grade 9 center - 2008 texas school survey of drug and alcohol use
TRANSCRIPT
8/6/2019 Cedar Hill ISD - Grade 9 Center - 2008 Texas School Survey of Drug and Alcohol Use
http://slidepdf.com/reader/full/cedar-hill-isd-grade-9-center-2008-texas-school-survey-of-drug-and-alcohol 1/60
Cedar Hill ISD - Grade 9 Center
SPRING 2008
Texas School Survey
of Drug and Alcohol Use
2008
Cedar Hill ISD
Campus-Level Analysis
Grade 9 Center
SECONDARY REPORT-PAGE PA

8/6/2019 Cedar Hill ISD - Grade 9 Center - 2008 Texas School Survey of Drug and Alcohol Use
http://slidepdf.com/reader/full/cedar-hill-isd-grade-9-center-2008-texas-school-survey-of-drug-and-alcohol 2/60
Cedar Hill ISD - Grade 9 Center
SPRING 2008
SECONDARY REPORT-PAGE PA
8/6/2019 Cedar Hill ISD - Grade 9 Center - 2008 Texas School Survey of Drug and Alcohol Use
http://slidepdf.com/reader/full/cedar-hill-isd-grade-9-center-2008-texas-school-survey-of-drug-and-alcohol 3/60
Cedar Hill ISD - Grade 9 Center
SPRING 2008
Campus-Level AnalysisSecondary (Grade 9)
Table of Contents
eneral Substance Tables 5-26
TobaccoAlcoholDrugsInhalantsMiscellaneous
revalence Tables 27-42
Selected Substances:
Table B1: All StudentsTable B2: Male StudentsTable B3: Female StudentsTable B4: White StudentsTable B5: African/American StudentsTable B6: Mexican/American StudentsTable B7: Students Reporting A GradesTable B8: Students Reporting Grades Lower Than an ATable B9: Students Living With 2 ParentsTable B10: Students Not Living With 2 ParentsTable B11: Students who would seek help from adultsTable B12: Students who wouldn’t seek help from adultsTable B13 Students Living in Town More Than 3 YearsTable B14: Students Living in Town 3 Years or Less
argin Tables 43-59
SECONDARY REPORT-PAGE PA

8/6/2019 Cedar Hill ISD - Grade 9 Center - 2008 Texas School Survey of Drug and Alcohol Use
http://slidepdf.com/reader/full/cedar-hill-isd-grade-9-center-2008-texas-school-survey-of-drug-and-alcohol 4/60
Cedar Hill ISD - Grade 9 Center
SPRING 2008
SECONDARY REPORT-PAGE PA

8/6/2019 Cedar Hill ISD - Grade 9 Center - 2008 Texas School Survey of Drug and Alcohol Use
http://slidepdf.com/reader/full/cedar-hill-isd-grade-9-center-2008-texas-school-survey-of-drug-and-alcohol 5/60
Cedar Hill ISD - Grade 9 Center
SPRING 2008
1. General Substance Tables
SECONDARY REPORT-PAGE PA

8/6/2019 Cedar Hill ISD - Grade 9 Center - 2008 Texas School Survey of Drug and Alcohol Use
http://slidepdf.com/reader/full/cedar-hill-isd-grade-9-center-2008-texas-school-survey-of-drug-and-alcohol 6/60
Cedar Hill ISD - Grade 9 Center
SPRING 2008
SECONDARY REPORT-PAGE PA

8/6/2019 Cedar Hill ISD - Grade 9 Center - 2008 Texas School Survey of Drug and Alcohol Use
http://slidepdf.com/reader/full/cedar-hill-isd-grade-9-center-2008-texas-school-survey-of-drug-and-alcohol 7/60
Cedar Hill ISD - Grade 9 Center
SPRING 2008
Table T-1: How recently, if ever, have you used ..
Past
Month
School
Year
Ever
Used
Never
Used
Any tobacco product
All 6.7% 8.9% 18.9% 81.1%
CigarettesAll 6.7% 8.3% 17.8% 82.2%
Smokeless tobacco
All 1.7% 2.3% 4.0% 96.0%
Table T-2: How often do you normally use ..
Never
Used
Every
Day
Several
Times a
Week
Several
Times a
Month
About
Once a
Month
About
Once a
Year
Less than
Once a
Year
Any tobacco product?
All 85.1% 1.3% 1.9% 3.9% 3.2% 1.3% 3.2%
Cigarettes?
All 84.7% 0.7% 1.3% 3.3% 5.3% 1.3% 3.3%
Smokeless tobacco?
All 95.4% 0.7% 0.7% 2.0% 0.7% 0.0% 0.7%
Table T-3: Average age of first use of:
All
Cigarettes
12.2Smokeless
tobacco
12.1
Any Tobacco
12.0
SECONDARY REPORT-PAGE PA
8/6/2019 Cedar Hill ISD - Grade 9 Center - 2008 Texas School Survey of Drug and Alcohol Use
http://slidepdf.com/reader/full/cedar-hill-isd-grade-9-center-2008-texas-school-survey-of-drug-and-alcohol 8/60
Cedar Hill ISD - Grade 9 Center
SPRING 2008
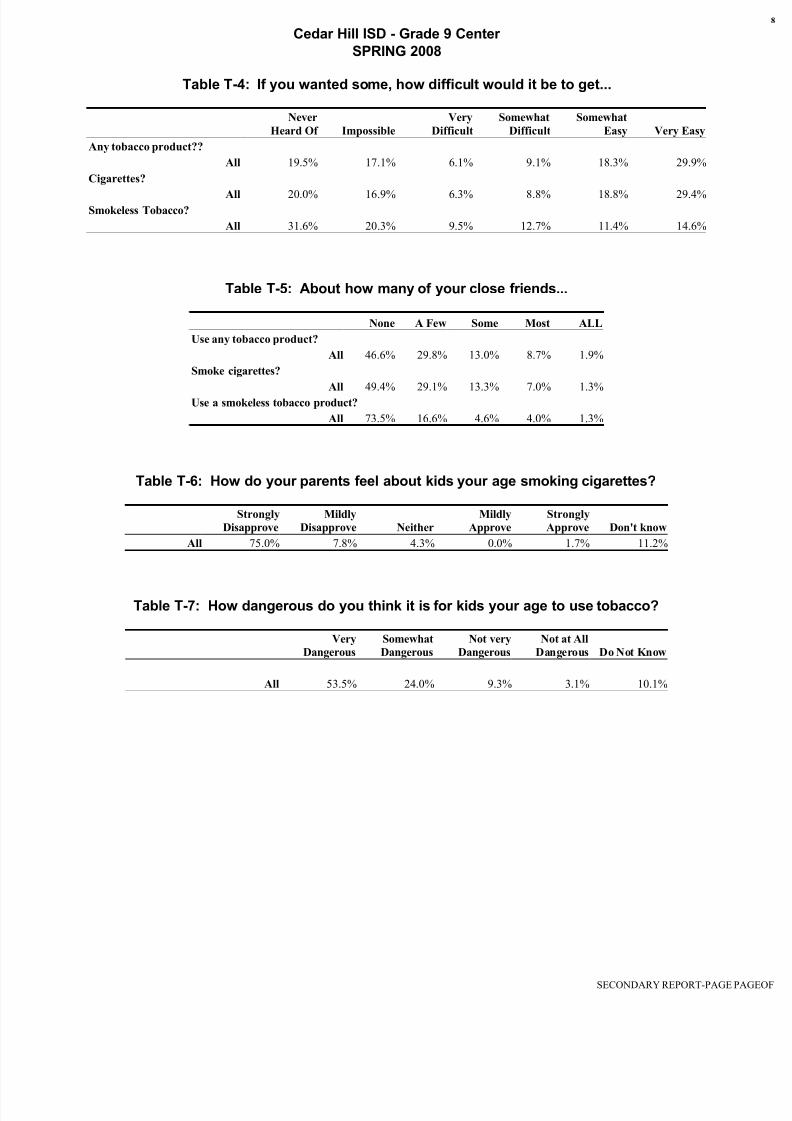
Table T-4: If you wanted some, how difficult would it be to get...
Never
Heard Of Impossible
Very
Difficult
Somewhat
Difficult
Somewhat
Easy Very Easy
Any tobacco product??
All 19.5% 17.1% 6.1% 9.1% 18.3% 29.9%
Cigarettes?
All 20.0% 16.9% 6.3% 8.8% 18.8% 29.4%Smokeless Tobacco?
All 31.6% 20.3% 9.5% 12.7% 11.4% 14.6%
Table T-5: About how many of your close friends...
None A Few Some Most ALL
Use any tobacco product?
All 46.6% 29.8% 13.0% 8.7% 1.9%
Smoke cigarettes?
All 49.4% 29.1% 13.3% 7.0% 1.3%Use a smokeless tobacco product?
All 73.5% 16.6% 4.6% 4.0% 1.3%
Table T-6: How do your parents feel about kids your age smoking cigarettes?
Strongly
Disapprove
Mildly
Disapprove Neither
Mildly
Approve
Strongly
Approve Don't know
All 75.0% 7.8% 4.3% 0.0% 1.7% 11.2%
Table T-7: How dangerous do you think it is for kids your age to use tobacco?
Very
Dangerous
Somewhat
Dangerous
Not very
Dangerous
Not at All
Dangerous Do Not Know
All 53.5% 24.0% 9.3% 3.1% 10.1%
SECONDARY REPORT-PAGE PA
8/6/2019 Cedar Hill ISD - Grade 9 Center - 2008 Texas School Survey of Drug and Alcohol Use
http://slidepdf.com/reader/full/cedar-hill-isd-grade-9-center-2008-texas-school-survey-of-drug-and-alcohol 9/60
Cedar Hill ISD - Grade 9 Center
SPRING 2008
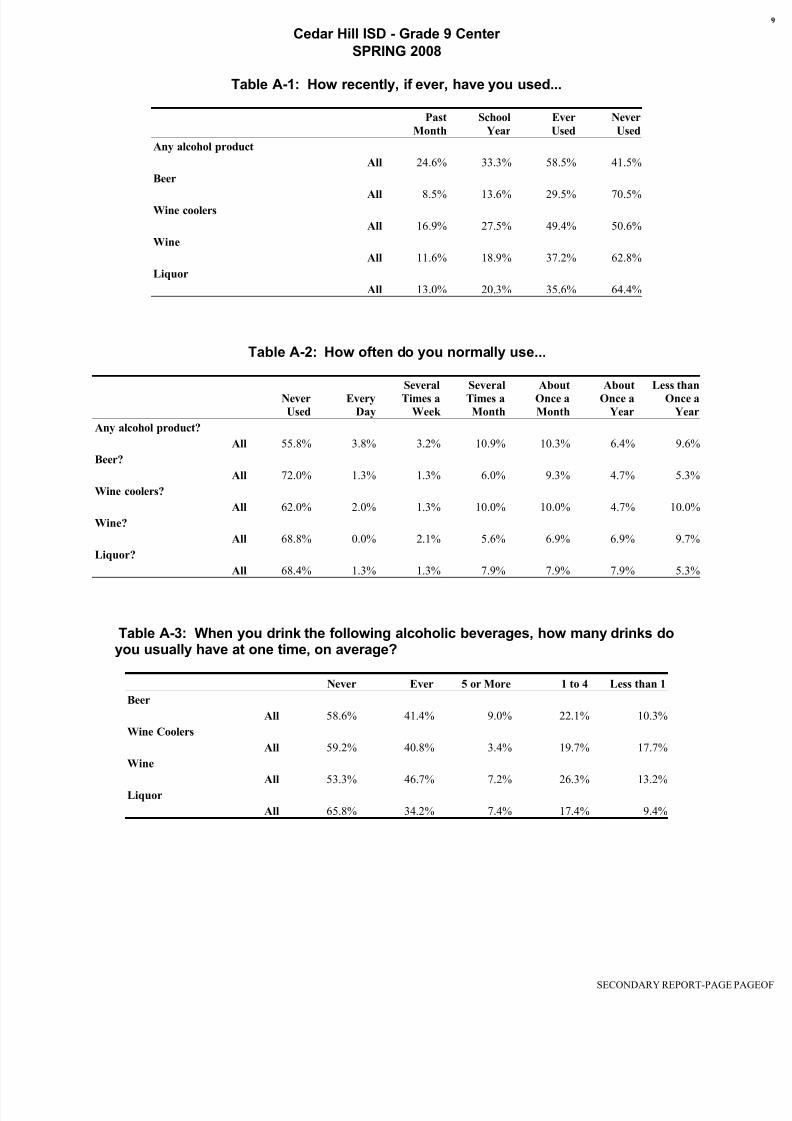
Table A-1: How recently, if ever, have you used...
Past
Month
School
Year
Ever
Used
Never
Used
Any alcohol product
All 24.6% 33.3% 58.5% 41.5%
Beer
All 8.5% 13.6% 29.5% 70.5%Wine coolers
All 16.9% 27.5% 49.4% 50.6%
Wine
All 11.6% 18.9% 37.2% 62.8%
Liquor
All 13.0% 20.3% 35.6% 64.4%
Table A-2: How often do you normally use...
Never
Used
Every
Day
Several
Times a
Week
Several
Times a
Month
About
Once a
Month
About
Once a
Year
Less than
Once a
Year
Any alcohol product?
All 55.8% 3.8% 3.2% 10.9% 10.3% 6.4% 9.6%
Beer?
All 72.0% 1.3% 1.3% 6.0% 9.3% 4.7% 5.3%
Wine coolers?
All 62.0% 2.0% 1.3% 10.0% 10.0% 4.7% 10.0%
Wine?
All 68.8% 0.0% 2.1% 5.6% 6.9% 6.9% 9.7%
Liquor?
All 68.4% 1.3% 1.3% 7.9% 7.9% 7.9% 5.3%
Table A-3: When you drink the following alcoholic beverages, how many drinks doyou usually have at one time, on average?
Never Ever 5 or More 1 to 4 Less than 1
Beer
All 58.6% 41.4% 9.0% 22.1% 10.3%
Wine Coolers
All 59.2% 40.8% 3.4% 19.7% 17.7%
Wine
All 53.3% 46.7% 7.2% 26.3% 13.2%
Liquor
All 65.8% 34.2% 7.4% 17.4% 9.4%
SECONDARY REPORT-PAGE PA

8/6/2019 Cedar Hill ISD - Grade 9 Center - 2008 Texas School Survey of Drug and Alcohol Use
http://slidepdf.com/reader/full/cedar-hill-isd-grade-9-center-2008-texas-school-survey-of-drug-and-alcohol 10/60
Cedar Hill ISD - Grade 9 Center
SPRING 2008
Table A-4: During the past 30 days, on how many days have you had five or moredrinks of alcohol at one time?
Never/None 1 day 2 days 3 to 5 days 6 to 9 days
10 or
more days
Alcohol
All 85.9% 3.2% 3.2% 3.8% 1.3% 2.6%
Table A-5: Average age of first use of:
All
Beer
11.6
Wine Coolers
11.8
Wine
12.2
Liquor12.6
Any Alcohol
11.5
Table A-6: If you wanted some, how difficult would it be to get...
Never
Heard Of Impossible
Very
Difficult
Somewhat
Difficult
Somewhat
Easy Very Easy
Beer?
All 17.8% 14.6% 5.1% 8.3% 22.3% 31.8%
Wine coolers?
All 16.1% 17.4% 3.9% 11.6% 20.6% 30.3%
Wine?
All 18.1% 15.6% 7.5% 13.8% 17.5% 27.5%
Liquor?
All 18.4% 17.1% 5.1% 10.1% 19.6% 29.7%
Any alcohol product?
All 15.1% 12.7% 3.0% 7.8% 21.1% 40.4%
SECONDARY REPORT-PAGE PA

8/6/2019 Cedar Hill ISD - Grade 9 Center - 2008 Texas School Survey of Drug and Alcohol Use
http://slidepdf.com/reader/full/cedar-hill-isd-grade-9-center-2008-texas-school-survey-of-drug-and-alcohol 11/60
Cedar Hill ISD - Grade 9 Center
SPRING 2008
Table A-7: Since school began in the fall, on how many days (if any) have you...
None 1-3 Times 4-9 Times 10+ Times
Attended class while drunk on alcohol?
All 90.4% 6.4% 2.4% 0.8%
Gotten into trouble with teachers because of your drinking?
All 96.8% 0.8% 1.6% 0.8%
Table A-8: School year use of alcohol by absences and conduct problems:
Average days absent due to
illness or other reasons
Alcohol Users: 3.7
Alcohol Non-use 3.5
Average days conduct problems
reported
Alcohol Users: 4.8
Alcohol Non-use 1.5
Table A-9: During the past twelve months, how many times have you...
None 1-3 Times 4-9 Times 10+ Times
Driven a car when you've had a good bit to drink?
All 95.8% 1.7% 0.8% 1.7%
Gotten into trouble with the police because of drinking?
All 95.8% 1.7% 2.5% 0.0%
SECONDARY REPORT-PAGE PA
8/6/2019 Cedar Hill ISD - Grade 9 Center - 2008 Texas School Survey of Drug and Alcohol Use
http://slidepdf.com/reader/full/cedar-hill-isd-grade-9-center-2008-texas-school-survey-of-drug-and-alcohol 12/60
Cedar Hill ISD - Grade 9 Center
SPRING 2008
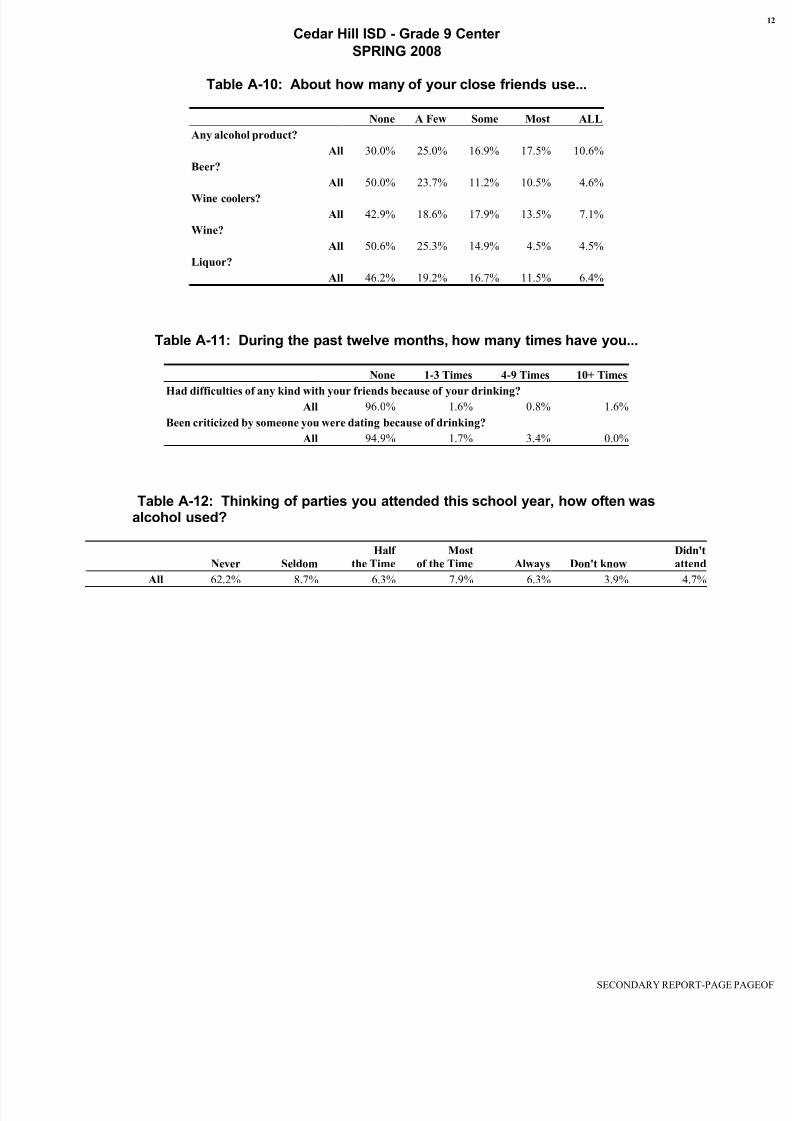
Table A-10: About how many of your close friends use...
None A Few Some Most ALL
Any alcohol product?
All 30.0% 25.0% 16.9% 17.5% 10.6%
Beer?
All 50.0% 23.7% 11.2% 10.5% 4.6%
Wine coolers?
All 42.9% 18.6% 17.9% 13.5% 7.1%
Wine?
All 50.6% 25.3% 14.9% 4.5% 4.5%
Liquor?
All 46.2% 19.2% 16.7% 11.5% 6.4%
Table A-11: During the past twelve months, how many times have you...
None 1-3 Times 4-9 Times 10+ Times
Had difficulties of any kind with your friends because of your drinking?All 96.0% 1.6% 0.8% 1.6%
Been criticized by someone you were dating because of drinking?
All 94.9% 1.7% 3.4% 0.0%
Table A-12: Thinking of parties you attended this school year, how often wasalcohol used?
Never Seldom
Half
the Time
Most
of the Time Always Don't know
Didn't
attend
All 62.2% 8.7% 6.3% 7.9% 6.3% 3.9% 4.7%
SECONDARY REPORT-PAGE PA
8/6/2019 Cedar Hill ISD - Grade 9 Center - 2008 Texas School Survey of Drug and Alcohol Use
http://slidepdf.com/reader/full/cedar-hill-isd-grade-9-center-2008-texas-school-survey-of-drug-and-alcohol 13/60
Cedar Hill ISD - Grade 9 Center
SPRING 2008
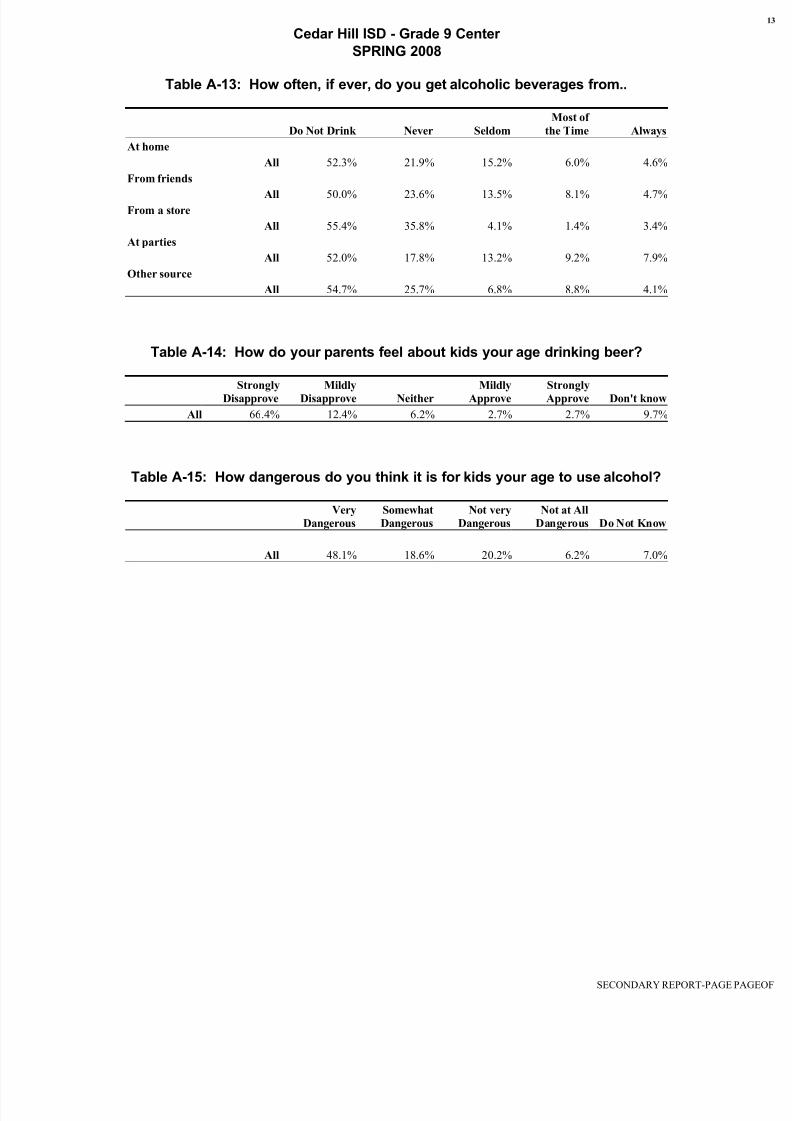
Table A-13: How often, if ever, do you get alcoholic beverages from..
Do Not Drink Never Seldom
Most of
the Time Always
At home
All 52.3% 21.9% 15.2% 6.0% 4.6%
From friends
All 50.0% 23.6% 13.5% 8.1% 4.7%From a store
All 55.4% 35.8% 4.1% 1.4% 3.4%
At parties
All 52.0% 17.8% 13.2% 9.2% 7.9%
Other source
All 54.7% 25.7% 6.8% 8.8% 4.1%
Table A-14: How do your parents feel about kids your age drinking beer?
Strongly
Disapprove
Mildly
Disapprove Neither
Mildly
Approve
Strongly
Approve Don't know
All 66.4% 12.4% 6.2% 2.7% 2.7% 9.7%
Table A-15: How dangerous do you think it is for kids your age to use alcohol?
Very
Dangerous
Somewhat
Dangerous
Not very
Dangerous
Not at All
Dangerous Do Not Know
All 48.1% 18.6% 20.2% 6.2% 7.0%
SECONDARY REPORT-PAGE PA
8/6/2019 Cedar Hill ISD - Grade 9 Center - 2008 Texas School Survey of Drug and Alcohol Use
http://slidepdf.com/reader/full/cedar-hill-isd-grade-9-center-2008-texas-school-survey-of-drug-and-alcohol 14/60
Cedar Hill ISD - Grade 9 Center
SPRING 2008
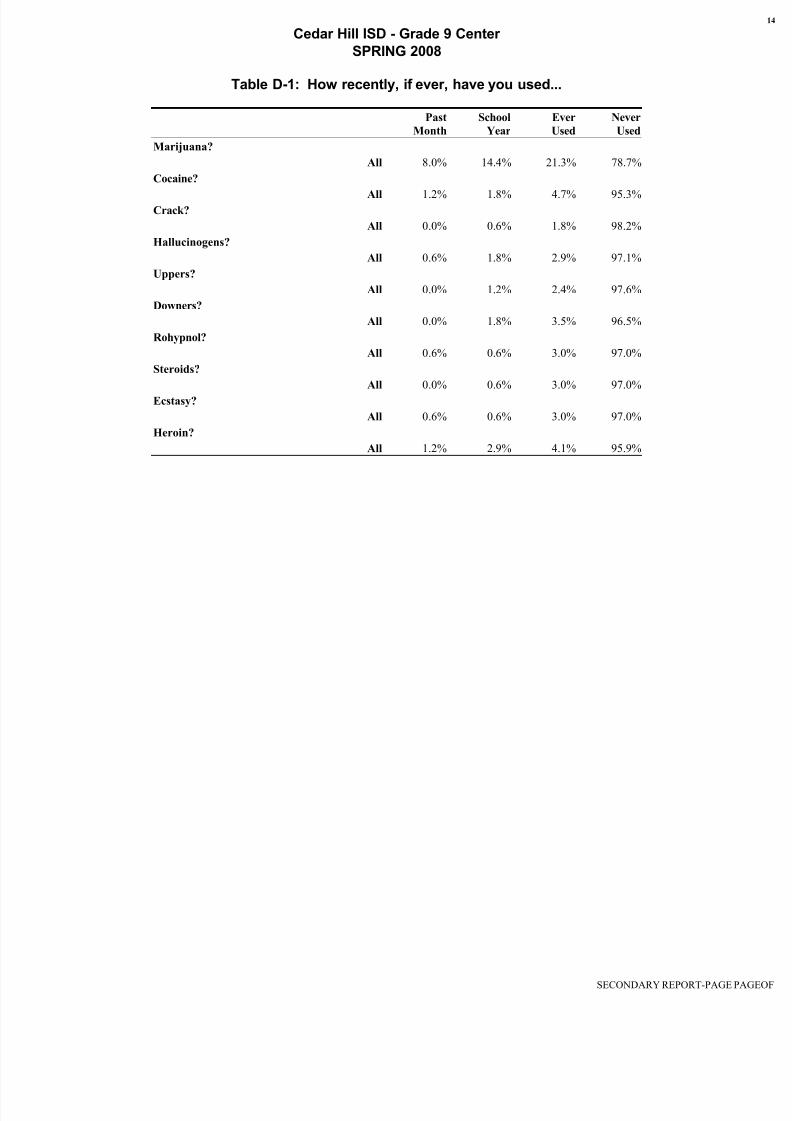
Table D-1: How recently, if ever, have you used...
Past
Month
School
Year
Ever
Used
Never
Used
Marijuana?
All 8.0% 14.4% 21.3% 78.7%
Cocaine?
All 1.2% 1.8% 4.7% 95.3%Crack?
All 0.0% 0.6% 1.8% 98.2%
Hallucinogens?
All 0.6% 1.8% 2.9% 97.1%
Uppers?
All 0.0% 1.2% 2.4% 97.6%
Downers?
All 0.0% 1.8% 3.5% 96.5%
Rohypnol?
All 0.6% 0.6% 3.0% 97.0%
Steroids?
All 0.0% 0.6% 3.0% 97.0%
Ecstasy?
All 0.6% 0.6% 3.0% 97.0%
Heroin?
All 1.2% 2.9% 4.1% 95.9%
SECONDARY REPORT-PAGE PA

8/6/2019 Cedar Hill ISD - Grade 9 Center - 2008 Texas School Survey of Drug and Alcohol Use
http://slidepdf.com/reader/full/cedar-hill-isd-grade-9-center-2008-texas-school-survey-of-drug-and-alcohol 15/60
Cedar Hill ISD - Grade 9 Center
SPRING 2008
Table D-2: How often do you normally use...
Never
Used
Every
Day
Several
Times a
Week
Several
Times a
Month
About
Once a
Month
About
Once a
Year
Less than
Once a
Year
Marijuana?
All 78.3% 3.3% 3.3% 4.6% 3.3% 2.6% 4.6%
Cocaine?All 95.3% 0.7% 0.0% 0.7% 0.0% 0.7% 2.7%
Crack?
All 97.3% 0.0% 0.0% 0.7% 0.0% 0.7% 1.3%
Hallucinogens?
All 96.6% 0.0% 0.0% 0.0% 0.7% 0.7% 2.1%
Uppers?
All 94.6% 0.0% 0.0% 0.7% 0.7% 3.4% 0.7%
Downers?
All 94.7% 0.0% 0.0% 1.3% 0.0% 2.7% 1.3%
Rohypnol?
All 98.6% 0.0% 0.0% 0.0% 0.0% 0.7% 0.7%
Steroids?
All 98.6% 0.0% 0.0% 0.0% 0.7% 0.0% 0.7%
Ecstasy?
All 97.2% 0.0% 0.0% 0.7% 0.7% 0.0% 1.4%
Heroin?
All 95.9% 0.0% 0.7% 0.7% 0.7% 0.7% 1.4%
Table D-3: Average age of first use of:
All
Marijuana
12.6Cocaine
12.9
Crack
13.8
Hallucinogens
13.8
Uppers
13.3
Downers
12.6
Rohypnol
*Steroids
*
Ecstasy
*
Heroin
14.0
SECONDARY REPORT-PAGE PA
8/6/2019 Cedar Hill ISD - Grade 9 Center - 2008 Texas School Survey of Drug and Alcohol Use
http://slidepdf.com/reader/full/cedar-hill-isd-grade-9-center-2008-texas-school-survey-of-drug-and-alcohol 16/60
Cedar Hill ISD - Grade 9 Center
SPRING 2008
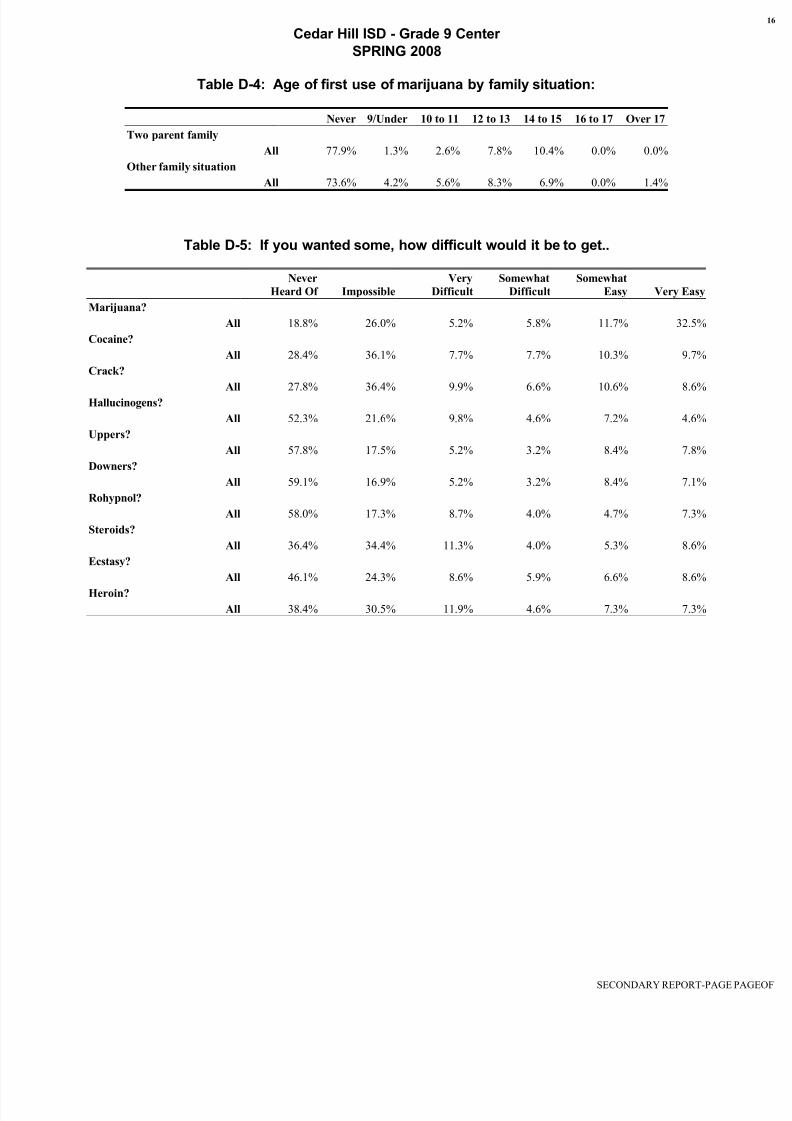
Table D-4: Age of first use of marijuana by family situation:
Never 9/Under 10 to 11 12 to 13 14 to 15 16 to 17 Over 17
Two parent family
All 77.9% 1.3% 2.6% 7.8% 10.4% 0.0% 0.0%
Other family situation
All 73.6% 4.2% 5.6% 8.3% 6.9% 0.0% 1.4%
Table D-5: If you wanted some, how difficult would it be to get..
Never
Heard Of Impossible
Very
Difficult
Somewhat
Difficult
Somewhat
Easy Very Easy
Marijuana?
All 18.8% 26.0% 5.2% 5.8% 11.7% 32.5%
Cocaine?
All 28.4% 36.1% 7.7% 7.7% 10.3% 9.7%
Crack?
All 27.8% 36.4% 9.9% 6.6% 10.6% 8.6%Hallucinogens?
All 52.3% 21.6% 9.8% 4.6% 7.2% 4.6%
Uppers?
All 57.8% 17.5% 5.2% 3.2% 8.4% 7.8%
Downers?
All 59.1% 16.9% 5.2% 3.2% 8.4% 7.1%
Rohypnol?
All 58.0% 17.3% 8.7% 4.0% 4.7% 7.3%
Steroids?
All 36.4% 34.4% 11.3% 4.0% 5.3% 8.6%
Ecstasy?
All 46.1% 24.3% 8.6% 5.9% 6.6% 8.6%
Heroin?
All 38.4% 30.5% 11.9% 4.6% 7.3% 7.3%
SECONDARY REPORT-PAGE PA

8/6/2019 Cedar Hill ISD - Grade 9 Center - 2008 Texas School Survey of Drug and Alcohol Use
http://slidepdf.com/reader/full/cedar-hill-isd-grade-9-center-2008-texas-school-survey-of-drug-and-alcohol 17/60
Cedar Hill ISD - Grade 9 Center
SPRING 2008
Table D-6: Since school began in the fall, on how many days (if any) have you..
None 1-3 Times 4-9 Times 10+ Times
Attended class while high from marijuana use?
All 87.4% 8.7% 2.4% 1.6%
Attended class while high from use of some other drug?
All 90.6% 6.3% 2.3% 0.8%
Gotten into trouble with teachers because of your drug use?
All 94.4% 0.8% 1.6% 3.2%
Table D-7: School year use of marijuana by absences and conduct problems:
Average days absent due to
illness or other reasons
Marijuana Users: 4.2
Marijuana Non-use 3.5
Average days conduct problems
reported
Marijuana Users: 6.7
Marijuana Non-use 2.0
Table D-8: During the past twelve months, how many times have you..
None 1-3 Times 4-9 Times 10+ Times
Driven a car when you've felt high from drugs?
All 93.8% 3.5% 0.0% 2.7%
Gotten into trouble with the police because of drug use?All 95.7% 1.7% 0.9% 1.7%
SECONDARY REPORT-PAGE PA
8/6/2019 Cedar Hill ISD - Grade 9 Center - 2008 Texas School Survey of Drug and Alcohol Use
http://slidepdf.com/reader/full/cedar-hill-isd-grade-9-center-2008-texas-school-survey-of-drug-and-alcohol 18/60
Cedar Hill ISD - Grade 9 Center
SPRING 2008
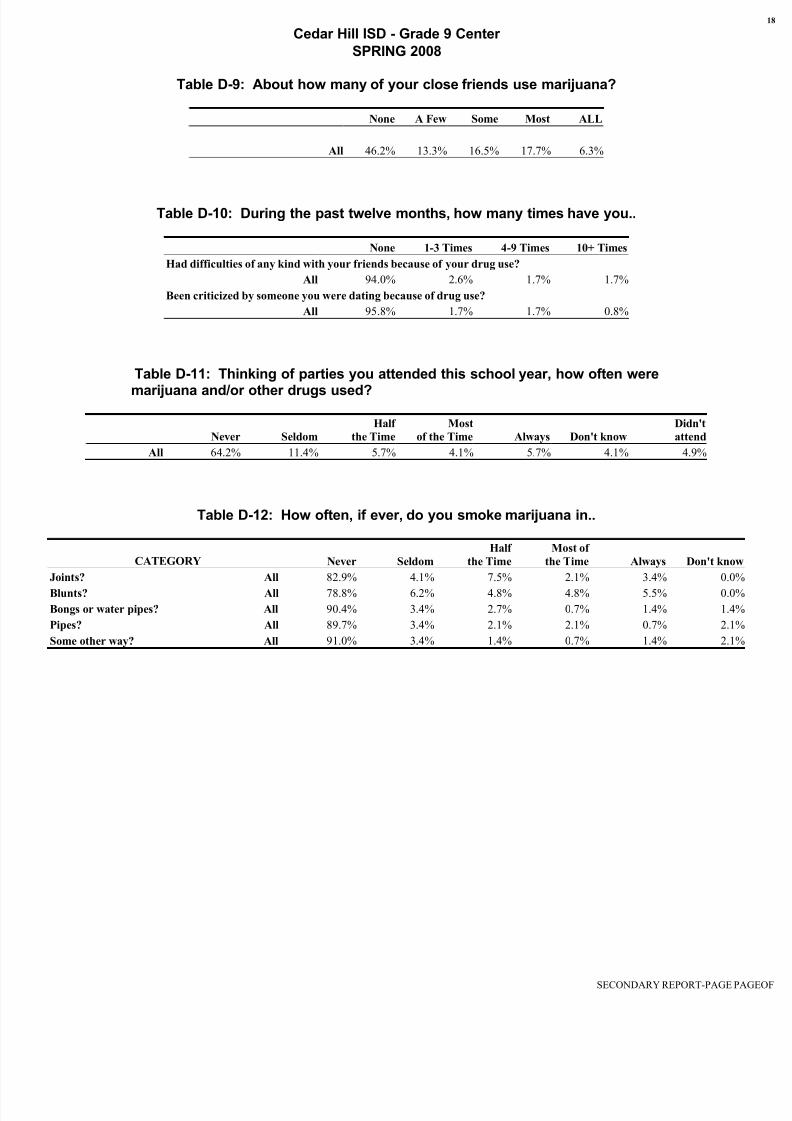
Table D-9: About how many of your close friends use marijuana?
None A Few Some Most ALL
All 46.2% 13.3% 16.5% 17.7% 6.3%
Table D-10: During the past twelve months, how many times have you..
None 1-3 Times 4-9 Times 10+ Times
Had difficulties of any kind with your friends because of your drug use?
All 94.0% 2.6% 1.7% 1.7%
Been criticized by someone you were dating because of drug use?
All 95.8% 1.7% 1.7% 0.8%
Table D-11: Thinking of parties you attended this school year, how often were
marijuana and/or other drugs used?
Never Seldom
Half
the Time
Most
of the Time Always Don't know
Didn't
attend
All 64.2% 11.4% 5.7% 4.1% 5.7% 4.1% 4.9%
Table D-12: How often, if ever, do you smoke marijuana in..
CATEGORY Never Seldom
Half
the Time
Most of
the Time Always Don't know
Joints? All 82.9% 4.1% 7.5% 2.1% 3.4% 0.0%
Blunts? All 78.8% 6.2% 4.8% 4.8% 5.5% 0.0%
Bongs or water pipes? All 90.4% 3.4% 2.7% 0.7% 1.4% 1.4%
Pipes? All 89.7% 3.4% 2.1% 2.1% 0.7% 2.1%
Some other way? All 91.0% 3.4% 1.4% 0.7% 1.4% 2.1%
SECONDARY REPORT-PAGE PA

8/6/2019 Cedar Hill ISD - Grade 9 Center - 2008 Texas School Survey of Drug and Alcohol Use
http://slidepdf.com/reader/full/cedar-hill-isd-grade-9-center-2008-texas-school-survey-of-drug-and-alcohol 19/60
Cedar Hill ISD - Grade 9 Center
SPRING 2008
Table D-13: How do your parents feel about kids your age using marijuana?
Strongly
Disapprove
Mildly
Disapprove Neither
Mildly
Approve
Strongly
Approve Don't know
All 79.5% 4.5% 4.5% 0.9% 1.8% 8.9%
Table D-14: How dangerous do you think it is for kids your age to use...
Very
Dangerous
Somewhat
Dangerous
Not very
Dangerous
Not at All
Dangerous Do Not Know
Marijuana?
All 62.9% 13.7% 12.1% 7.3% 4.0%
Cocaine?
All 84.3% 7.4% 2.5% 0.8% 5.0%
Crack?
All 87.9% 5.6% 1.6% 0.8% 4.0%
Ecstasy?
All 80.3% 8.2% 4.1% 0.8% 6.6%
Steroids?
All 72.6% 15.3% 4.8% 2.4% 4.8%
Heroin?
All 87.2% 4.0% 2.4% 0.8% 5.6%
SECONDARY REPORT-PAGE PA

8/6/2019 Cedar Hill ISD - Grade 9 Center - 2008 Texas School Survey of Drug and Alcohol Use
http://slidepdf.com/reader/full/cedar-hill-isd-grade-9-center-2008-texas-school-survey-of-drug-and-alcohol 20/60
Cedar Hill ISD - Grade 9 Center
SPRING 2008
Table D-15: How recently, if ever, have you taken...
Past
Month
School
Year
Ever
Used
Never
Used
Methamphetamine?
All 0.7% 1.4% 3.5% 96.5%
Table D-16: How recently, if ever, have you used...
Past
Month
School
Year
Ever
Used
Never
Used
Codeine?
All 1.5% 3.6% 5.1% 94.9%
Oxycontin, Percodan or Percocet?
All 1.5% 1.5% 2.3% 97.7%
Vicodin, Lortab or Lorcet?
All 1.5% 3.8% 3.8% 96.2%
Valium or Diazepam?
All 0.7% 3.7% 5.2% 94.8%
Xanax or Alprazolam?
All 5.1% 6.6% 10.9% 89.1%
Table D-17: How recently, if ever, have you taken...
Past
Month
School
Year
Ever
Used
Never
Used
DXM, Triple C?
All 2.2% 3.6% 6.5% 93.5%
SECONDARY REPORT-PAGE PA
8/6/2019 Cedar Hill ISD - Grade 9 Center - 2008 Texas School Survey of Drug and Alcohol Use
http://slidepdf.com/reader/full/cedar-hill-isd-grade-9-center-2008-texas-school-survey-of-drug-and-alcohol 21/60
Cedar Hill ISD - Grade 9 Center
SPRING 2008
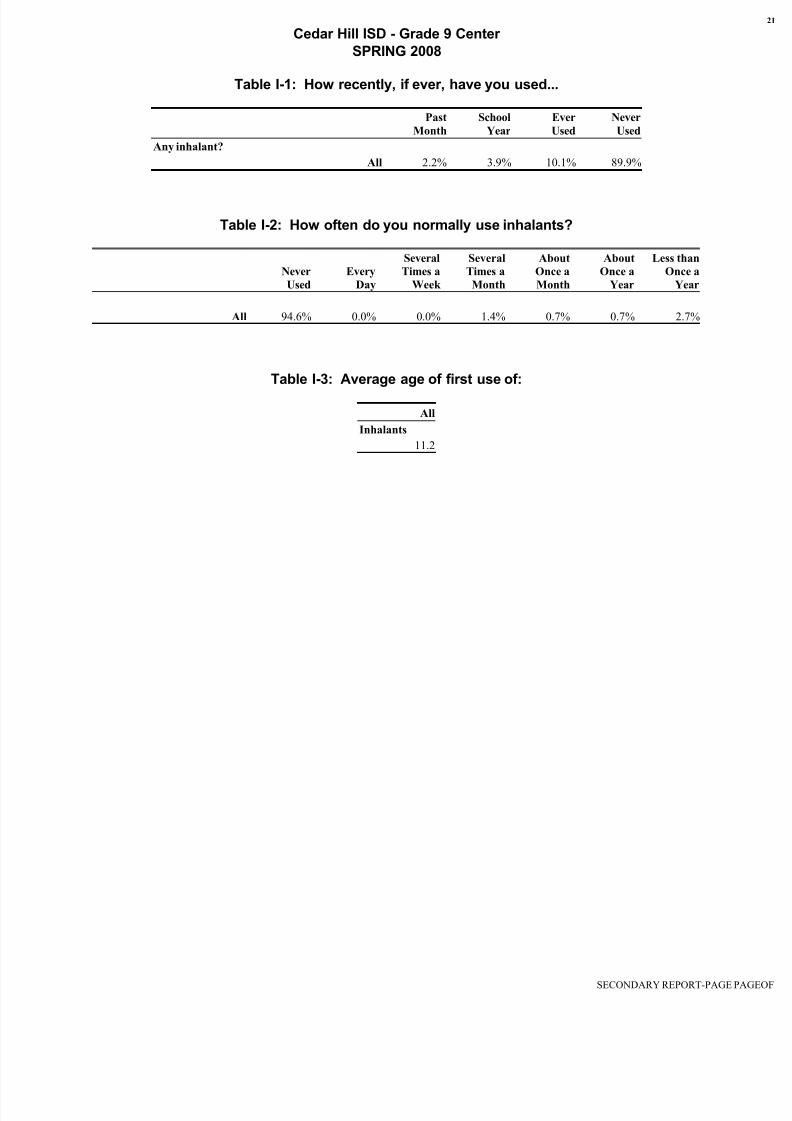
Table I-1: How recently, if ever, have you used...
Past
Month
School
Year
Ever
Used
Never
Used
Any inhalant?
All 2.2% 3.9% 10.1% 89.9%
Table I-2: How often do you normally use inhalants?
Never
Used
Every
Day
Several
Times a
Week
Several
Times a
Month
About
Once a
Month
About
Once a
Year
Less than
Once a
Year
All 94.6% 0.0% 0.0% 1.4% 0.7% 0.7% 2.7%
Table I-3: Average age of first use of:
All
Inhalants
11.2
SECONDARY REPORT-PAGE PA
8/6/2019 Cedar Hill ISD - Grade 9 Center - 2008 Texas School Survey of Drug and Alcohol Use
http://slidepdf.com/reader/full/cedar-hill-isd-grade-9-center-2008-texas-school-survey-of-drug-and-alcohol 22/60
Cedar Hill ISD - Grade 9 Center
SPRING 2008
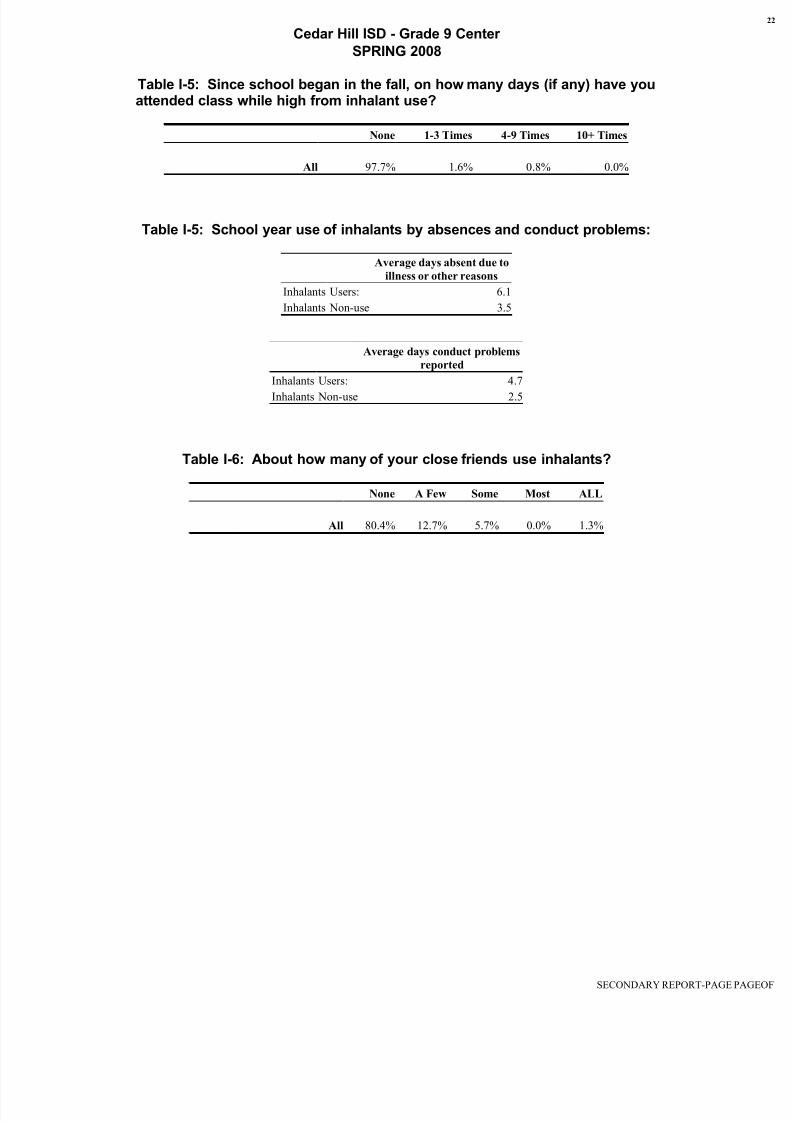
Table I-5: Since school began in the fall, on how many days (if any) have youattended class while high from inhalant use?
None 1-3 Times 4-9 Times 10+ Times
All 97.7% 1.6% 0.8% 0.0%
Table I-5: School year use of inhalants by absences and conduct problems:
Average days absent due to
illness or other reasons
Inhalants Users: 6.1
Inhalants Non-use 3.5
Average days conduct problems
reported
Inhalants Users: 4.7
Inhalants Non-use 2.5
Table I-6: About how many of your close friends use inhalants?
None A Few Some Most ALL
All 80.4% 12.7% 5.7% 0.0% 1.3%
SECONDARY REPORT-PAGE PA

8/6/2019 Cedar Hill ISD - Grade 9 Center - 2008 Texas School Survey of Drug and Alcohol Use
http://slidepdf.com/reader/full/cedar-hill-isd-grade-9-center-2008-texas-school-survey-of-drug-and-alcohol 23/60
Cedar Hill ISD - Grade 9 Center
SPRING 2008
Table I-7: How dangerous do you think it is for kids your age to use inhalants?
Very
Dangerous
Somewhat
Dangerous
Not very
Dangerous
Not at All
Dangerous Do Not Know
All 66.7% 14.5% 7.7% 4.3% 6.8%
Table I-8: If you wanted some, how difficult would it be to get..
Never
Heard Of Impossible
Very
Difficult
Somewhat
Difficult
Somewhat
Easy Very Easy
Inhalants?
All 27.5% 18.1% 5.6% 3.1% 11.3% 34.4%
SECONDARY REPORT-PAGE PA

8/6/2019 Cedar Hill ISD - Grade 9 Center - 2008 Texas School Survey of Drug and Alcohol Use
http://slidepdf.com/reader/full/cedar-hill-isd-grade-9-center-2008-texas-school-survey-of-drug-and-alcohol 24/60
Cedar Hill ISD - Grade 9 Center
SPRING 2008
Table X-1: Since school began in the fall, have you gotten any informationon drugs or alcohol from the following sources?
CATEGORY Yes
A school health class All 42.7%
An assembly program All 60.4%
Guidance counselor All 26.8%
Science class All 29.2%
Social studies class All 16.0%
Student group session All 20.0%
An invited school guest All 46.7%
Another source at school All 35.8%
Any school source All 41.4%
Table X-2: If you had a drug or alcohol problem and needed help, who would you go to?
CATEGORY Yes
A counselor or program in All 36.4%Another adult in school ( All 33.9%
A counselor or program ou All 37.5%
Your parents All 50.0%
A medical doctor All 42.7%
Your friends All 68.9%
Another adult (a relative All 58.1%
Table X-3: Since school began in the fall, have you sought help, other thanfrom family or friends, for problems in any way connected with your use of
alcohol, marijuana, or other drugs?
CATEGORY Yes
Seek Help All 5.8%
SECONDARY REPORT-PAGE PA
8/6/2019 Cedar Hill ISD - Grade 9 Center - 2008 Texas School Survey of Drug and Alcohol Use
http://slidepdf.com/reader/full/cedar-hill-isd-grade-9-center-2008-texas-school-survey-of-drug-and-alcohol 25/60
Cedar Hill ISD - Grade 9 Center
SPRING 2008
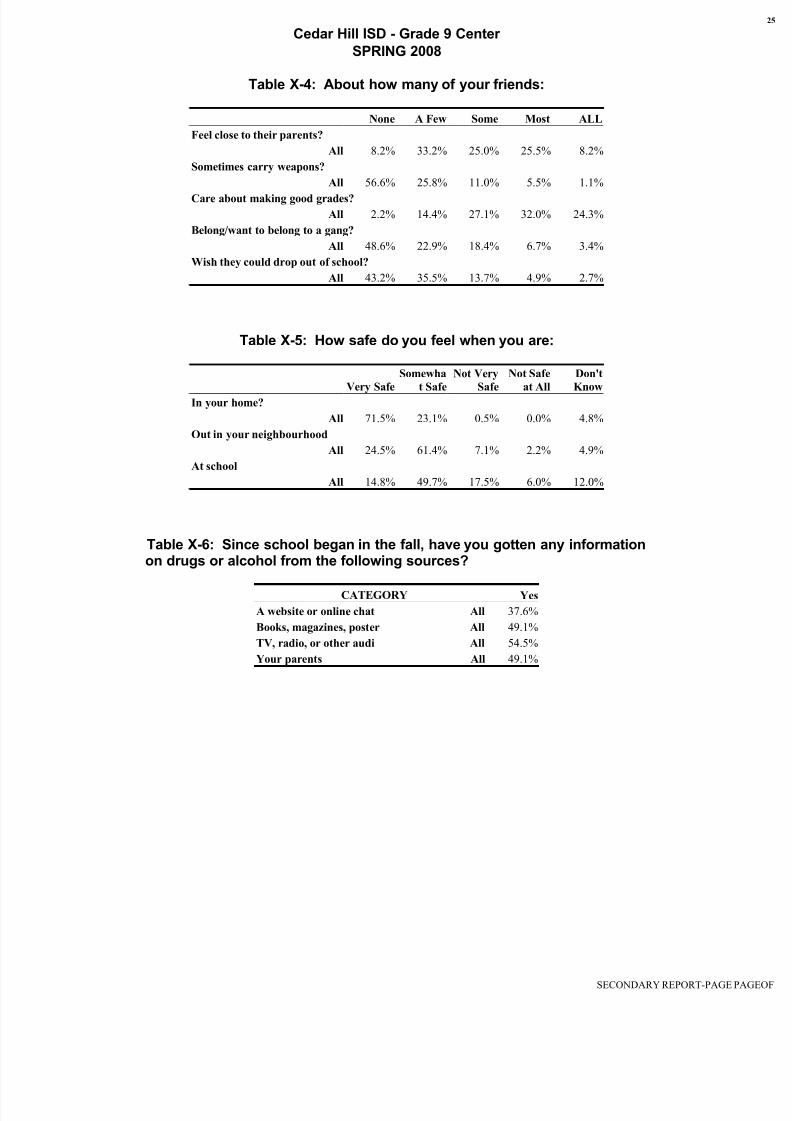
Table X-4: About how many of your friends:
None A Few Some Most ALL
Feel close to their parents?
All 8.2% 33.2% 25.0% 25.5% 8.2%
Sometimes carry weapons?
All 56.6% 25.8% 11.0% 5.5% 1.1%
Care about making good grades?
All 2.2% 14.4% 27.1% 32.0% 24.3%
Belong/want to belong to a gang?
All 48.6% 22.9% 18.4% 6.7% 3.4%
Wish they could drop out of school?
All 43.2% 35.5% 13.7% 4.9% 2.7%
Table X-5: How safe do you feel when you are:
Very Safe
Somewha
t Safe
Not Very
Safe
Not Safe
at All
Don't
KnowIn your home?
All 71.5% 23.1% 0.5% 0.0% 4.8%
Out in your neighbourhood
All 24.5% 61.4% 7.1% 2.2% 4.9%
At school
All 14.8% 49.7% 17.5% 6.0% 12.0%
Table X-6: Since school began in the fall, have you gotten any informationon drugs or alcohol from the following sources?
CATEGORY Yes
A website or online chat All 37.6%
Books, magazines, poster All 49.1%
TV, radio, or other audi All 54.5%
Your parents All 49.1%
SECONDARY REPORT-PAGE PA

8/6/2019 Cedar Hill ISD - Grade 9 Center - 2008 Texas School Survey of Drug and Alcohol Use
http://slidepdf.com/reader/full/cedar-hill-isd-grade-9-center-2008-texas-school-survey-of-drug-and-alcohol 26/60
Cedar Hill ISD - Grade 9 Center
SPRING 2008
SECONDARY REPORT-PAGE PA

8/6/2019 Cedar Hill ISD - Grade 9 Center - 2008 Texas School Survey of Drug and Alcohol Use
http://slidepdf.com/reader/full/cedar-hill-isd-grade-9-center-2008-texas-school-survey-of-drug-and-alcohol 27/60
Cedar Hill ISD - Grade 9 Center
SPRING 2008
2. Prevalence Tables
SECONDARY REPORT-PAGE PA

8/6/2019 Cedar Hill ISD - Grade 9 Center - 2008 Texas School Survey of Drug and Alcohol Use
http://slidepdf.com/reader/full/cedar-hill-isd-grade-9-center-2008-texas-school-survey-of-drug-and-alcohol 28/60
Cedar Hill ISD - Grade 9 Center
SPRING 2008
SECONDARY REPORT-PAGE PA

8/6/2019 Cedar Hill ISD - Grade 9 Center - 2008 Texas School Survey of Drug and Alcohol Use
http://slidepdf.com/reader/full/cedar-hill-isd-grade-9-center-2008-texas-school-survey-of-drug-and-alcohol 29/60
Cedar Hill ISD - Grade 9 Center
SPRING 2008
Table B1: Prevalence and recency of use of selected substances by gradeAll students
Past
Month
School
Year
Ever
Used
Never
Used
Tobacco
All 6.7% 8.9% 18.9% 81.1%
AlcoholAll 24.6% 33.3% 58.5% 41.5%
Inhalants
All 2.2% 3.9% 10.1% 89.9%
Any Illicit Drug
All 9.9% 15.4% 22.5% 77.5%
Marijuana
All 8.0% 14.4% 21.3% 78.7%
Marijuana Only
All 4.2% 6.3% 12.0% 88.0%
Cocaine or Crack
All 1.2% 1.7% 4.6% 95.4%
Cocaine
All 1.2% 1.8% 4.7% 95.3%
Crack
All 0.0% 0.6% 1.8% 98.2%
Hallucinogens
All 0.6% 1.8% 2.9% 97.1%
Uppers
All 0.0% 1.2% 2.4% 97.6%
Downers
All 0.0% 1.8% 3.5% 96.5%
Rohypnol
All 0.6% 0.6% 3.0% 97.0%
Steroids
All 0.0% 0.6% 3.0% 97.0%
Ecstasy
All 0.6% 0.6% 3.0% 97.0%
Heroin
All 1.2% 2.9% 4.1% 95.9%
SECONDARY REPORT-PAGE PA

8/6/2019 Cedar Hill ISD - Grade 9 Center - 2008 Texas School Survey of Drug and Alcohol Use
http://slidepdf.com/reader/full/cedar-hill-isd-grade-9-center-2008-texas-school-survey-of-drug-and-alcohol 30/60
Cedar Hill ISD - Grade 9 Center
SPRING 2008
Table B2: Prevalence and recency of use of selected substances by gradeMale students
Past
Month
School
Year
Ever
Used
Never
Used
Tobacco
All 4.8% 8.4% 18.1% 81.9%
AlcoholAll 22.4% 29.4% 52.9% 47.1%
Inhalants
All 2.5% 2.5% 7.4% 92.6%
Any Illicit Drug
All 9.5% 17.9% 25.0% 75.0%
Marijuana
All 7.6% 16.5% 22.8% 77.2%
Marijuana Only
All 4.4% 7.7% 13.2% 86.8%
Cocaine or Crack
All 0.0% 1.3% 6.4% 93.6%
Cocaine
All 0.0% 1.3% 6.6% 93.4%
Crack
All 0.0% 0.0% 2.6% 97.4%
Hallucinogens
All 0.0% 2.6% 3.9% 96.1%
Uppers
All 0.0% 1.3% 3.9% 96.1%
Downers
All 0.0% 2.6% 6.6% 93.4%
Rohypnol
All 1.3% 1.3% 3.9% 96.1%
Steroids
All 0.0% 1.3% 6.6% 93.4%
Ecstasy
All 0.0% 0.0% 2.6% 97.4%
Heroin
All 1.3% 3.9% 6.6% 93.4%
SECONDARY REPORT-PAGE PA
8/6/2019 Cedar Hill ISD - Grade 9 Center - 2008 Texas School Survey of Drug and Alcohol Use
http://slidepdf.com/reader/full/cedar-hill-isd-grade-9-center-2008-texas-school-survey-of-drug-and-alcohol 31/60
Cedar Hill ISD - Grade 9 Center
SPRING 2008
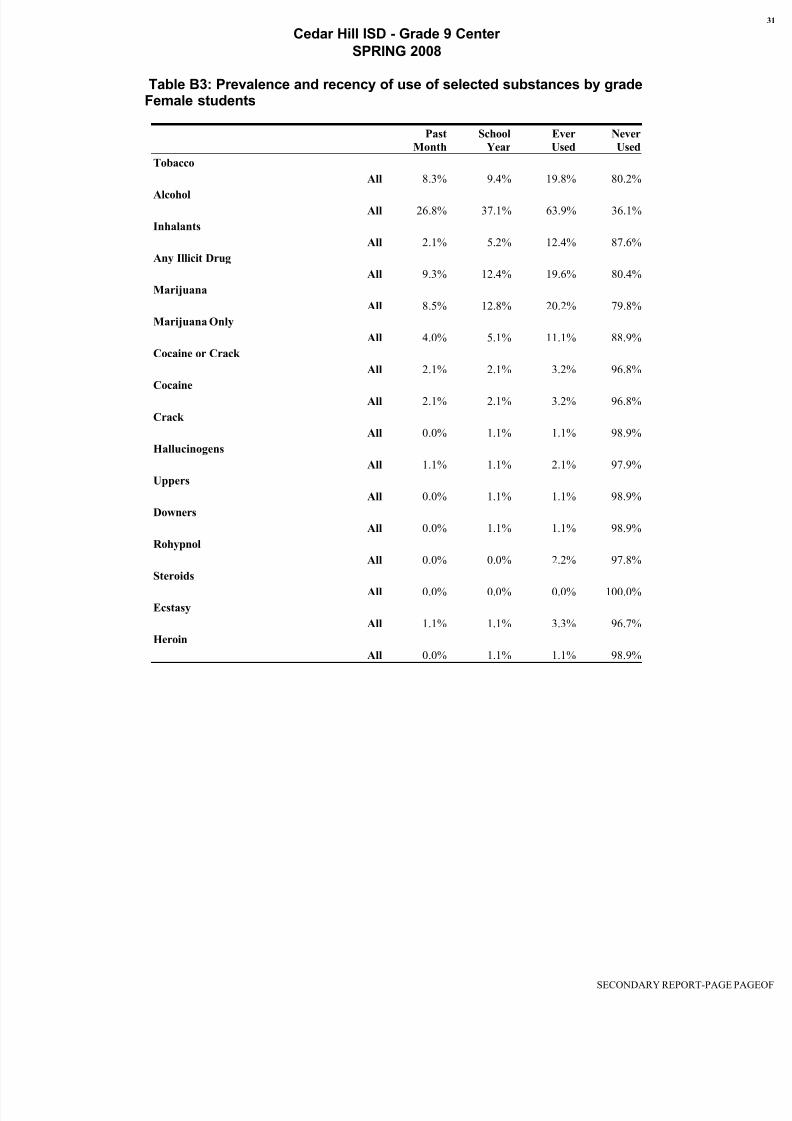
Table B3: Prevalence and recency of use of selected substances by gradeFemale students
Past
Month
School
Year
Ever
Used
Never
Used
Tobacco
All 8.3% 9.4% 19.8% 80.2%
AlcoholAll 26.8% 37.1% 63.9% 36.1%
Inhalants
All 2.1% 5.2% 12.4% 87.6%
Any Illicit Drug
All 9.3% 12.4% 19.6% 80.4%
Marijuana
All 8.5% 12.8% 20.2% 79.8%
Marijuana Only
All 4.0% 5.1% 11.1% 88.9%
Cocaine or Crack
All 2.1% 2.1% 3.2% 96.8%
Cocaine
All 2.1% 2.1% 3.2% 96.8%
Crack
All 0.0% 1.1% 1.1% 98.9%
Hallucinogens
All 1.1% 1.1% 2.1% 97.9%
Uppers
All 0.0% 1.1% 1.1% 98.9%
Downers
All 0.0% 1.1% 1.1% 98.9%
Rohypnol
All 0.0% 0.0% 2.2% 97.8%
Steroids
All 0.0% 0.0% 0.0% 100.0%
Ecstasy
All 1.1% 1.1% 3.3% 96.7%
Heroin
All 0.0% 1.1% 1.1% 98.9%
SECONDARY REPORT-PAGE PA

8/6/2019 Cedar Hill ISD - Grade 9 Center - 2008 Texas School Survey of Drug and Alcohol Use
http://slidepdf.com/reader/full/cedar-hill-isd-grade-9-center-2008-texas-school-survey-of-drug-and-alcohol 32/60

8/6/2019 Cedar Hill ISD - Grade 9 Center - 2008 Texas School Survey of Drug and Alcohol Use
http://slidepdf.com/reader/full/cedar-hill-isd-grade-9-center-2008-texas-school-survey-of-drug-and-alcohol 33/60

8/6/2019 Cedar Hill ISD - Grade 9 Center - 2008 Texas School Survey of Drug and Alcohol Use
http://slidepdf.com/reader/full/cedar-hill-isd-grade-9-center-2008-texas-school-survey-of-drug-and-alcohol 34/60
Cedar Hill ISD - Grade 9 Center
SPRING 2008
Table B6: Prevalence and recency of use of selected substances by gradeMexican/American students
Past
Month
School
Year
Ever
Used
Never
Used
Tobacco
All 17.6% 17.6% 29.4% 70.6%
AlcoholAll 23.5% 32.4% 47.1% 52.9%
Inhalants
All 2.9% 8.8% 14.7% 85.3%
Any Illicit Drug
All 17.6% 23.5% 29.4% 70.6%
Marijuana
All 19.4% 25.8% 29.0% 71.0%
Marijuana Only
All 2.8% 5.6% 5.6% 94.4%
Cocaine or Crack
All 3.1% 3.1% 12.5% 87.5%
Cocaine
All 3.1% 3.1% 12.5% 87.5%
Crack
All 0.0% 0.0% 0.0% 100.0%
Hallucinogens
All 0.0% 0.0% 6.5% 93.5%
Uppers
All 0.0% 0.0% 3.2% 96.8%
Downers
All 0.0% 0.0% 3.2% 96.8%
Rohypnol
All 0.0% 0.0% 6.5% 93.5%
Steroids
All 0.0% 0.0% 0.0% 100.0%
Ecstasy
All 0.0% 0.0% 3.3% 96.7%
Heroin
All 3.2% 3.2% 3.2% 96.8%
SECONDARY REPORT-PAGE PA

8/6/2019 Cedar Hill ISD - Grade 9 Center - 2008 Texas School Survey of Drug and Alcohol Use
http://slidepdf.com/reader/full/cedar-hill-isd-grade-9-center-2008-texas-school-survey-of-drug-and-alcohol 35/60
Cedar Hill ISD - Grade 9 Center
SPRING 2008
Table B7: Prevalence and recency of use of selected substances by gradeStudents reporting A grades
Past
Month
School
Year
Ever
Used
Never
Used
Tobacco
All 4.3% 8.5% 12.8% 87.2%
AlcoholAll 10.6% 21.3% 42.6% 57.4%
Inhalants
All 0.0% 0.0% 4.3% 95.7%
Any Illicit Drug
All 6.4% 8.5% 8.5% 91.5%
Marijuana
All 4.3% 8.7% 8.7% 91.3%
Marijuana Only
All 2.1% 4.3% 4.3% 95.7%
Cocaine or Crack
All 4.3% 4.3% 4.3% 95.7%
Cocaine
All 4.3% 4.3% 4.3% 95.7%
Crack
All 0.0% 2.2% 2.2% 97.8%
Hallucinogens
All 2.2% 2.2% 2.2% 97.8%
Uppers
All 0.0% 2.2% 2.2% 97.8%
Downers
All 0.0% 2.2% 2.2% 97.8%
Rohypnol
All 0.0% 0.0% 0.0% 100.0%
Steroids
All 0.0% 0.0% 2.2% 97.8%
Ecstasy
All 2.2% 2.2% 2.2% 97.8%
Heroin
All 0.0% 2.2% 2.2% 97.8%
SECONDARY REPORT-PAGE PA
8/6/2019 Cedar Hill ISD - Grade 9 Center - 2008 Texas School Survey of Drug and Alcohol Use
http://slidepdf.com/reader/full/cedar-hill-isd-grade-9-center-2008-texas-school-survey-of-drug-and-alcohol 36/60
Cedar Hill ISD - Grade 9 Center
SPRING 2008
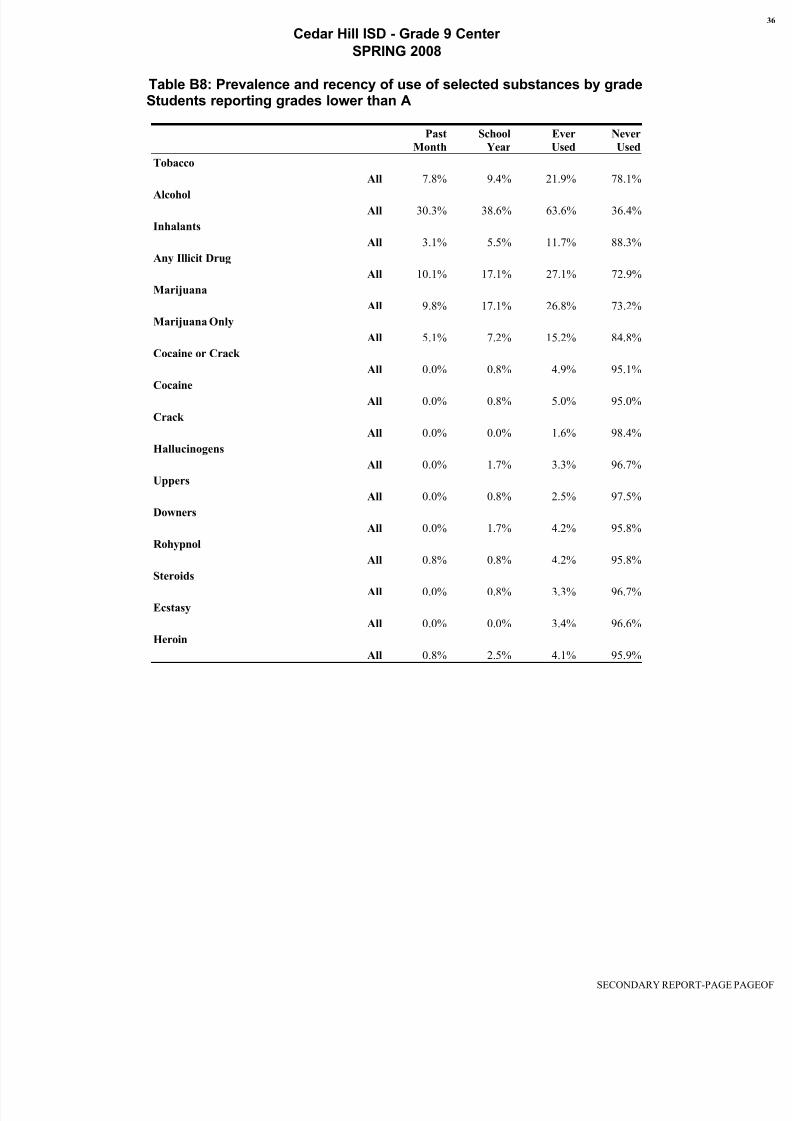
Table B8: Prevalence and recency of use of selected substances by gradeStudents reporting grades lower than A
Past
Month
School
Year
Ever
Used
Never
Used
Tobacco
All 7.8% 9.4% 21.9% 78.1%
AlcoholAll 30.3% 38.6% 63.6% 36.4%
Inhalants
All 3.1% 5.5% 11.7% 88.3%
Any Illicit Drug
All 10.1% 17.1% 27.1% 72.9%
Marijuana
All 9.8% 17.1% 26.8% 73.2%
Marijuana Only
All 5.1% 7.2% 15.2% 84.8%
Cocaine or Crack
All 0.0% 0.8% 4.9% 95.1%
Cocaine
All 0.0% 0.8% 5.0% 95.0%
Crack
All 0.0% 0.0% 1.6% 98.4%
Hallucinogens
All 0.0% 1.7% 3.3% 96.7%
Uppers
All 0.0% 0.8% 2.5% 97.5%
Downers
All 0.0% 1.7% 4.2% 95.8%
Rohypnol
All 0.8% 0.8% 4.2% 95.8%
Steroids
All 0.0% 0.8% 3.3% 96.7%
Ecstasy
All 0.0% 0.0% 3.4% 96.6%
Heroin
All 0.8% 2.5% 4.1% 95.9%
SECONDARY REPORT-PAGE PA

8/6/2019 Cedar Hill ISD - Grade 9 Center - 2008 Texas School Survey of Drug and Alcohol Use
http://slidepdf.com/reader/full/cedar-hill-isd-grade-9-center-2008-texas-school-survey-of-drug-and-alcohol 37/60
Cedar Hill ISD - Grade 9 Center
SPRING 2008
Table B9: Prevalence and recency of use of selected substances by gradeStudents living with two parents
Past
Month
School
Year
Ever
Used
Never
Used
Tobacco
All 9.0% 10.1% 14.6% 85.4%
AlcoholAll 18.9% 26.7% 50.0% 50.0%
Inhalants
All 3.4% 5.7% 11.4% 88.6%
Any Illicit Drug
All 8.9% 15.6% 22.2% 77.8%
Marijuana
All 8.1% 15.1% 20.9% 79.1%
Marijuana Only
All 3.2% 5.4% 10.8% 89.2%
Cocaine or Crack
All 0.0% 0.0% 3.5% 96.5%
Cocaine
All 0.0% 0.0% 3.5% 96.5%
Crack
All 0.0% 0.0% 1.2% 98.8%
Hallucinogens
All 0.0% 2.4% 4.7% 95.3%
Uppers
All 0.0% 1.2% 2.3% 97.7%
Downers
All 0.0% 1.2% 2.4% 97.6%
Rohypnol
All 0.0% 0.0% 3.6% 96.4%
Steroids
All 0.0% 0.0% 1.2% 98.8%
Ecstasy
All 0.0% 0.0% 2.4% 97.6%
Heroin
All 2.3% 3.5% 4.7% 95.3%
SECONDARY REPORT-PAGE PA

8/6/2019 Cedar Hill ISD - Grade 9 Center - 2008 Texas School Survey of Drug and Alcohol Use
http://slidepdf.com/reader/full/cedar-hill-isd-grade-9-center-2008-texas-school-survey-of-drug-and-alcohol 38/60
8/6/2019 Cedar Hill ISD - Grade 9 Center - 2008 Texas School Survey of Drug and Alcohol Use
http://slidepdf.com/reader/full/cedar-hill-isd-grade-9-center-2008-texas-school-survey-of-drug-and-alcohol 39/60
Cedar Hill ISD - Grade 9 Center
SPRING 2008
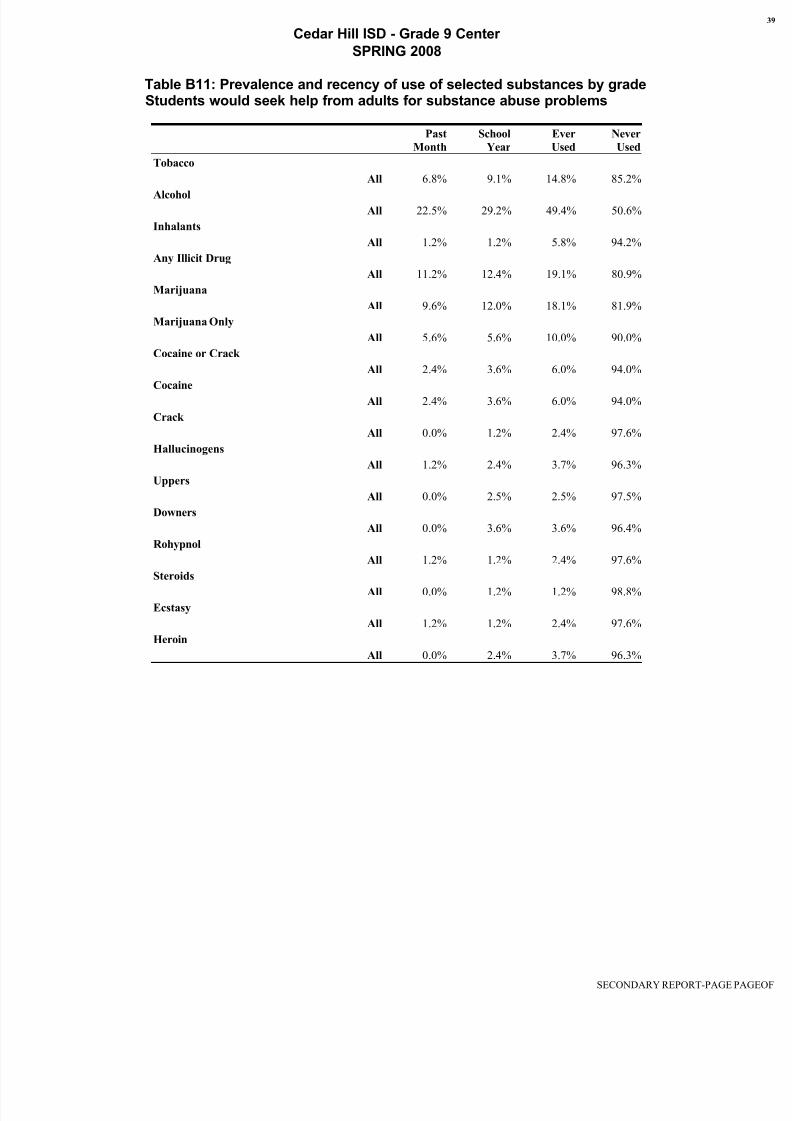
Table B11: Prevalence and recency of use of selected substances by gradeStudents would seek help from adults for substance abuse problems
Past
Month
School
Year
Ever
Used
Never
Used
Tobacco
All 6.8% 9.1% 14.8% 85.2%
AlcoholAll 22.5% 29.2% 49.4% 50.6%
Inhalants
All 1.2% 1.2% 5.8% 94.2%
Any Illicit Drug
All 11.2% 12.4% 19.1% 80.9%
Marijuana
All 9.6% 12.0% 18.1% 81.9%
Marijuana Only
All 5.6% 5.6% 10.0% 90.0%
Cocaine or Crack
All 2.4% 3.6% 6.0% 94.0%
Cocaine
All 2.4% 3.6% 6.0% 94.0%
Crack
All 0.0% 1.2% 2.4% 97.6%
Hallucinogens
All 1.2% 2.4% 3.7% 96.3%
Uppers
All 0.0% 2.5% 2.5% 97.5%
Downers
All 0.0% 3.6% 3.6% 96.4%
Rohypnol
All 1.2% 1.2% 2.4% 97.6%
Steroids
All 0.0% 1.2% 1.2% 98.8%
Ecstasy
All 1.2% 1.2% 2.4% 97.6%
Heroin
All 0.0% 2.4% 3.7% 96.3%
SECONDARY REPORT-PAGE PA

8/6/2019 Cedar Hill ISD - Grade 9 Center - 2008 Texas School Survey of Drug and Alcohol Use
http://slidepdf.com/reader/full/cedar-hill-isd-grade-9-center-2008-texas-school-survey-of-drug-and-alcohol 40/60
Cedar Hill ISD - Grade 9 Center
SPRING 2008
Table B12: Prevalence and recency of use of selected substances by gradeStudents wouldn''t seek help from adults for substance abuse problems
Past
Month
School
Year
Ever
Used
Never
Used
Tobacco
All 12.5% 12.5% 25.0% 75.0%
AlcoholAll 17.6% 29.4% 52.9% 47.1%
Inhalants
All 2.9% 8.8% 14.7% 85.3%
Any Illicit Drug
All 8.8% 17.6% 23.5% 76.5%
Marijuana
All 9.1% 18.2% 24.2% 75.8%
Marijuana Only
All 2.9% 5.9% 11.8% 88.2%
Cocaine or Crack
All 0.0% 0.0% 3.0% 97.0%
Cocaine
All 0.0% 0.0% 3.1% 96.9%
Crack
All 0.0% 0.0% 0.0% 100.0%
Hallucinogens
All 0.0% 0.0% 0.0% 100.0%
Uppers
All 0.0% 0.0% 0.0% 100.0%
Downers
All 0.0% 0.0% 3.1% 96.9%
Rohypnol
All 0.0% 0.0% 9.4% 90.6%
Steroids
All 0.0% 0.0% 3.0% 97.0%
Ecstasy
All 0.0% 0.0% 3.1% 96.9%
Heroin
All 3.0% 3.0% 6.1% 93.9%
SECONDARY REPORT-PAGE PA
8/6/2019 Cedar Hill ISD - Grade 9 Center - 2008 Texas School Survey of Drug and Alcohol Use
http://slidepdf.com/reader/full/cedar-hill-isd-grade-9-center-2008-texas-school-survey-of-drug-and-alcohol 41/60
Cedar Hill ISD - Grade 9 Center
SPRING 2008
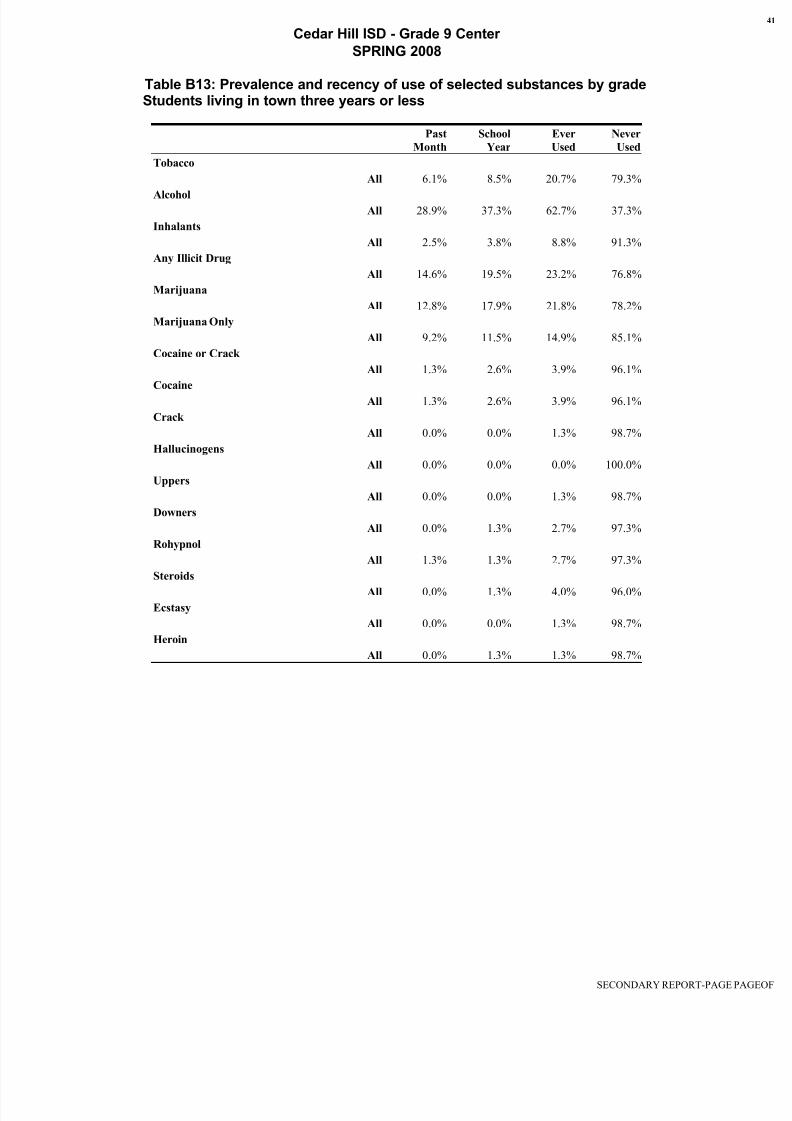
Table B13: Prevalence and recency of use of selected substances by gradeStudents living in town three years or less
Past
Month
School
Year
Ever
Used
Never
Used
Tobacco
All 6.1% 8.5% 20.7% 79.3%
AlcoholAll 28.9% 37.3% 62.7% 37.3%
Inhalants
All 2.5% 3.8% 8.8% 91.3%
Any Illicit Drug
All 14.6% 19.5% 23.2% 76.8%
Marijuana
All 12.8% 17.9% 21.8% 78.2%
Marijuana Only
All 9.2% 11.5% 14.9% 85.1%
Cocaine or Crack
All 1.3% 2.6% 3.9% 96.1%
Cocaine
All 1.3% 2.6% 3.9% 96.1%
Crack
All 0.0% 0.0% 1.3% 98.7%
Hallucinogens
All 0.0% 0.0% 0.0% 100.0%
Uppers
All 0.0% 0.0% 1.3% 98.7%
Downers
All 0.0% 1.3% 2.7% 97.3%
Rohypnol
All 1.3% 1.3% 2.7% 97.3%
Steroids
All 0.0% 1.3% 4.0% 96.0%
Ecstasy
All 0.0% 0.0% 1.3% 98.7%
Heroin
All 0.0% 1.3% 1.3% 98.7%
SECONDARY REPORT-PAGE PA

8/6/2019 Cedar Hill ISD - Grade 9 Center - 2008 Texas School Survey of Drug and Alcohol Use
http://slidepdf.com/reader/full/cedar-hill-isd-grade-9-center-2008-texas-school-survey-of-drug-and-alcohol 42/60
Cedar Hill ISD - Grade 9 Center
SPRING 2008
Table B14: Prevalence and recency of use of selected substances by gradeStudents living in town more than three years
Past
Month
School
Year
Ever
Used
Never
Used
Tobacco
All 6.4% 8.5% 16.0% 84.0%
AlcoholAll 20.2% 28.7% 55.3% 44.7%
Inhalants
All 2.1% 3.2% 9.6% 90.4%
Any Illicit Drug
All 4.3% 9.6% 19.1% 80.9%
Marijuana
All 3.3% 9.9% 18.7% 81.3%
Marijuana Only
All 0.0% 2.0% 9.2% 90.8%
Cocaine or Crack
All 1.1% 1.1% 5.4% 94.6%
Cocaine
All 1.1% 1.1% 5.4% 94.6%
Crack
All 0.0% 1.1% 2.2% 97.8%
Hallucinogens
All 1.1% 3.3% 5.5% 94.5%
Uppers
All 0.0% 2.2% 3.3% 96.7%
Downers
All 0.0% 2.2% 3.3% 96.7%
Rohypnol
All 0.0% 0.0% 1.1% 98.9%
Steroids
All 0.0% 0.0% 1.1% 98.9%
Ecstasy
All 1.1% 1.1% 3.3% 96.7%
Heroin
All 1.1% 3.3% 4.4% 95.6%
SECONDARY REPORT-PAGE PA

8/6/2019 Cedar Hill ISD - Grade 9 Center - 2008 Texas School Survey of Drug and Alcohol Use
http://slidepdf.com/reader/full/cedar-hill-isd-grade-9-center-2008-texas-school-survey-of-drug-and-alcohol 43/60
Cedar Hill ISD - Grade 9 Center
SPRING 2008
3. Margin Tables
SECONDARY REPORT-PAGE PA
8/6/2019 Cedar Hill ISD - Grade 9 Center - 2008 Texas School Survey of Drug and Alcohol Use
http://slidepdf.com/reader/full/cedar-hill-isd-grade-9-center-2008-texas-school-survey-of-drug-and-alcohol 44/60
Cedar Hill ISD - Grade 9 Center
SPRING 2008
SECONDARY REPORT-PAGE PA
8/6/2019 Cedar Hill ISD - Grade 9 Center - 2008 Texas School Survey of Drug and Alcohol Use
http://slidepdf.com/reader/full/cedar-hill-isd-grade-9-center-2008-texas-school-survey-of-drug-and-alcohol 45/60
Cedar Hill ISD - Grade 9 Center
Spring 2008
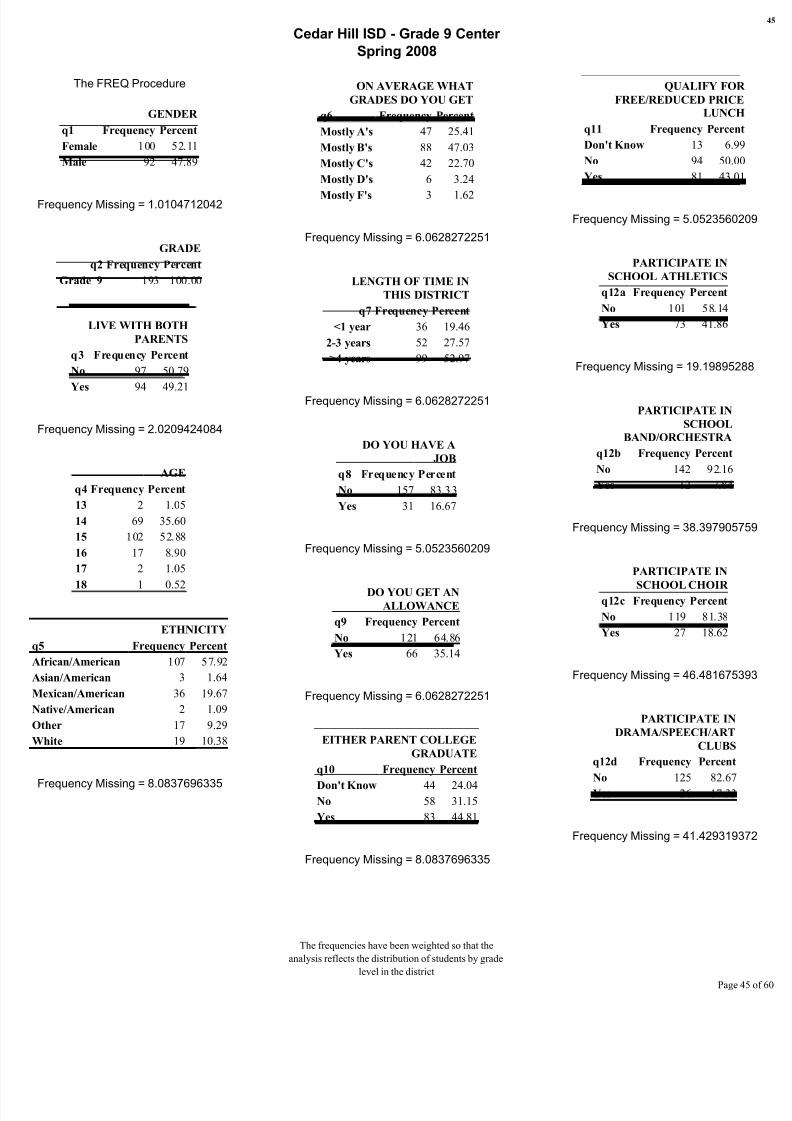
The FREQ Procedure
GENDER
q1 Frequency Percent
Female 100 52.11
Male 92 47.89
Frequency Missing = 1.0104712042
GRADE
q2 Frequency Percent
Grade 9 193 100.00
LIVE WITH BOTH
PARENTS
q3 Frequency Percent
No 97 50.79
Yes 94 49.21
Frequency Missing = 2.0209424084
AGE
q4 Frequency Percent
13 2 1.05
14 69 35.60
15 102 52.88
16 17 8.90
17 2 1.05
18 1 0.52
ETHNICITY
q5 Frequency Percent
African/American 107 57.92
Asian/American 3 1.64
Mexican/American 36 19.67
Native/American 2 1.09
Other 17 9.29
White 19 10.38
Frequency Missing = 8.0837696335
ON AVERAGE WHAT
GRADES DO YOU GET
q6 Frequency Percent
Mostly A's 47 25.41
Mostly B's 88 47.03
Mostly C's 42 22.70
Mostly D's 6 3.24
Mostly F's 3 1.62
Frequency Missing = 6.0628272251
LENGTH OF TIME IN
THIS DISTRICT
q7 Frequency Percent
<1 year 36 19.46
2-3 years 52 27.57
>4 years 99 52.97
Frequency Missing = 6.0628272251
DO YOU HAVE A
JOB
q8 Frequency Percent
No 157 83.33
Yes 31 16.67
Frequency Missing = 5.0523560209
DO YOU GET ANALLOWANCE
q9 Frequency Percent
No 121 64.86
Yes 66 35.14
Frequency Missing = 6.0628272251
EITHER PARENT COLLEGE
GRADUATE
q10 Frequency Percent
Don't Know 44 24.04No 58 31.15
Yes 83 44.81
Frequency Missing = 8.0837696335
QUALIFY FOR
FREE/REDUCED PRICE
LUNCH
q11 Frequency Percen
Don't Know 13 6.99
No 94 50.00
Yes 81 43.0
Frequency Missing = 5.05235602
PARTICIPATE IN
SCHOOL ATHLETICS
q12a Frequency Percent
No 101 58.14
Yes 73 41.86
Frequency Missing = 19.198952
PARTICIPATE IN
SCHOOL
BAND/ORCHESTRA
q12b Frequency Percent
No 142 92.16
Yes 12 7.84
Frequency Missing = 38.3979057
PARTICIPATE IN
SCHOOL CHOIR q12c Frequency Percent
No 119 81.38
Yes 27 18.62
Frequency Missing = 46.4816753
PARTICIPATE IN
DRAMA/SPEECH/ART
CLUBS
q12d Frequency Percent
No 125 82.67
Yes 26 17.33
Frequency Missing = 41.4293193
The frequencies have been weighted so that the
analysis reflects the distribution of students by grade
level in the district
Page

8/6/2019 Cedar Hill ISD - Grade 9 Center - 2008 Texas School Survey of Drug and Alcohol Use
http://slidepdf.com/reader/full/cedar-hill-isd-grade-9-center-2008-texas-school-survey-of-drug-and-alcohol 46/60
Cedar Hill ISD - Grade 9 Center
Spring 2008
PARTICIPATE IN DRILL
TEAM/CHEERLEADING
q12e Frequency Percent
No 130 92.14
Yes 11 7.86
Frequency Missing = 51.534031414
PARTICIPATE IN
STUDENT
GOVERNMENT
q12f Frequency Percent
No 135 93.06
Yes 10 6.94
Frequency Missing = 47.492146597
PARTICIPATE IN SCHOOLNEWSPAPER/YEARBOOK
q12g Frequency Percent
No 138 97.86
Yes 3 2.14
Frequency Missing = 51.534031414
PARTICIPATE IN
ACADEMIC
CLUBS/SOCIETIES
q12h Frequency PercentNo 129 87.07
Yes 19 12.93
Frequency Missing = 44.460732984
PARTICIPATE IN
ACADEMIC
COMPETITION
GROUPS
q12i Frequency Percent
No 132 88.51
Yes 17 11.49
Frequency Missing = 43.45026178
PARTICIPATE IN
SCHOOL SERVICE
CLUBS
q12j Frequency Percent
No 143 95.95
Yes 6 4.05
Frequency Missing = 43.45026178
PARTICIPATE IN
OTHER SCHOOL
CLUBS OR GROUPS
q12k Frequency Percent
No 120 80.41
Yes 29 19.59
Frequency Missing = 43.45026178
PARTICIPATE IN
ATHLETIC TEAMS
OUTSIDE OF SCHOOL
q12l Frequency Percent
No 109 69.23
Yes 49 30.77
Frequency Missing = 35.366492147
PARTICIPATE IN
OTHER CLUBS OR
GROUPS OUTSIDE OF
SCHOOL
q12m Frequency Percent
No 99 63.64
Yes 57 36.36
Frequency Missing = 37.387434555
DO YOU FEEL SAFE IN YOUR
HOME
q13a Frequency Percent
Very Safe 134 71.51
Somewhat Safe 43 23.12
Not Very Safe 1 0.54
Don't Know 9 4.84
Frequency Missing = 5.0523560209
DO YOU FEEL SAFE IN YOU
NEIGHBORHOO
q13b Frequency Perce
Very Safe 45 24.
Somewhat Safe 114 61.
Not Very Safe 13 7.
Not Safe At All 4 2.
Don't Know 9 4.
Frequency Missing = 7.07329842
DO YOU FEEL SAFE A
SCHOO
q13c Frequency Perce
Very Safe 27 14.
Somewhat Safe 92 49.
Not Very Safe 32 17.
Not Safe At All 11 6.
Don't Know 22 12.
Frequency Missing = 8.08376963
FRIENDS FEELING
CLOSE TO THEIR
PARENTS
q14a Frequency Percent
None 15 8.15
A Few 62 33.15
Some 46 25.00
Most 47 25.54
All 15 8.15
Frequency Missing = 7.07329842
HOW MANY FRIENDS
CARRY WEAPONS
q14b Frequency Percent
None 104 56.59
A Few 47 25.82
Some 20 10.99
Most 10 5.49
All 2 1.10
Frequency Missing = 9.09424083
The frequencies have been weighted so that the
analysis reflects the distribution of students by grade
level in the district
Page

8/6/2019 Cedar Hill ISD - Grade 9 Center - 2008 Texas School Survey of Drug and Alcohol Use
http://slidepdf.com/reader/full/cedar-hill-isd-grade-9-center-2008-texas-school-survey-of-drug-and-alcohol 47/60
Cedar Hill ISD - Grade 9 Center
Spring 2008
HOW MANY FRIENDS
CARE ABOUT GOOD
GRADES
q14c Frequency Percent
None 4 2.21
A Few 26 14.36
Some 50 27.07
Most 59 32.04All 44 24.31
Frequency Missing = 10.104712042
HOW MANY FRIENDS
BELONG TO A GANG
q14d Frequency Percent
None 88 48.60
A Few 41 22.91
Some 33 18.44
Most 12 6.70All 6 3.35
Frequency Missing = 12.12565445
FRIENDS WISHING TO
DROP OUT OF
SCHOOL
q14e Frequency Percent
None 80 43.17
A Few 66 35.52
Some 25 13.66
Most 9 4.92
All 5 2.73
Frequency Missing = 8.0837696335
PARENTS ATTEND
PTA/SCHOOL OPEN
HOUSES
q15 Frequency Percent
No 101 67.57
Yes 49 32.43
Frequency Missing = 43.45026178
RECENT CIGARETTE USE
Q16A Frequency Percent
Never Heard/Used 150 82.22
In Your Lifetime 17 9.44
Since School Began 3 1.67
In the Past Month 12 6.67
Frequency Missing = 11.115183246
RECENT SMOKELESS TOBACCO
USE
Q16B Frequency Percent
Never Heard/Used 169 95.98
In Your Lifetime 3 1.72
Since School Began 1 0.57
In the Past Month 3 1.72
Frequency Missing = 17.178010471
RECENT BEER USE
Q16C Frequency Percent
Never Heard/Used 125 70.45
In Your Lifetime 28 15.91
Since School Began 9 5.11
In the Past Month 15 8.52
Frequency Missing = 15.157068063
RECENT WINE COOLER USE
Q16D Frequency Percent
Never Heard/Used 91 50.56
In Your Lifetime 39 21.91
Since School Began 19 10.67
In the Past Month 30 16.85
Frequency Missing = 13.136125654
RECENT WINE USE
Q16E Frequency PercentNever Heard/Used 104 62.80
In Your Lifetime 30 18.29
Since School Began 12 7.32
In the Past Month 19 11.59
Frequency Missing = 27.282722513
RECENT LIQUOR
Q16F Frequency Per
Never Heard/Used 115 6
In Your Lifetime 27 1
Since School Began 13
In the Past Month 23 1
Frequency Missing = 14.1465968
RECENT INHALANT
Q16G Frequency Per
Never Heard/Used 162 8
In Your Lifetime 11
Since School Began 3
In the Past Month 4
Frequency Missing = 13.1361256
RECENT MARIJUANA
Q17A Frequency Per
Never Heard/Used 138 7
In Your Lifetime 12
Since School Began 11
In the Past Month 14
Frequency Missing = 17.1780104
RECENT COCAINE Q17B Frequency Per
Never Heard/Used 165 9
In Your Lifetime 5
Since School Began 1
In the Past Month 2
Frequency Missing = 20.2094240
RECENT CRACK
Q17C Frequency Per
Never Heard/Used 170 9In Your Lifetime 2
Since School Began 1
Frequency Missing = 20.2094240
The frequencies have been weighted so that the
analysis reflects the distribution of students by grade
level in the district
Page
8/6/2019 Cedar Hill ISD - Grade 9 Center - 2008 Texas School Survey of Drug and Alcohol Use
http://slidepdf.com/reader/full/cedar-hill-isd-grade-9-center-2008-texas-school-survey-of-drug-and-alcohol 48/60
Cedar Hill ISD - Grade 9 Center
Spring 2008
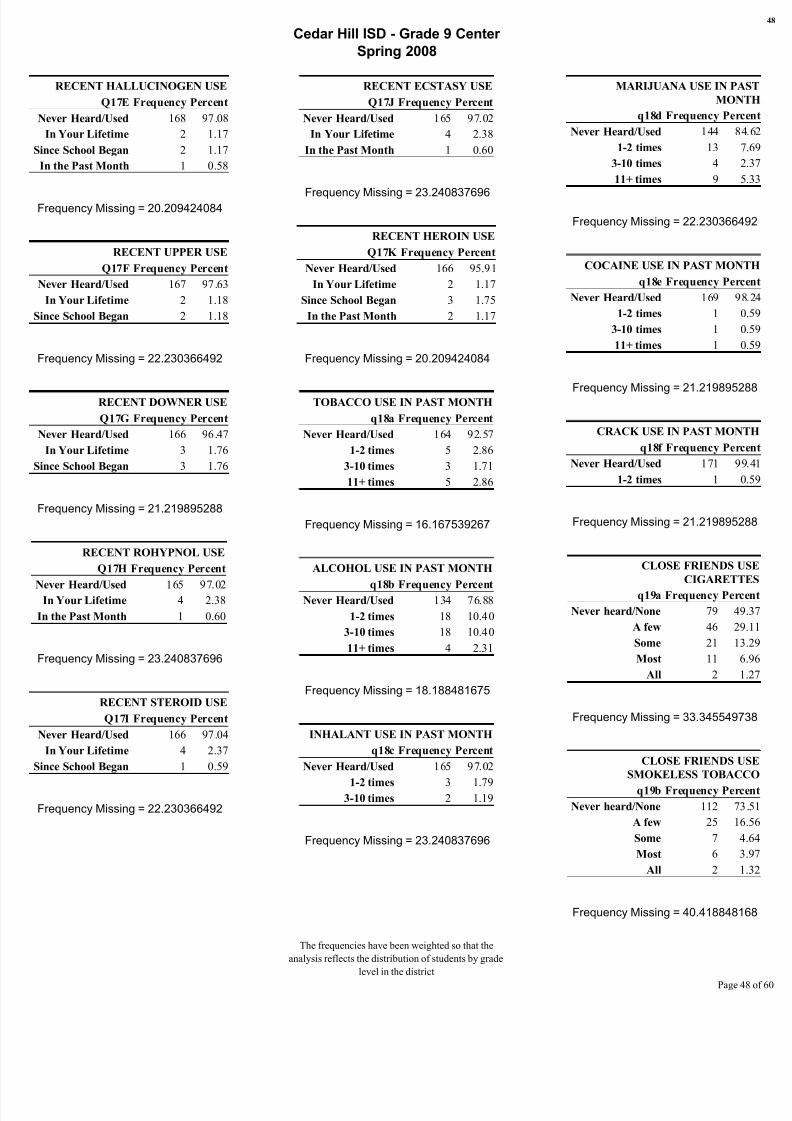
RECENT HALLUCINOGEN USE
Q17E Frequency Percent
Never Heard/Used 168 97.08
In Your Lifetime 2 1.17
Since School Began 2 1.17
In the Past Month 1 0.58
Frequency Missing = 20.209424084
RECENT UPPER USE
Q17F Frequency Percent
Never Heard/Used 167 97.63
In Your Lifetime 2 1.18
Since School Began 2 1.18
Frequency Missing = 22.230366492
RECENT DOWNER USE
Q17G Frequency Percent
Never Heard/Used 166 96.47
In Your Lifetime 3 1.76
Since School Began 3 1.76
Frequency Missing = 21.219895288
RECENT ROHYPNOL USE
Q17H Frequency Percent
Never Heard/Used 165 97.02In Your Lifetime 4 2.38
In the Past Month 1 0.60
Frequency Missing = 23.240837696
RECENT STEROID USE
Q17I Frequency Percent
Never Heard/Used 166 97.04
In Your Lifetime 4 2.37
Since School Began 1 0.59
Frequency Missing = 22.230366492
RECENT ECSTASY USE
Q17J Frequency Percent
Never Heard/Used 165 97.02
In Your Lifetime 4 2.38
In the Past Month 1 0.60
Frequency Missing = 23.240837696
RECENT HEROIN USE
Q17K Frequency Percent
Never Heard/Used 166 95.91
In Your Lifetime 2 1.17
Since School Began 3 1.75
In the Past Month 2 1.17
Frequency Missing = 20.209424084
TOBACCO USE IN PAST MONTH
q18a Frequency Percent
Never Heard/Used 164 92.57
1-2 times 5 2.86
3-10 times 3 1.71
11+ times 5 2.86
Frequency Missing = 16.167539267
ALCOHOL USE IN PAST MONTH
q18b Frequency PercentNever Heard/Used 134 76.88
1-2 times 18 10.40
3-10 times 18 10.40
11+ times 4 2.31
Frequency Missing = 18.188481675
INHALANT USE IN PAST MONTH
q18c Frequency Percent
Never Heard/Used 165 97.02
1-2 times 3 1.793-10 times 2 1.19
Frequency Missing = 23.240837696
MARIJUANA USE IN PA
MON
q18d Frequency Per
Never Heard/Used 144 8
1-2 times 13
3-10 times 4
11+ times 9
Frequency Missing = 22.2303664
COCAINE USE IN PAST MON
q18e Frequency Per
Never Heard/Used 169 9
1-2 times 1
3-10 times 1
11+ times 1
Frequency Missing = 21.2198952
CRACK USE IN PAST MON
q18f Frequency Per
Never Heard/Used 171 9
1-2 times 1
Frequency Missing = 21.2198952
CLOSE FRIENDS U
CIGARETT
q19a Frequency Perc
Never heard/None 79 49
A few 46 29
Some 21 13
Most 11 6
All 2
Frequency Missing = 33.3455497
CLOSE FRIENDS U
SMOKELESS TOBAC
q19b Frequency Perc
Never heard/None 112 73
A few 25 16
Some 7 4
Most 6 3
All 2
Frequency Missing = 40.4188481
The frequencies have been weighted so that the
analysis reflects the distribution of students by grade
level in the district
Page

8/6/2019 Cedar Hill ISD - Grade 9 Center - 2008 Texas School Survey of Drug and Alcohol Use
http://slidepdf.com/reader/full/cedar-hill-isd-grade-9-center-2008-texas-school-survey-of-drug-and-alcohol 49/60
Cedar Hill ISD - Grade 9 Center
Spring 2008
CLOSE FRIENDS USE BEER
q19c Frequency Percent
Never heard/None 77 50.00
A few 36 23.68
Some 17 11.18
Most 16 10.53All 7 4.61
Frequency Missing = 39.408376963
CLOSE FRIENDS USE WINE
COOLERS
q19d Frequency Percent
Never heard/None 68 42.95
A few 29 18.59
Some 28 17.95
Most 21 13.46All 11 7.05
Frequency Missing = 35.366492147
CLOSE FRIENDS USE WINE
q19e Frequency Percent
Never heard/None 79 50.65
A few 39 25.32
Some 23 14.94
Most 7 4.55
All 7 4.55
Frequency Missing = 37.387434555
CLOSE FRIENDS USE LIQUOR
q19f Frequency Percent
Never heard/None 73 46.15
A few 30 19.23
Some 26 16.67
Most 18 11.54
All 10 6.41
Frequency Missing = 35.366492147
CLOSE FRIENDS USE INHALANTS
q19g Frequency Percent
Never heard/None 128 80.38
A few 20 12.66
Some 9 5.70
All 2 1.27
Frequency Missing = 33.345549738
CLOSE FRIENDS USE
MARIJUANA
q19h Frequency Percent
Never heard/None 74 46.20
A few 21 13.29
Some 26 16.46
Most 28 17.72
All 10 6.33
Frequency Missing = 33.345549738
DIFFICULT TO GET
CIGARETTES
q20a Frequency Percent
Never heard of 32 20.00
Impossible 27 16.87
Very difficult 10 6.25
Somewhat diff 14 8.75
Somewhat easy 30 18.75
Very easy 47 29.38
Frequency Missing = 31.32460733
DIFFICULT TO GET
SMOKELESS TOBACCO
q20b Frequency Percent
Never heard of 51 31.65
Impossible 32 20.25
Very difficult 15 9.49
Somewhat diff 20 12.66
Somewhat easy 18 11.39
Very easy 23 14.56
Frequency Missing = 33.345549738
DIFFICULT TO GET BEE
q20c Frequency Perce
Never heard of 28 17.
Impossible 23 14.
Very difficult 8 5.
Somewhat diff 13 8.
Somewhat easy 35 22.
Very easy 51 31.
Frequency Missing = 34.3560209
DIFFICULT TO GET WIN
COOLER
q20d Frequency Perce
Never heard of 25 16.
Impossible 27 17.
Very difficult 6 3.
Somewhat diff 18 11.
Somewhat easy 32 20.Very easy 47 30.
Frequency Missing = 36.3769633
DIFFICULT TO GET WIN
q20e Frequency Perce
Never heard of 29 18.
Impossible 25 15.
Very difficult 12 7.
Somewhat diff 22 13.
Somewhat easy 28 17.Very easy 44 27.
Frequency Missing = 31.324607
DIFFICULT TO GET LIQUO
q20f Frequency Perce
Never heard of 29 18.
Impossible 27 17.
Very difficult 8 5.
Somewhat diff 16 10.
Somewhat easy 31 19.
Very easy 47 29.
Frequency Missing = 33.3455497
The frequencies have been weighted so that the
analysis reflects the distribution of students by grade
level in the district
Page
8/6/2019 Cedar Hill ISD - Grade 9 Center - 2008 Texas School Survey of Drug and Alcohol Use
http://slidepdf.com/reader/full/cedar-hill-isd-grade-9-center-2008-texas-school-survey-of-drug-and-alcohol 50/60
Cedar Hill ISD - Grade 9 Center
Spring 2008
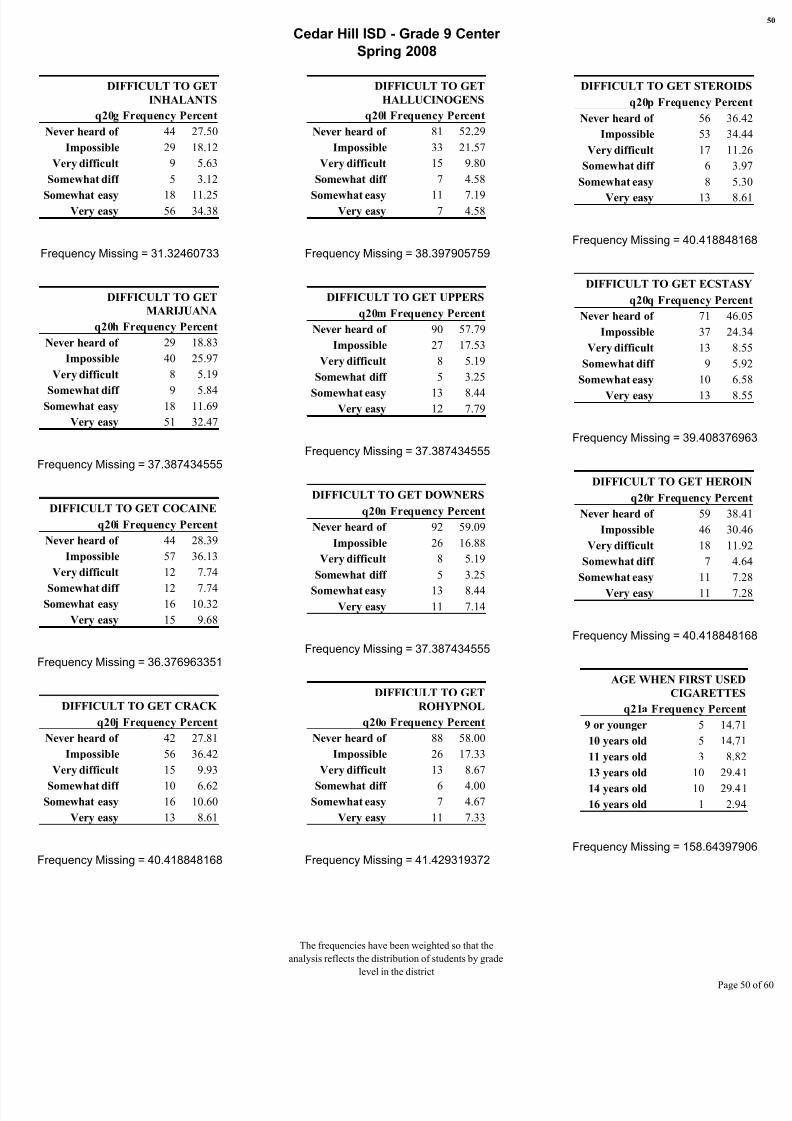
DIFFICULT TO GET
INHALANTS
q20g Frequency Percent
Never heard of 44 27.50
Impossible 29 18.12
Very difficult 9 5.63
Somewhat diff 5 3.12
Somewhat easy 18 11.25Very easy 56 34.38
Frequency Missing = 31.32460733
DIFFICULT TO GET
MARIJUANA
q20h Frequency Percent
Never heard of 29 18.83
Impossible 40 25.97
Very difficult 8 5.19
Somewhat diff 9 5.84Somewhat easy 18 11.69
Very easy 51 32.47
Frequency Missing = 37.387434555
DIFFICULT TO GET COCAINE
q20i Frequency Percent
Never heard of 44 28.39
Impossible 57 36.13
Very difficult 12 7.74
Somewhat diff 12 7.74Somewhat easy 16 10.32
Very easy 15 9.68
Frequency Missing = 36.376963351
DIFFICULT TO GET CRACK
q20j Frequency Percent
Never heard of 42 27.81
Impossible 56 36.42
Very difficult 15 9.93
Somewhat diff 10 6.62Somewhat easy 16 10.60
Very easy 13 8.61
Frequency Missing = 40.418848168
DIFFICULT TO GET
HALLUCINOGENS
q20l Frequency Percent
Never heard of 81 52.29
Impossible 33 21.57
Very difficult 15 9.80
Somewhat diff 7 4.58
Somewhat easy 11 7.19Very easy 7 4.58
Frequency Missing = 38.397905759
DIFFICULT TO GET UPPERS
q20m Frequency Percent
Never heard of 90 57.79
Impossible 27 17.53
Very difficult 8 5.19
Somewhat diff 5 3.25
Somewhat easy 13 8.44Very easy 12 7.79
Frequency Missing = 37.387434555
DIFFICULT TO GET DOWNERS
q20n Frequency Percent
Never heard of 92 59.09
Impossible 26 16.88
Very difficult 8 5.19
Somewhat diff 5 3.25
Somewhat easy 13 8.44Very easy 11 7.14
Frequency Missing = 37.387434555
DIFFICULT TO GET
ROHYPNOL
q20o Frequency Percent
Never heard of 88 58.00
Impossible 26 17.33
Very difficult 13 8.67
Somewhat diff 6 4.00Somewhat easy 7 4.67
Very easy 11 7.33
Frequency Missing = 41.429319372
DIFFICULT TO GET STEROID
q20p Frequency Perce
Never heard of 56 36.
Impossible 53 34.
Very difficult 17 11.
Somewhat diff 6 3.
Somewhat easy 8 5.
Very easy 13 8.
Frequency Missing = 40.4188481
DIFFICULT TO GET ECSTAS
q20q Frequency Perce
Never heard of 71 46.
Impossible 37 24.
Very difficult 13 8.
Somewhat diff 9 5.
Somewhat easy 10 6.
Very easy 13 8.
Frequency Missing = 39.4083769
DIFFICULT TO GET HERO
q20r Frequency Perce
Never heard of 59 38.
Impossible 46 30.
Very difficult 18 11.
Somewhat diff 7 4.
Somewhat easy 11 7.
Very easy 11 7.
Frequency Missing = 40.4188481
AGE WHEN FIRST USED
CIGARETTE
q21a Frequency Percen
9 or younger 5 14.7
10 years old 5 14.7
11 years old 3 8.8
13 years old 10 29.4
14 years old 10 29.4
16 years old 1 2.9
Frequency Missing = 158.643979
The frequencies have been weighted so that the
analysis reflects the distribution of students by grade
level in the district
Page

8/6/2019 Cedar Hill ISD - Grade 9 Center - 2008 Texas School Survey of Drug and Alcohol Use
http://slidepdf.com/reader/full/cedar-hill-isd-grade-9-center-2008-texas-school-survey-of-drug-and-alcohol 51/60
Cedar Hill ISD - Grade 9 Center
Spring 2008
AGE WHEN FIRST USED
SMOKELESS TOBACCO
q21b Frequency Percent
9 or younger 3 25.00
10 years old 1 8.33
12 years old 3 25.00
13 years old 2 16.67
14 years old 2 16.6718 or older 1 8.33
Frequency Missing = 180.87434555
AGE WHEN FIRST USED
BEER
q21c Frequency Percent
9 or younger 19 32.20
10 years old 3 5.08
11 years old 4 6.78
12 years old 8 13.5613 years old 12 20.34
14 years old 8 13.56
15 years old 5 8.47
Frequency Missing = 133.38219895
AGE WHEN FIRST USED
WINE COOLERS
q21d Frequency Percent
9 or younger 11 15.71
10 years old 6 8.5711 years old 10 14.29
12 years old 19 27.14
13 years old 11 15.71
14 years old 8 11.43
15 years old 5 7.14
Frequency Missing = 122.26701571
AGE WHEN FIRST USED
WINE
q21e Frequency Percent
9 or younger 5 8.20
10 years old 9 14.75
11 years old 6 9.84
12 years old 13 21.31
13 years old 11 18.0314 years old 12 19.67
15 years old 4 6.56
18 or older 1 1.64
Frequency Missing = 131.36125654
AGE WHEN FIRST USED
LIQUOR
q21f Frequency Percent
9 or younger 4 6.67
10 years old 5 8.3311 years old 6 10.00
12 years old 14 23.33
13 years old 10 16.67
14 years old 15 25.00
15 years old 4 6.67
17 years old 1 1.67
18 or older 1 1.67
Frequency Missing = 132.37172775
AGE WHEN FIRST USEDINHALANTS
q21g Frequency Percent
9 or younger 1 10.00
10 years old 2 20.00
11 years old 4 40.00
12 years old 1 10.00
13 years old 1 10.00
14 years old 1 10.00
Frequency Missing = 182.89528796
AGE WHEN FIRST USED
MARIJUANA
q21h Frequency Percen
9 or younger 4 11.1
10 years old 3 8.3
11 years old 3 8.3
12 years old 5 13.8
13 years old 7 19.414 years old 10 27.7
15 years old 3 8.3
18 or older 1 2.7
Frequency Missing = 156.623036
AGE WHEN FIRST USED
COCAINE
q21i Frequency Percen
10 years old 1 14.29
12 years old 1 14.2913 years old 2 28.57
14 years old 3 42.86
Frequency Missing = 185.926701
AGE WHEN FIRST USED
CRACK
q21j Frequency Percen
11 years old 1 20.00
12 years old 1 20.00
13 years old 1 20.0015 years old 1 20.00
18 or older 1 20.00
Frequency Missing = 187.947643
AGE WHEN FIRST USED
HALLUCINOGENS
q21l Frequency Percen
12 years old 1 16.67
13 years old 1 16.67
14 years old 2 33.3315 years old 2 33.33
Frequency Missing = 186.937172
The frequencies have been weighted so that the
analysis reflects the distribution of students by grade
level in the district
Page
8/6/2019 Cedar Hill ISD - Grade 9 Center - 2008 Texas School Survey of Drug and Alcohol Use
http://slidepdf.com/reader/full/cedar-hill-isd-grade-9-center-2008-texas-school-survey-of-drug-and-alcohol 52/60
Cedar Hill ISD - Grade 9 Center
Spring 2008
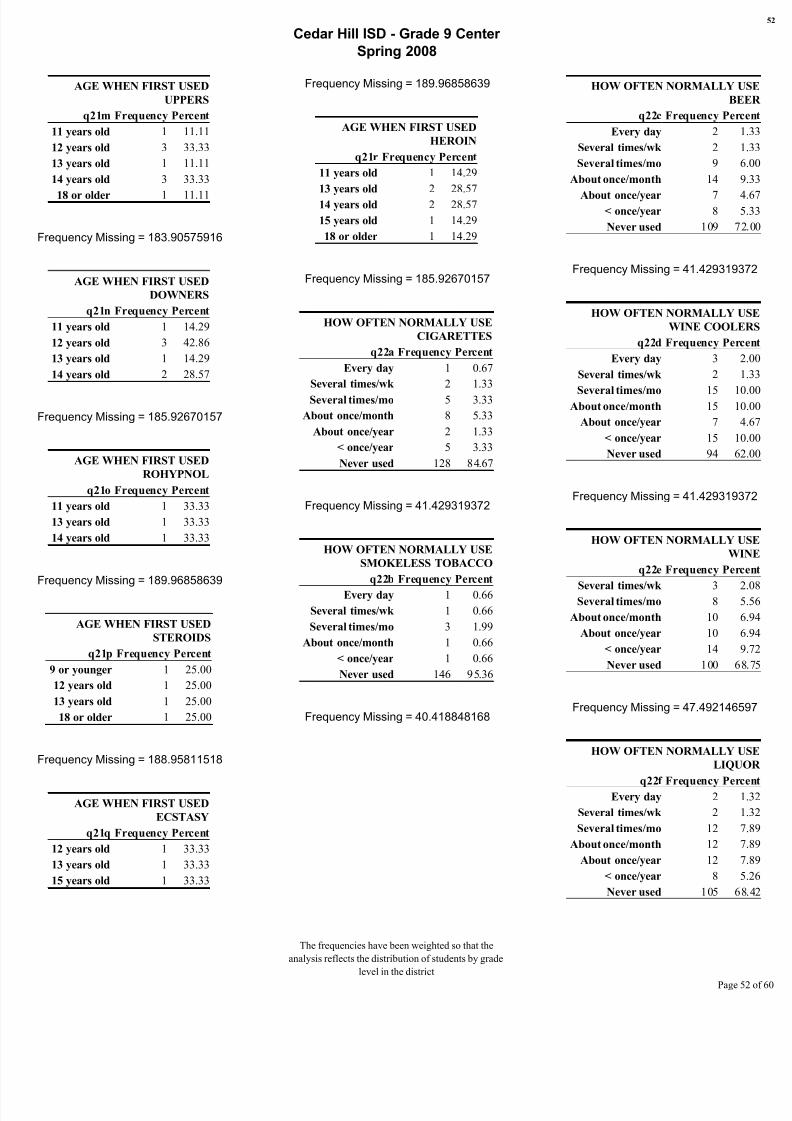
AGE WHEN FIRST USED
UPPERS
q21m Frequency Percent
11 years old 1 11.11
12 years old 3 33.33
13 years old 1 11.11
14 years old 3 33.33
18 or older 1 11.11
Frequency Missing = 183.90575916
AGE WHEN FIRST USED
DOWNERS
q21n Frequency Percent
11 years old 1 14.29
12 years old 3 42.86
13 years old 1 14.29
14 years old 2 28.57
Frequency Missing = 185.92670157
AGE WHEN FIRST USED
ROHYPNOL
q21o Frequency Percent
11 years old 1 33.33
13 years old 1 33.33
14 years old 1 33.33
Frequency Missing = 189.96858639
AGE WHEN FIRST USED
STEROIDS
q21p Frequency Percent
9 or younger 1 25.00
12 years old 1 25.00
13 years old 1 25.00
18 or older 1 25.00
Frequency Missing = 188.95811518
AGE WHEN FIRST USED
ECSTASY
q21q Frequency Percent
12 years old 1 33.33
13 years old 1 33.33
15 years old 1 33.33
Frequency Missing = 189.96858639
AGE WHEN FIRST USED
HEROIN
q21r Frequency Percent
11 years old 1 14.29
13 years old 2 28.57
14 years old 2 28.57
15 years old 1 14.29
18 or older 1 14.29
Frequency Missing = 185.92670157
HOW OFTEN NORMALLY USE
CIGARETTES
q22a Frequency Percent
Every day 1 0.67
Several times/wk 2 1.33
Several times/mo 5 3.33
About once/month 8 5.33
About once/year 2 1.33
< once/year 5 3.33
Never used 128 84.67
Frequency Missing = 41.429319372
HOW OFTEN NORMALLY USE
SMOKELESS TOBACCO
q22b Frequency Percent
Every day 1 0.66
Several times/wk 1 0.66
Several times/mo 3 1.99
About once/month 1 0.66
< once/year 1 0.66
Never used 146 95.36
Frequency Missing = 40.418848168
HOW OFTEN NORMALLY U
BE
q22c Frequency Per
Every day 2
Several times/wk 2
Several times/mo 9
About once/month 14
About once/year 7 < once/year 8
Never used 109 7
Frequency Missing = 41.4293193
HOW OFTEN NORMALLY U
WINE COOLE
q22d Frequency Per
Every day 3
Several times/wk 2
Several times/mo 15 1About once/month 15 1
About once/year 7
< once/year 15 1
Never used 94 6
Frequency Missing = 41.4293193
HOW OFTEN NORMALLY U
WI
q22e Frequency Per
Several times/wk 3 Several times/mo 8
About once/month 10
About once/year 10
< once/year 14
Never used 100 6
Frequency Missing = 47.4921465
HOW OFTEN NORMALLY U
LIQU
q22f Frequency PerEvery day 2
Several times/wk 2
Several times/mo 12
About once/month 12
About once/year 12
< once/year 8
Never used 105 6
The frequencies have been weighted so that the
analysis reflects the distribution of students by grade
level in the district
Page

8/6/2019 Cedar Hill ISD - Grade 9 Center - 2008 Texas School Survey of Drug and Alcohol Use
http://slidepdf.com/reader/full/cedar-hill-isd-grade-9-center-2008-texas-school-survey-of-drug-and-alcohol 53/60
Cedar Hill ISD - Grade 9 Center
Spring 2008
Frequency Missing = 39.408376963
HOW OFTEN NORMALLY USE
INHALANTS
q22g Frequency Percent
Several times/mo 2 1.35
About once/month 1 0.68
About once/year 1 0.68
< once/year 4 2.70
Never used 141 94.59
Frequency Missing = 43.45026178
HOW OFTEN NORMALLY USE
MARIJUANA
q22h Frequency Percent
Every day 5 3.29
Several times/wk 5 3.29
Several times/mo 7 4.61
About once/month 5 3.29
About once/year 4 2.63
< once/year 7 4.61
Never used 120 78.29
Frequency Missing = 39.408376963
HOW OFTEN NORMALLY USE
COCAINE
q22i Frequency Percent
Every day 1 0.67
Several times/mo 1 0.67
About once/year 1 0.67
< once/year 4 2.68
Never used 143 95.30
Frequency Missing = 42.439790576
HOW OFTEN NORMALLY USE
CRACK
q22j Frequency Percent
Several times/mo 1 0.67
About once/year 1 0.67
< once/year 2 1.34
Never used 147 97.32
Frequency Missing = 42.439790576
HOW OFTEN NORMALLY USE
HALLUCINOGENS
q22l Frequency Percent
About once/month 1 0.68
About once/year 1 0.68
< once/year 3 2.05
Never used 142 96.58
Frequency Missing = 45.471204188
HOW OFTEN NORMALLY USE
UPPERS
q22m Frequency Percent
Several times/mo 1 0.68
About once/month 1 0.68
About once/year 5 3.40
< once/year 1 0.68
Never used 140 94.56
Frequency Missing = 44.460732984
HOW OFTEN NORMALLY USE
DOWNERS
q22n Frequency Percent
Several times/mo 2 1.33
About once/year 4 2.67
< once/year 2 1.33
Never used 143 94.67
Frequency Missing = 41.429319372
HOW OFTEN NORMALLY USE
ROHYPNOL
q22o Frequency Percent
About once/year 1 0.68
< once/year 1 0.68
Never used 147 98.64
Frequency Missing = 44.460732984
HOW OFTEN NORMALLY USE
STEROIDS
q22p Frequency Percent
About once/month 1 0.69
< once/year 1 0.69
Never used 144 98.62
Frequency Missing = 46.4816753
HOW OFTEN NORMALLY U
ECSTA
q22q Frequency Per
Several times/mo 1
About once/month 1
< once/year 2
Never used 142 9
Frequency Missing = 46.4816753
HOW OFTEN NORMALLY U
HERO
q22r Frequency Per
Several times/wk 1
Several times/mo 1
About once/month 1
About once/year 1
< once/year 2
Never used 140 9
Frequency Missing = 46.4816753
AMOUNT OF BEER AT ON
TIM
q23a Frequency Perc
Never drink this 86 58
12+ drinks 5 3
9-11 drinks 4 2
5-8 drinks 4 2
3-4 drinks 9 6
2 drinks 9 6
1 drink 14 9
< 1 drink 15 10
Frequency Missing = 46.4816753
The frequencies have been weighted so that the
analysis reflects the distribution of students by grade
level in the district
Page

8/6/2019 Cedar Hill ISD - Grade 9 Center - 2008 Texas School Survey of Drug and Alcohol Use
http://slidepdf.com/reader/full/cedar-hill-isd-grade-9-center-2008-texas-school-survey-of-drug-and-alcohol 54/60
Cedar Hill ISD - Grade 9 Center
Spring 2008
AMOUNT OF WINE COOLERS
AT ONE TIME
q23b Frequency Percent
Never drink this 88 59.18
12+ drinks 2 1.36
5-8 drinks 3 2.04
3-4 drinks 8 5.44
2 drinks 9 6.121 drink 12 8.16
< 1 drink 26 17.69
Frequency Missing = 44.460732984
AMOUNT OF WINE AT ONE
TIME
q23c Frequency Percent
Never drink this 82 53.29
12+ drinks 6 3.95
9-11 drinks 1 0.665-8 drinks 4 2.63
3-4 drinks 13 8.55
2 drinks 14 9.21
1 drink 13 8.55
< 1 drink 20 13.16
Frequency Missing = 39.408376963
AMOUNT OF LIQUOR AT ONE
TIME
q23d Frequency PercentNever drink this 99 65.77
12+ drinks 1 0.67
9-11 drinks 4 2.68
5-8 drinks 6 4.03
3-4 drinks 5 3.36
2 drinks 12 8.05
1 drink 9 6.04
< 1 drink 14 9.40
Frequency Missing = 42.439790576
HOW MANY 5+ DRINKS IN PAST
30 DAYS
q24 Frequency Percent
Never 5+ at time 66 41.67
None 70 44.23
1 day 5 3.21
2 days 5 3.21
3 to 5 days 6 3.856 to 9 days 2 1.28
10 or more days 4 2.56
Frequency Missing = 35.366492147
GET ALCOHOLIC BEVERAGES
FROM HOME
q25a Frequency Percent
Do not Drink 80 52.32
Never 33 21.85
Seldom 23 15.23Most of the Time 9 5.96
Always 7 4.64
Frequency Missing = 40.418848168
GET ALCOHOLIC BEVERAGES
FROM FRIENDS
q25b Frequency Percent
Do not Drink 75 50.00
Never 35 23.65
Seldom 20 13.51Most of the Time 12 8.11
Always 7 4.73
Frequency Missing = 43.45026178
GET ALCOHOLIC BEVERAGES
FROM A STORE
q25c Frequency Percent
Do not Drink 83 55.41
Never 54 35.81
Seldom 6 4.05Most of the Time 2 1.35
Always 5 3.38
Frequency Missing = 43.45026178
GET ALCOHOLIC BEVERAG
AT PARTI
q25d Frequency Perc
Do not Drink 80 51
Never 27 17
Seldom 20 13
Most of the Time 14 9
Always 12 7
Frequency Missing = 39.4083769
GET ALCOHOLIC BEVERAG
FROM OTH
q25e Frequency Perc
Do not Drink 82 54
Never 38 25
Seldom 10 6
Most of the Time 13 8
Always 6 4
Frequency Missing = 43.450261
USE MARIJUANA AS JOIN
q26a Frequency Perc
Never 122 82
Seldom 6 4
Half the time 11 7
Most of the time 3 2
Always 5 3
Frequency Missing = 45.4712041
USE MARIJUANA AS BLUN
q26b Frequency Perc
Never 116 78
Seldom 9 6
Half the time 7 4
Most of the time 7 4
Always 8 5
Frequency Missing = 45.4712041
The frequencies have been weighted so that the
analysis reflects the distribution of students by grade
level in the district
Page
8/6/2019 Cedar Hill ISD - Grade 9 Center - 2008 Texas School Survey of Drug and Alcohol Use
http://slidepdf.com/reader/full/cedar-hill-isd-grade-9-center-2008-texas-school-survey-of-drug-and-alcohol 55/60
Cedar Hill ISD - Grade 9 Center
Spring 2008
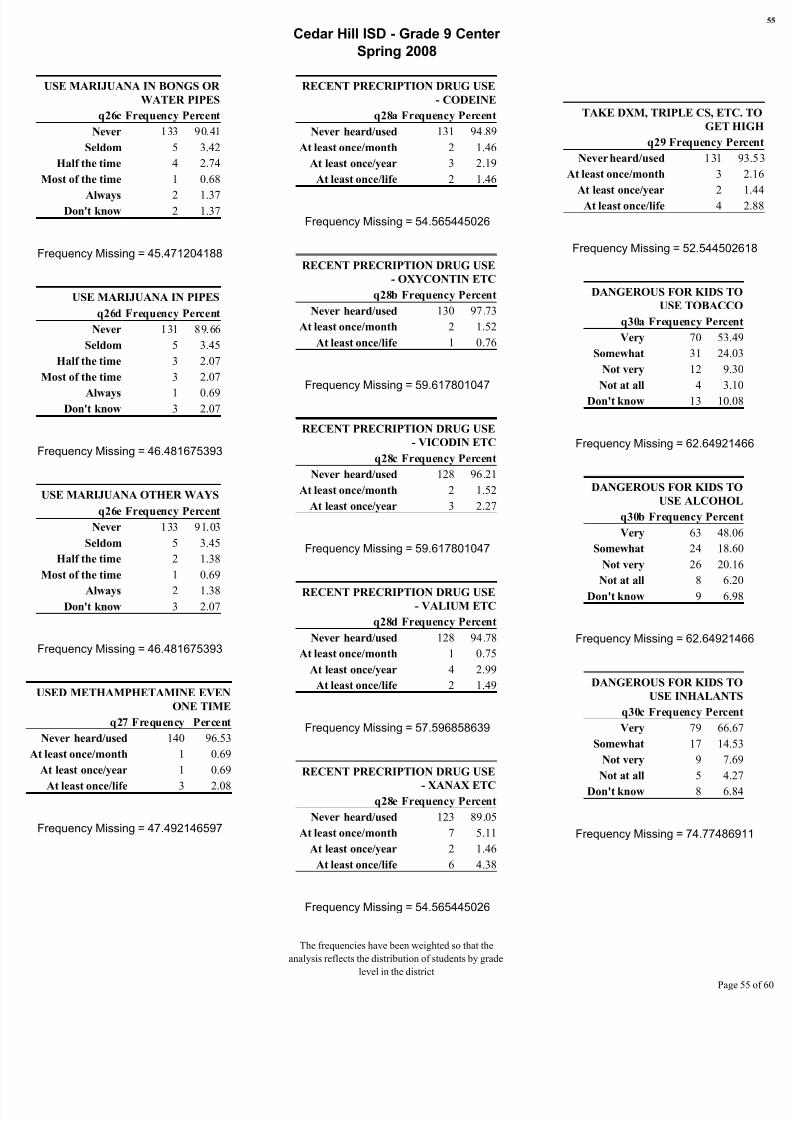
USE MARIJUANA IN BONGS OR
WATER PIPES
q26c Frequency Percent
Never 133 90.41
Seldom 5 3.42
Half the time 4 2.74
Most of the time 1 0.68
Always 2 1.37Don't know 2 1.37
Frequency Missing = 45.471204188
USE MARIJUANA IN PIPES
q26d Frequency Percent
Never 131 89.66
Seldom 5 3.45
Half the time 3 2.07
Most of the time 3 2.07
Always 1 0.69Don't know 3 2.07
Frequency Missing = 46.481675393
USE MARIJUANA OTHER WAYS
q26e Frequency Percent
Never 133 91.03
Seldom 5 3.45
Half the time 2 1.38
Most of the time 1 0.69
Always 2 1.38Don't know 3 2.07
Frequency Missing = 46.481675393
USED METHAMPHETAMINE EVEN
ONE TIME
q27 Frequency Percent
Never heard/used 140 96.53
At least once/month 1 0.69
At least once/year 1 0.69
At least once/life 3 2.08
Frequency Missing = 47.492146597
RECENT PRECRIPTION DRUG USE
- CODEINE
q28a Frequency Percent
Never heard/used 131 94.89
At least once/month 2 1.46
At least once/year 3 2.19
At least once/life 2 1.46
Frequency Missing = 54.565445026
RECENT PRECRIPTION DRUG USE
- OXYCONTIN ETC
q28b Frequency Percent
Never heard/used 130 97.73
At least once/month 2 1.52
At least once/life 1 0.76
Frequency Missing = 59.617801047
RECENT PRECRIPTION DRUG USE
- VICODIN ETC
q28c Frequency Percent
Never heard/used 128 96.21
At least once/month 2 1.52
At least once/year 3 2.27
Frequency Missing = 59.617801047
RECENT PRECRIPTION DRUG USE- VALIUM ETC
q28d Frequency Percent
Never heard/used 128 94.78
At least once/month 1 0.75
At least once/year 4 2.99
At least once/life 2 1.49
Frequency Missing = 57.596858639
RECENT PRECRIPTION DRUG USE
- XANAX ETCq28e Frequency Percent
Never heard/used 123 89.05
At least once/month 7 5.11
At least once/year 2 1.46
At least once/life 6 4.38
Frequency Missing = 54.565445026
TAKE DXM, TRIPLE CS, ETC
GET H
q29 Frequency Per
Never heard/used 131 9
At least once/month 3
At least once/year 2
At least once/life 4
Frequency Missing = 52.5445026
DANGEROUS FOR KIDS TO
USE TOBACCO
q30a Frequency Percen
Very 70 53.49
Somewhat 31 24.03
Not very 12 9.30
Not at all 4 3.10
Don't know 13 10.08
Frequency Missing = 62.649214
DANGEROUS FOR KIDS TO
USE ALCOHOL
q30b Frequency Percen
Very 63 48.06
Somewhat 24 18.60
Not very 26 20.16
Not at all 8 6.20
Don't know 9 6.98
Frequency Missing = 62.649214
DANGEROUS FOR KIDS TO
USE INHALANTS
q30c Frequency Percen
Very 79 66.67
Somewhat 17 14.53
Not very 9 7.69
Not at all 5 4.27
Don't know 8 6.84
Frequency Missing = 74.774869
The frequencies have been weighted so that the
analysis reflects the distribution of students by grade
level in the district
Page
8/6/2019 Cedar Hill ISD - Grade 9 Center - 2008 Texas School Survey of Drug and Alcohol Use
http://slidepdf.com/reader/full/cedar-hill-isd-grade-9-center-2008-texas-school-survey-of-drug-and-alcohol 56/60

8/6/2019 Cedar Hill ISD - Grade 9 Center - 2008 Texas School Survey of Drug and Alcohol Use
http://slidepdf.com/reader/full/cedar-hill-isd-grade-9-center-2008-texas-school-survey-of-drug-and-alcohol 57/60
Cedar Hill ISD - Grade 9 Center
Spring 2008
IN TROUBLE FOR
DRINKING SINCE
SEPTEMBER
q31f Frequency Percent
None 121 96.77
1-3 days 1 0.81
4-9 days 2 1.61
10+ days 1 0.81
Frequency Missing = 67.701570681
IN TROUBLE FOR DRUG
USE SINCE SEPTEMBER
q31g Frequency Percent
None 120 94.44
1-3 days 1 0.79
4-9 days 2 1.59
10+ days 4 3.17
Frequency Missing = 65.680628272
TROUBLE WITH FRIENDS
BECAUSE OF DRINKING
q32a Frequency Percent
None 122 96.03
1-3 times 2 1.59
4-9 times 1 0.79
10+ times 2 1.59
Frequency Missing = 65.680628272
DRIVEN A CAR AFTER A
GOOD BIT TO DRINK
q32b Frequency Percent
None 116 95.83
1-3 times 2 1.67
4-9 times 1 0.83
10+ times 2 1.67
Frequency Missing = 71.743455497
CRITICIZED BY DATE
BECAUSE OF DRINKING
q32c Frequency Percent
None 113 94.92
1-3 times 2 1.69
4-9 times 4 3.39
Frequency Missing = 73.764397906
TROUBLE WITH POLICE
BECAUSE OF DRINKING
q32d Frequency Percent
None 114 95.76
1-3 times 2 1.69
4-9 times 3 2.54
Frequency Missing = 73.764397906
TROUBLE WITH FRIENDS
BECAUSE OF DRUG USE
q32e Frequency Percent
None 110 93.97
1-3 times 3 2.59
4-9 times 2 1.72
10+ times 2 1.72
Frequency Missing = 75.785340314
DRIVEN A CAR WHILE
HIGH FROM DRUGS
q32f Frequency Percent
None 107 93.81
1-3 times 4 3.54
10+ times 3 2.65
Frequency Missing = 78.816753927
CRITICIZED BY DATE
BECAUSE OF DRUG USE
q32g Frequency Percent
None 114 95.76
1-3 times 2 1.69
4-9 times 2 1.69
10+ times 1 0.85
Frequency Missing = 73.764397906
TROUBLE WITH POLICE
BECAUSE OF DRUG USE
q32h Frequency Percent
None 111 95.65
1-3 times 2 1.74
4-9 times 1 0.87
10+ times 2 1.74
Frequency Missing = 76.7958115
CLASS DAYS DRUNK ON
ALCOHOL SINCE SEPT
q33a Frequency Percent
None 114 90.40
1-3 days 8 6.40
4-9 days 3 2.40
10+ days 1 0.80
Frequency Missing = 66.6910994
CLASS DAYS HIGH ON
MARIJUANA SINCE SEPT
q33b Frequency Percent
None 112 87.40
1-3 days 11 8.66
4-9 days 3 2.36
10+ days 2 1.57
Frequency Missing = 64.6701570
CLASS DAYS HIGH ON
INHALANTS SINCE SEPT
q33c Frequency Percent
None 126 97.66
1-3 days 2 1.56
4-9 days 1 0.78
Frequency Missing = 63.6596858
CLASS DAYS HIGH ONOTHER DRUG(S)
q33d Frequency Percent
None 117 90.62
1-3 days 8 6.25
4-9 days 3 2.34
10+ days 1 0.78
The frequencies have been weighted so that the
analysis reflects the distribution of students by grade
level in the district
Page
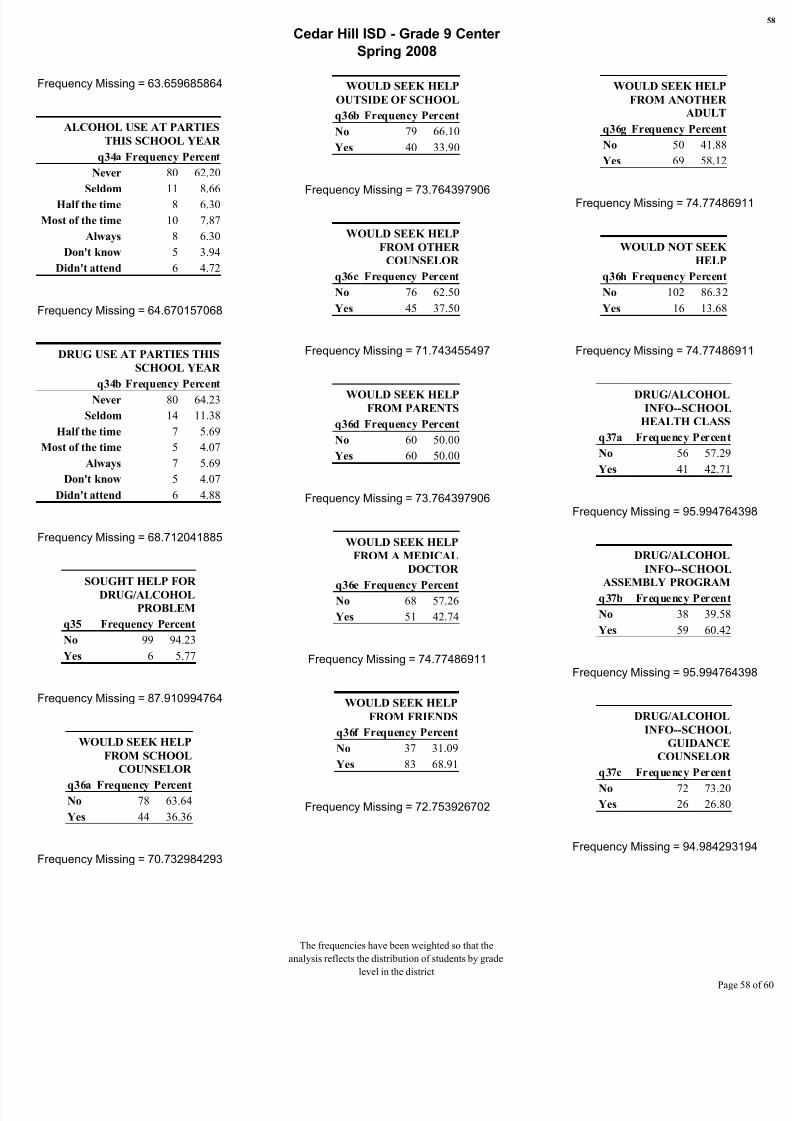
8/6/2019 Cedar Hill ISD - Grade 9 Center - 2008 Texas School Survey of Drug and Alcohol Use
http://slidepdf.com/reader/full/cedar-hill-isd-grade-9-center-2008-texas-school-survey-of-drug-and-alcohol 58/60
Cedar Hill ISD - Grade 9 Center
Spring 2008
Frequency Missing = 63.659685864
ALCOHOL USE AT PARTIES
THIS SCHOOL YEAR
q34a Frequency Percent
Never 80 62.20
Seldom 11 8.66
Half the time 8 6.30
Most of the time 10 7.87
Always 8 6.30
Don't know 5 3.94
Didn't attend 6 4.72
Frequency Missing = 64.670157068
DRUG USE AT PARTIES THIS
SCHOOL YEAR
q34b Frequency Percent
Never 80 64.23
Seldom 14 11.38
Half the time 7 5.69
Most of the time 5 4.07
Always 7 5.69
Don't know 5 4.07
Didn't attend 6 4.88
Frequency Missing = 68.712041885
SOUGHT HELP FOR
DRUG/ALCOHOL
PROBLEM
q35 Frequency Percent
No 99 94.23
Yes 6 5.77
Frequency Missing = 87.910994764
WOULD SEEK HELP
FROM SCHOOL
COUNSELOR
q36a Frequency PercentNo 78 63.64
Yes 44 36.36
Frequency Missing = 70.732984293
WOULD SEEK HELP
OUTSIDE OF SCHOOL
q36b Frequency Percent
No 79 66.10
Yes 40 33.90
Frequency Missing = 73.764397906
WOULD SEEK HELP
FROM OTHER
COUNSELOR
q36c Frequency Percent
No 76 62.50
Yes 45 37.50
Frequency Missing = 71.743455497
WOULD SEEK HELPFROM PARENTS
q36d Frequency Percent
No 60 50.00
Yes 60 50.00
Frequency Missing = 73.764397906
WOULD SEEK HELP
FROM A MEDICAL
DOCTOR
q36e Frequency PercentNo 68 57.26
Yes 51 42.74
Frequency Missing = 74.77486911
WOULD SEEK HELP
FROM FRIENDS
q36f Frequency Percent
No 37 31.09
Yes 83 68.91
Frequency Missing = 72.753926702
WOULD SEEK HELP
FROM ANOTHER
ADULT
q36g Frequency Percent
No 50 41.88
Yes 69 58.12
Frequency Missing = 74.774869
WOULD NOT SEEK
HELP
q36h Frequency Percent
No 102 86.32
Yes 16 13.68
Frequency Missing = 74.774869
DRUG/ALCOHOLINFO--SCHOOL
HEALTH CLASS
q37a Frequency Percent
No 56 57.29
Yes 41 42.71
Frequency Missing = 95.9947643
DRUG/ALCOHOL
INFO--SCHOOL
ASSEMBLY PROGRAM
q37b Frequency Percent
No 38 39.58
Yes 59 60.42
Frequency Missing = 95.9947643
DRUG/ALCOHOL
INFO--SCHOOL
GUIDANCE
COUNSELOR
q37c Frequency Percent
No 72 73.20
Yes 26 26.80
Frequency Missing = 94.9842931
The frequencies have been weighted so that the
analysis reflects the distribution of students by grade
level in the district
Page

8/6/2019 Cedar Hill ISD - Grade 9 Center - 2008 Texas School Survey of Drug and Alcohol Use
http://slidepdf.com/reader/full/cedar-hill-isd-grade-9-center-2008-texas-school-survey-of-drug-and-alcohol 59/60
Cedar Hill ISD - Grade 9 Center
Spring 2008
DRUG/ALCOHOL
INFO--SCIENCE CLASS
q37d Frequency Percent
No 69 70.83
Yes 28 29.17
Frequency Missing = 95.994764398
DRUG/ALCOHOL
INFO--SOCIAL
STUDIES CLASS
q37e Frequency Percent
No 80 84.04
Yes 15 15.96
Frequency Missing = 98.015706806
DRUG/ALCOHOLINFO--SCHOOL
STUDENT GROUP OR
CLUB
q37f Frequency Percent
No 77 80.00
Yes 19 20.00
Frequency Missing = 97.005235602
DRUG/ALCOHOL
INFO--INVITED
SCHOOL GUEST
q37g Frequency Percent
No 50 53.26
Yes 43 46.74
Frequency Missing = 100.03664921
DRUG/ALCOHOL
INFO--ANOTHER
SCHOOL SOURCE
q37h Frequency Percent
No 62 64.21
Yes 34 35.79
Frequency Missing = 97.005235602
DRUG/ALCOHOL INFO--
WEBSITE/ONLINE CHAT
GROUP
q38a Frequency Percent
No 69 62.39
Yes 41 37.61
Frequency Missing = 82.858638743
DRUG/ALCOHOL INFO--
BOOKS/MAGAZINES/POSTERS/PA
MPHLETS
q38b Frequency
No 59
Yes 57
DRUG/ALCOHOL INFO--
BOOKS/MAGAZINES/POSTERS/PA
MPHLETS
q38b Percent
No 50.88
Yes 49.12
Frequency Missing = 77.806282723
DRUG/ALCOHOL INFO--
TV/RADIO/OTHER
AUDIO/VIDEO
q38c Frequency Percent
No 52 45.54
Yes 62 54.46
Frequency Missing = 79.827225131
DRUG/ALCOHOL
INFO--PARENTS
q38d Frequency Percent
No 57 50.91
Yes 55 49.09
Frequency Missing = 81.848167539
PARENTS FEEL ABOUT K
SMOKING CIGAR
q39a Frequency Per
Strong disapprove 88 7
Mild disapprove 9
Neither 5
Strongly approve 2
Don't know 13 1
Frequency Missing = 75.7853403
PARENTS FEEL ABOUT K
DRINKING BE
q39b Frequency Per
Strong disapprove 76 6
Mild disapprove 14 1
Neither 7
Mildly approve 3
Strongly approve 3 Don't know 11
Frequency Missing = 78.8167539
PARENTS FEEL ABOUT K
USING MARIJUA
q39c Frequency Per
Strong disapprove 90 7
Mild disapprove 5
Neither 5
Mildly approve 1 Strongly approve 2
Don't know 10
Frequency Missing = 79.8272251
TESTED FOR DRUG
USE AT SCHOOL
q40 Frequency Percent
No 110 93.97
Yes 7 6.03
Frequency Missing = 75.7853403
The frequencies have been weighted so that the
analysis reflects the distribution of students by grade
level in the district
Page
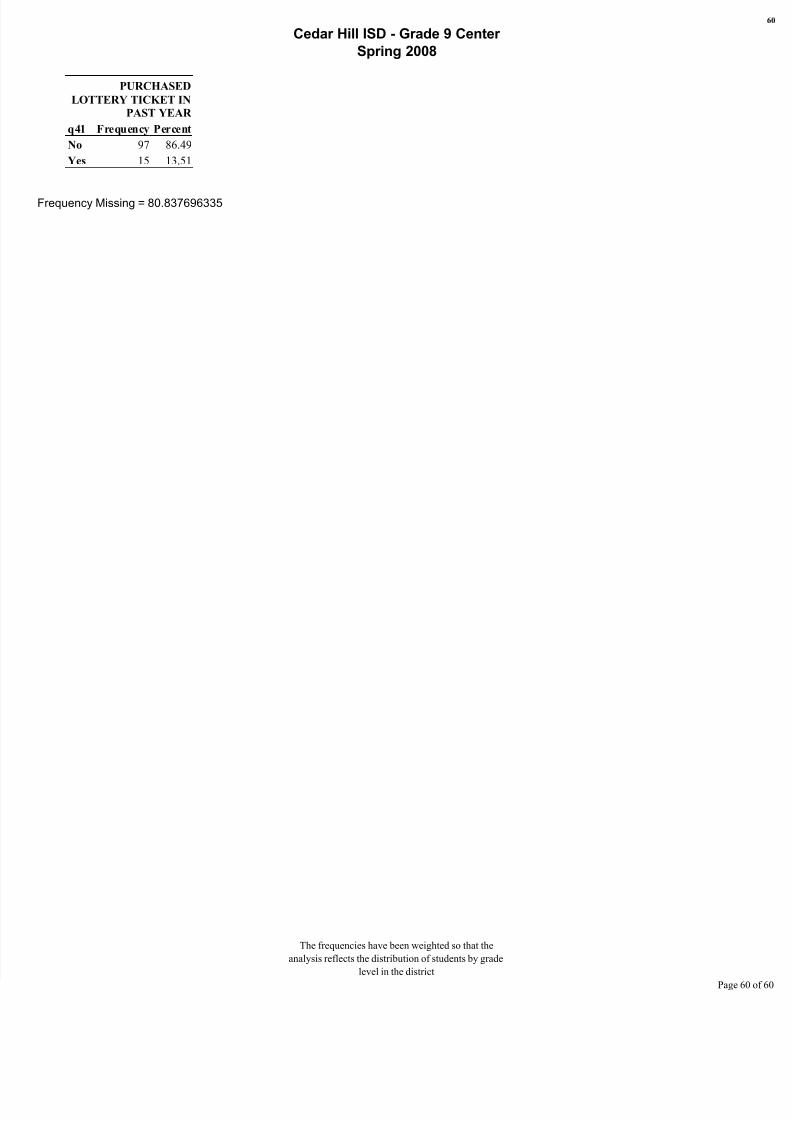
8/6/2019 Cedar Hill ISD - Grade 9 Center - 2008 Texas School Survey of Drug and Alcohol Use
http://slidepdf.com/reader/full/cedar-hill-isd-grade-9-center-2008-texas-school-survey-of-drug-and-alcohol 60/60
Cedar Hill ISD - Grade 9 Center
Spring 2008
PURCHASED
LOTTERY TICKET IN
PAST YEAR
q41 Frequency Percent
No 97 86.49
Yes 15 13.51
Frequency Missing = 80.837696335