cedar county, iowa · cedar county, iowa land use plan 2006 ... billy campion leroy moeller ......
TRANSCRIPT

CEDAR COUNTY, IOWA
LAND USE PLAN 2006
Prepared by : EAST CENTRAL INTERGOVERNMENTAL ASSOCIATION 3999 PENNSYLVANIA AVENUE #200 DUBUQUE, IOWA 52002


CEDAR COUNTY LAND USE PLAN 2006
ACKNOWLEDGEMENTS
Cedar County Board of Supervisors Jon Bell Dennis Boedeker, Chairman Billy Campion Leroy Moeller Dennis Weih
Cedar County Planning & Zoning Commission Joel Brown Don Lamp Dennis Pruess, Chairman Larry Quinn Dave Schuett Stephanie Weisenbach Kurtis Voparil
Cedar County Environmental & Zoning Deptartment Phil LaRue, Director Sharon Laucamp, Office Manager
Cedar County Engineer Robert Fangmann, P.E.
TABLE OF CONTENT
CEDAR COUNTY LAND USE PLAN 2006 BACKGROUND AND PURPOSE .................................................................................................................. 1 LAND USE PLAN ........................................................................................................................................... 2 OVERVIEW ....................................................................................................................................... 2 A. CEDAR COUNTY PLANNING GOALS AND OBJECTIVES ............................................................ 3 B. CEDAR COUNTY DEVELOPMENT POLICIES ................................................................................ 7 C. CEDAR COUNTY PROFILE ............................................................................................................. 8 Population ................................................................................................................................ 8 Population Projection ............................................................................................................... 11 Population Profile ...................................................................................................................... 11 D. CEDAR COUNTY EXISTING LAND USE AND DEVELOPMENT ................................................... 18 Physical Setting ......................................................................................................................... 18 General County Development Trends ..................................................................................... 24 Residential, Commercial, and Industrial Development Trends ............................................ 26 E. CEDAR COUNTY FUTURE LAND USE .......................................................................................... 34 Future Land Use Map Areas ..................................................................................................... 34 Future Land Use Plan and Map Review and Amendment ..................................................... 36
LIST OF FIGURES
FIGURE 1 CEDAR COUNTY POPULATION ........................................................................................ 8
LIST OF TABLES
TABLE 1 CITY AND COUNTY POPULATION COMPARISON .......................................................... 9 TABLE 2 TOWNSHIP POPULATION COMPARISON ........................................................................ 10 TABLE 3 CEDAR COUNTY POPULATION PROJECTION ................................................................ 11 TABLE 4 CEDAR COUNTY URBAN, RURAL NON-FARM, & FARM POPULATION ....................... 11 TABLE 5 CEDAR COUNTY NUMBER OF FARMS ............................................................................ 12 TABLE 6 CEDAR COUNTY LAND IN FARMS .................................................................................... 12 TABLE 7 CEDAR COUNTY AGE AND SEX ....................................................................................... 13 TABLE 8 CEDAR COUNTY AGE OF FARM OPERATORS ............................................................... 13 TABLE 9 CEDAR COUNTY MEDIAN HOUSEHOLD INCOME .......................................................... 14 TABLE 10 CEDAR COUNTY SCHOOL ENROLLMENTS .................................................................... 14 TABLE 11 CEDAR COUNTY EMPLOYMENT & OCCUPATION .......................................................... 15 TABLE 12 CEDAR COUNTY PRINCIPAL FARMER OCCUPATION ................................................... 16 TABLE 13 CEDAR COUNTY NUMBER OF HOUSING UNITS ............................................................ 16 TABLE 14 CEDAR COUNTY PERMIT AUTHORIZED HOUSING UNITS ............................................ 17 TABLE 15 CEDAR COUNTY BUILDING PERMIT SUMMARY 1980-2000 .......................................... 24 TABLE 16 CEDAR COUNTY REZONING SUMMARY 1980-2000 ....................................................... 25

LIST OF MAPS
MAP 1 CEDAR COUNTY SLOPE MAP ................................................................................................. 19 MAP 2 CEDAR COUNTY CORN SUITABILITY RATING ...................................................................... 20 MAP 3 CEDAR COUNTY 100-YEAR FLOOD PLAN ............................................................................. 22 MAP 4 CEDAR COUNTY ROAD SYSTEM ............................................................................................ 23 MAP 5 CEDAR COUNTY RESIDENTIAL REZONING 1990-2002 ........................................................ 27 MAP 6 CEDAR COUNTY RESIDENTIAL BUILDING PERMITS 1990-2002 ......................................... 28 MAP 7 CEDAR COUNTY COMMERCIAL/MANUFACTURING REZONING 1990-2002 ...................... 31 MAP 8 CEDAR COUNTY COMMERCIAL BUILDING PERMITS 1990-2002 ........................................ 32 MAP 9 CEDAR COUNTY INDUSTRIAL BUILDING PERMITS 1990-2002 ........................................... 33 MAP 10 CEDAR COUNTY FUTURE LAND USE MAP ........................................................................... 37

BACKGROUND AND PURPOSE Cedar County first adopted Zoning in 1959. The initial Subdivision Ordinance was adopted in September 1974 and the Zoning Ordinance was revised in 1975, both with the assistance of Schoon Planning and Engineering Consultants. The initial Comprehensive Plan 1980-2000 for Cedar County was completed in June 1980 with the assistance of the East Central Intergovernmental Association. ECIA also assisted Cedar County with the development of the Community Builder Plan (April 1994), Housing Needs Assessment (March 2000), Hazard Mitigation Plan (August 2001), and Pre-Disaster Mitigation Plan (May 2005). Today, Cedar County has revised the 1980 Comprehensive Plan with the adoption of this document, the Cedar County, Iowa - Land Use Plan 2006. As part of the Land Use Plan revision process, the Cedar County Planning and Zoning Commission and Board of Supervisors reviewed the 1980 Land Use Plan, requested public input, and studied development trends. The current land use and zoning within the County was also examined. The County sought input from the incorporated cities on potential future development in their surrounding urban fringe area. The new Land Use Plan includes a revised Future Land Use Map, and revised Planning Goals, Objectives and Policies. By combining the 2006 Cedar County, Iowa Land Use Plan with the County’s 1994 Community Builder Plan (which does not contain a land use element), the 2000 Housing Needs Assessment, the 2001 Hazard Mitigation Plan and 2005 Pre-Disaster Mitigation Plan, and other County reports and data, the County is providing a revised version of the 1980 Comprehensive Plan. These combined documents (or planning elements) shall act as the Comprehensive Plan for the Cedar County, and used as the official guidelines in making decisions and recommendations for rural development. It is very important that the goals and intent of these documents continue to represent the County’s ideals for the future. Therefore, periodic review and amendment are necessary to keep Cedar County on a course of advancing the quality of life for the County.
LAND USE PLAN
Overview The Cedar County Planning and Zoning Commission has been the primary county body charged with the update of the 1980 Land Use Plan (Comprehensive Plan). The Planning and Zoning Commission was assisted by the Cedar County Board of Supervisors and the County Zoning Administrator. The Cedar County Land Use Plan shall be used by county officials, developers, landowners, and residents as the official guidelines for making decisions and recommendations related to rural development. The Land Use Plan is based on the following Planning Goals and Objectives, and Development Policies that were developed in public work sessions by the Cedar County Zoning Commission and presented to the public for review and comment. Goals are broad statements of purpose that express a desired end result. Objectives indicate a course of action needed to attain an established goal. Policies are specific actions developed to accomplish the objectives. As the County grows, officials may need to develop other specific policies based on further study of local problems or needs in order to continue to attain the goals. The goals may also need to be amended as the development needs of the County change. The Planning Goals and Objectives, and Development Policies are implemented through adoption of the Land Use Plan and Future Land Use Map, and enforcement of the Zoning Ordinance, Subdivision Regulations, and other land development regulations.

A. CEDAR COUNTY PLANNING GOALS AND OBJECTIVES
1. OVERALL COUNTY GROWTH AND DEVELOPMENT GOAL
To promote the health, safety, and general welfare of the residents of Cedar County and to promote economic, efficient and convenient growth in the county by guiding physical development and public improvements through the planning process.
Objectives:
1-A. To discourage scattered residential development when the resulting densities
will not support a full range of services, and to guide new growth into a more compact and compatible growth pattern in which development can be adequately served by transportation facilities, public utilities, and other services and amenities.
1-B. To enhance the appearance of the County by preserving areas of natural
beauty and by encouraging development proposals which are compatible with the surrounding environment.
1-C. To maximize the effectiveness of development expenditures in areas changing
from rural to urban development by the orderly extension of public utilities and community facilities.
1-D. To preserve and enhance the quality of life in Cedar County.
2. NATURAL RESOURCES DEVELOPMENT GOAL
To maintain and protect the County’s natural resources for the future generations.
Objectives:
2-A. To advise of development difficulties where physical considerations such as
soil types, drainage patterns, flooding, and slopes may pose environmental and/or health problems.
2-B. To encourage the protection of surface and ground waters. 2-C. To encourage the preservation of significant woodland areas, scenic vistas,
and historic sites from destruction and encroachment by development. 2-D. To insure that the extraction for Cedar County’s mineral resources will not
create a detrimental impact on adjacent lands.

2-E. To promote and encourage projects which will control flooding along the Cedar River and major streams, and to maintain and enforce regulations that will reduce damages caused by flooding.
3. RESIDENTIAL DEVELOPMENT GOAL
To acknowledge the need to have a variety of housing types available for all income levels in appropriate locations in Cedar County.
Objectives:
3-A. To maintain the existing sound housing units, and to upgrade or replace
substandard housing units in the County. 3-B. To provide residential development with adequate community facilities and
essential services such as fire and police protection, water, and sewer, in the most economically efficient manner.
3-C. To promote planning, design, and construction of a wider range of housing unit
types in adequate supply for all income levels and age groups. 3-D. To discourage non-farm development on prime agricultural land having a high
Corn Suitability Rating.
4. COMMERCIAL DEVELOPMENT GOAL
To locate areas of commercial development within the context of an overall plan so that it is economically feasible to operate a business and provide goods and services in an attractive, safe, and convenient manner.
Objectives: 4-A. To encourage the retention and strengthening of commercial districts within the
various communities in the County. 4-B. To encourage the planning and construction of compact commercial cluster
developments, thereby reducing the potential amount of strip development along the major transportation arteries in the County.

5. INDUSTRIAL DEVELOPMENT GOAL
To promote and encourage industrial, warehouse, and wholesaling development at appropriate locations within the county, and to aid in the proper location of new and expanding industry in order to provide a stable economic base.
Objectives: 5-A. To encourage the establishment of industrial parks, designed attractively and
efficiently with adequate facilities and service roads. 5-B. To encourage the diversification of area industries in order to promote a more
stable economic base in the County. 5-C. To assist local industrial development groups in gathering necessary data
about the County for prospective industries. 5-D. To promote the necessary programs which may be utilized to provide skills to
the county’s labor force and serve as an incentive for new or expanding industries.
6. TRANSPORTATION IMPROVEMENT GOAL
To develop a transportation system which will provide for the rapid, safe, convenient and economical movement of people, goods, and services within and through the County.
Objectives:
6-A. To effect improvements to the County’s highways having narrow and
deteriorating driving surfaces. 6-B. To encourage the extension, reconstruction, and improvement in the County’s
local road system. 6-C. To promote the development of a total transportation system including rail,
highway, and air.

7. PUBLIC UTILITIES AND SERVICES GOAL
To encourage the provision of public utilities and other services at a level which will guide and promote cost-effective, compact development adjacent to existing communities within the County.
Objectives:
7-A. To abate the pollution of ground and surface water by discouraging the use of septic tanks and individual wells in new subdivisions.
7-B. To encourage and assist in the development of water and sewer systems in
communities where necessary. 7-C. To promote the establishment of fire protection facilities throughout the county
where needed, and require adequate access for emergency vehicles in new developments.
7-D. To develop educational and recreational facilities as needed. 7-E. To maintain emergency management services which will provide responsive
assistance in times of medical emergencies, human distress and natural disasters.
8. PRESERVATION OF AGRICULTURAL LAND GOAL
To maintain the agricultural economy of Cedar County by preserving the availability of productive farmland and the conservation of prime agricultural soils.
Objectives:
8-A. To protect prime agricultural lands from needless encroachment by
incompatible land uses, preserving it for agricultural use.
8-B. To discourage non-farm development on prime agricultural land having a high Corn Suitability Rating.
8-C. To support the rural life style and quality of life associated with agriculture
presently available in Cedar County. 8-D. To encourage multiple soil conservation practices to preserve prime
agricultural soils and water quality.

B. CEDAR COUNTY DEVELOPMENT POLICIES
Below are the major policy statements adopted by the Cedar County Board of Supervisors and Zoning Commission for use as official guidelines for future development in Cedar County. These policy statements are intended to provide parameters for rational decision-making on specific development proposals that will arise. Without such explicit statements, decision-making takes place incrementally, on an ad-hoc basis. Consequently, important development proposals are dealt with in a policy vacuum with no regard for long-range planning.
Natural Resources Policy:
1. Appropriate development should be allowed to occur within potential recreational
or open space areas in Cedar County. Timberlands, waterways and watershed areas, scenic geographical features, historical sites and structures, and environmentally sensitive areas should be preserved in their natural state.
2. Prime agricultural land within Cedar County should be preserved for agricultural
use. Conservation practices should be stressed to preserve top soils from erosion.
Residential Policy:
3. Scattered non-farm residential development, rural subdivisions, and
manufactured home parks should be discouraged from locating in the unincorporated areas of the county that are particularly suited for agricultural or recreational uses. Residential development should occur as natural extensions of the communities and follow an orderly, compact growth pattern, and insure transportation demands can be accommodated.
Commercial Policy: 4. Commercial development should be encouraged to develop within, and adjacent
to, communities
5. Rural commercial development should be limited primarily to those businesses providing local retail, service and agricultural needs of the rural neighborhoods, and located along roads adequate to support projected traffic demand.
6. Commercial and recreational businesses should be strongly encouraged to
locate along hard surfaced roads, or roadways adequate to support projected traffic demand.
Industrial Policy:
7. Future industrial development should take place in planned industrial parks or
contiguous to existing industrial usages, having adequate utilities, and transportation network.

C. CEDAR COUNTY PROFILE
The County Profile for Cedar County Iowa includes information on population, income, education, employment, and housing. The source of the data displayed in Figure 1 and the various tables that follow are primarily from the U.S. Bureau of the Census, though other sources are also used. Comparisons between the census years 1980, 1990, and 2000 are provided throughout, with other census years included when applicable. Population Starting with the 1850 U.S. Census, which recorded 3,941 people, Cedar County had a steady and rapid growth in population through 1870, as indicated in Figure 1. By 1870, the population grew to 19,731 persons; this is the largest population to reside in Cedar County. Between 1870 and 1890, the population declined by nearly 1,500 persons, then grew to its second highest level of 19,371 people in 1900. Following the 1900 census, the population began a slow decline through 1930 (16,760 persons), and then began a slow increase up through 1980 (18,635 persons). Between 1980 and 1990, the years of the Midwest farm crises, the population declined by 1,191 persons (-6.4%). The population then increase by 743 persons (+4.3%) between 1990 and 2000. The 2000 U.S. Census population is 18,187 persons for Cedar County as a whole, including cities and unincorporated areas.
00
5000
10000
15000
20000
25000
1850
1860
1870
1880
1890
1900
1910
1920
1930
1940
1950
1960
1970
1980
1990
2000
Popu
latio
n by
Yea
r
Year
Figure 1CEDAR COUNTY POPULATION
1850-2000
Source: U.S. Census Bureau

Cedar County contains seven incorporated cities and portions of two others (Durant and Wilton). Seven cities gained population between 1990 and 2000, while Bennett and Cedar County’s portion of Wilton remained unchanged. During this same time period, the unincorporated area of the County declined by only 21 persons overall. This information is shown in Table 1 – CITY AND COUNTY POPULATION COMPARISON. The Cities of West Branch, Tipton, Mechanicsville, Clarence, Lowden, and Durant had the highest numerical population increases in that order.
1970 1980 1990 2000
385 458 395 395 0 0.0%915 1,001 936 1,008 72 7.7%
1,463 1,583 1,540 1,601 61 3.7%667 717 726 794 68 9.4%989 1,166 1,075 1,173 98 9.1%642 705 646 680 34 5.3%
2,877 3,055 2,998 3,155 157 5.2%1,322 1,867 1,908 2,188 280 14.7%
- 9 4 4 0 0.0%
8,395 8,074 7,216 7,189 (-27) (-0.4)%
17,655 18,635 17,444 18,187 743 4.3%
*Population in Cedar County only.
CITY AND COUNTY POPULATION COMPARISON
Clarence*Durant
Change 1990-2000City/County Population
Bennett
Unincorporated
Cedar Co.Total
Table 1
Source: U.S. Census Bureau
LowdenMechanicsvilleStanwoodTiptonWest Branch*Wilton
Table 2 – TOWNSHIP POPULATION COMPARISON, provides a comparison of the populations of the 17 township within Cedar County for the U.S. Census years 1970, 1980, 1990 and 2000. The percent change in township populations between 1990 and 2000 is also shown. Six townships (Cass, Fairfield, Inland, Massillon, Red Oak, and Sugar Creek) lost population between 1990 and 2000. The population numbers shown in Table 2 contains both incorporated (city) and unincorporated (rural).
Table 2 also indicates 11 townships gained population between 1990 and 2000. The four townships that gained the highest numerical population increases are Center, Gower, Pioneer, and Springdale. Using other U.S. Census information, it is possible to determine if the population growth in these townships occurred within a city or in the rural area.

Pioneer Township had the greatest population growth with a total of 294 people, of which, 98 people (33%) were located in Mechanicsville. Springdale Township gained a total of 176 people with 280 persons (159%) located in West Branch (meaning some of the previously rural township population moved into West Branch, or were annexed). Center Township gained a total of 166 people with 157 (95%) located in Tipton. Grower Township gained 89 people and has no incorporated city, but does have the village of Cedar Valley that may have grown.
1970 1980 1990 2000
351 329 313 295 (-18) (-5.8)%3,843 3,988 3,779 3,945 166 4.4%1,339 1,347 1,219 1,282 63 5.2%
422 348 306 268 (-38) (-12.4)%
2,113 2,185 2,080 2,137 57 2.7%1,066 1,295 970 991 21 2.2%
518 486 439 528 89 20.3%902 954 824 773 (-51) (-6.2)%
425 408 413 460 47 11.4%212 216 190 201 11 5.8%455 422 374 330 (-44) (-11.8)%
1,361 1,460 1,516 1,810 294 19.4%
330 263 224 194 (-30) (-13.4)%458 550 560 603 43 7.7%
2,256 2,825 2,681 2,857 176 6.6%1,219 1,148 1,114 1,138 24 2.2%
382 411 379 375 (-4) (-1.6)%
17,655 18,635 17,381 18,187 806 4.6%
Change 1990-2000
Population
Springdale
GrowerInland
IowaLinn
SpringfieldSugar Creek
Cedar Co. Total
MassillonPioneer
Red OakRochester
Source: U.S. Census Bureau
TOWNSHIP POPULATION COMPARISONTable 2
Township
CassCenterDaytonFairfield
FarmingtonFremont

Population Projection Table 3 – CEDAR COUNTY POPULATION PROJECTION, displays the population projections for Cedar County between 2005 and 2030 in five-year increments. This Cedar County population projection is provided through the State Data Center of Iowa, and was developed by Woods & Poole Economics, Inc. for the “2005 State Profile: Iowa”. The population projection for Cedar County shows a continued increase through the year 2030. The average percent of increase is 1.67% over the years indicated.
Table 3
2000 2005 2010 2015 2020 2025
18,217 18,361 18,636 18,968 19,333 19,786
+0.08% +1.50% +1.78% +1.92% +2.34%
CEDAR COUNTY POPULATION PROJECTION
Source: Woods & Poole Economics, Inc (2005)
2030
20,259
+2.39%
Population Profile Table 4 – CEDAR COUNTY URBAN, RURAL NON-FARM, & FARM POPULATION, displays the change in population distribution between urban, rural non-farm, and farm locations between 1970 and 2000.
1980 1990 2000
18,635 17,444 18,187
3,064 3,002 3,009
10,847 11,140 13,415
4,724 3,239 1,763
CEDAR COUNTY URBAN, RURAL NON-FARM, & FARM POPULATIONTable 4
1970
17,655
Source: U.S. Census Bureau
Total Population
Urban
Rural Nonfarm
Farm
2,877
8,471
6,307

Table 5 – CEDAR COUNTY NUMBER OF FARMS, shows the decreasing number of farms in the County between 1969 and 2002. Over this period, the number of farms was reduced by 696 (a 41.8% reduction from the1969 number).
1969 1974 1978 1982 1987 1992 1997 2002
1,667 1,446 1,402 1,323 1,170 1,099 965 971
Source: Census of Agriculture
CEDAR COUNTY NUMBER OF FARMS
Number of Farms
Table 5
Table 6 – CEDAR COUNTY LAND IN FARMS, compares the acreage in farms between 1969 and 2002. During this period the acreage in farms decreased 23,966 acres (6.61%) overall between the years 1969 and 2002.
1969 1978 1982 1987 1992 1997 2002
362,459 363,027 349,453 303,044 304,103 337,077 338,493
Source: Census of Agriculture
CEDAR COUNTY LAND IN FARMSTable 6
Land in farms(acres)

Table 7 – CEDAR COUNTY AGE AND SEX, provides a comparison of the age and sex breakdown for 1980, 1990, and 2000. The Median Age of county residents continues to rise.
Table 7
YearTotal
Population Male FemaleUnder
18 YearsOver
65 Years Median Age
1980 18,635 9,179 9,456 5,450 2,715 31.8
1990 17,381 8,476 8,905 4,633 2,933 36.1
2000 18,187 8,980 9,210 4,601 2,952 39.2
CEDAR COUNTY AGE AND SEX
Source: U.S. Census Bureau
Table 8 – CEDAR COUNTY AGE OF FARM OPERATORS, shows the distribution of farm operators by age group between 1969 and 2002. Table 8 also provides the average age of farm operators, and shows that average age continues to increase.
CEDAR COUNTY AGE OF FARM OPERATORS
1969 1978 1987 1992 1997 2002
1,667 1,402 1,170 1,099 965 971
283 307 225 160 81 48
355 263 271 290 221 161
465 357 238 244 270 301
404 355 267 222 214 263
160 120 169 183 179 198
48.1 47.1 48.7 49.6 51.9 54.4
Table 8
Operators 65 Years or Older
Average Age of Farm Operators
Source: Census of Agriculture
Total Farm Operators
Operators 34 Years or Younger
Operators 35 to 44 Years
Operators 45 to 54 Years
Operators 55 to 64 Years

Table 9 – CEDAR COUNTY MEDIAN HOUSEHOLD INCOME, shows the number of households, median household income, and average household size for the years 1980, 1990 and 2000. Overall, the number of households and median household income has increased, while the average household size has decreased slightly. Between 1980 and 2000, the total number of households has increased by 422 (6.3%).
CEDAR COUNTY MEDIAN HOUSEHOLD INCOME
Number of Households
Median Household Income
Average Household Size
6,737 2.77$17,2922.572.51
Source: U.S. Census Bureau
6,6847,159
$27,713$42,1982000
Table 9
Year
19801990
Table 10 – CEDAR COUNTY SCHOOL ENROLLMENT, provides a breakdown of school enrollment for 1980, 1990, and 2000. Note that total enrollment dropped in 1990, but has increased again in 2000 to almost the 1980 level.
YearPreprimary
School ElementaryHigh
School CollegeTotal
Enrollment
1980 440 2,417 1,396 355 4,6081990 378 combined (3,196) combined 769 4,3432000 529 2,153 1,206 686 4,574
CEDAR COUNTY SCHOOL ENROLLMENT
Source: U.S. Census Bureau
Table 10

Table 11 – CEDAR COUNTY EMPLOYMENT & OCCUPATION, compares employment and occupation for the years 1980, 1990, and 2000. Over this period of time, the total number of person employed 16 years and over has continued to increase. This increase appears to be due to the number of female workers entering the workforce. Also note that there has been a significant reduction in the number of persons employed within the occupational category for ”Farming, Fishing & Forestry”.
Table 11
1980 1990 2000
8,318 8,510 9,753
5,052 4,678 5,1003,266 3,832 4,653
1,614 * 1,639 * 2,756
1,038 1,047 1,290
1,492 2,091 2,420
1,539 1,095 194
1,648 * 1,503 * 1,139
987 * 1,135 * 1,954
Sales and Office
Farming, Fishing & Forestry
Construction, Extraction & Maint.
Production, Transportation &
CEDAR COUNTY EMPLOYMENT & OCCUPATION
Total Employed(16 years & over)
Source: U.S. Census Bureau
MaleFemale
Management/Professional
Service Occupations
Material Moving
* Catergory breakdown was adjusted to match the 2000 Census catergories.
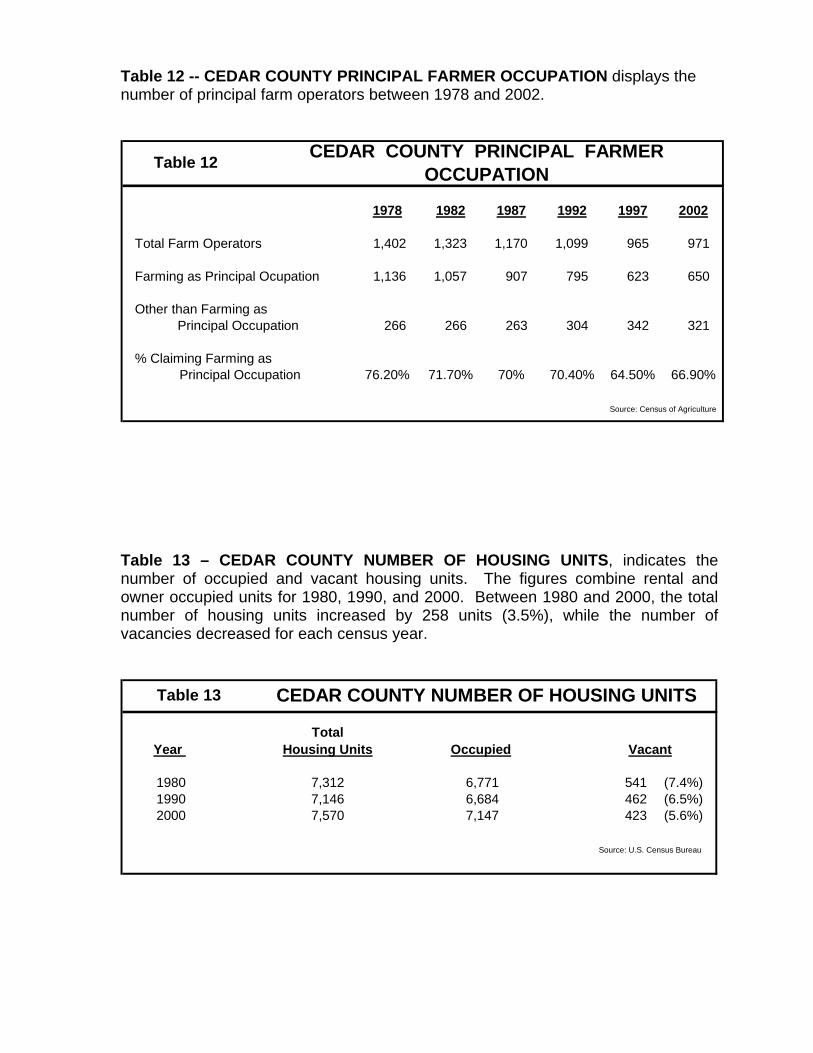
Table 12 -- CEDAR COUNTY PRINCIPAL FARMER OCCUPATION displays the number of principal farm operators between 1978 and 2002.
1978 1982 1987 1992 1997 2002
1,402 1,323 1,170 1,099 965 971
1,136 1,057 907 795 623 650
266 266 263 304 342 321
76.20% 71.70% 70% 70.40% 64.50% 66.90%
Source: Census of Agriculture
Table 12
Other than Farming as
% Claiming Farming as
Farming as Principal Ocupation
Total Farm Operators
CEDAR COUNTY PRINCIPAL FARMER OCCUPATION
Principal Occupation
Principal Occupation
Table 13 – CEDAR COUNTY NUMBER OF HOUSING UNITS, indicates the number of occupied and vacant housing units. The figures combine rental and owner occupied units for 1980, 1990, and 2000. Between 1980 and 2000, the total number of housing units increased by 258 units (3.5%), while the number of vacancies decreased for each census year.
Year Occupied
1980 6,771 541 (7.4%)1990 6,684 462 (6.5%)2000 7,147 423 (5.6%)
7,3127,1467,570
Source: U.S. Census Bureau
CEDAR COUNTY NUMBER OF HOUSING UNITS
Vacant
Table 13
Total Housing Units

Table 14 – CEDAR COUNTY PERMIT AUTHORIZED HOUSING UNITS, displays the number of residential housing units that were authorized by permit in both the County and incorporated cities between 1980 and 2004. The number of permits have been combined into ten year increments (except for 2000 to 2004), and indicates continued residential growth throughout the County.
TABLE 14
1980-1989 1990-1999 2000-2004 Total
130 466 406 1,002
CEDAR COUNTY PERMIT AUTHORIZED HOUSING UNITS
Source: U.S. Census Bureau
Housing Units

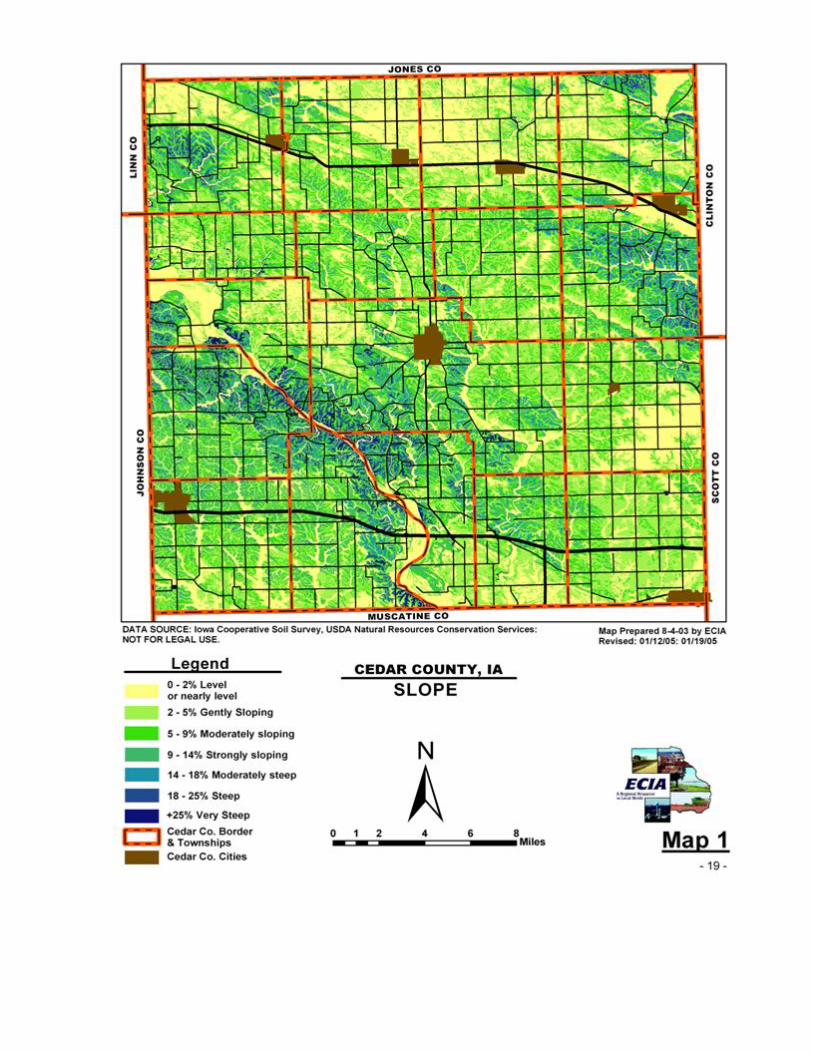
D. CEDAR COUNTY EXISTING LAND USE AND DEVELOPMENT Physical Setting Cedar County contains 579.52 square miles, or 370,893 acres, according to the
2000 U.S. Census. The County contains 16 townships and 9 incorporated cities. The Cedar River flows through the southwest quarter of the County for approximately 22 miles. The Wasipinicon River flows through the extreme northeast corner of the County for approximately 3 miles. Throughout much of the County, the surface topography is nearly level to moderately sloping. The slope does increase in other areas, with the greatest area of steep slopes found in the southwest portion of the County near the Cedar River. In addition, other areas of steep slope can be found to the northwest in the Clear Creek basin, near the Wapsipinicon River to the northeast, in the Lizard Creek basin to the east, and portions of the Sugar Creek, Crooked Creek, and Rock Creek basins in the south central area of the County. Map 1 – CEDAR COUNTY SLOPE, displays the slope in Cedar County on the following page. Map 2 – CEDAR COUNTY CORN SUITABILITY RATING, displays the Corn Suitability Rating for Cedar County. Due to the uneven pattern of prehistoric soil erosion which occurred across Cedar County, the Corn Suitability Rating (CSR) of area soils varies greatly as indicated by the map legend. The CSR is used to provide a relative ranking system of soils based upon their potential use for intensive row crop production. Soils with no physical limitations for row crop production will rate 100, while very poor soils with severe limitations such as steep slope may only rate a 20. Currently, Cedar County considers soils having a CSR of 75 or greater to be an important part of the agricultural economy and should be preserved unless certain exceptions apply. The majority of the County area is covered by soils having CSR of 75 or greater. Many of the areas with a lower CSR are located near the areas with the steepest slopes shown on Map 1. Both Maps 1 and 2 follow this page.


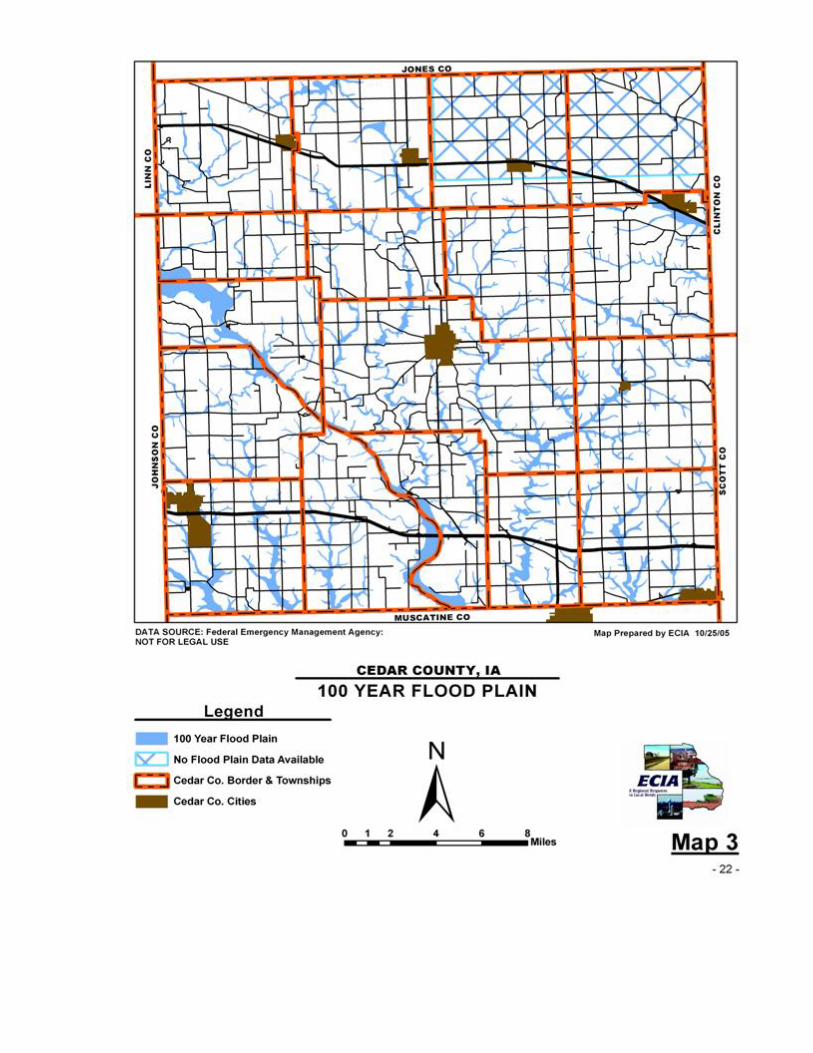
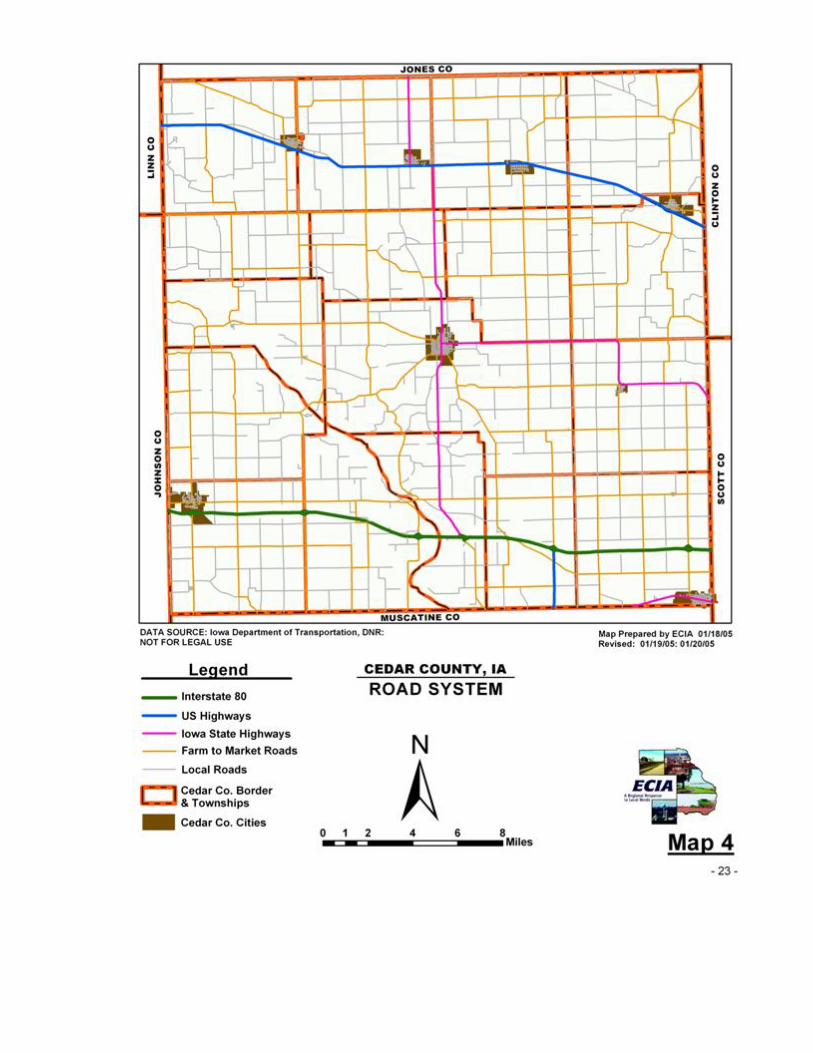
MAP 3 – CEDAR COUNTY 100-YEAR FLOOD PLAIN, displays Cedar County’s mapped 100-year flood plain areas. These flood areas are based on maps provided by the Federal Emergency Management Agency (FEMA). The 100-year flood plains are located throughout the County, with the largest flood plain being along the Cedar River. These flood plains reflect most of river and stream valleys shown on the County slope (Map 1). The majority of areas in Dayton and Massillon Townships have not had the flood plains mapped by FEMA and therefore are not shown on the map. Map 4 – CEDAR COUNTY ROAD SYSTEM, displays the Cedar County Road System. The road system is not a feature of the natural environment, but is greatly influenced by that environment, and once constructed and improved, the road system becomes part of the physical setting and influences the location of development. The majority of the County’s road system follows the conventional grid pattern found throughout Iowa. Other segments of the road system have been located due to the influences of steep slopes and rivers, especially in the southwest quarter of the County. Map 3 also identifies the Functional Classification of the road system throughout Cedar County. Both Maps 3 and 4 follow this page.

General County Development Trends The purpose of this section is to review and assess development trends related to the use of land in Cedar County. This review provides interpretations of the information displayed in the following tables and maps included in this section. Overall, the primary use of land in the County is agriculture. Table 15 – CEDAR COUNTY BUILDING PERMIT SUMMARY 1990 – 2000, was complied from the records of the Cedar County Zoning Office. The table displays an annual summary of the number of building permits and acreages involved for each use classification (residential, commercial, industrial) between 1980 and 2000 inclusive in the unincorporated area of the County.
Year
1980 15 (26 Acres) ------------ 1 ( 5 A.)1981 11 (30 Arces) ------------ 5 (19 A.)1982 7 (21 Acres) 1 (80 A.) Golf Course 8 (38 A.)1983 14 (45 Acres) ------------ 3 (11 A.)1984 12 (27 Acres) ------------ 4 (14 A.)
1985 11 (58 Acres) 1 ( 6 A.) Wal Mart ------------1986 1 ( 1 Acres) 1 ( 1 A.) 2 ( 1 A.)1987 11 (34 Acres) ------------ 1 ( 7 A.)1988 9 (23 Acres) 1 ( 1 A.) 4 (16 A.)1989 11 (35 Acres) ------------ 1 (40 A.) Pioneer
1990 9 (24 Acres) ------------ ------------1991 13 (42 Acres) ------------ 1 ( 0 A.)1992 16 (63 Acres) 2 ( 2 A.) 1 ( 4 A.)1993 16 (41 Acres) 1 ( 6 A.) 2 ( 3 A.)1994 28 (77 Acres) ------------ 2 (11 A.)
1995 30 (109 Acres) ------------ 1 ( 3 A.)1996 36 (73 Acres) 2 (10 A.) 2 ( 6 A.)1997 46 (113 Acres) ------------ 1 ( 1 A.)1198 29 (79 Acres) 9 (42 A.) 2 ( 5 A.)1999 21 (87 Acres) 10 (101 A.) 2 (16 A.)2000 35 (176 Acres) 7 (121 A.) 3 (23 A.)
Total 381 (1,184 Acres) 35 (370 A.) 46 (223 A.)
CEDAR COUNTY BUILDING PERMIT SUMMARY 1980 - 2000Table 15
Source: Cedar County Environmental and Zoning Dept.
Residential Industrial Commerical

The summary indicates that there were far more residential building permits (and acreages) than commercial or industrial. Also indicated is that the number of residential building permits decreased through the second half of the 1980’s and then started to rebound in the 1990’s that continued to increase through 2000. Table 16 – CEDAR COUNTY REZONING SUMMARY 1980 – 2000, was also complied from the records of the Cedar County Zoning Office. The table displays a summary of the number of rezonings from agriculture, including the acreages involved for each basic zoning district category between 1980 and 2000 inclusive in the unincorporated area of the County.
Acres
635
159 (AR -1 District created 1996)
45 (by Special Exceptions)
12
616 (IBP 488 acres)
1,467
19
215
CEDAR COUNTY REZONING SUMMARY 1980 - 2000
176
2
8
10
Table 16
DistrictNumber of Rezoning
Source: Cedar County Environmental and Zoning Dept.
Residential
Ag./Recreational
Ag. Business
Commercial
Industrial
Total
The summary indicates that there were far more rezoning to residential than to any other zoning district. The number of acres rezoned to industrial includes a large rezoning for IBP, which was never used.

Residential, Commercial, and Industrial Development Trends
The following development trend maps provide more detail about the location and intensity of rezoning and building permits in the unincorporated area of Cedar County. These maps display data at the section level from 1990 to 2002 inclusive, and were compiled from the records of the Cedar County Zoning Office. The vast majority of these rezoning were used to change agriculturally zoned land to another zoning district. Both Map 5 - CEDAR COUNTY RESIDENTIAL REZONING 1990 - 2002 and Map 6 - CEDAR COUNTY RESIDENTIAL BUILDING PERMITS 1990 - 2000 display the distribution and intensity of residential rezoning by acre and the number of building permits in the County. Both maps are located after this page. Both Maps 5 and 6, when compared, show development occurring near the same locations. These general patterns indicate that residential development since 1990 has primarily occurred throughout the southwest quarter of the County, near the south County boundary towards the southeast corner, and near the County’s northwest corner. These development patterns may be divided into three different types of residential development clusters based on their location – 1) urban fringe areas, 2) rural unincorporated communities, and 3) rural areas. The first group of residential clusters surrounds most of the incorporated cities within their two-mile urban fringe areas. Those fringe areas containing the greatest amounts of acreage rezoned to residential, as well as more residential building permits since 1990, are located near the Cities of Tipton, West Branch, Durant and Wilton. Because such developments are near cities, it is possible that these areas may be annexed and provided municipal services in the future. The second group of residential clusters having high amounts of rezoned acreage and building permits since 1990 are located adjacent to previously existing rural unincorporated communities. These growing rural unincorporated community clusters include both Springdale and Lime City near Interstate 80, as well as Rochester, Cedar Valley, Buchanan, and Cedar Bluff all located near the scenic corridor along the Cedar River. Such unincorporated communities do not provide typical municipal services, relying primarily on individual septic and well systems. The third group of residential clusters, which have fairly high amounts of rezoned acreage and building permits since 1990, are located in rural areas. Such clusters are located in various areas of the County, which include:
- Along Interstate 80 near the Cedar River. - North of Wilton and West of Sunbury approximately 3 miles. - Southwest of Tipton between the City and the Cedar River. - Near the County’s west boundary between the Cedar River and West Branch. - Along the County’s west boundary near and south of Hwy 30.


Depending somewhat on the size of these rural developments clusters, they may rely on community well or septic systems, or individual systems. If community well or septic systems are constructed, they are usually operated and maintained by homeowner’s associations. In addition, if a development is of sufficient size, it may contain an internal street system, which is also usually maintained by a homeowner’s association. No matter what type of the three residential clusters exists in Cedar County, the location of some of these residential developments is influenced by the cities and employment opportunities in surrounding counties. To the southwest are Johnson County and the Iowa City metropolitan area less than 10 miles from West Branch. To the northwest are Linn County and the Cedar Rapids metropolitan area within approximately 15 miles of the Cedar County boundary. To the south are Muscatine County, and the City of Muscatine 8 miles from the north edge of Wilton. To the east are Scott County and the City of Davenport (Quad Cities) Metropolitan area less than 15 mile from Durant. These nearby locations in outlying metropolitan areas have initiated “bedroom community” areas in Cedar County. The majority of these bedroom communities appear to the primarily located near the County’s western and southern boundaries. These bedroom communities are located in all three types of residential development clusters – 1) urban fringe areas, 2) rural unincorporated communities, and 3) rural areas. Interstate 80, State Highways 30, 38,130, and 927, as well as most of the County’s Farm to Market Road System, help facilitate the travel to and from these bedroom community areas (see Map 4). This is not to say that Cedar County does not contain its own industrial and commercial employment base, rather, the nearness and transportation systems to the outlaying and large metropolitan areas has great influence on Cedar County’s development patterns. Another comparison of the distribution and intensity of residential rezoning and building permits (Maps 5 & 6) is important to make. When these maps are compared to the Corn Suitability Map ( Map 2), it shows that nearly all the residential rezoning and the majority of residential building permits have not been located on soils having a CSR of 75 or greater (the green area on the map). This is important, and reinforces that the primary natural resource and economic base of Cedar County is agriculture, and that this resource is being spared from the majority of residential development.

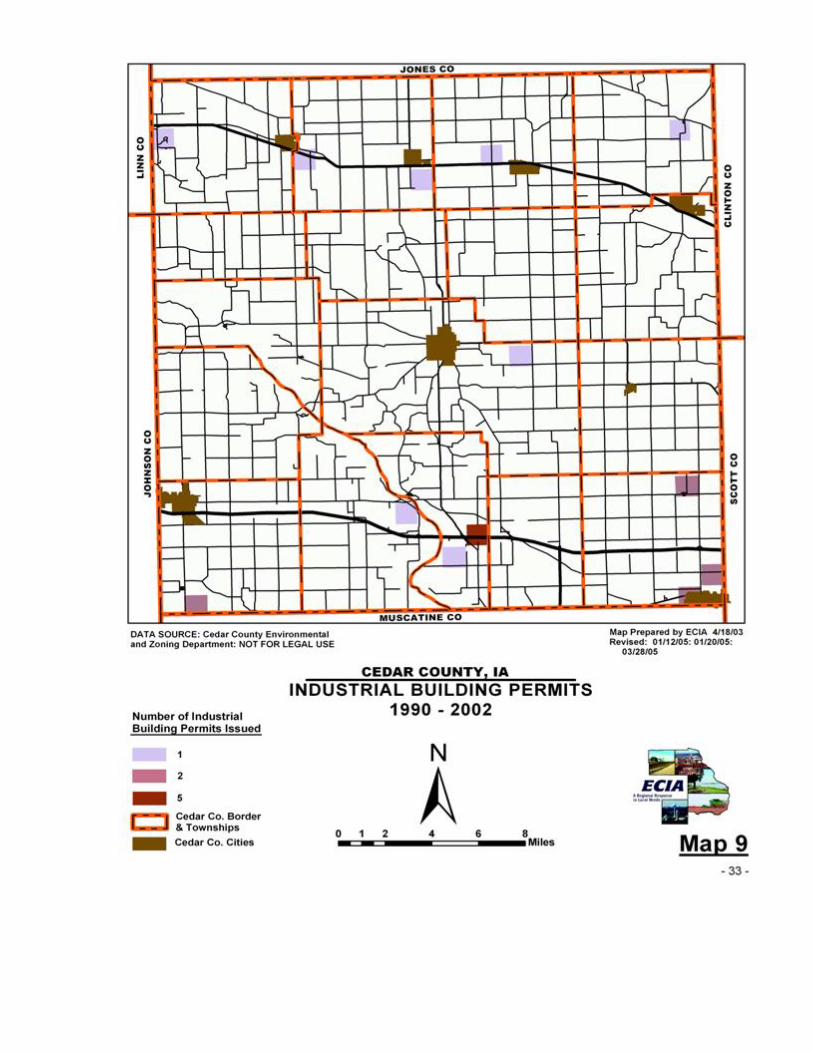
Map 7 – CEDAR COUNTY COMMERCIAL / MANUFACTURING REZONING 1990 – 2002, displays the distribution and intensity of both commercial and manufacturing rezoning by acre over that time period. Map 8 – CEDAR COUNTY COMMERCIAL BUILDING PERMITS 1990 – 2002 and Map 9 – CEDAR COUNTY INDUSTRIAL BUILDING PERMITS 1990 – 2002, both display the distribution and intensity of the number of commercial and industrial building permits between 1990-2002. All three maps on the following pages, when compared, show similar development location patterns. These general patterns indicate that rural commercial and industrial development since 1990 are primarily located in the Tipton area, the Interstate 80 corridor, and along the Highway 30 corridor. Such types of development by their nature, are located adjacent to primary roadways. The Interstate 80 corridor contains the majority of both commercial and industrial building permits issued during this time frame. The rural area surrounding Tipton contains several commercial building permits, but only one industrial permit during this time frame. Maps 7, 8 and 9 follow this page.


E. CEDAR COUNTY FUTURE LAND USE
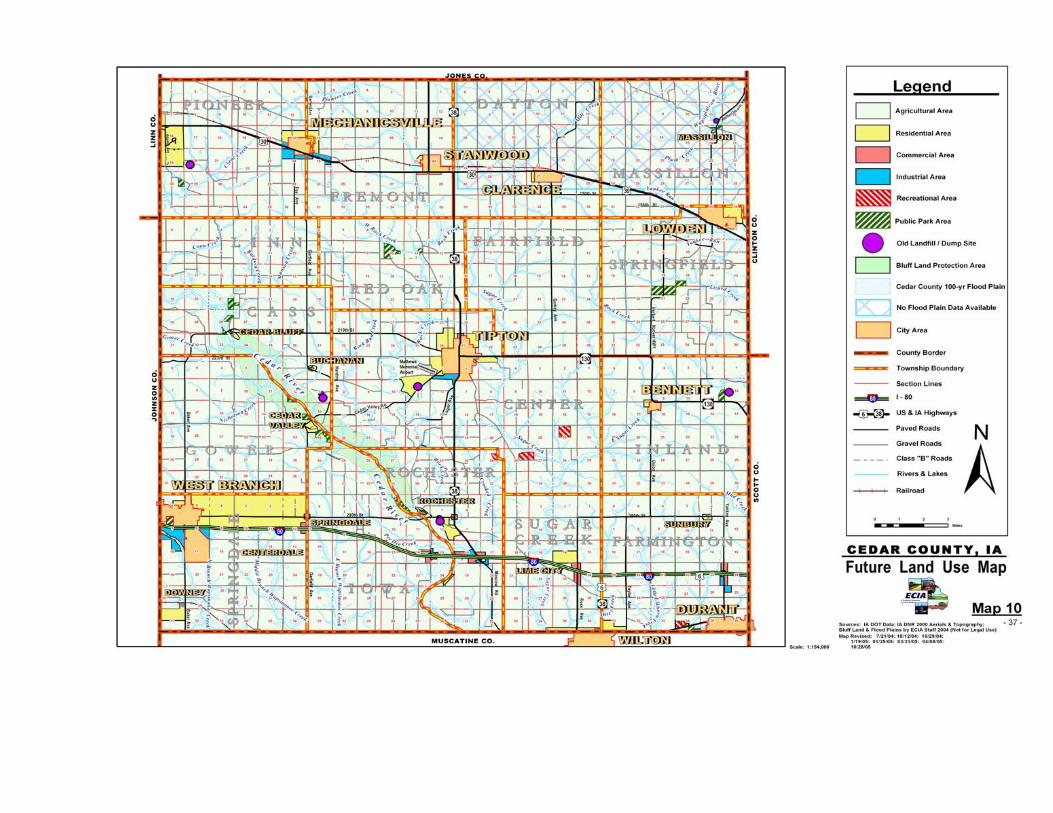
The intent of this document, the Cedar County Land Use Plan 2006, is to provide a publicly approved guide for the future development of the County. MAP 10 – CEDAR COUNTY FUTURE LAND USE MAP, provides a visual display of that future guide to development, and is located at the end of this section. The Future Land Use Map, along with the Land Use Plan’s Goals, Objectives, and Policies, are to help make public and private land use development decisions for such actions as the rezoning and subdivision of land. The Future Land Use Map shows the location of the preferred land uses Cedar County has agreed is best for the County’s future. These preferred land uses are located in the unincorporated areas of the county and include the following uses. Future Land Use Map Areas 1. Agricultural Area
The Agricultural Area is established for agricultural activities such as the various types of farming, as well as directly related commercial and industrial activities that support the farming community. The Agricultural Area covers the majority of the Land Use Map and reflects Cedar County’s primary natural resource and economy.
2. Residential Area The Residential Area is established to indicate generally suitable locations for residential
development. The Residential Areas are located near incorporated cities, some rural unincorporated communities, and certain rural areas that have developed over time due to their location.
3. Commercial Area The Commercial Area is established to indicate generally suitable locations for various types
of commercial activities. The Commercial Areas are primarily located near a few cities and several key interchanges along Interstate 80.
4. Industrial Area The Industrial Area is established to indicate generally suitable locations for industrial and
manufacturing activities, and supporting activities such as warehousing and trucking facilities. The industrial Areas are primarily located near cities and several key interchanges along Interstate 80.

5. Recreational Area The Recreational Area is established to indicate generally suitable locations for private
recreational facilities such as golf courses. The Recreational Areas may be found in various locations across the County.
6. Public Park Area The Public Park Area is established to indicate generally suitable locations for public parks.
The Public Park Areas may be found in various locations across the County. 7. Bluff Land Protection Area
The Bluff Land Protection Area is established to indicate areas providing unique environmental character that require special protection in order to be preserved. Development is allowed within the Bluff Land Protection Area, but the location, height, or site improvement of such development may be limited. The Bluff Land Protection Area is located along the Cedar River between the unincorporated communities of Cedar Bluff and Rochester.
Other areas are also shown on the Future Land Use Map in the unincorporated areas of the County. These areas indicate Old Landfill / Dump sites and the 100-Year Flood Plain. Such areas are to be considered as constraints on future development and are to be avoided.

Future Land Use Plan and Map Review and Amendment Cedar County’s Land Use Plan 2006 and Future Land Use Map are intended to be dynamic documents that respond to changing needs and conditions. In order to access the Plan’s and Map’s effectiveness in responding to changing conditions, the County will need to monitor actions affecting both. As a result of these monitoring efforts or private development requests, the County may need to amend the Plan and Map periodically. Any proposed Plan or Map amendments should be considered carefully to determine if the proposed amendment is consistent with the Plan’s Goal and Policies. A formal review process will provide a mechanism to help assure the Plan and Map remain current with changing conditions. The County should review the Plan and Map, perhaps every few years, and measure the County’s success in achieving the Plan’s goals. Also, the County should evaluate growth trends and compare these trends to the Plan’s projections or indicated growth areas. The results of these reviews and evaluations will indicate the County’s progress in achieving the Plan’s goals, and also provide an opportunity to amend the Plan’s policies to better achieve the wanted outcome. Also, Future Land Use Map amendments that support the Plan’s goals and policies may be justified as growth occurs and market conditions change. Land Use Map amendments may occur more frequently than policy changes, but they must remain in support the Plan’s goals in order to reduce the potential for unintended policy shifts. Any amendment to the Cedar County Land Use Plan 2006 and Future Land Use Map must first go through a public hearing process lead by the Planning and Zoning Commission, and adopted by the Board of Supervisors. Both the Land Use Plan and Future Land Use Map are amended by resolution of the Cedar County Board of Supervisors