cecl methodology series for consumer loan pools
TRANSCRIPT

Garver MoorePrincipal - Advisory Services
CECL Methodology Series
Consumer CreditJanuary 26, 2017
P R E S E N T E D B Y
Neekis Hammond, CPAPrincipal - Advisory Services

About the Webinar
2
• Ask questions throughout the session using the GoToWebinar control panel
• We will answer as many questions as we can at the end of the presentation

About Sageworks
• Risk management thought leader for institutions and examiners
• Regularly featured in national and trade media
• Loan portfolio and risk management solutions
• More than 1,000 financial institution clients
• Founded in 1998
3
Disclaimer
This presentation may include statements that constitute “forward-looking statements” relative to publicly available industry data. Forward-looking statements often contain words such as “believe,” “expect,” “plans,” “project,” “target,” “anticipate,” “will,” “should,” “see,” “guidance,” “confident” and similar terms. There can be no assurance that any of the future events discussed will occur as anticipated, if at all, or that actual results on the industry will be as expected. Sageworks is not responsible for the accuracy or validity of this publicly available industry data, or the outcome of the use of this data relative to business or investment decisions made by the recipients of this data. Sageworks disclaims all representations and warranties, express or implied. Risks and uncertainties include risks related to the effect of economic conditions and financial market conditions; fluctuation in commodity prices, interest rates and foreign currency exchange rates. No Sageworks employee is authorized to make recommendations or give advice as to any course of action that should be made as an outcome of this data. The forward-looking statements and data speak only as of the date of this presentation and we undertake no obligation to update or revise this information as of a later date.
4

About Today’s Presenters
Principal – Advisory Services
5
G A RV E R M O O R E
Principal – Advisory Services
N E E K I S H A M M O N D , C PA

ASU 326 (CECL)
RE:
• “CECL is being delayed…”
• “New administration will abolish CECL with regulatory reform…”
• “ABA advocating to delay implementation…”

ASU 326 (CECL)

Agenda
• Series Overview
• Consumer Segmentation Principles
• Consumer Sub-segmentation Principles
• Methodologies and Calculations
» Guidance Considerations
» Loss-Rate & Roll-Rate
» Vintage
» PD/LGD (Probability of Default/Loss Given Default)
» DCF (Discounted Cash Flow)
• Questions

CECL Methodology Series
• Thursday, January 26: Consumer Pool CECL Methodologies
• Thursday, February 9, 2017, 2-3 p.m.: C&I Pool CECL Methodologies
• Thursday, February 16th, 2017, 2-3 p.m.: CECL Methodology Q&A
• Thursday, February 23, 2017, 2-3 p.m.: Unfunded Commitments & Construction Loan CECL Methodologies
• Thursday, March 9, 2017, 2-3 p.m.: Forecasting with CECL
• Thursday, March 16th, 2017, 2-3 p.m.: CECL Calculations in a Software Environment
• Thursday, March 23, 2017, 2-3 p.m.: Disclosures with CECL
Sign up at: web.sageworks.com/cecl-methodology-webinar-series/

Considerations for Initial Segmentation (ASU 326-20-55-5,12,15)
Segmentation.
• Payment Structure
» Interest Only, Balloon, Amortizing, etc.
• Contract Term
» 30 yr., 15 yr., 3/1 or 5/1 ARM, Revolving, etc.
• Interest Rate
» Fixed/Variable
• Exposure Type
» 1st Lien Residential, 2nd Lien Residential, HELOC, New Auto, Used Auto, Unsecured, etc.

Next Step; Include Risk Characteristic (ASU 326-20-55-5,12,15)
Sub-segmentation.
• Internal/External credit score or credit rating
» Origination (Vintage), Most Recent (Other Methodologies)
• Classification
» Pass, Special Mention, Substandard, Doubtful, Loss
• Past Due/Payment Behavior
» Days, Times, Combination/Formulaic
• Geography
» Is this truly predictive of future losses?
• Key – ACCURATE data as of specific points-in-time over n historical periods CRITICAL

Considerations - From the Guidance (ASU 326-20-55-6,7)
Methodology.
“Estimating expected credit losses is highly judgmental and generally will require an entity to make specific judgments. Those judgments may include any of the following:”
B. Approach to measuring historical loss amount
C. Approach to determine the appropriate historical period
D. Approach to adjusting credit loss to reflect current and forecasted conditions (economic cycle)
E. Methodology
F. Method for adjusting for recoveries
G. How expected prepayments affect the estimate
I. The assessment of whether financial assets exhibits risk characteristics similar to other assets
* Letter convention references ASU 326-20-55-6,7

Considerations – Historical Loss Experience (ASU 326-20-30-3)
Methodology.
“The allowance for credit losses may be determined using various methods. For example, an entity may use discounted cash flow methods, loss-rate methods, roll-rate methods, probability of default methods, or methods that utilize an aging schedule:”
• Loss-rate-method: Net charge-offs/average balance is of little worth. Cumulative loss rates are appropriate. For more information: http://web.sageworks.com/CECL-Historical-Loss-Misconceptions/
• Roll-rate-method: Net change in balances assumed to indicate migration through default to loss
• Vintage: Suitable for installment loans; not for revolving credits.
• PD & LGD: Probability of defaulting over how many periods? Alignment between the life of the asset and the probability that a loan will default is a common error in logic.
• DCF: Inputs prior to executing amortization schedules require models as well; loss-rate or probability-of-default, prepayment, loss-given-default, recovery lag, etc.

Poll Question.

Fundamental Principles
Cumulative Loss-Rate.
• WRONG: Average Annual Loss-Rates (Chargeoffs or Net Chargeoffs/Average Balance)
» Numerator polluted with subsequent originations
» Denominator polluted with subsequent originations and exits
• RIGHT: Cumulative Loss-Rate (ASU 326-20-55-20)
» Numerator includes cumulative losses specific to a pool of loans
» Denominator includes the balance specific to a pool of loans
• Loan-Level Detail is required
» Required in order to link chargeoffs and recoveries to loans within a specific pool

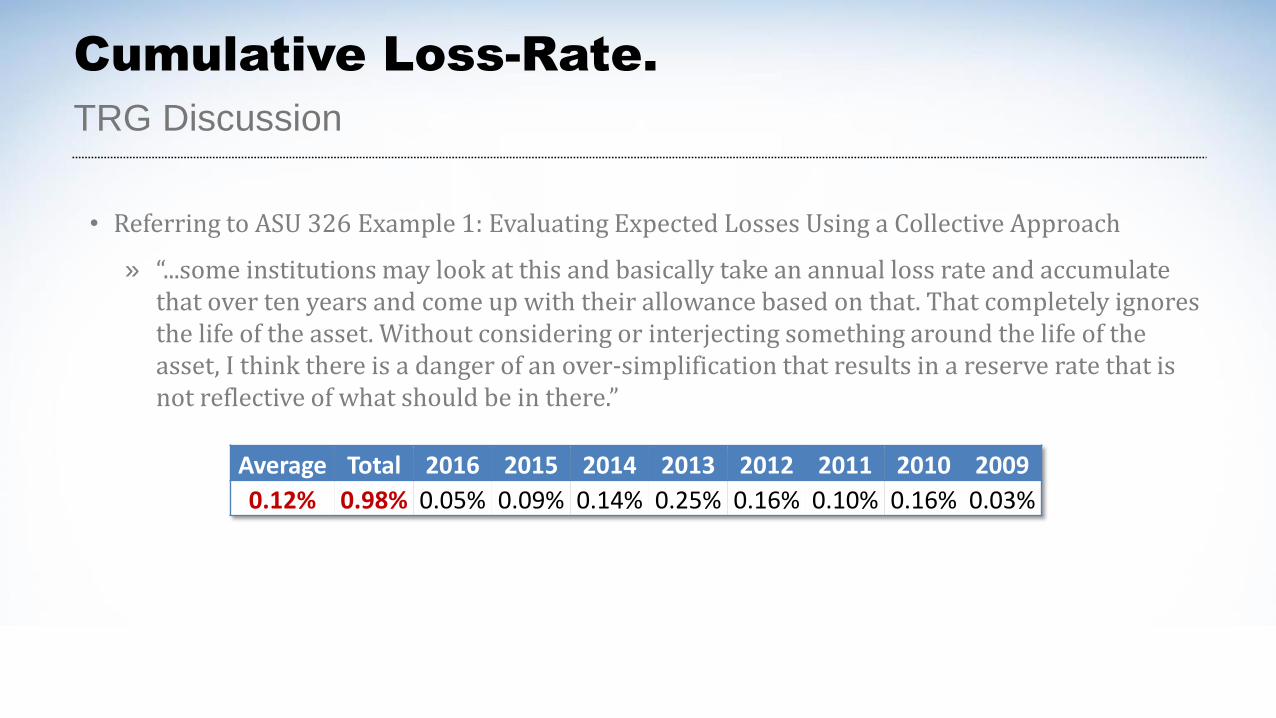
• Referring to ASU 326 Example 1: Evaluating Expected Losses Using a Collective Approach
» “...some institutions may look at this and basically take an annual loss rate and accumulate that over ten years and come up with their allowance based on that. That completely ignores the life of the asset. Without considering or interjecting something around the life of the asset, I think there is a danger of an over-simplification that results in a reserve rate that is not reflective of what should be in there.”
TRG Discussion
Cumulative Loss-Rate.
Average Total 2016 2015 2014 2013 2012 2011 2010 2009
0.12% 0.98% 0.05% 0.09% 0.14% 0.25% 0.16% 0.10% 0.16% 0.03%

TRG Discussion (Continued)
Cumulative Loss-Rate.
2015 2014 2013 2012 2011 2010 2009 2008 2007 2006 2005 2004
Annual Loss Rate 0.05% 0.09% 0.14% 0.25% 0.16% 0.10% 0.16% 0.03% 0.00% 0.00% 0.00% 0.00%
Rolling 5-Year Aggregate 0.69% 0.74% 0.81% 0.70% 0.45% 0.29% 0.19% 0.03%
5-Year Average 0.14% 0.15% 0.16% 0.14% 0.09% 0.06% 0.04% 0.01%
2015 2014 2013 2012 2011 2010 2009 2008 2007 2006 2005 2004
1,604,453 1,384,820 909,800 999,629 932,531 756,666 431,117 315,862 227,040 213,321 226,860 206,417
.04%.40%
.75%1.27%
.89%
.25%.35%
.65%

Example Inputs and Outputs
Cumulative Loss-Rate.

Example Inputs and Outputs
Cumulative Loss-Rate.
0.00%
0.50%
1.00%
1.50%
2.00%
2.50%
0
50,000
100,000
150,000
200,000
250,000
300,000
350,000
400,000
450,000
500,000
Tho
usa
nd
s
Chargeoffs Balance Loss %
Roll-Rate.
Fundamental Principles
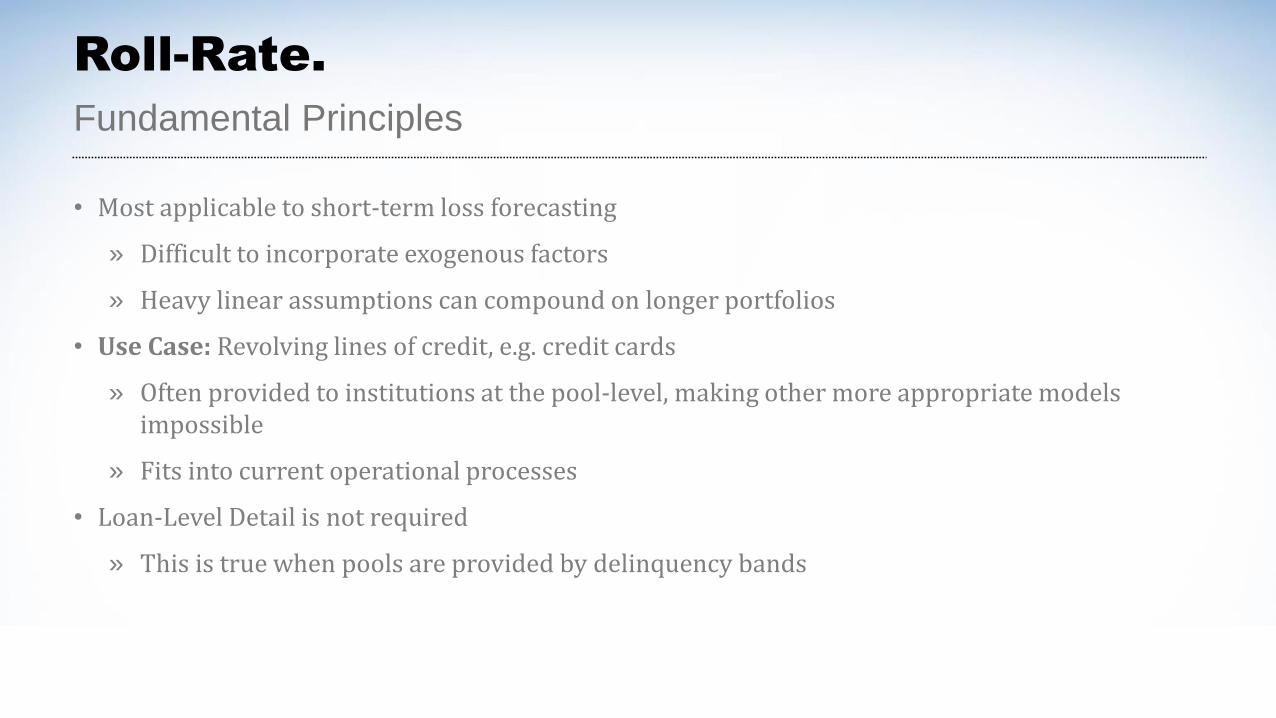
• Most applicable to short-term loss forecasting
» Difficult to incorporate exogenous factors
» Heavy linear assumptions can compound on longer portfolios
• Use Case: Revolving lines of credit, e.g. credit cards
» Often provided to institutions at the pool-level, making other more appropriate models impossible
» Fits into current operational processes
• Loan-Level Detail is not required
» This is true when pools are provided by delinquency bands

Month Balance 30 Days Roll-Rate 60 Days Roll-Rate 90 Days Roll-Rate >90 Days Roll-Rate Loss Factor12/31/2014 1,000 39 12 9 8
3/31/2015 1,100 40 4.0% 15 38.5% 10 83.3% 8 88.9% 1.14%6/30/2015 1,250 50 4.5% 20 50.0% 12 80.0% 9 90.0% 1.64%
9/30/2015 1,200 65 5.2% 28 56.0% 17 85.0% 11 91.7% 2.27%12/31/2015 1,056 45 3.8% 17 26.2% 11 39.3% 15 88.2% 0.34%
3/31/2016 1,061 43 4.1% 16 35.6% 17 100.0% 10 90.9% 1.32%
6/30/2016 1,218 45 4.2% 24 55.8% 9 56.3% 15 88.2% 1.17%9/30/2016 1,190 64 5.3% 14 31.1% 14 58.3% 8 88.9% 0.85%
12/31/2016 1,131 41 3.4% 22 34.4% 16 114.3% 13 92.9% 1.26%
Roll-Rate.
Example – Current GAAP (ASC 450-20)

Month Balance 30 Days Roll-Rate 60 Days Roll-Rate 90 Days Roll-Rate >90 Days Roll-Rate Loss Factor12/31/2014 1,000 39 12 9 8
3/31/2015 1,100 40 4.0% 15 38.5% 10 83.3% 8 88.9% 1.14%6/30/2015 1,250 50 4.5% 20 50.0% 12 80.0% 9 90.0% 1.64%
9/30/2015 1,200 65 5.2% 28 56.0% 17 85.0% 11 91.7% 2.27%12/31/2015 1,056 45 3.8% 17 26.2% 11 39.3% 15 88.2% 0.34%
3/31/2016 1,061 43 4.1% 16 35.6% 17 100.0% 10 90.9% 1.32%
6/30/2016 1,218 45 4.2% 24 55.8% 9 56.3% 15 88.2% 1.17%9/30/2016 1,190 64 5.3% 14 31.1% 14 58.3% 8 88.9% 0.85%
12/31/2016 1,131 41 3.4% 22 34.4% 16 114.3% 13 92.9% 1.26%3/31/2017 751 49 4.3% 17 40.9% 17 77.1% 14 90.0% 1.22%
6/30/2017 483 33 4.4% 20 41.2% 13 76.3% 15 90.1% 1.23%9/30/2017 301 21 4.3% 13 40.1% 15 75.8% 12 90.1% 1.19%
12/31/2017 182 13 4.2% 8 38.2% 10 74.7% 14 89.9% 1.08%
3/31/2018 108 8 4.3% 5 39.7% 6 79.1% 9 90.1% 1.21%6/30/2018 64 5 4.3% 3 40.2% 4 76.5% 6 90.0% 1.19%
9/30/2018 *immaterial 3 4.3% 2 38.2% 2 79.0% 3 90.2% 1.18%
Roll-Rate.
Example – Future GAAP (ASU 326)

Roll-Rate.
Example – Future GAAP (ASU 326)
Month Balance 30 Days Roll-Rate 60 Days Roll-Rate 90 Days Roll-Rate >90 Days Roll-Rate Loss Factor Loss 3/31/2017 751 49 4.3% 17 40.9% 17 77.1% 14 90.0% 1.22% 14
6/30/2017 483 33 4.4% 20 41.2% 13 76.3% 15 90.1% 1.23% 9 9/30/2017 301 21 4.3% 13 40.1% 15 75.8% 12 90.1% 1.19% 6
12/31/2017 182 13 4.2% 8 38.2% 10 74.7% 14 89.9% 1.08% 3 3/31/2018 108 8 4.3% 5 39.7% 6 79.1% 9 90.1% 1.21% 2 6/30/2018 64 5 4.3% 3 40.2% 4 76.5% 6 90.0% 1.19% 1
9/30/2018 *immaterial 3 4.3% 2 38.2% 2 79.0% 3 90.2% 1.18% 1 Total 130 68 67 73 36
Rate 11.5% 6.0% 6.0% 6.4% 3.2%

Poll Question.
Fundamental Principles
Vintage.
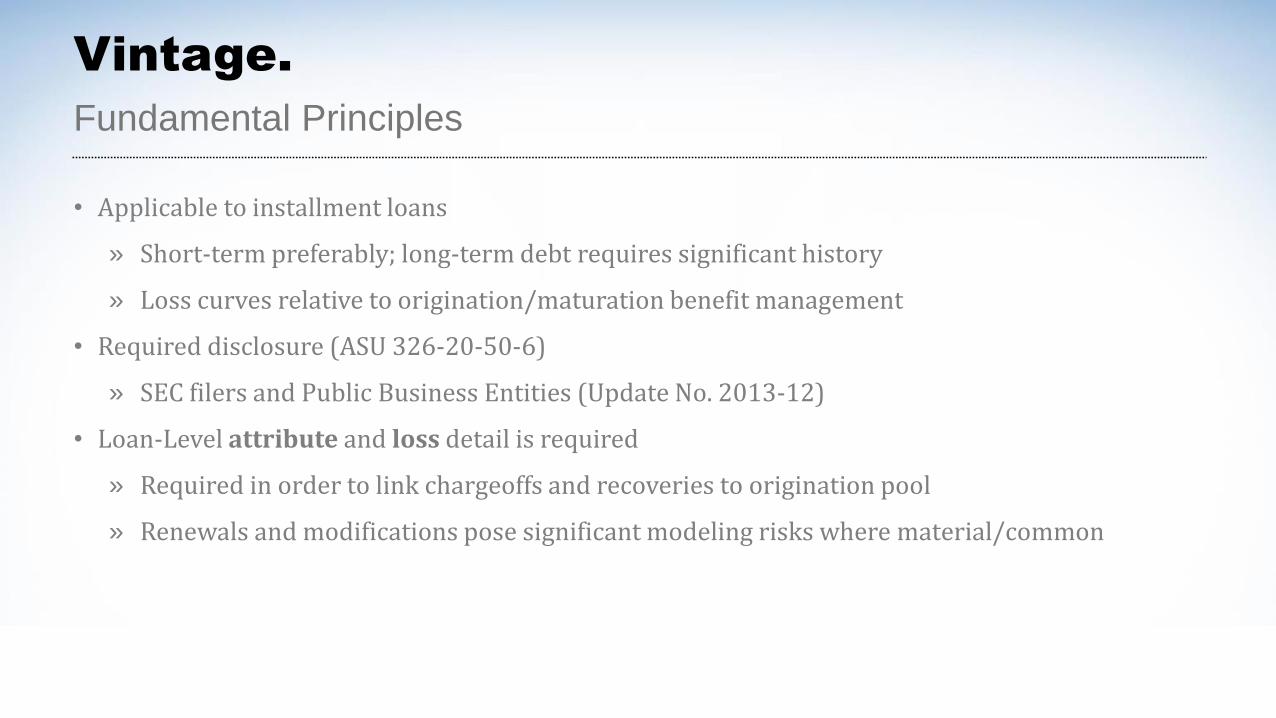
• Applicable to installment loans
» Short-term preferably; long-term debt requires significant history
» Loss curves relative to origination/maturation benefit management
• Required disclosure (ASU 326-20-50-6)
» SEC filers and Public Business Entities (Update No. 2013-12)
• Loan-Level attribute and loss detail is required
» Required in order to link chargeoffs and recoveries to origination pool
» Renewals and modifications pose significant modeling risks where material/common

Example Inputs and Outputs
Vintage.

Example Inputs and Outputs
Vintage.

Example Inputs and Outputs
Vintage.

Example Inputs and Outputs
Vintage.

Example Inputs and Outputs
Vintage.

Fundamental Principles
PD & LGD.
• Probability of Default and Loss Given Default
» PD analysis first requires an understanding of “contractual life” at the pool or loan-level
» LGD requires symmetry with PD analysis; of all loans that defaulted, what was the loss rate at the loan-level
• Material input into other more flexible models (Discounted Cash Flow)
• Loan-Level attribute, default, and loss detail is required
» Required in order to identify defaults, the timing of the default, the exposure, loss amount, and loss timing
• Misuse and material errors in modeling logic are very common – know what you’re attempting to accomplish

FICO Band
Example Inputs and Outputs
PD & LGD.

Example Inputs and Outputs
PD & LGD.

Example Inputs and Outputs
PD & LGD.
Greater Than 675
575 to 675
Less Than 575
Unknown
Default State

Example Inputs and Outputs
PD & LGD.
Greater Than 675
575 to 675
Less Than 575
Unknown
Default State

Example Inputs and Outputs
PD & LGD.
0.0%
10.0%
20.0%
30.0%
40.0%
50.0%
60.0%
70.0%
80.0%
90.0%
100.0%
575 to 675 Greater than 675 Less Than 575

Example Inputs and Outputs
PD & LGD.
0.0%
10.0%
20.0%
30.0%
40.0%
50.0%
60.0%
70.0%
80.0%
90.0%
100.0%
575 to 675 Greater than 675 Less Than 575
• PD Criteria inversely related to LGD – Push/Pull

Poll Question.

Fundamental Principles
DCF.
• Go-forward Analysis
» Input periodic default, loss, prepayment, contractual, and collection assumptions and amortize each credit accordingly
• Discount Expected Cash Flows
» Cash flows are discounted at the instrument level then aggregated into a pool for total NPV
• Timing vs. Credit
» Period to period, institutions will see fluctuation in NPV for timing related items. Such items can be recorded as interest income. Institutions must disclose this amount

DCF.
Pros and Cons
• Pros
» Best Feedback Loop – Production and yield are great, but NPV represents how great
» Cross Application – Classification and Measurement; simply adjust discount rate assumptions for fair value. 310-30 updating accretable yield/expected cash flows can be facilitated with minimal changes to assumptions/inputs
» Increased Forecast Flexibility – Period level forecasts can be performed under this approach. In other words, one can model a rise and fall in unemployment rate and correlate the impact to losses
• Cons
» Less Practical – more difficult to perform than PD & LGD and/or DCF

Example Inputs and Outputs
DCF.

Example Inputs and Outputs
DCF.

Example Inputs and Outputs
DCF.
Date NPER/Period Beginning Balance Principal Interest PrepaymentDefaulted Principal Estimated Loss
Estimated Recovery
End of Month Balance Cash Flow
TOTAL 903,989,324 118,343,162 612,879,479 46,443,050 4,644,305 41,798,745 1,677,010,710
- (1,563,311,854) (1,563,311,854)
12/31/2015 1 1,563,311,854 10,763,327 4,879,366 40,485,455 1,914,877 191,488 - 1,510,148,194 56,128,148
1/31/2016 2 1,510,148,194 10,929,260 4,713,433 38,576,701 1,849,758 184,976 - 1,458,792,475 54,219,394
2/29/2016 3 1,458,792,475 11,089,550 4,553,143 36,732,858 1,786,853 178,685 - 1,409,183,213 52,375,551
3/31/2016 4 1,409,183,213 11,244,389 4,398,304 34,951,719 1,726,087 172,609 - 1,361,261,017 50,594,412
4/30/2016 5 1,361,261,017 11,393,963 4,248,730 33,231,151 1,667,388 166,739 - 1,314,968,515 48,873,844
5/31/2016 6 1,314,968,515 11,538,450 4,104,243 31,569,095 1,610,685 161,069 - 1,270,250,286 47,211,788
6/30/2016 7 1,270,250,286 11,678,023 3,964,670 29,963,560 1,555,910 155,591 - 1,227,052,792 45,606,253
7/31/2016 8 1,227,052,792 11,812,850 3,829,843 28,412,625 1,502,999 150,300 - 1,185,324,319 44,055,318
8/31/2016 9 1,185,324,319 11,943,091 3,699,601 26,914,433 1,451,886 145,189 - 1,145,014,908 42,557,126
9/30/2016 10 1,145,014,908 12,068,904 3,573,789 25,467,190 1,402,512 140,251 - 1,106,076,303 41,109,882
10/31/2016 11 1,106,076,303 12,190,438 3,452,255 24,069,163 1,354,816 135,482 - 1,068,461,886 39,711,856
11/30/2016 12 1,068,461,886 12,307,839 3,334,854 22,718,679 1,308,743 130,874 - 1,032,126,625 38,361,372

Outputs
DCF.
Segment Consumer 1-4 RE
GL Balance 1,565,565,815
PV 1,559,569,236
Reserve 5,996,579
Reserve % 0.38%
NPV (Effective) (5,977,900)
NPV (Pricing) 59,902,862
Defaulted Principal 2.98%
Principal 904,883,630
Interest 118,508,137
Prepayment 614,045,605
Estimated Loss 0.30%
Estimated Recovery 41,972,922
Cash Flow 1,679,410,293 $0
$5,000
$10,000
$15,000
$20,000
$25,000
$30,000
$35,000
$40,000
$45,000
THO
USA
ND
S
Prepaid Principal Interest Collection Estimated Default

Poll Question.

Q&A
• Follow up email
• ALLL.com
• SageworksAnalyst.com – latest whitepapers and archived webinars
• SageworksAnalyst.com – product and advisory services information
• Risk Management Summit 2017 –September 24-27 in Denver, CO
57
RESOURCES
Garver MoorePrincipal – Advisory Services
Neekis Hammond, CPAPrincipal – Advisory Services
PRESENTERS