cea - the climate · greenhouse gases (see "the greenhouse effect", pp. 19-24), whether...
TRANSCRIPT

w Observing the past, conserving the future
© French Alternative Energies and Atomic Energy Commission, 2011Communication DivisionHead Office91191 Gif-sur-Yvette – www.cea.fr
ISSN 1637-5408.
15 wThe climate
THE COLLECTION
1 w The atom2 w Radioactivity3 w Radiation and man4 w Energy5 w Nuclear energy: fusion and fission6 w How a nuclear reactor works7 w The nuclear fuel cycle8 w Microelectronics9 w The laser: a concentrate of light10 w Medical imaging11 w Nuclear astrophysics12 w Hydrogen13 w The Sun14 w Radioactive waste15 w The climate16 w Numerical simulation17 w Earthquakes18 w The nanoworld19 w Energies for the 21st century
FROM RESEARCH
TO INDUSTRY
THE CLIMATE MACHINEPREDICTING THE CLIMATE: MODELINGTHE GREENHOUSE EFFECTSTUDYING PAST CLIMATESMONITORING CHANGES TO CLIMATE AND THEENVIRONMENT

Observing the past, conserving the future 15w The climate
w CONTENTS 32
climatology andmeteorology
Before we begin, we need to define thedifference between meteorology and
climatology. Meteorology is the study andforecasting of atmospheric phenomena overshort periods of time, for specific geographicareas. The information dealt with is, therefore,temporary. Climatology investigates sets ofmeteorological conditions which are likely toaffect different regions over long periods oftime. The subject is built upon the foundationsof various natural sciences: geography, geology,physics, chemistry...
"Climate involves changes inmeteorological conditions consideredover the entire planet."
The word "climate" is used to refer to two distinctideas. The more traditional meaning, whichwe learnt in our geography classes, is a propertyof a given location: the Earth is divided intocl imatic areas as a function of themeteorological conditions which dominate thevarious seasons in those regions. The secondmeaning of the word "climate" refers to a globalapproach with respect to time: in this case,we are interested in changes in meteorologicalconditions considered over the entire planetand over long time periods (at least 30 years).It is this second meaning of the word that formsthe subject of this leaflet, a leaflet which aimsto explain how the global climate functions.
THE CLIMATE MACHINE 4The Earth and the Sun 5The multiple aspects 6The atmosphere 7The oceans 10Ocean-atmosphere interactions 12The role of continentalbiosphere 13The role of the cryosphere 14The role of the lithosphere 14
PREDICTING THE CLIMATE:MODELLING 15Long-term forecasts 16Questions of hierarchy 17
THE GREEN-HOUSE EFFECT 19Solar energy… 20
STUDYING PAST CLIMATES 25Nature and its indicators 26Between hot and cold 28The once green Sahara… 30The El Niño example 32
MONITORING CHANGES TOCLMATE AND THEENVIRONMENT 34Meteorological satellites 35The climat of the future 37
w INTRODUCTION 3
The climate
Today, varioustechnologies helpus to understandclimate function.
Observing the past, conserving the future 15w The climate
Design and production: SPECIFIQUE – www.specifique.fr – Cover: PhotoDisc – Illustrations: Yuvanoé Printed by: Imprimerie Sénécaut – 07/2011
© P
hoto
Dis
c - CEA/P
. B
azog
e - CEA
Climate changeimpacts on the entireplanet.

Observing the past, conserving the future 15w The climate
w THE CLIMATE MACHINE 54TO UNDERSTAND THE CLIMATE ON EARTH, WE NEED TODEFINE THE "CLIMATE MACHINE", STARTING BYIDENTIFYING THE SIGNIFICANT PARAMETERS AND THEIRINTERACTIONS.
THE EARTH AND THE SUNThe Earth is a solid rotating ball, enveloped ingas, and covered with water over 70% of its sur-face. The 30% of the surface that projects abovethis water is very unevenly distributed over theglobe, and has a varied topography. The planetreceives its energy from the Sun with a meanpower of 1,368 W/m2 incident at the top of theatmosphere, measured perpendicular to theSun's rays. Since the Earth is a sphere, and onlyhalf of it can be illuminated by the sun at anyone time, the mean energy received at the sur-face of the Earth is 342 W/m2. There is a largedisparity between the equatorial regions where,in the middle of the day, the Sun's rays meetthe surface almost perpendicularly, and thepolar regions, where the glancing impact of theillumination provides only a weak energy per unitsurface area (the word climate comes from theGreek klima which means inclination).The spectrum of radiation originating from thesun consists mainly of wavelengths between 0.2 µm, in the ultra-violet region, and 4 µm inthe infrared. The Earth emits energy back intospace, in the form of infrared rays (from 4 to100 µm).The climate is said to be in “radiative equili-brium” when the amount of (solar) energy itreceives is equal to the amount of energy re-emitted by the Earth in the form of infrared radia-tion (see the chapter below on "The greenhouseeffect"). Such a radiative equilibrium is achie-ved on the global level. In contrast, there is astrong variation between different latitudes: at
Observing the past, conserving the future 15wThe climate
© P
hoto
Dis
c
The climateThe climatemachinemachine
the lowest latitudes, the energy received exceedsenergy radiated back into space. Above latitude35°, the inverse is true. Hence, the surface ofthe Earth is in a radiative disequilibrium at anyindividual location. If no heat transport wastaking place, temperatures would be very muchhigher than we know them to be in the Tropics,and would be lower above latitude 40°; i.e. itwould be warmer in most of Africa and cooler inFrance, for example.The current average meteorological conditionsexist because of the climate machine, whichtransports excess heat from lower latitudes tohigher latitudes.The atmosphere and the oceans transport com-parable amount of energy. According to currentestimates (see diagram p.6), oceanic heat-trans-port dominates at lower latitudes, via the water
Latitude
South North
Radiative balance (W/m2)
80
60
40
20
0
-20
-40
-60
-80
-100
-120
-140
90 60 30 0 30 60 90
THE MEAN ANNUAL RADIATIVEBALANCEThe radiative balance is the difference between theenergy received from the Sun and that emitted backinto space, as a function of latitude. This curve comesfrom the results of the ERBE (Earth Radiation BudgetExperiment, see box on page 6) which since 1984 hasused satellite measurements of the radiation sent fromthe Earth into space (reflected solar radiation andradiation from the ground).

• the formation, thawing, and behavior of ice(cryosphere), both marine (pack ice) and conti-nental (especially, the large ice caps of Green-land and Antarctica). The phenomena governingthe function of the various components of the cli-matic system have very different response times. Hence, mixing in the lower stratosphere occurson a timescale of a day; mixing of oceanic sur-face waters requires one month; one year is needed for dispersal of atmospheric aerosols;decades are required to eliminate certain green-house gases; it takes a millennium for water tocomplete a deep ocea-nic circulation loop andseveral tens of thou-sands of years for thecontinents to achieve isostatic equilibration.
Observing the past, conserving the future 15w The climate
w THE CLIMATE MACHINE 7
Observing the past, conserving the future 15w The climate
6 w THE CLIMATE MACHINE
As well as this large non-uniformity in the times-cales of the phenomena involved, there is also alarge variety in the range of their characteristicdistances: aerosol particles have sub-microndimensions, ice crystals and water droplets inclouds have micrometer dimensions (which deter-mine their radiative heat transfer behavior); themixed layer at the surface of the oceans is around100 meters thick, the ice-caps cover millions ofsquare kilometers and have heights of several kilo-meters; and ocean currents cover distances mea-sured in thousands of kilometers.
cycle and atmospheric heat transport takes overas we move towards the poles.
THE MULTIPLE ASPECTSThe function of the climate machine is regula-ted by the laws of physics (thermodynamics, fluidmechanics, radiative transfer...), as well as che-mistry and biology. It relies on the various phe-nomena which occur within the fluid layers thatenvelop the surface of the Earth:• the two fluid dynamic, of the atmosphere andthe waters of the oceans (hydrosphere);• the physical and chemical processes of thecompounds they contain, and their interactionswith the biosphere (continental vegetation, aqua-tic microorganisms on the ocean surface), in par-ticular, but not uniquely, for the role of photo-synthesis;
H2O
Pole
H2O
Ice caps103 / 106 years
Ocean
Deep ocean 10 years / 1,000 years
Surface waters 1 month / 10 years
Atmosphere 1 day / 10 years
C02, CH4, O31 month / 109 years
Ice 1 month / 10 years
Lithosphere104 / 109 years
Biosphere 1 month / 100 years
A CONTINUOUS INTERACTION
ENERGYTRANSPORTERTransport of energy by the climatemachine (1 petawatt = 1015 watts). The total energy transport ismeasured by satellite. Energytransport by the ocean is deducedfrom meteorological data. Energytransport by the atmosphere isobtained from the difference. Thisenergy transport is considerable.For comparison, man's mean totalannual energy consumption was only15.1012 watts in 2004 (10,000 timesless).
The atmosphere, hydrosphere, biosphereand cryosphere, are continuouslyinteracting through exchanges of matterand energy. However, the phenomena
which they are home to, occur on verydifferent timescales, as shown in the figure.Greenhouse gases (see "The greenhouseeffect", pp. 19-24), whether naturally
occurring or man-made, have very variableatmospheric residence times, from days fortropospheric ozone to a decade formethane and centuries for carbon dioxide.
The continents are floatingto varying degrees on theterrestrial magma, as afunction of their weight.They rise slowly as thisweight diminishes througherosion or large scalethawing of glacial masses.
Almost all the atmospheric phenomena which affect climateoccur in the troposphere.
© P
hoto
Dis
c
6
4
2
0
2
4
680 60 40 20 0 20 40 60 80
Transport towards the north
Transport towards the south
NorthSouth
By the ocean
Total
By the atmosphere
Latitude
Energy transport (petawatts)
Eequator
Energy transferWater transferCarbon transfer

and humidity, provides the equatorial air with thenecessary energy to rise up by humid convectionto the troposphereat an altitude of15 km, generatingintense precipitation. At an attitude of 15 km,
these air masses, largelydrained of moisture, diverge
moving north and south to end up at around lati-tude 30°. Here they descend again, becomingreheated and strongly reducing their relativehumidity. This explains the presence of the greatdeserts in the two hemispheres. The trade windsare pushed towards the West by the "Coriolisforce" (see box above), a manifestation of the factthat the movement is taking place on a rotatingbody.Convection cells are also found at other latitudes(see diagram opposite): Ferrell cells at interme-diate latitudes and polar cells at high latitudes.At intermediate latitudes, these diverse cells leadto westerly winds at the surface and the jetstreams at high altitude. The circulation is stron-gly modulated by Rossby waves, which are aconsequence of the variation of the Coriolis force
• either directly by conduction and turbulence- referred to as sensible heat;• or in the form of infrared radiation, a large frac-tion of which is absorbed by components of thetroposphere;• or in the form of latent heat, through evapo-ration of water from the surface. This heat isreturned when the vapor condenses. The tro-posphere is moved around by a system of windswhose “engine” is powered by heat. The opera-tion of this engine is strongly influenced by therotation of the Earth, and notably by its topo-graphy.
Circulation of the atmosphereThe trade winds are very regular winds comingfrom the northeast in the Northern Hemisphereand from the southeast in the Southern Hemis-phere. Very warm and very dry at the outset, thesewinds pick up moisture as they move along theiroceanic route. They converge in the equatorialregion, where their burden of momentum, heat
THE ATMOSPHEREThe Earth is surrounded by a gaseous envelope,the atmosphere. The main atmospheric pheno-mena which affect the climate, take place in thetroposphere. The stratosphere also plays a rolethrough its involvement in the radiative balance,in normal conditionsthrough absorption ofUV by ozone, but also
inthe presence of sulfate aero-sols (injected into the stratos-phere during major volcaniceruptions). These aerosols actas a parasol, reflecting part of
the Sun's light back into space. The stratosphereis stratified in temperature, from which it getsits name.The troposphere is characterized by a steep ver-tical temperature gradient, due to the fact thatmost of the heat which supplies it, is transmit-ted from the Earth's surface:
w THE CLIMATE MACHINE
Observing the past, conserving the future 15w The climate
9w THE CLIMATE MACHINE
Observing the past, conserving the future 15w The climate
8
Vertical structure of the atmosphere
Typical behavior of the atmospheric circulation
THE CORIOLIS FORCETo an observer in a rotating frame of reference, moving bodies appear to besubject to a force perpendicular to their direction of motion. This force is knownas the Coriolis force. Consider the example of a rotating platform on which two
children are being held upright.One child throws a ball to his friend. Because of the rotation ofthe platform, his friend does notreceive the ball, because it isdiverted by a force perpendicularto its direction of movement. (Thisexperiment can be seen at thePalais de la Découverte - Paris)
The balance of the quantity ofenergy received (from theSun) in comparison to thequantity of energy re-emitted(into space).
A powerfulgreenhouse gas,formed naturally inthe stratosphere andpresent in thetroposphere due tothe effects ofpollution.
Liquid: rain and fog. Solid: snow and hail.
100
80
60
40
20
0
0,001
0,01
0,1
1
10
100
1000
Elevation (km)
Temperature (°C)
Pressure (mbar)
Southern Hemisphere
-80 -60 -40 -20 0 20 40 60 80
Thermosphere
Polar cell
Ferrell cell
Ferrell cell
Hadley cell
Hadley cell
Polar cell
Low pressures
Low pressures
High pressures
High pressures
Tropical convergencezone
60°
30°
0°
30°
60°
Mesopause
Stratopause
Tropopause
Mesosphere
Stratosphere
Troposphere
Polar windsfrom theeast
Winds fromthe west
Trade windsfrom thenortheast
Trade windsfrom thesoutheast
Winds fromthe west
Polar windsfrom theeast
Rising currents Falling currents
Vertical movement of the air due to inhomogeneity in itstemperature and hence its density. Northern Hemisphere

rally less than a kilometer thick), which are dri-ven by the wind. A rotating current (caused bythe Coriolis force) can be found around the cir-cumference of each of the great Ocean basins,running clockwise in the Northern Hemisphereand anticlockwise in the Southern Hemisphere.Another important current, also caused by thewind, encircles the Antarctic continent.Because of their differences in temperature andsalinity, these water masses also have differentdensities. These differences cause another deep
w THE CLIMATE MACHINE
Observing the past, conserving the future 15w The climate
11
Observing the past, conserving the future 15w The climate
w THE CLIMATE MACHINE10
as a function of latitude. These atmosphericinstabilities generate the succession of depres-sions which sweep across the Atlantic and Wes-tern Europe.The diverse meteorological phenomena producedwithin the atmosphere (wind, transport mecha-nisms, precipitation, cloud...) are clearly actorson the climactic stage. Clouds, which are able toabsorb and reflect solar radiation and radiationfrom the ground, play a fundamental role as eitherregulators or amplifiers of the greenhouse effect,depending on their structure and altitude.The various components of the system interactcontinuously. Hence, the winds drive the largeocean currents, whose characteristics are alsorefined by the topography of the oceanic basinand by the rotation of the Earth.
THE OCEANSThe Oceans are a large, salt-water reservoir, whosesurface covers 70% of the Earth to a mean depthof 3.7 km.
Ocean circulationSalinity and water temperature vary from onepoint to another. The water masses circulating inthe world's oceans only mix very slowly with eachother. Because of this, their temperature and sali-nity changes very slowly and this allow oceano-graphers to trace the origins of these watermasses.Ocean water is entrained in great currents whichbring considerable kinetic energy into play. Mostof this energy is carried in surface currents (gene-
Surface ocean currents
Oyashio
Current
Kurosh
io
Current
Kamcha
tka
Current
North PacificDrift North Pacific
Drift
AlaskaCurrent
WestAustralianCurrent
EastAustralianCurrent
Antarctic Circumpolar Current Antarctic Circumpolar Current
NorthEquatorialCurrent
North EquatorialCurrent
Equatorial Counter Current
South Equatorial Current South EquatorialCurrent
CaliforniaCurrent
HumboldtCurrent
Falkland
Current
Brazil
Current
WestGreenlandCurrent
LabradorCurrent
East Greenland
Current
Gulf Stream
Dérive North Atlan
tic Drift
North Equatorial CurrentEquatorial
Counter Current
South EquatorialCurrent
Canary Current
GuineaCurrent
BenguelaCurrent
Cape Horn Current
Mozambique
Current
Southwest andNortheast
Monsoon Drift
1035
1030
1025
1020
1015
1010
1005
1000
995
35
30
25
20
15
10
5
Density kg/m
3
Temperature in °C-10 0 10 20 30
Variation in the density of water withtemperature and salinity
The salinity of the sea is approximately 35 grams per liter.
Thermohaline circulation(IPCC report 2001)
Deep, cold, saltycurrent
Warm surfacecurrent
Transfer ofheat to theatmosphere
Transfer of heat tothe atmosphere
ATLANTICOCEAN
INDIANOCEAN
PACIFICOCEAN
S = 0
S = 40

and fishing. It has been shown that the level ofrainfall experienced during this green Saharanperiod could not have occurred without the pre-sence of local vegetation.The annual cycle has vegetation as a consumerof carbon dioxide in its active period (photosyn-thesis) and as an emitter of carbon dioxide, byrespiration, in vegetative rest periods. At present,CO2 absorption exceeds its emission: vegetationis one of a number of phenomena that specia-lists refer to as carbon sinks. Under the effect ofclimate warming, therole of this sink couldbe counterbalanced by the decomposition of rot-ting vegetation. Moreover, its capacity to absorbCO2 reduces in hot and dry climatic conditions,such as during the 2003 heat wave in Europe.
circulation, called thermohaline circulation. In the NorwegianSea, and alsoaround the Antarc-tic, the waters become very cold. Part of the waterfreezes (at approximately -1.8 °C) to give sea ice(pack ice) and, in so doing, expels its salt whichduly increases the salinity of the surrounding
w THE CLIMATE MACHINE
Observing the past, conserving the future 15w The climate
13
Observing the past, conserving the future 15w The climate
w THE CLIMATE MACHINE12
unfrozen water. The result is to form very saltyand very cold water, which is therefore very dense,and sinks towards the ocean floor.This water then begins to travel a great loopalong the bottom of this worldwide ocean.Effects which favor the rising of this cold waterfrom the deep, produced by diffusion towardswarmer masses and by winds along certaincoasts or in the equatorial zone, will eventuallyreturn these waters to the surface, where theywill be heated. They will then be carried by sur-face circulation and will finally return to thearea of deep water formation, after a tour whichcould last 1,000 years.
OCEAN-ATMOSPHEREINTERACTIONSThe atmosphere and the oceans transportapproximately equal amounts of energy. Accor-ding to the estimates in the diagram on page 6,oceanic heat transport dominates at lower lati-tudes via the water cycle, whereas atmosphericheat transport takes over towards the poles.The winds are responsible for surface oceancurrents, which induce a significant change inthe relative momentum between the two fluids.One fundamental exchange, is the exchange ofwater, first in the “ocean to atmosphere” direc-tion, in the form of water vapor, and then in the“atmosphere to the ocean” direction by preci-pitation and a flow back to the sea of waterwhich falls on the continents. Water vaporplays an essential role in the atmosphere'stransport of heat towards higher latitudes.
The existence of a warm ocean surface (tempe-rature > 27 °C) is a requirement for formation oftropical cyclones.The Ocean plays an important role in the carboncycle: it currently absorbs around 1/4 of all car-bon dioxide emitted by man. Note that becauseof the acidification that it causes in the water,this absorption could have significant conse-quences on the biological equilibrium of theocean and its biodiversity.Plankton emit sulfur compounds, which moveinto the atmosphere in the form of sulfur oxides.These oxides gather in aerosols and play a fun-damental role in the condensation of vapor withinclouds.Through its large heat capacity and its inertia, dueto the time of circulation and equilibration, theOcean smoothes out these phenomena in theshort term and delays longer term changes.
THE ROLE OFTHE CONTINENTAL BIOSPHEREVegetation plays several roles in the climatemachine.Firstly it has a radiative role: a surface coveredwith vegetation absorbs much more solar radia-tion than bare soil. This role will be more or lesssignificant, depending on the type of vegetationand the season.Vegetation also plays a significant role in the watercycle, absorbing water in order to grow, and thenrejecting it through evapotranspiration. Localcave paintings reveal that, six thousand years ago,the Saharan population was practicing farming
Vegetation absorbs water to grow and rejects it byevapotranspiration.
© P
hoto
Dis
c
Substances are emitted into theambient environment by sourcesand removed by sinks.
“The winds are responsible for surface ocean currents.”
The large oceanic water currents bring into play considerablekinetic energy, mostly concentrated at the surface.
© P
hoto
Dis
c
Because of its origin: temperatureand salinity; thermohaline comesfrom the Greek thermos = heat andhalos = salts.

the density of seawater to cause significant dis-turbances to the thermohaline circulation.
THE ROLE OF THE LITHOSPHEREThe time constants of the lithosphere are suchthat their variations do not have any significanteffect on the climate on human timescales. Onthe geological timescale, however, the lithos-phere plays a role. The movements of tectonicplates, which change the layout of the continentsand oceans, are important for circulation of theatmosphere and of the ocean. The formation ofmassive mountains also modifies atmosphericcirculation and the accumulation of snow at highaltitudes strongly increases the albedo of the sur-face. Accumulation or degra-dation of large rock layers(basalts) leads to major changes in the compo-sition of the atmosphere and hence in the natu-ral greenhouse effect. These various effectshave caused the Earth to experience episodes(600 to 700 million years ago, in the Neopro-terozoic Era), when its surface was completelycovered in ice on the single continent that exis-ted at that time, Rodinia, and probably also overthe entire ocean.
Vegetation can then become, at least locally, aCO2 source.Finally, vegetation also plays a role in the nitro-gen cycle and in the emission of various reactivecomponents and greenhouse gases. Nitrogenoxides are greenhouse gases, or their precursors.
THE ROLE OF THE CRYOSPHEREIn the liquid state, water can absorb nearly all thesolar radiation incident upon it. In the solid state
(snow or ice), it becomesa very good reflector and
returns radiation to space.Furthermore, during crystallization seawaterejects the salt that was dissolved in it. Hence, theformation of sea-ice is an essential part of the pro-cess that causes the great thermohaline circula-tion loop in the ocean.With the warming that is now occurring, there isa risk that the permafrost will melt, releasing into
the atmos-phere largequantities of
methane, a gas with a significant greenhouse war-ming potential. Furthermore, the polar ice-capsrisk being destabilized and released into the seain the form of icebergs containing massive quan-tities of fresh water. These could sufficiently alter
FORECASTING WHAT THE WEATHER WILL DO IS ONETHING… DEFINING THE CLIMATE AND PREDICTING HOW ITWILL CHANGE IS QUITE ANOTHER. TO ACHIEVE THISREQUIRES THE USE OF MODELS.
Predicting thePredicting theclimate: climate: modellingmodelling
© D
igital
Vis
ion
Observing the past, conserving the future 15w The climateObserving the past, conserving the future 15w The climate
14 w THE CLIMATE MACHINE 15©
Pho
toD
isc
Permanently frozen ground, which occupiesa significant fraction of the continentalsurface area of the northern hemisphere,particularly around 70°N.
Reflective efficiency.
Which reaches its surface.
The formation ofsea-ice isresponsible forthermohalinecirculation of theocean.

is representative of the real world when sub-ject to the conditions imposed in the model(amount of sunshine, atmospheric composi-tion, etc.). This is the mode of operation forclimate models.
QUESTIONS OF HIERARCHYFor the climatologist, models typically have twovery different kinds of use, with various degreesof complexity, which leads to construction ofa hierarchy of models:• first they act as a way of testing hypotheseson the mechanisms involved in climatic phenomena, such as the abrupt variations inpast climates discovered by drilling experi-
and run calculations over long time periods.Hence, even with the most powerful computerconfigurations (such as the Earth Simulator inJapan), climate models are limited to calcula-tions using longer time steps and lower spatialresolution (typically 100 km) than meteorolo-gical models.From a more conceptual point of view, the wayin which the models operate is also different:meteorological models start from observationsand go on to calculate the development, overa short period of time, of the meteorologicalsituation in comparison to these observations.The chaotic nature of the climate means that,after a certain number of time steps, the modelhas lost any memory of the initial conditions.It cannot describe the real world from day-to-day, rather, it provides a statistical view which
w PREDICTING THE CLIMATE: MODELLING
Observing the past, conserving the futur 15w The climateObserving the past, conserving the futur 15w The climate
16
LONG-TERM FORECASTSThe task addressed by meteorologists is to knowwhat the weather will do at a given time andplace. Owing to the chaotic character of theatmosphere (the equations which described itsfunction are a long way from being linear; asmall change in initial conditions can have aconsiderable effect on the subsequent deve-lopments), beyond a few days, it is only pos-sible to determine the weather in a ratherunreliable way. Given this situation, it is notnecessary to take account of more slowly chan-ging phenomena when compiling meteorologicalforecasts: current, longest-term aims relate toseasonal forecasting.Climate can be defined as the distribution ofpossible meteorological conditions, over a pos-sibly very long period of time, in a given region.This is a question of not only knowing what theweather actually will do, but also what the wea-ther could do, with what probability and whatchanges are possible. The laws which governthe functioning of the climate machine are thesame, but in this case it is no longer possibleto ignore the long timescale components of thesystem. This is the first major difference bet-ween meteorological models and climate models.The limited power of computers causes a seconddifference. Meteorological models, which onlyconsider a restricted number of phenomena overa rather short period of time, can work on alarge number of points in space with a shorttime step. In contrast, climate models must
include all phenomena
17
“A small variation in initialatmospheric conditions can modifysubsequent developments”
There are large differences between meteorological modelsand climate models.
The task is not only to know what the weather will do, butwhat the weather could do, and with what probability.
© C
EA/P
. B
azog
e
Temperature changes, recorded sincethe middle of the 19th century, areshown in red, with the results from themodel in grey. The models are notable to reproduce the observedvariation if they only take into accountnatural causes: volcanic activity, solaractivity (left-hand figure): or if they
only consider those causes resultingfrom human activity: greenhouse gaseffect, aerosols, soil usage (centrefigure). By contrast, it can reproducethe observations well if we take intoaccount of both natural causes andhuman activity at the same time (right-hand figure).
This is a good indication that weunderstand the climate machine butalso demonstrates that man isgenuinely en route to derailing theclimate. (Figure extracted from the IPCCreport 2001, see box "Internationalpolitical action", p. 39).
WHAT CAUSES WHICH TEMPERATURES?
Divisions of time on the orderof an hour, a week, a year…
natural causes
1850
+1
+0,5
0
-0,5
-11900 1950 2000 1900 1950 2000 1900 1950 2000
anthropic causes all causes
© P
hoto
Dis
c
w PREDICTING THE CLIMATE: MODELLING

ments in the glacial ice caps of Greenland andthrough sampling marine sediments in theNorth Atlantic. We would like to simulate thedynamic processes of climate variation and thethreshold effects. We can easily understand that
a complex model,with very long calcu-lation times, will not
be suitable for this type of study. We need touse simplified models, which are nevertheless
Observing the past, conserving the futur 15w The climate
w PREDICTING THE CLIMATE: MODELLING18
suitable for determining the impact of parti-cular processes on the climate.• Three-dimensional general circulation modelsare used for long duration simulations. Theseare intended either to test the model's capa-city to reproduce a climate state which is verydifferent from the current one, or to forecastwhat the climate might be in an altered envi-ronment.
A NATURAL PHENOMENA, ESSENTIAL FOR LIFE,THE GREENHOUSE EFFECT IS BEING AMPLIFIED BYHUMAN ACTIVITIES. IT HAS BEGUN TO CHANGE THECLIMATE.
The greenhouseThe greenhouseeffecteffect
© C
EA/IPEV
Observing the past, conserving the futur 15w The climate
19
Physical model Computer model
A climate model is composed of a flat physical model on a horizontal and vertical grid, suitable for numericalresolution of the climate-system equations. It must take account of all the environmental compartments: theatmosphere, oceans and continents, and their respective components. It needs to describe the perturbations causedby human activity and it allows all these elements to interact.
CLIMATE EQUATIONS
Phenomena which only occurwhen certain quantities exceed a particular value.
Continental land areasSoil and vegetation
OceanSea ice
Marinebiogeochemistry
ChemistryGas and aerosols
CO2
Atmosphere
Continentalbiogeochemistry
Deforestation, soil use
Emission ofpollutants
CO2 emission
Human activity

GAZ CHEMICAL ABUNDANCEFORMULA (by volume)
Nitrogen N2 78,08%
Oxygen O2 20,95%
Water vapor H2O 0 to 4%
Argon Ar 0,93%
Carbon dioxide CO2 0,0370%
Neon Ne 0,0018%
Helium He 0,0005%
Methane CH4 0,00017%
Hydrogen H2 0,00005%
Nitrous oxide N2O 0,00003
Ozone O3 0,000004%
The composition of the atmosphere near the Earth's surface
(0 to 25 km)Greenhouse gases are in blue italics*
which radiates energy, in the form of electro-magnetic waves, with an intensity that dependsvery strongly on its temperature (Stefan-Boltz-mann law). To radiate 239 W/m2, the surfaceof the Earth would need a mean global tem-perature of -18 °C, which would not be veryfavorable to life as we know it.
The actual mean temperature of the surface is+15 °C, which is, in itself, experimental proofof the existence of a natural greenhouse effect.At 15 °C (288 K), the Earth is emitting infraredradiation with peak intensity at a wavelengthof 10 µm. There are a number of trace gasespresent in the atmosphere which are able toabsorb radiation at the wavelengths of thisinfrared radiation emitted from the ground. The atmosphere, which is transparent to almostall of the incident solar radiation, thereforebehaves as an absorber which traps a signifi-cant fraction of the radiation from the ground.The atmosphere, warmed by this absorbedradiation, also behaves as a black body and willitself emit energy in the form of infrared radia-tion. Because of its lower temperature, theatmosphere will radiate less energy than thesurface. Since it radiates in an isotropic fashion,half of this re-emitted radiationwill travel in a direction towardsthe surface of the Earth. Hence, energy is beingtrapped between the atmosphere and the sur-face and this will lead to surface warming.This behavior reminds us of a greenhouse:where the glass allows incident solar radia-
reaches the "top of the atmosphere", which cor-responds to a mean global energy of 342 W/m2
on the ground. Taking account of the Earth'smean albedo (around 30 %), it can be calcu-lated that, in the absence of other phenomena,this equates to 239 W/m2 being absorbed bythe Earth. The Earth behaves as a black body
Observing the past, conserving the futur 15w The climate
21w THE GREENHOUSE EFFECT
tion to enter, but then traps the energy insidethe greenhouse. This similarity led to the name"greenhouse gas" being applied to atmos-pheric gases which absorb infrared radiationcoming from the ground.
The basic composition of the atmosphere,which varies slightly from place to place, isgiven in the table below:
Observing the past, conserving the futur 15w The climate
w THE GREENHOUSE EFFECT20
SOLAR ENERGY...Climatic equilibrium (the stationary state) isobtained when the global energy balance is,on average, zero: i.e. the quantity of energyreceived (from the Sun) is equal to the quan-tity of energy lost (emitted into space). Energycoming from the Sun: currently 1,368 W/m2
Some dates relating to the greenhouse effect… Some dates relating to the greenhouse effect… Some dates relating to the green
1824The greenhouse effectis discovered by JeanBaptiste Joseph Fourier, a French mathematician.
only a very basic under-standing of the operation ofthe climate machine.
1896The Swedish physicist andchemist, Svante Arrhenius,gives the greenhouse effect itscurrent description. He alsosuggests that burning fossil
fuels to increase the concentra-tion of carbon dioxide in theatmosphere would have benefi-cial consequences: a more uni-form terrestrial climate,
stimulated plant growth andhence increased production ofnutrition for a growing popula-tion. Such optimism was pos-sible in an era when there was
1860’sThe Irish physicist John Tyndallattributes the greenhouse effectto water vapor and carbondioxide.
Reflected solarradiation: 107 W/m2
Reflected by clouds,aerosols and theatmosphere
Emitted by theatmosphere
Atmosphericwindow
Greenhouse gas
Absorbed by theEarth's surface
Absorbed by theEarth's surface
Absorbed bythe
atmosphere
Latentheat
107
30
24
6777
78
168
390
350
235
165
40
4030
324
342
Reflected by theEarth's surface
Radiation from theEarth's surface
Evapo -transpiration
Sensibleheat
Incident solar radiation:342 W/m2
Departing infraredradiation: 235 W/m2
The atmosphere is highlytransparent to sunlight: in spite ofthe presence of clouds, nearly 60%of the luminous energy arriving atthe Earth reaches the surface of theglobe, which only reflects a smallfraction. Overall, half the solar
energy arriving at the Earth isabsorbed by the continents andoceans, which it warms. Part of thisheat is re-emitted, mainly in theform of infrared radiation. Certaingases, present in small quantities inthe atmosphere (water vapor,
carbon dioxide, methane), absorbinfrared radiation: Only 10% of theradiation emitted by the surface ofthe Earth escapes directly intospace.
(Source: IPCC report 2001)
* In reality, it is not the quite genuine, opacity of glassto infrared radiation which is responsible for trapping energy in a greenhouse, but the obstacleprovided by the roof to the escape of any hot air byconvection. It is now common to see plastic green-houses which are transparent to infrared.
ENERGY FLOW WITHIN THE CLIMATE SYSTEMThe same way inall directions.

They act directly like a parasolagainst solar radiation, which theycan absorb or reflect. Hence,stratospheric aerosols coming fromthe eruption of Pinatubo caused areduction in global temperature ofhalf a degree, during the two yearsfollowing the eruption. However,certain aerosols contribute to thegreenhouse effect by absorbinginfrared radiation emitted from theground.
Aerosols also have several indirecteffects on climate: they act asnuclei for water vapor condensationduring cloud formation; theirconcentration will influence dropletsize and this size then has an effecton the reflective efficiency (albedo)and residence time of the clouds.Through absorbing radiation comingfrom the ground, they heat theatmosphere locally, altering itsvertical stability. Through complex chemicalreactions in which they participate,they influence the concentration ofgreenhouse gas compounds or theirprecursors. Finally, they affectphotosynthesis because they supplyessential nutrients to phytoplankton,both in the open ocean and also inthe Amazonian forest.
carbon concentration has increased by 30%since 1800, rising from 280 to 387 ppmtoday (parts per million).More than 50% of the additional greenhouseeffect due to human activity comes from CO2.The other contributors are methane, nitrousoxide, tropospheric ozone,carbon halides (CFCs ortheir current substitutes)…The effect of a green-house gas on the climate depends not onlyon its opacity to infrared radiation, but alsoon the time that it remains in the atmospherebefore being eliminated, either by a chemi-cal reaction or by absorption into another sec-tion of the environment. Tropospheric ozone,which is eliminated by chemical reactions,has a very variable residence time depending
w THE GREENHOUSE EFFECT
Observing the past, conserving the futur 15w The climate
23
Observing the past, conserving the futur 15w The climate
w THE GREENHOUSE EFFECT22
In nature, the main greenhouse gas is watervapor, which is directly responsible foraround 60% of the natural greenhouse effect.The rest comes from clouds and various gases(CO2, CH4, N2O, O3) and ranked first amongthese is carbon dioxide. Although present invery low quantities, ozone is a very effectivegreenhouse gas and contributes 8% of theglobal greenhouse effect.Since the beginning of the industrial era,man has re-injected 300 billion tons of car-bon, in the form of CO2, into the atmosphere.Natural processes had taken millions of yearsto hide this carbon under the ground in theform of coal, oil and gas. Although half of thiscarbon dioxide has been recaptured by vege-tation, the soil and the oceans, 150 billiontonnes remains in the atmosphere where the
A product of anaerobicdecomposition ofcellulose, in particular onrice plantations or in thepaunches of ruminants.
CONCENTRATEDATMOSPHEREIn Ireland, an oscillation issuperimposed on top of thecontinuous mean increase. This isdue to the seasonal activity ofvegetation which is very significantin these northern hemispherelatitudes. At Mace Head, when the windcomes from the continent, itcarries an increased concentrationof CO2, resulting directly from localhuman activities.
“In the past century and a half,man has re-injected 300 billiontons of carbon into theatmosphere, in the form of CO2.”
Evolution of the atmospheric concentration of CO2since 1980 on Amsterdam Island and, since 1992, at Mace Head
AEROSOLSThe term “aerosols” refers tosuspensions of fine particles in theatmosphere. They can be natural oranthropic in origin (produced byman).
Some natural aerosols come fromthe ocean: sea-salt produced byevaporation of spray, sulfatescoming from the oxidation of sulfur compounds (dimethyl sulfide)emitted by plankton.Others come from the continents:dust originating on land picked up by
wind erosion,carbon in mineralor organic form(soot particles)
produced by forest fires or savannastruck by lightning, volcanic dustand sulfates.
Human activity contributes to thegeneration of certain types ofaerosols: stripping vegetation fromthe soil enhances its erosion by thewind; various types of industrialcombustion processes, transport andfires set for agricultural practices(particularly savanna or forest fires)produce carbon aerosols, whereasatmospheric emissions of sulfurproduce sulfate aerosols.
The majority of aerosols remain in
the troposphere for a short periodonly; their duration is less than aweek. They can be transported overseveral thousand kilometers. Theyreturn to Earth under the effect ofgravity or are washed out of theatmosphere by rain. Theirgeographical distribution is veryvariable; their effect is thereforeessentially local.
Stratospheric sulfate aerosols areproduced by major volcaniceruptions (e.g. Mt St-Helen,Pinatubo). These can remain in thestratosphere for more than a year.They therefore have time toequilibrate their concentrationwhich, after several months, hasbecome homogeneous at any givenlatitude.
The climatic role of aerosols iscomplex and not yet fullyestablished. It depends on the natureof the aerosol, on its size andaltitude, and on the local albedo ofthe surface.
Dust of mineralorigin, lifted fromthe ground.
© P
hoto
Dis
c
© P
hovo
ir
© C
EA
© D
ufre
sne
J.-L
. et
al., La
Met
eoro
logi
e, (55):45{5
9, N
ov. 2006

Observing the past, conserving the futur 15w The climate
w THE GREENHOUSE EFFECT24
on atmospheric conditions. It is, however, notmore than several weeks. Methane has a resi-dence time of 10 years, carbon dioxide of morethan 100 years, nitrous oxide and CFCs haveresidence times on the order of a century.Indeed, many of the compounds injected intothe atmosphere contribute to the greenhouseeffect, even if they are not themselves green-house gases. Aerosols (see box on page 23)contribute directly to the greenhouse effectas a function of their composition, their alti-tude and their reflectivity from the ground.
Compounds which alter the oxidative capa-city of the atmosphere will make an indirectcontribution to the greenhouse effect, throughtheir effects on the production of gases suchas ozone or by modifying the elimination ofgases such as methane. For example, carbonmonoxide CO destroys hydroxyl radicals OHwhich are destructive agents to methane.Hence, injecting CO into the atmosphere inhi-bits the elimination of methane whose green-house effect will, therefore, endure for alonger time.
Carbon halides
Strato-sphericozone Sulfates
(direct effect)
Tropo-sphericozone
Fossil fuels(carbon black,direct effect)
Mineral dust(direct effect)
Produced byaircraft
Aerosols
Trails Cirrus
Sun
Soil use(albedo)
Fossil fuels(organiccarbon,
direct effect)Biomassfuels
(direct effect)
Troposphericaerosols
(indirect effect)
NO2
CO2
CH4
Cooling
Radiative forcing (Wm-2)
Level of scientific knowledge
Warming3
2
1
0
-1
-2
High Middle Low Very low
Anything which contributes to changes in the quantity of energy, received or emitted by the earth, in the form of radiation, iscalled radiative forcing.
Changes in radiative forcing between 1750 and 2000

THE HISTORY OF THE EARTH'S CLIMATE HAS SEENALTERNATE PERIODS OF WARM AND COLD. THEREASONS FOR THESE CHANGES AND THEIR IMPACTREMAIN TO BE DETERMINED.
Studying past Studying past climatesclimates
© CEA/IPEV
Observing the past, conserving the future 15w The climate
25

w STUDYING PAST CLIMATES
Observing the past, conserving the future 15w The climate
27
Observing the past, conserving the future 15w The climate
w STUDYING PAST CLIMATES26
Climate varies naturally. The history of the Ear-th's climate is peppered, with hot episodes andcold episodes. Climatologists are regularly askedhow they can tell that the increase in tempe-rature observed over the last century is reallydue to man and not a manifestation of naturalclimatic variation. For climatologists it is, the-refore, important to know the details of past cli-mates and to understand why and how climatecan vary.It was known in the 19th century, through thework of Swiss naturalist Louis Agassiz, that theEarth had been subject to periods of glaciation.We now know that, over the course of the lastmillion years, it has been subject to a succes-sion of glacial episodes interspaced with gene-rally rather short, warm periods, as at present.During the long glaciations, the high latitudecontinents of the northern hemisphere werecovered with ice several kilometers thick. The history of these episodes is itself rather
variable with local temperature changes, inGreenland, as high as 15 °C over several decades.It is important for climatologists to understandthese various changes. It is very useful formodelers to have well documented informationon such episodes which they can use to testthe ability of their models to reproduce real cli-mates that are very different from the presentday.
NATURE AND ITS INDICATORSSystematic measurement of meteorologicalconditions only began in the second half of the19th century. To gain knowledge of past climates,climatologists must, therefore, find indiceswhich testify to the climate which prevailed atthe time. Some indicators exist for historicaltime periods, for example the dates of agri-cultural work (it has been determined from thedates of the grape harvest, that the heat waveof 2003 was unprecedented over the previoussix centuries). But most indicators must be sear-ched for on the ground, in regions where naturehas been able to preserve them. This willdepend on the time period and scale of thephenomena which are of interest:• in marine sediments, for very long time scales;• in lake sediments;• in coral skeletons;• in concretions (stalagmites) slowly depositedin caves;• in the ice building, year by year, on the conti-nents at high latitudes (Greenland, Antarctica);• in the highest mountain ranges (Andes),
where the ice does not melt in the summer.For the most recent time periods, the growthof trees can be analyzed using the characte-ristics recorded in the annual rings.Climatologists find the information that has beendeposited in these natural archives.• in sediments this comes from the debris(shells, skeletons, etc., of aquatic animals),pollen grains and insoluble minerals;• in the continental glaciers (polar or alpine),apart from the ice, we also find deposited par-ticles and trapped air;• concretions in caves contain the minerals pre-cipitated at the time of their formation…A deposit needs to be decoded like a book,page by page, i.e. layer by layer.
The growth of these deposits is sometimesaffected by the weather, displaying a markedseasonality. This is the case for ice, coral andsometimes concretions.As long as the marks left by this seasonal varia-tion are clear, it allows the signals recorded atdifferent depths to be precisely dated. Beyondthis, more indirect methods are required to esta-blish the chronology of measured events at dif-ferent sites around the globe.
BETWEEN HOT AND COLDFrom deep drilling of cores in Greenland andAntarctica, as well as many measurements onmarine sediments, it has being possible toalmost entirely rediscover the climatic conditions
“By comparing the dates of past wine harvests, it could be seen that the heat wave of 2003 was unprecedented over the previous six centuries."
Layers of ice accumulated, year after year, in Greenland andAntarctica are also indicators of the history of the climate.
© CEA/IPEV
A CORE FOR THECLIMATEIn the cellar of the castle,on the CNRS site at Gif-sur-Yvette, thousands ofcores of marine sedimentare stored. Climatologistswant to take samples ofthese cores at differentdepths in the sediment (inthe lower left photograph,the core is placed in acontainer, graduated bydepth of sediment). The isotopic composition ofthe Foraminifera skeletonswhich the core contains,tell us about the climate which governedthe lives of theforaminifera measured.
© CEA/P. Bazoge
w STUDYING PAST CLIMATES
Observing the past, conserving the future 15w The climate
29
Observing the past, conserving the future 15w The climate
w STUDYING PAST CLIMATES28
over the last million years. The isotopic paleo-thermometer shows us that the climate has oscil-lated between two states, with a periodicity of around 100,000 years: a coldstate, corresponding to large-scale glaciation, thelast of which reached its height 21,000 yearsago, - and a warm state, like the present one,generally of short duration. The last warm periodto last as long as the present one occurred400,000 years ago; this was a comparable time,in terms of the orbital cycle of the Earth, to thepresent situation. The primary cause of large scaleglaciation was the geographic distribution andintensity of solar illumination throughout the year.This variation is however far from sufficient toproduce the large changes observed. Feedbackphenomena, particularly due to the strong albedoor greenhouse gases associated with snow-coveredice caps and pack ice, have a considerable ampli-
fying effect. It is remarkable to see, as was dis-covered from the bubbles of air imprisoned inthe ice cores from Vostok, these measurementsdemonstrate that the greenhouse gases CO2 andCH4and the Earth temperature are tightly linked,although it is not a demonstration that CO2drivesthe climate. The current understanding is thatorbital forcing has driven the temperature changesand that CO2 has a strong positive feedback tothe initial temperature changes.But none of these periods, warm and cold, wascalm. Analysis of glacial ice cores and oceaniccores has highlighted rapid changes in the cli-mate at high latitudes. The interpretation whichhas been given to these events is that large flowsof icebergs deposited enormous quantities offresh water into the North Atlantic, seriouslydisturbing the oceanic circulation. Similar eventscould arise in the future if global warming,
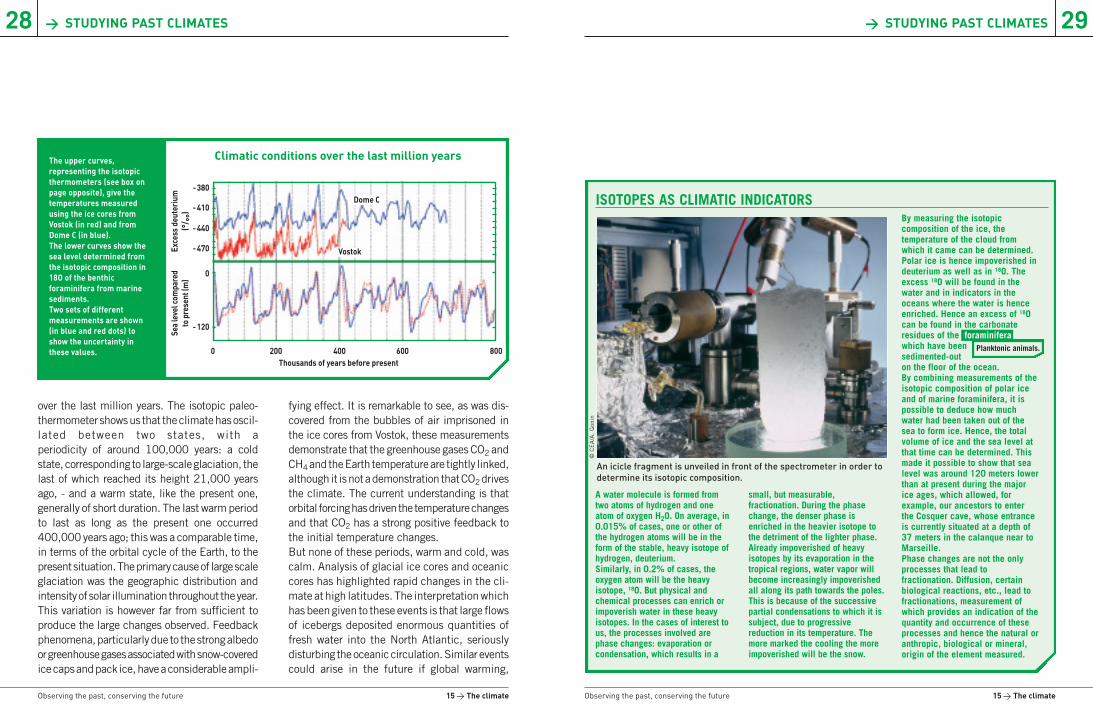
Climatic conditions over the last million yearsThe upper curves,representing the isotopicthermometers (see box onpage opposite), give thetemperatures measuredusing the ice cores fromVostok (in red) and fromDome C (in blue). The lower curves show thesea level determined fromthe isotopic composition in18O of the benthicforaminifera from marinesediments. Two sets of differentmeasurements are shown(in blue and red dots) toshow the uncertainty inthese values.
A water molecule is formed fromtwo atoms of hydrogen and oneatom of oxygen H2O. On average, in0.015% of cases, one or other ofthe hydrogen atoms will be in theform of the stable, heavy isotope ofhydrogen, deuterium. Similarly, in 0.2% of cases, theoxygen atom will be the heavyisotope, 18O. But physical andchemical processes can enrich orimpoverish water in these heavyisotopes. In the cases of interest tous, the processes involved arephase changes: evaporation orcondensation, which results in a
small, but measurable,fractionation. During the phasechange, the denser phase isenriched in the heavier isotope tothe detriment of the lighter phase.Already impoverished of heavyisotopes by its evaporation in thetropical regions, water vapor willbecome increasingly impoverishedall along its path towards the poles.This is because of the successivepartial condensations to which it issubject, due to progressivereduction in its temperature. Themore marked the cooling the moreimpoverished will be the snow.
By measuring the isotopiccomposition of the ice, thetemperature of the cloud fromwhich it came can be determined.Polar ice is hence impoverished indeuterium as well as in 18O. Theexcess 18O will be found in thewater and in indicators in theoceans where the water is henceenriched. Hence an excess of 18Ocan be found in the carbonateresidues of the foraminifera which have beensedimented-outon the floor of the ocean.By combining measurements of theisotopic composition of polar iceand of marine foraminifera, it ispossible to deduce how muchwater had been taken out of thesea to form ice. Hence, the totalvolume of ice and the sea level atthat time can be determined. Thismade it possible to show that sealevel was around 120 meters lowerthan at present during the majorice ages, which allowed, forexample, our ancestors to enterthe Cosquer cave, whose entranceis currently situated at a depth of37 meters in the calanque near toMarseille.Phase changes are not the onlyprocesses that lead tofractionation. Diffusion, certainbiological reactions, etc., lead tofractionations, measurement ofwhich provides an indication of thequantity and occurrence of theseprocesses and hence the natural oranthropic, biological or mineral,origin of the element measured.
An icicle fragment is unveiled in front of the spectrometer in order todetermine its isotopic composition.
0
-120
0
-470
-440
-410
-380
200 400
Vostok
Dome C
Sea level com
pared
to present (m
)Excess deuterium
(°/ °°)
600 800Thousands of years before present
© CEA/A. Gonin
ISOTOPES AS CLIMATIC INDICATORS
Planktonic animals.
foraminifera

w STUDYING PAST CLIMATES
Observing the past, conserving the future 15w The climate
31
Observing the past, conserving the future 15w The climate
w STUDYING PAST CLIMATES30
accompanied by significant precipitation orabrupt melting of the glacial ice caps, occurs.The possibility cannot be ruled out, that thiscould sufficiently disturb oceanic circulation,by moving the northern limit of the North AtlanticDrift to the south, (see chart of surface oceancurrents, page 11), so as to remove the warmwaters of the Gulf Stream from the coast of Europeand hence limite future warming of WesternEurope.
THE ONCE GREEN SAHARA…Climatic variability is not limited to ice ages.Six thousand years ago, the Sahara was not thedesert we know today, but a verdant region withlakes, where farming and fishing were practi-ced. There are many cave paintings which tes-tify to this. Europe experienced a climate opti-mum in the Middle Ages, which, among othersthings, allowed colonization of Greenland bythe Vikings.After this, a notable cooling marked the period1400-1850: the Little Ice Age saw tempera-
LIFE AND DEATH OF A FORAMINIFERAForaminifera live and die in the waters of theoceans. Their shells are found in sediments on theocean floor. During the periods of abrupt coolingwhich have punctuated the warmer phases,conditions (temperature and salinity) have causedthe Foraminifera to disappear completely. In theirplace, the sediments contain rocky debris, scouredfrom the continents by the glaciers. It is thedropping into the ocean of gigantic pieces of theseglaciers which, by releasing the massive amountsof fresh water which they contain, has modifiedoceanic circulation and provoked the cooling.
© CEA
Mean temperature evolution of the Northern Hemisphere since the year 1000
The values shown are the meantemperature variations over theperiod 1961–1990. The red curve isthe instrumental value measuredwith various thermometers since1902. The other curves are valuespresented by various authors.Their dispersion indicates theuncertainty in these estimates.The Mediaeval Climate Optimumand the low temperatures of theLittle Ice Age can be clearlydistinguished. However, the moststriking feature is the rapid andsignificant increase intemperature since the start of the20th century and in particularsince 1970.(Figure taken from Wikipedia).
Little Ice Age
Medieval Optimum
Measured temperatures 2004
1000
-1
-0,8
-0,6
-0,4
0,2
0,4
0,6
0
-0,2
1100 1200 1300 1400 1500 1600 1700 1800 1900 2000
Temperature variation (in °C)
Hendrick Avercamp(1585-1634), A WinterScene with Skaters(Rijksmuseum,Amsterdam). Cold winters whereskaters could enjoy thefrozen rivers provided agreat deal of inspirationfor painters during theLittle Ice Age.
ISOTOPES EMPLOYED IN CHRONOLOGYA major problem for climatologists is tocorrelate the dates obtained fromdifferent indicators measured atdifferent locations around the globe.This is an indispensable requirement ifwe are to establish the chronology ofdiverse events.The majority of the "clocks" employedare based on radioactive decay. One ofthe best-known is carbon-14 (14C)measurement. During its life, abiological organism continuouslybalances the isotopic composition ofits carbon with that of the surroundingenvironment - i.e. with the atmospherein the case of vegetation.
Biological tissues, therefore, mirror theambient ratio of carbon-14. After itsdeath (at a time referred to as t0),exchange with the environment ceases;the carbon-14 continues to decay witha radioactive half-life of 5,730 years.The ratio in the present-day samplemakes it possible to determine howlong it has been dead, provided oneknows what the ambient ratio was atthe time of death.Many other radioactive families areused such as the pairs: uranium 234and thorium 230; potassium 40 andargon 40, etc. Some minerals accumulate received
radiation. Under certain conditions,they will emit light proportional to thequantity of this accumulated radiation.Researchers use this property fordating. The great difficulty is to findsufficient sensitive phenomena tocover all of the time ranges to beconsidered and samples for which it issignificant to define t0.Dating can also take advantage ofother techniques, such as intensitymeasurements of the Earth's magneticfield, recorded by magnetic minerals,which have the advantage of been ableto study synchronous variations overthe whole planet.
In carbon-14 dating, samples are chemically treated to extract thecarbon which is purified in the form of CO2. This carbon dioxide isthen reduced and transformed to graphite. Isotopic analysis of thegraphite is performed using a particle accelerator (tandem)coupled to a magnetic spectrometer. This technique makes itpossible to process very small samples (mg of carbon). Processingbenches make it possible to prepare a large number of samplessimultaneously.
© CEA/P. Bazoge
© akg-images

w STUDYING PAST CLIMATES
Observing the past, conserving the future 15w The climate
33
Observing the past, conserving the future 15w The climate
w STUDYING PAST CLIMATES32
ASTRONOMICAL GLACIATION THEORYIn the Northern Hemisphere,continental landmassespredominate in comparison to theoceans (though the pole is in anocean). In the SouthernHemisphere, the continents onlyoccupy a very small fraction of thesurface area (though here the Poleis at the centre of a continent). An
ice age will clearly start on thecontinents, where the thermalinertia is lower than that of theocean, and hence will start in theNorthern Hemisphere (Antarcticaremains covered by ice in anyevent). If precipitation and sunlightconditions are such that the snowfalling in winter does not melt in
summer, then snow will accumulateand be transformed into ice. Such conditions require aseasonality that does not exhibitlarge contrasts, having humidwinters, which are not too cold andcool summers. This is where theposition of the Earth with respect tothe Sun plays a role.
Three types of pseudo-periodicchanges affect the position of theEarth with respect to the Sun:
– the eccentricity of the ellipsewhich varies with two pseudoperiods of 100,000 and 413,000years,
– the inclination of the Earth'saxes of rotation to the plane of theeclipse, which varies between 22and 25° with a period of 41,000years;
▲ – finally, the rotation of the Earthalso has a precession movement (withperiods of 19,000 and 23,000 years),on a cone, the peak of which is locatedat the centre of the Earth. The axis per-pendicular to the ecliptic plane leadsto a shift of the position of the equi-noxes and solstices on the ellipse.These diverse frequencies are thedominant frequencies of climatevariation over the course of the lastmillion years.
Autumnal equinox
22°25°23°30’
Spring Equinox
Summer solstice
Winter solstice
Precession
tures lowered throughout Europe (frozen win-ter scenes inspired many artists) and more orless affected the whole of the northern hemis-phere, with a notable advance of glaciers.Since 1850, man has been assisting in a war-ming process which has seen the end of theLittle Ice Age.But we have also entered into the industrial era,and it is necessary to separate what is naturaland what is due to human activity.
THE EL NIÑO EXAMPLEThis involves a short-term variability in the cli-mate, which is located primarily in the equa-torial Pacific but which, through its most violentevents, affects all of the tropics as far up as40° south in the Indian and Pacific oceans andthe Western border of the Atlantic.It is characterized by an anomalous couplingof the atmosphere and the ocean. In the normalsituation (when El Niño is not present), the tradewinds push the surface waters from the Ame-ricas towards Indonesia. This results, in the WestPacific, in high humidity over Indonesia and asea level that is higher than in the East Pacific.In the East, along the Peruvian coast, deep coldwaters rise up, rich in nutrients, leading to cooltemperatures and a marine productivity whichis very favorable for fishing.
Approximately every three or four years, the tradewinds are weaker and the ocean flows backtowards Peru. This blocks the rising deep waterand hence the fish. It can lead to torrential rainalong the west coast of South America andserious drought, sometimes generating fires, inIndonesia. This phenomenon which lasts severalmonths has been christened El Niño (the child,implying: Jesus) by the Peruvian population,who appreciate the warm water that it bringsto their cold coasts around Christmas.Between two El Niño type events, the oppositephenomena can occur which, by analogy, hasbeen named La Niña.Given the violence of recent El Niño, the ques-tion has been asked as to what influence globalwarming is having on the frequency and inten-sity of this phenomenon.El Niño is not the only example of climatic varia-bility. For example, the North-Atlantic Oscilla-tion (NAO), modulates the position and intensityof westerly winds over the ocean, and stronglyaffects climate conditions (temperature, pre-cipitation, storms, etc.) in the North Atlanticand Europe.
“El Niño can cause heavy rainfallon the western side of South America and severe droughts in Indonesia.”
▲ The motion of the Earthdescribes an ellipse with the Sun atone of the focal points. The Earth issubject to the attraction of the Sun,but also of attraction by the otherplanets in the solar system. This hasthe effect of deforming its trajectory,causing the seasonal distri bution ofradiation from the sun to vary.
Sun
Earth
▲

w MONITORING CHANGES TO CLIMATE AND THE ENVIRONMENT
Observing the past, conserving the future 15w The climate
35
Observing the past, conserving the future 15w The climate
34
REGULAR MEASUREMENT OF CLIMATIC CHANGESHELPS US TO UNDERSTAND THE CONSEQUENCESOF OUR BEHAVIOR.
MonitoringMonitoringchanges to changes to climate and the climate and the environmentenvironment
METEOROLOGICAL SATELLITESMeteorological variability is very large in the shortterm. In our region, it is very much greater thanthe worst variations predicted for average climaticconditions. A large number of measurements overa long period of time will be necessary to detectclimate change and the environmental parame-ters which depend upon it.The geographic separation of measurements, andtheir frequency, will depend on the spatial andtemporal variability of the phenomena which areto be monitored.For measurements which require daily monito-ring on a large spatial and temporal scale, a satel-lite is the ideal observatory, provided it hasinstruments capable of resolving the phenomenato be studied. Geostationary meteorological satel-lites can monitor a third of the surface of theglobe, and can do this several times per hour.Satellites in polar orbit can make daily observa-tion of almost the entire surface of the globe. Toobserve phenomena which are limited to a givengeographical region (for example: the monsoon),satellites require specific orbits. Apart from meteo-rological satellites, satellites dedicated to obser-vation of the environment and to monitoringclimate components (clouds, solar radiation,radiation from the ground, aerosols, greenhousegases, etc.) have been launched for the scien-tific community.Although a large amount of meteorological datacan be measured by satellite, there is neverthe-less the problem of vertical variation, which canonly be resolved for a limited number of para-
meters. Moreover, the satellite cannot record alarge number of parameters with a high spatialresolution, without risking saturating data trans-mission and processing.
Finally, once launched, a satellite is inaccessibleand its correct operation can only be verified andcorrected through measurements taken from theground. These are an indispensable complementto satellite measurements. Long-term, high fre-quency monitoring will be made by automaticstations, judiciously distributed over the surfaceof the globe to ensure good coverage and to pre-vent the required signal being perturbed. Thesewill include meteorological stations, automaticbuoys, stations for analysis of atmosphere com-position and automatic spectrometers, etc.
“A single geostationary, meteorologicalsatellite can continuously monitor aroundone third of the surface of the globe”
A satellite is an ideal observatory for daily monitoring on alarge spatial and temporal scale.
© PhotoDisc
© CEA

w MONITORING CHANGES TO CLIMATE AND THE ENVIRONMENT
Observing the past, conserving the future 15w The climate
37
Observing the past, conserving the future 15w The climate
w MONITORING CHANGES TO CLIMATE AND THE ENVIRONMENT36
Moreover meteorologists make daily measure-ments using balloon based probes, to attain ver-tical distributions of weather parameters.As an indication, the World Meteorological Orga-nization uses some 10,000 stations on land,7,000 stations on board ships and 800 driftingbuoys in the sea, more than 800 radiosonde sta-tions and 14 satellites, of which 8 are geosta-tionary.For a geographically limited, detailed unders-tanding, there are programs of recurrent measu-rements which, if necessary, use existing transport:temperature measurements of the sea are car-
ried out daily by numerous merchant ships andatmospheric measurements are installed on boardairliners.
Finally, study of particular phenomena may requiremulti-instrument programs, the most importantof which have been set up on the internationalscale. Consider for example the INDOEX cam-paign in 1999, which studied aerosols emittedby India. This program simultaneously put in placemeasurements on the ground, on board ships, atairports and by satellite. Another example of aprogram dedicated to climate is AMMA, which
Mean annual changes in various radiative forcing components (in W.m-2) from 1750 to 2000 due to human activity
Greenhouse gases which have a long residence time in the atmosphere are well mixed. One measurement per latitudeband is sufficient to understand their forcing. Tropospheric ozone, which has a shorter residence time, does not havesufficient time to move far from its sources. It therefore requires at least one measurement per latitude band and percontinent. Aerosols, which are either sedimentary or carbonaceous, do not travel far before the large majority have beeneliminated from the atmosphere. They must therefore be measured close to each source. (Figure IPCC 2001)
was a program studying African monsoons, forwhich the majority of observations took place in2005.
THE CLIMATE OF THE FUTUREMeasurements carried out directly in the atmos-phere show that the concentration of greenhousegases in the atmosphere has been increasing ata speed unknown in the geological history of theEarth and to a level without precedent in thecourse of the last million years.Changes to the climate and the environmenthave been clearly observed over the course ofthe 20th century:• there has been a mean temperature increaseof 0.7 °C, and the nocturnal maximum tempe-rature has increased more than the diurnalmaximum temperature;• sea level has risen by 17 cm;• over the last 30 years the volume of pack ice
in the Arctic Ocean has sharply decreased; itsminimum surface area in summer has decreasedby 40%, with, in consequence, a notable war-ming of the seawater in the whole region.Considering the quantities of gas which havealready been injected into the atmosphere andthe inertia of the system, warming of the cli-mate should be expected in the coming cen-tury, even if concentrations of greenhouse gasdo not increase further. However, even the mostoptimistic estimates of changes in the world'ssociety and its behavior, predicts a strong increasein this concentration.In order to estimate how the climate will changeover the course of the 21st century and beyond,it is not possible to simply extrapolate from pastclimates, since we do not know of an analogousset of astronomical and environmental charac-teristics sufficiently close to those of the pre-sent day. We must therefore rely on modeling.
Atmospheric measurements on board an aircraft forgathering geographically limited, but detailed information.
© CEA/P. Bazoge
Analyses on the ground are an indispensable complement tosatellite measurements.
© CEA/Sciare
Mineral dusts emitted due to human activity
Greenhouse gas CO2, CH4, N2O and CFC Increase in tropospheric ozone
-4,5 -3 -1,5 0 1,5 3 4,5
-2,25 -1,5 -0,75 0 0,75 1,5 2,25 -2,25 -1,5 -0,75 0 0,75 1,5 2,25
-0,9 -0,6 -0,3 0 0,3 0,6 0,9
Carbon (lampblack and soot) coming from fossil fuels

rainfall, the whole of the Mediterranean basinis threatened by increased aridification.However, the amplitude of these phenomenaand their geographic distribution will dependgreatly on the way in which humanity managesthe accumulation of greenhouse gases. Simu-lations of future climate are necessarily basedon scenarios of society's development and itsemissions of greenhouse gases.The environmental impacts of future climatechange often result in pessimistic predictions.However, without a sufficient understanding ofthe feedback actions of the system, it is cur-rently difficult to predict the severity and fre-quency of the events which are likely to beproduced.Increased awareness of the possible conse-quences of the disturbances that mankind isbringing to the global environment have resulted in an enormous research effort over the last few
w MONITORING CHANGES TO CLIMATE AND THE ENVIRONMENT
Observing the past, conserving the future 15w The climate
39
Observing the past, conserving the future 15w The climate
w MONITORING CHANGES TO CLIMATE AND THE ENVIRONMENT38
Maximum warming could provoke a massive thaw.
© CEA/IPEV
Typical result of a simulation of summer climate evolution in France, from 1860 to 2100, with a "selfish" scenario for the development of nations
The model’s predictions are shown inblack, the trend (smoothed model usingsmoothed mean over 50 years) is shownin blue. For comparison, actualmeasurements are shown in red.According to this simulation, the heatwave of 2003 is clearly hotter than anysummer which was considered hotaround 1900. The mean temperature isincreasing. If we take a very hot summermeasured as the yardstick of 1900, thenthe frequency of such occurrenceswhich was once per century has nowbecome much more frequent, whereasthe frequency of cold summers isdecreasing. With continued increase inthe mean temperature, an averagesummer will be warmer in 2050 than thewarmest summers in 1900. Followingthis trend, a summer as "hot" as 2003will be considered a cool summer.
INTERNATIONAL POLITICAL ACTION
Climate change and changes to theglobal environment have led to theorganization of some importantconferences.
At the request of the G7 and underauspices of the United Nations, agroup of international scientists, theIPCC (Intergovernmental Panel onClimate Change), was set in place in1988. This intergovernmental groupof experts on climate changeproduces a report every five or sixyears on the current state ofknowledge concerning climatechange (http://www.ipcc.ch). Themost recent is dated 2007.
Under the impetus of the UnitedNations Environment Program, theproblems posed by substanceswhich deplete the atmosphericozone layer were discussed inVienna (1985) and notably inMontréal (September 1987) where a
protocol was signed imposingreductions in the production and useof chlorofluorocarbons (CFC).
The protocol has been subject toamendments in London (1990),which imposed a ban on CFC's from1st January 2000 and extended theregulation to other products, inCopenhagen (1992), Montreal(1997) and Beijing (1999).
At the Earth Summit in Rio deJaneiro (June 1992), a frameworkUnited Nations FrameworkConvention was signed on climatechange, which adopted the objectiveof stabilizing greenhouse gasemissions (coming into force on 21stMarch 1994).
At the Kyoto conference (December1997) a protocol was signed onglobal reduction of emissions ofthese gases, by 5.2% on average, in2008-2012, compared with the
1990 baseline, for OECD countriesand the countries of Eastern Europe(including Russia). The reductiontargets for the European Union andFrance were 8% and 0%respectively. In spite of theconference keeping to an intensivepace, it was necessary to wait until2005 before Russia finally rejoinedand the protocol could be ratified.For the subsequent period (startingfrom 2013), the Bali conference(December 2007) has begun theprocess to define the reductions ingreenhouse gas emission and theterms and methods of thesereductions. It has also begunactions for adapting to climatechange.
In 2007, the Nobel Peace Prize wasawarded, jointly, to Al Gore and tothe IPCC for their activity in raisingawareness of the risks linked toclimate change.
“The "ecological" awakening has advancedour capacity to model the climate.”
1860
16
18
20
22
24
26
T°C
1900 1950 2000
2003
For1900
average
verycold
veryhot
Model
Mean model over50 years
Observations 20th century
2050 2100
decades and considerable progress has beenmade in our understanding and our ability tomodel the climate, in particular thanks to stu-dies of past climates. However, our understan-ding of the mechanisms of change andstabilization of the climate, which have beenused to model its history, are still very limited.They must be improved in order to allow areliable forecast of the changes in climate, par-ticularly in extreme cases, for which the impacton society may be major.
As we have seen, climate modeling is an imper-fect science: the climate machine is complexand the phenomena in play are often still poorlyunderstood and difficult to model in a realisticfashion. The unavoidable limits on calculationresources require to use simplified approaches,which cannot take into account the full and finedetails of certain phenomena. Each model seeksto bring its own solutions to these diverse pro-blems. This leads to a disparity in results, whichclimatologists investigate under large interna-tional inter-comparison programs.
A certain number of results are robust and arefound in all the models: hence, it is certain thatwarming will be the greatest at high latitudes,as has already been observed in the Arctic, withthe consequence of massive thawing of the permafrost and the out-gassing of the methane
that it holds. In the case ofGround frozen all yearround.
© Dufresne J.-L. et al., La Meteorologie, (55):45{59, Nov. 2006.