ce100 usa - ellen macarthur foundation · maintain/prolong 6 2803 00069 ... the ce100 usa is a...
TRANSCRIPT

CE100 USA

TODAY’S LINEAR ‘TAKE-MAKE-DISPOSE” ECONOMY IS CHANGING
New products = New raw materials
Material, Asset, Product waste is chronically high
Our linear “take, make, dispose” economy is changing. The growing world population (9bn by 2050) and new middle class consumers (+3bn by 2030) put significant pressure on economic growth that is dependent on finite resources. This is especially challenging when all new products are made of new raw materials and the structural waste in the economic system is chronically high.

Farming/collection1
Biochemical feedstock
Regeneration
Extraction of biochemical feedstock2
Cascades
Collection
Parts manufacturer
Product manufacturer
Service provider
Collection
User
Biosphere Recycle
Refurbish/remanufacture
Reuse/redistribute
Maintain/prolong
6 2803 0006 9
Consumer
MINIMISE SYSTEMIC LEAKAGE AND NEGATIVE EXTERNALITIES
FINITE MATERIALSRENEWABLES
Biogas
Renewables flow management Stock management
Share
Regenerate Substitute materials Virtualise Restore
THE CIRCULAR ECONOMY – KEY PRINCIPLES
Preserve and enhance natural capital by controlling finite stocks and balancing renewable resource flows
Optimise resource yields by circulating products, components and materials in use at the highest utility at all times in both technical and biological cycles
Foster system effectiveness by revealing and designing out negative externalities
PRINCIPLE 3
PRINCIPLE 2
PRINCIPLE 1
SOURCE: Growth Within (2015) - Ellen MacArthur Foundation; Stiftungsfonds für Umweltökonomie und Nachhaltigkeit (SUN); McKinsey Center for Business and Environment; Drawing from Braungart & McDonough Cradle to Cradle (C2C)

THE CIRCULAR ECONOMY – RESTORATIVE AND REGENERATIVE BY DESIGN
Restorative by design
…keeping products, components and materials at their highest utility and value, at all times …eliminating waste, with materials re-entering the economy at end of use as defined, valuable technical or biological nutrients

63 98
121
154
270
Fresh Food
Beverages
Apparel
Packaged food
Others
706 ROUGH ESTIMATES
Net material cost savings1
USD billions per year
Others Furniture Other transport Electrical machinery
Machinery and equipment
Motor vehicles
112 40 54 91
135
198
630
Medium-lived complex goods
(EU-27)
Fast-moving consumer
goods (global) Sector
1 Advanced scenario SOURCE: Ellen MacArthur Foundation – Towards a Circular Economy Vol. 1&2; Eurostat Input/Output tables 2007 for EU-27 economies; Euromonitor 2011
THE ECONOMIC CASE IS COMPELLINGGlobal analyses reveals a circular economy enables significant material cost savings opportunities while at the same time setting up for growth and innovation. "

WHAT BUSINESSES CAN DO The ReSOLVE framework helps business explore circular opportunities
▪ Remanufacture products or components ▪ Recycle materials ▪ Anaerobic digestion ▪ Extract biochemicals from organic waste
▪ Increase performance/efficiency of product ▪ Remove waste in production and supply chain ▪ Leverage big data, automation, remote sensing and steering
▪ Deliver utility virtually
▪ Replace old with advanced non-renewable materials ▪ Apply new technologies ▪ Choose new product/service
▪ Shift to renewable energy and materials ▪ Reclaim, retain, and restore health of ecosystems ▪ Return recovered biological resources to the biosphere ▪ Share assets ▪ Reuse/secondhand ▪ Prolong life through maintenance, durability, upgradability
SOURCE: Ellen MacArthur Foundation, SUN, McKinsey Center for Business and Environment - Growth Within: a circular economy vision for Europe
REgenerate
Share
Optimise
Loop
Virtualise
Exchange
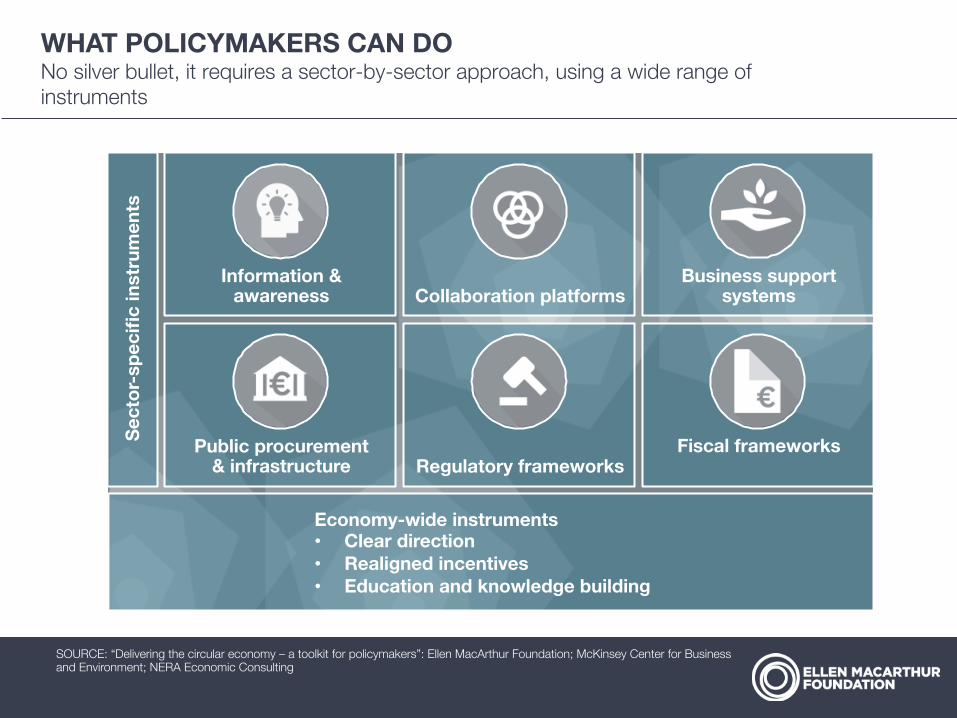
Information & awareness
Business support systems Collaboration platforms
Public procurement & infrastructure
Fiscal frameworks Regulatory frameworks
Sect
or-s
peci
fic in
stru
men
ts
Economy-wide instruments • Clear direction • Realigned incentives • Education and knowledge building
SOURCE: “Delivering the circular economy – a toolkit for policymakers”: Ellen MacArthur Foundation; McKinsey Center for Business and Environment; NERA Economic Consulting
WHAT POLICYMAKERS CAN DO No silver bullet, it requires a sector-by-sector approach, using a wide range of instruments

WITH U.S. BUSINESS, GOVERNMENT AND EDUCATION


EMPOWERING ORGANISATIONS IN THE UNITED STATESAccelerating the transition towards a circular economy requires a multi-stakeholder approach
• Business with a strong focus on the U.S. market keen to learn and develop CE opportunities.
• U.S. Gov. & Cities who wish to create an effective environment for the growth of the circular economy.
• U.S. Universities providing insight and capacity through relevant CE teaching and/or research programs.
• Emerging Innovators (EI) such as Start-ups and SME’s with a unique technology, service or solution that disrupt status quo and accelerate the transition.
• CE100 international members of the international CE100 program keen to develop opportunities and engage with U.S. like minded organizations.
The CE100 USA is a United States centric, pre-competitive collaboration and innovation program, bringing together key stakeholders:

CE100 USA Empowering organizations to reach their circular economy goals faster
Over the course of 3 years, the program delivers value on every step of the journey, enabling organizations to capture cost savings, innovative and build new circular economy opportunities:
COLLABORATION Tailored activities to stimulate cross-company, cross-sector, pre-competitive collaboration
CAPACITY BUILDING Develop understanding of the circular economy as an innovation framework and build organizational capacity
NETWORK Network of circular economy experts, businesses and public bodies, across sectors / industries
INSIGHTS & ANALYSIS The latest circular economy analyses, intelligence, tools and templates

CE100 USAInspired by the international CE100, the CE100 USA is developed with tailored program elements that fit ambitious organizations operating in the U.S."
CE100 USA Members
• 2x 1-day Workshop ▪ Collaborative Projects
▪ CE100 U.S. directory ▪ CE100 U.S. member book
▪ 10 E-learning places ▪ Educational video’s,
templates, and tools
CAPACITY BUILDING
NETWORK
COLLABO-RATION
Benefits & Program Elements
Excellent opportunities to connect with like minded US organizations, suppliers, and customers through Events, Member Directory and Member Book.
Tools and templates for building CE capacity in organizations needed to accelerate implementation of new projects.
Action-oriented programs and projects such as 1-day Acceleration Workshop each six months to convene all the U.S members to focus on cross-sector, cross-industry collaboration initiatives
▪ Online library ▪ US centric research ▪ Local case studies
INSIGHT & ANALYSIS
Research and case studies developed by the Foundations and local members addressing new opportunities and insights to overcoming barriers to implementation.

Ellen MacArthur Foundation in the USA
Upcoming:
• CE100 USA Launch Event – Circular economy in the US and key pillars of the program
31 March 2016 San Francisco CA
• CE100 USA 1st Acceleration Workshop for program members
September 2016 NYC
If your organisation is interested in participating in the programme, please contact: [email protected]
• USCCF 2016 Sustainability Forum – Keynote by Andrew Morlet (CEO) and workshops by the Foundation team
16, 17 May 2016 Washington DC
Date:

FEEDBACK FROM CE100 MEMBERS
“Even if you do not believe in a sustainability agenda, the efficiency gains of managing (circular) material flows should convince you to go after this potential.” NATIONAL GRID “We’re proud to be a founding partner of the Ellen MacArthur Foundation, because we believe that the circular economy offers a solid concept on which we can base our thinking for our potential future business model.” KINGFISHER “While not every product is appropriate for refurbishment, it seems highly likely that nearly all companies will have parts of their product portfolio where circular business practices will prove profitable.” CISCO
“Nothing is impossible,
particularly if it is inevitable.”
HERMAN MULDER
CHAIRMAN OF THE GLOBAL REPORTING INITIATIVE

CE100 USA

THE ELLEN MACARTHUR FOUNDATION The Ellen MacArthur Foundation works across four areas, with the aim of accelerating the transition towards a circular economy:
INSIGHT & ANALYSIS
EDUCATION & TRAINING
Catalysing circular activities across the global economy
Inspiring learners to re-think the future through the circular economy framework
Providing robust evidence about the benefits of the circular economy transition
BUSINESS & POLICY
COMMUNICA-TIONS & PUBLISHING
KEN WEBSTER
THECIRCULARECONOMYA WEALTH OF FLOWS
Developing the conceptual framework and celebrating best practice

80 •
DE
LIV
ER
ING
TH
E C
IRC
ULA
R E
CO
NO
MY
– A
TO
OLK
IT F
OR
PO
LIC
YM
AK
ER
S
Form public private partnerships to finance the deployment of mature bio-refining technologies
Reduce VAT on high value chemicals derived from waste feedstock
Stimulate the development of advanced, high-value bio-refining technologies by funding cross-institutional R&D clusters
Require municipalities to collect organic waste separately
Propose a minimum proportion of 2nd generation biofuels in the EU biofuel target
Provide a business advice service
Identify and communicate necessary changes to EU policy (or its national implementation) to address unintended consequence
Incorporate bio-refining into the government’s long-term strategic plans
Provide low-cost loans or loan guarantees for the deployment of mature bio-refining technologies
IMPA
CT
LOW
HIG
H
HIGH COST LOW
Require municipalities to send organic waste for one round of processing to extract high value compounds before it could be incinerated / used as fertiliser
Figure 22: Prioritisation of opportunities
SOURCE: Ellen MacArthur Foundation circular economy team; NERA Economic Consulting
PT_n
ew_1
9.in
dd
8018
/06/
2015
11
:19
POLICYMAKERS HAVE AN IMPORTANT ROLE TO PLAY IN ENABLING THE TRANSITION
100 • DELIVERING THE CIRCULAR ECONOMY – A TOOLKIT FOR POLICYMAKERS
BARRIERS
Value capture in cascading bio-refineries
Reduction of avoidable food waste
Industrialised production and 3D printing of building modules
Reuse and high value recycling of components and materials
Sharing and multi-purposing of buildings
Remanufac-turing and new business models
Increased recycling of plastic packaging
Bio-based packaging where beneficial
Performance models in procurement
Waste reduction and recycling in hospitals
Not profitable for businesses1 even if other barriers are overcome
Capital intensive and/or uncertain payback times
Technology not yet fully available at scale
Externalities (true costs) not fully refletcted in market prices
Insufficient public goods / infrastructure2 provided by the market or the state
Insufficient competition / markets leading to lower quantity and higher prices than is socially desirable
Imperfect information that negatively affects market decisions, such as asymmetric information
Split incentives (agency problem) when two parties to a transaction have different goals
Transaction costs such as the costs of finding and bargaining with customers or suppliers
Inadequately defined legal frameworks that govern areas such as the use of new technologies
Poorly defined targets and objectives which provide either insufficient or skewed direction to industry
Implementation and enforcement failures leading to the effects of regulations being diluted or altered
Unintended consequences of existing regulations that hamper circular practices
Capabilities and skills lacking either in-house or in the market at reasonable cost
Custom and habit: ingrained patterns of behaviour by consumers and businesses
1 At market prices excluding the full pricing of externalities such as greenhouse gas emissions, ecosystem degradation and resource depletion 2 Infrastructure defined as fundamental physical and organisational structures and facilities, such as transportation, communication, water and energy supplies and waste treatment
Figure 28: Barrier matrix for the ten prioritised opportunities in Denmark
Critical barrier (‘make or break’)
Very important barrier (to scale-up / acceleration of lever)
Important barrier (to scale-up / acceleration of lever)
Limited or no barrier
CIRCULAR ECONOMY OPPORTUNITIES
ECO
NO
MIC
SM
AR
KET FA
ILUR
ESR
EGU
LATO
RY
FA
ILUR
ESSO
CIA
L FA
CTO
RS
PT_new_19.indd 100 18/06/2015 11:19
60 • DELIVERING THE CIRCULAR ECONOMY – A TOOLKIT FOR POLICYMAKERS
Figure 14: Schematic overview of sector-specific impact quantification
Circular scenario adoption rate, %
Business as usual scenario adoption rate, %
Net value created in sector
EUR million
Net value created in deep-dive sub-sector
EUR million
Scale up factor to full sector
%
Size of sector vs. deep-dive sub-sector
%
Scalability factor
(between 0 and 1)
Additional costs per activity
EUR per unit
Additional revenues and cost savings per activity
EUR per unit
Adoption rate%
Number of units in deep-dive sub-sector
Net value created per unit in deep-dive sub-sector
EUR per unit
SOURCE: Ellen MacArthur Foundation circular economy team
Additional sales
Price / value increase
Material / labour savings
Labour
Services
Materials / components
Energy
CapitalSector size
Deep-dive sub-sector size
A
B
2.2.4 Identify barriers
Objective: Understand the barriers standing in the way of the identified circular economy opportunities, in order to render policy options (Section 2.2.5) more targeted.
End product: Importance and description of barriers for each opportunity, structured by 15 types of barriers in four categories (economic, market failures, regulatory failures, social factors).
Once the circular economy opportunities have been prioritised, it is time to look at the barriers that stand in their way. The toolkit provides a framework to categorise these barriers and analyse their severity. Careful analysis of barriers forms the basis for the next step of arriving at targeted policy options.
The approach in this toolkit is to combine a standard analysis of market failures and regulatory failures with social factors and the economic concerns of business. The methodology refers to 15 types of barrier in four categories. It starts with the economic concerns of businesses that are assessing these opportunities: profitability, capital and technology. It includes the two ‘classic’ barrier categories from economic theory, market failures and regulatory failures, split into ten types, drawing heavily on the EU Impact
PT_new_19.indd 60 18/06/2015 11:19
58 •
DE
LIV
ER
ING
TH
E C
IRC
ULA
R E
CO
NO
MY
– A
TO
OLK
IT F
OR
PO
LIC
YM
AK
ER
S
• Use of biological elements in architecture (e.g. ‘living roofs’ that purify water) • Return of organic construction material to biosphere
• Sharing of floor space reducing demand for new buildings • Shared residential floor space (e.g. Airbnb, Couchsurfing, Hoffice)• Shared office space (e.g. Liquidspace) and increase of desk sharing policies
• Increased use of under-utilised buildings• Multi-purposing of offices and public buildings for better utilisation• Re-purposing of building interiors to increase lifetime of existing buildings
• Coordination of all stakeholders along value chain to reduce structural waste• Energy use optimisation through low-energy houses and smart homes
• Increased reuse and high-value recycling of building components and materials, enabled by • Designing buildings for disassembly• New business models (e.g. other owner of materials than property owner)• Building passports/signatures and reverse logistics ecosystems
Increased teleworking to reduce need for office floor space
Modular production off-site for rapid assembly on-site3D printing of building components
Figure 13: Qualitative assessment of potential of opportunities for the Construction & Real Estate sector in the Denmark pilot
SOURCE: Ellen MacArthur Foundation circular economy team
QUALITATIVE ASSESSMENT OF POTENTIAL
Low potential
High potential
Prioritised for further assessment
Indirectly included as enabler of key sector opportunities
XCHANGE
PT_n
ew_1
9.in
dd
5818
/06/
2015
11
:19
52 • DELIVERING THE CIRCULAR ECONOMY – A TOOLKIT FOR POLICYMAKERS
Figure 11: Results of sector prioritisation in Denmark pilot
NOTE: Only producing sectors (24% of national GVA) and hospitals (3.5% of national GVA) considered SOURCE: Statistics Denmark (2011 data); Danish Business Authority; Danish Environmental Protection Agency; Ellen MacArthur Foundation circular economy team
Producing sectors
Non-producing sector
Prioritised sectors
Size = Gross value added
Food and beverages
Construction
Machinery
Hospitals
Basic metals andfabricated products
Electronic products
Water supply, sewerage
Rubber and plastic products
Electricity, gas
Agriculture, forestry and fishing Pharmaceuticals
Mining and quarrying
ROLE IN NATIONAL ECONOMY
CIR
CU
LAR
ITY
PO
TEN
TIA
L
Packaging(not sized)
PT_new_19.indd 52 18/06/2015 11:19
The Toolkit for policymakers has been developed to support national and regional governments who wish to embark on an a circular economy transition The toolkit is… • a three-step, end-to-end methodology to set
ambition and focus, assess specific opportunities, and analyse economy-wide implications
• a set of 11 tools to identify and quantify circular economy opportunities, identify barriers, map and prioritise policy options
• It also entails a comprehensive case study on Denmark
Full report and more information here: www.ellenmacarthurfoundation.org/programmes/government/toolkit-for-policymakers