cdp iberia 125 report 2011 towards a low carbon … iberia 125 report 2011 towards a low carbon...
TRANSCRIPT

CDP Iberia 125 Report 2011Towards A Low Carbon Recovery
On behalf of 551 investors with assets of US$ 71 trillion
Ecología y Desarrollowww.ecodes.org+34 976 [email protected]
Carbon Disclosure Project (CDP)www.cdproject.net+44 (0) 207 970 [email protected]
CARBON DISCLOSURE PROJECT
Report writer:
Portada 2011 (ingles) 05/12/11 8:34 Página 1
ABRAPP - AssociaçãoBrasileira das EntidadesFechadas de PrevidênciaComplementar
AEGON N.V.
AKBANK T.A.S.
Allianz Global InvestorsKapitalanlagegesellschaftmbH
ATP Group
Aviva Investors
Bank of America MerrillLynch
BlackRock
BP InvestmentManagement Limited
California PublicEmployees’ RetirementSystem
California State Teachers’Retirement System
Calvert AssetManagement Company,Inc.
Catholic Super
CCLA InvestmentManagement Ltd
Ethos Foundation
Generation InvestmentManagement
HSBC Holdings plc
ING
KB Kookmin Bank
KLP
Legg Mason, Inc.
London Pensions FundAuthority
Mitsubishi UFJ FinancialGroup (MUFG)
Morgan Stanley
National Australia Bank
NEI Investments
Neuberger Berman
Newton InvestmentManagement Limited
Nordea InvestmentManagement
PFA Pension
Raiffeisen Schweiz
Royal Bank of ScotlandGroup
Robeco
Rockefeller & Co., Inc.
SAM Group
Schroders
Scottish WidowsInvestment Partnership
SEB
Sompo Japan Insurance Inc.
Standard Chartered
Sun Life Financial Inc.
TD Asset ManagementInc. and TDAM USA Inc.
The Wellcome Trust
Zurich Cantonal Bank
1
2011Carbon Disclosure ProjectInvestor Members
CDP works with investors globally to advance the investment opportunities and reduce the risks posed by climate changeby asking almost 6,000 of the world’s largest companies to report on their climate strategies, GHG emissions and energyuse in the standardized Investor CDP format. To learn more about CDP’s member offering and becoming a member, pleasecontact us or visit the CDP Investor Member section at www.cdproject.net/investormembers
Informe 2011 (ingles) 05/12/11 9:50 Página 1
Daegu Bank
Daiwa Securities Group Inc.
de Pury Pictet Turrettini & Cie S.A.
DekaBank Deutsche Girozentrale
Deutsche Asset Management Investmentgesellschaft mbH
Deutsche Bank AG
Deutsche Postbank Vermögensmanagement S.A.
Development Bank of Japan Inc.
Development Bank of the Philippines (DBP)
Dexia Asset Management
Dexus Property Group
DnB NOR ASA
Domini Social Investments LLC
Dongbu Insurance
DWS Investment GmbH
Earth Capital Partners LLP
East Sussex Pension Fund
Ecclesiastical Investment Management
Ecofi Investissements - Groupe Credit Cooperatif
Edward W. Hazen Foundation
EEA Group Ltd
Elan Capital Partners
Element Investment Managers
ELETRA - Fundação Celg de Seguros e Previdência
Environment Agency Active Pension fund
Epworth Investment Management
Equilibrium Capital Group
Erste Asset Management
Erste Group Bank
Essex Investment Management Company, LLC
ESSSuper
Ethos Foundation
Eureko B.V.
Eurizon Capital SGR
Evangelical Lutheran Church in Canada Pension Plan for Clergy and LayWorkers
Evli Bank Plc
F&C Management Ltd
FAELCE – Fundacao Coelce de Seguridade Social
FAPERS- Fundação Assistencial e Previdenciária da Extensão Rural do RioGrande do Sul
FASERN - Fundação COSERN de Previdência Complementar
Fédéris Gestion d’Actifs
FIDURA Capital Consult GmbH
FIM Asset Management Ltd
FIPECq - Fundação de Previdência Complementar dos Empregados eServidores da FINEP, do IPEA, do CNPq
FIRA. - Banco de Mexico
First Affirmative Financial Network, LLC
First Swedish National Pension Fund (AP1)
Firstrand Limited
Five Oceans Asset Management Pty Limited
Florida State Board of Administration (SBA)
Folketrygdfondet
Folksam
Fondaction CSN
Fondation de Luxembourg
Fondiaria-SAI
Fonds de Réserve pour les Retraites – FRR
Fourth Swedish National Pension Fund (AP4)
FRANKFURT-TRUST Investment-Gesellschaft mbH
Fukoku Capital Management Inc
FUNCEF - Fundação dos Economiários Federais
Fundação AMPLA de Seguridade Social - Brasiletros
Fundação Atlântico de Seguridade Social
Fundação Attilio Francisco Xavier Fontana
Fundação Banrisul de Seguridade Social
Fundação de Assistência e Previdência Social do BNDES - FAPES
FUNDAÇÃO ELETROBRÁS DE SEGURIDADE SOCIAL - ELETROS
Fundação Forluminas de Seguridade Social - FORLUZ
FUNDAÇÃO ITAUBANCO
Fundação Itaúsa Industrial
Fundação Promon de Previdência Social
Fundação Vale do Rio Doce de Seguridade Social - VALIA
Fundação Rede Ferroviaria de Seguridade Social – Refer
Fundação Sistel de Seguridade Social (Sistel)
FUNDIÁGUA - FUNDAÇÃO DE PREVIDENCIA COMPLEMENTAR DACAESB
Baumann and Partners S.A.
BAWAG P.S.K. INVEST GmbH
Bayern LB
BayernInvest Kapitalanlagegesellschaft mbH
BBC Pension Trust Ltd
BBVA
Bedfordshire Pension Fund
Bentall Kennedy
Beutel Goodman and Co. Ltd
BioFinance Administração de Recursos de Terceiros Ltda
BlackRock
Blumenthal Foundation
BNP Paribas Investment Partners
BNY Mellon
BNY Mellon Service Kapitalanlage Gesellschaft
Boston Common Asset Management, LLC
BP Investment Management Limited
Brasilprev Seguros e Previdência S/A.
British Columbia Investment Management Corporation (bcIMC)
BT Investment Management
Busan Bank
CAAT Pension Plan
Cadiz Holdings Limited
Caisse de dépôt et placement du Québec
Caisse des Dépôts
Caixa Beneficente dos Empregados da Companhia Siderurgica Nacional -CBS
Caixa de Previdência dos Funcionários do Banco do Nordeste do Brasil(CAPEF)
Caixa Econômica Federal
Caixa Geral de Depositos
Caja de Ahorros de Valencia, Castellón y Valencia, BANCAJA
Caja Navarra
California Public Employees’ Retirement System
California State Teachers’ Retirement System
California State Treasurer
Calvert Asset Management Company, Inc
Canada Pension Plan Investment Board
Canadian Friends Service Committee (Quakers)
Canadian Imperial Bank of Commerce (CIBC)
CAPESESP
Capital Innovations, LLC
CARE Super Pty Ltd
Carlson Investment Management
Carmignac Gestion
Catherine Donnelly Foundation
Catholic Super
Cbus Superannuation Fund
CCLA Investment Management Ltd
Celeste Funds Management Limited
Central Finance Board of the Methodist Church
Ceres
Christian Super
Christopher Reynolds Foundation
Church Commissioners for England
Church of England Pensions Board
CI Mutual Funds’ Signature Global Advisors
Clean Yield Group, Inc.
Cleantech Invest AG
ClearBridge Advisors
Climate Change Capital Group Ltd
CM-CIC Asset Management
Colonial First State Global Asset Management
Comerica Incorporated
Comite syndical national de retraite Bâtirente
Commerzbank AG
CommInsure
Commonwealth Bank of Australia
Compton Foundation, Inc.
Concordia Versicherungsgruppe
Connecticut Retirement Plans and Trust Funds
Co-operative Financial Services (CFS)
Corston-Smith Asset Management Sdn. Bhd.
CRD Analytics
Crédit Agricole
Credit Suisse
Gruppo Credito Valtellinese
Carbon Disclosure Projet 2011
551 financial institutions with assetsof US$71 trillion were signatories tothe CDP 2011 information requestdated February 1st, 2011
Aberdeen Asset Managers
Aberdeen Immobilien KAG mbH
ABRAPP - Associação Brasileira das Entidades Fechadas de PrevidênciaComplementar
Active Earth Investment Management
Acuity Investment Management
Addenda Capital Inc.
Advanced Investment Partners
Advantage Asset Managers (Pty) Ltd
AEGON Magyarország Befektetési Alapkezelo Zrt.
AEGON N.V.
AEGON-INDUSTRIAL Fund Management Co., Ltd
AFP Integra
AIG Asset Management
Ak Asset Management
AKBANK T.A.S.
Alberta Investment Management Corporation (AIMCo)
Alberta Teachers Retirement Fund
Alcyone Finance
Allianz Elementar Versicherungs-AG
Allianz Group
Altira Group
Amalgamated Bank
AMP Capital Investors
AmpegaGerling Investment GmbH
Amundi AM
ANBIMA – Associação Brasileira das Entidades dos Mercados Financeiro ede Capitais
Antera Gestão de Recursos S.A.
APG Group
Aprionis
Aquila Capital
ARIA (Australian Reward Investment Alliance)
Arisaig Partners Asia Pte Ltd
ARK Investment Advisors Inc.
Arma Portföy Yönetimi A.S.
ASB Community Trust
ASM Administradora de Recursos S.A.
ASN Bank
Assicurazioni Generali Spa
ATP Group
Australia and New Zealand Banking Group Limited
Australian Central Credit Union incorporating Savings & Loans Credit Union
Australian Ethical Investment Limited
AustralianSuper
Aviva
Aviva Investors
AXA Group
Baillie Gifford & Co.
Bakers Investment Group (Australia) Pty Ltd
Banco Bradesco S/A
Banco de Credito del Peru BCP
Banco de Galicia y Buenos Aires S.A.
Banco do Brasil S/A
Banco Nacional de Desenvolvimento Econômico e Social - BNDES
Banco Santander
Banesprev – Fundo Banespa de Seguridade Social
Banesto (Banco Español de Crédito S.A.)
Bank of America Merrill Lynch
Bank of Montreal
Bank Sarasin & Cie AG
Bank Vontobel
Bankhaus Schelhammer & Schattera Kapitalanlagegesellschaft m.b.H.
BANKINTER S.A.
BankInvest
Banque Degroof
Barclays
2
2011 Carbon Disclosure ProjectInvestor Signatories
Informe 2011 (ingles) 05/12/11 9:50 Página 2

NH-CA Asset Management
Nikko Asset Management Co., Ltd.
Nikko Cordial Securities
Nissay Asset Management Corporation
NORD/LB Kapitalanlagegesellschaft AG
Nordea Investment Management
Norfolk Pension Fund
Norges Bank Investment Management (NBIM)
North Carolina Retirement System
Northern Ireland Local Government Officers’ Superannuation Committee(NILGOSC)
Northern Trust
Nykredit
Oddo & Cie
OECO Capital Lebensversicherung AG
Old Mutual plc
OMERS Administration Corporation
Ontario Teachers’ Pension Plan
OP Fund Management Company Ltd
Oppenheim Fonds Trust GmbH
Opplysningsvesenets fond (The Norwegian Church Endowment)
OPSEU Pension Trust
Oregon State Treasurer
Orion Asset Management LLC
Parnassus Investments
Pax World Funds
Pensioenfonds Vervoer
Pension Denmark
Pension Fund for Danish Lawyers and Economists
Pension Protection Fund
Pensionsmyndigheten
PETROS - The Fundação Petrobras de Seguridade Social
PFA Pension
PGGM
Phillips, Hager & North Investment Management Ltd.
PhiTrust Active Investors
Phoenix Asset Management Inc.
Pictet Asset Management SA
PKA
Pluris Sustainable Investments SA
PNC Financial Services Group, Inc.
Pohjola Asset Management Ltd
Portfolio 21 Investments
Porto Seguro S.A.
PREVHAB PREVIDÊNCIA COMPLEMENTAR
PREVI Caixa de Previdência dos Funcionários do Banco do Brasil
PREVIG Sociedade de Previdência Complementar
Provinzial Rheinland Holding
Prudential Investment Management
Psagot Investment House Ltd
PSP Investments
PSS - Seguridade Social
Q Capital Partners Co. Ltd
QBE Insurance Group
Rabobank
Raiffeisen Schweiz
Railpen Investments
Rathbones / Rathbone Greenbank Investments
Real Grandeza Fundação de Previdência e Assistência Social
Rei Super
Reliance Capital Ltd
Resolution
Resona Bank, Limited
Reynders McVeigh Capital Management
RLAM
Robeco
Rockefeller Financial
Rose Foundation for Communities and the Environment
Royal Bank of Canada
Royal Bank of Scotland Group
RREEF Investment GmbH
SAM Group
SAMPENSION KP LIVSFORSIKRING A/S
SAMSUNG FIRE & MARINE INSURANCE
Samsung Securities
Sanlam
Santa Fé Portfolios Ltda
KPA Pension
La Banque Postale Asset Management
La Financiere Responsable
Lampe Asset Management GmbH
Landsorganisationen i Sverige
LBBW - Landesbank Baden-Württemberg
LBBW Asset Management Investmentgesellschaft mbH
LD Lønmodtagernes Dyrtidsfond
Legal & General Investment Management
Legg Mason, Inc.
LGT Capital Management Ltd.
LIG Insurance Co., Ltd
Light Green Advisors, LLC
Living Planet Fund Management Company S.A.
Local Authority Pension Fund Forum
Local Government Super
Local Super
Lombard Odier Darier Hentsch & Cie
London Pensions Fund Authority
Lothian Pension Fund
Lupus alpha Asset Management GmbH
Macif Gestion
Macquarie Group Limited
MAMA Sustainable Incubation AG
Man
Maple-Brown Abbott Limited
Marc J. Lane Investment Management, Inc.
Maryland State Treasurer
Matrix Asset Management
McLean Budden
MEAG MUNICH ERGO Asset Management GmbH
Meeschaert Gestion Privée
Meiji Yasuda Life Insurance Company
Mendesprev Sociedade Previdenciária
Merck Family Fund
Meritas Mutual Funds
MetallRente GmbH
Metrus – Instituto de Seguridade Social
Metzler Investment Gmbh
MFS Investment Management
Midas International Asset Management
Miller/Howard Investments
Mirae Asset Global Investments Co. Ltd.
Mirae Asset Securities Co., Ltd.
Missionary Oblates of Mary Immaculate
Mistra, Foundation for Strategic Environmental Research
Mitsubishi UFJ Financial Group (MUFG)
Mizuho Financial Group, Inc.
Mn Services
Monega Kapitalanlagegesellschaft mbH
Morgan Stanley
Motor Trades Association of Australia Superannuation Fund Pty Ltd
Mutual Insurance Company Pension-Fennia
Natcan Investment Management
Nathan Cummings Foundation, The
National Australia Bank
National Bank of Canada
National Grid Electricity Group of the Electricity Supply Pension Scheme
National Grid UK Pension Scheme
National Pensions Reserve Fund of Ireland
National Union of Public and General Employees (NUPGE)
NATIXIS
Nedbank Limited
Needmor Fund
NEI Investments
Nelson Capital Management, LLC
Nest Sammelstiftung
Neuberger Berman
New Amsterdam Partners LLC
New Mexico State Treasurer
New York City Employees Retirement System
New York City Teachers Retirement System
New York State Common Retirement Fund (NYSCRF)
New Zealand Earthquake Commission
Newton Investment Management Limited
NGS Super
Futuregrowth Asset Management
Gartmore Investment Management Ltd
GEAP Fundação de Seguridade Social
Generali Deutschland Holding AG
Generation Investment Management
Genus Capital Management
Gjensidige Forsikring ASA
GLS Gemeinschaftsbank eG
Goldman Sachs Group Inc.
GOOD GROWTH INSTITUT für globale Vermögensentwicklung mbH
Governance for Owners
Government Employees Pension Fund (“GEPF”), Republic of South Africa
Green Cay Asset Management
Green Century Capital Management
Groupe Crédit Coopératif
Groupe Investissement Responsable Inc.
GROUPE OFI AM
Grupo Banco Popular
Grupo Santander Brasil
Gruppo Credito Valtellinese
Gruppo Montepaschi
Guardian Ethical Management Inc
Guardians of New Zealand Superannuation
Guosen Securities Co., LTD.
Hang Seng Bank
Harbourmaster Capital
Harrington Investments, Inc
Hauck & Aufhäuser Asset Management GmbH
Hazel Capital LLP
HDFC Bank Ltd
Health Super Fund
Healthcare of Ontario Pension Plan (HOOPP)
Henderson Global Investors
Hermes Fund Managers
HESTA Super
HSBC Global Asset Management (Deutschland) GmbH
HSBC Holdings plc
HSBC INKA Internationale Kapitalanlagegesellschaft mbH
Hyundai Marine & Fire Insurance. Co., Ltd.
Hyundai Securities Co., Ltd.
Ibgeana Society of Assistance and Security SIAS / Sociedade Ibgeana deAssistência e Seguridade (SIAS)
IDBI Bank Ltd
Ilmarinen Mutual Pension Insurance Company
Impax Group plc
IndusInd Bank Limited
Industrial Bank (A)
Industrial Bank of Korea
Industry Funds Management
Infrastructure Development Finance Company
ING
Insight Investment Management (Global) Ltd
Instituto de Seguridade Social dos Correios e Telégrafos- Postalis
Instituto Infraero de Seguridade Social - INFRAPREV
Instituto Sebrae De Seguridade Social - SEBRAEPREV
Insurance Australia Group
Investec Asset Management
Irish Life Investment Managers
Itau Asset Management
Itaú Unibanco Holding S A
Janus Capital Group Inc.
Jarislowsky Fraser Limited
JPMorgan Chase & Co.
Jubitz Family Foundation
Jupiter Asset Management
Kaiser Ritter Partner (Schweiz) AG
KB asset Management
KB Kookmin Bank
KBC Asset Management NV
KDB Asset Management Co., Ltd.
KEPLER-FONDS Kapitalanlagegesellschaft m. b. H.
KfW Bankengruppe
KlimaINVEST
KLP
Korea Investment Management Co., Ltd.
The Korea Teachers Pension (KTP)
Korea Technology Finance Corporation (KOTEC)
3
Investor Signatories
Informe 2011 (ingles) 05/12/11 9:50 Página 3
The Russell Family Foundation
The Shiga Bank, Ltd.
The Standard Bank Group
The United Church of Canada - General Council
The University of Edinburgh Endowment Fund
The Wellcome Trust
Third Swedish National Pension Fund (AP3)
Threadneedle Asset Management
Tokio Marine & Nichido Fire Insurance Co., Ltd.
Toronto Atmospheric Fund
Trillium Asset Management Corporation
Triodos Investment Management
Tryg
UBS
UniCredit Group
Union Asset Management Holding AG
Unipension
UNISON staff pension scheme
UniSuper
Unitarian Universalist Association
United Methodist Church General Board of Pension and Health Benefits
United Nations Foundation
Universities Superannuation Scheme (USS)
Vancity Group of Companies
VCH Vermögensverwaltung AG
Veris Wealth Partners
Veritas Investment Trust GmbH
Vermont State Treasurer
Vexiom Capital, L.P.
VicSuper Pty Ltd
Victorian Funds Management Corporation
VietNam Holding Ltd.
Vision Super
VOLKSBANK INVESTMENTS
Waikato Community Trust Inc
Walden Asset Management, a division of Boston Trust & InvestmentManagement Company
WARBURG - HENDERSON Kapitalanlagegesellschaft für Immobilien mbH
WARBURG INVEST KAPITALANLAGEGESELLSCHAFT MBH
Wells Fargo & Company
West Yorkshire Pension Fund
WestLB Mellon Asset Management (WMAM)
Westpac Banking Corporation
White Owl Capital AG
Winslow Management, A Brown Advisory Investment Group
Woori Bank
Woori Investment & Securities Co., Ltd.
YES BANK Limited
York University Pension Fund
Youville Provident Fund Inc.
Zegora Investment Management
Zevin Asset Management
Zurich Cantonal Bank
SAS Trustee Corporation
Sauren Finanzdienstleistungen GmbH & Co. KG
Schroders
Scotiabank
Scottish Widows Investment Partnership
SEB
SEB Asset Management AG
Second Swedish National Pension Fund (AP2)
SEIU Master Trust
Seligson & Co Fund Management Plc
Sentinel Investments
SERPROS - Fundo Multipatrocinado
Seventh Swedish National Pension Fund (AP7)
Shinhan Bank
Shinhan BNP Paribas Investment Trust Management Co., Ltd
Shinkin Asset Management Co., Ltd
Siemens Kapitalanlagegesellschaft mbH
Signet Capital Management Ltd
SMBC Friend Securities Co., LTD
Smith Pierce, LLC
SNS Asset Management
Social(k)
Sociedade de Previdencia Complementar da Dataprev - Prevdata
Solaris Investment Management Limited
Sompo Japan Insurance Inc.
Sopher Investment Management
SPF Beheer bv
Sprucegrove Investment Management Ltd
Standard Chartered
Standard Chartered Korea Limited
Standard Life Investments
State Bank of India
State Street Corporation
StatewideSuper
StoreBrand ASA
Strathclyde Pension Fund
Stratus Group
Sumitomo Mitsui Banking Corporation
Sumitomo Mitsui Card Company, Limited
Sumitomo Mitsui Finance & Leasing Co., Ltd
Sumitomo Mitsui Financial Group
The Sumitomo Trust & Banking Co., Ltd.
Sun Life Financial Inc.
Superfund Asset Management GmbH
SUSI Partners AG
Sustainable Capital
Svenska Kyrkan, Church of Sweden
Swedbank AB
Swiss Re
Swisscanto Holding AG
Syntrus Achmea Asset Management
T. Rowe Price
T. SINAI KALKINMA BANKASI A.S.
T.GARANTI BANKASI A.S.
Tata Capital Limited
TD Asset Management Inc. and TDAM USA Inc.
Teachers Insurance and Annuity Association – College Retirement EquitiesFund (TIAA-CREF)
Telluride Association
Tempis Asset Management Co. Ltd
Terra Forvaltning AS
TerraVerde Capital Management LLC
The Brainerd Foundation
The Bullitt Foundation
The Central Church Fund of Finland
The Collins Foundation
The Co-operative Asset Management
The Co-operators Group Ltd
The Daly Foundation
The GPT Group
The Hartford Financial Services Group, Inc.
The Japan Research Institute, Limited
The Joseph Rowntree Charitable Trust
The Local Government Pensions Institution
The Pension Plan For Employees of the Public Service Alliance of Canada
The Pinch Group
The Presbyterian Church in Canada
4
Carbon Disclosure Project 2011 – Iberia Report 125
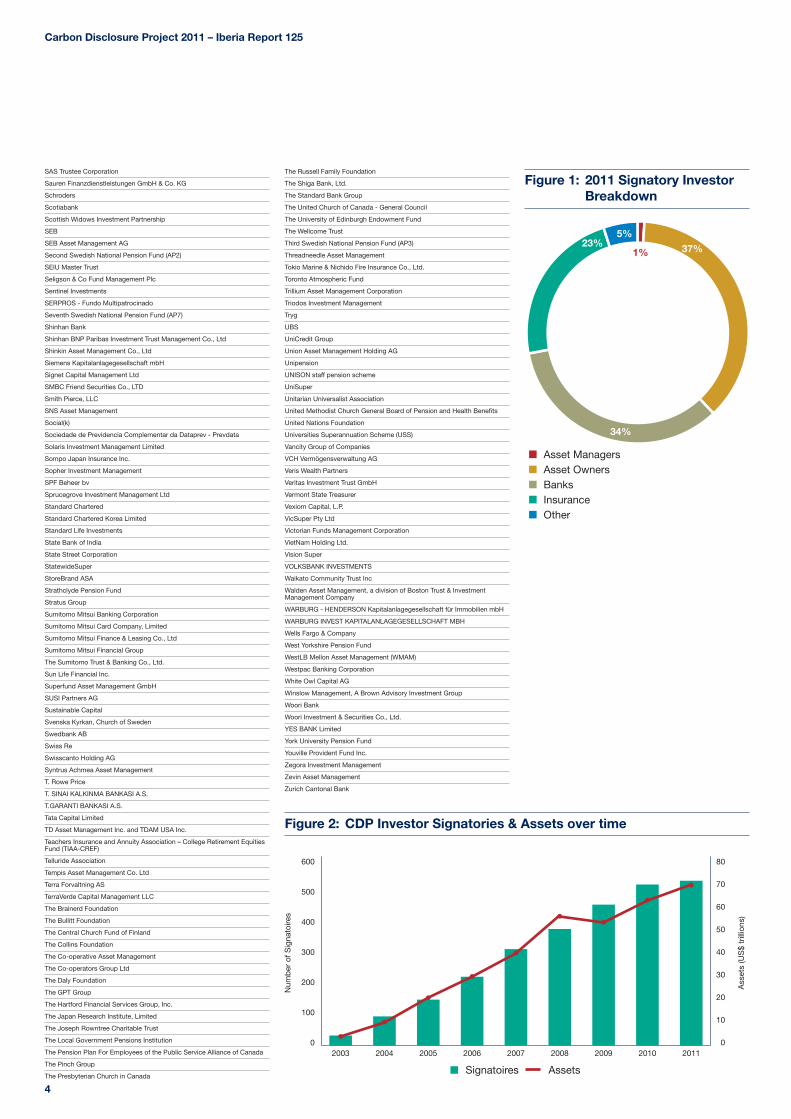
Figure 1: 2011 Signatory InvestorBreakdown
Figure 2: CDP Investor Signatories & Assets over time
Num
ber
of S
igna
toire
s
Ass
ets
(US
$ tr
illio
ns)
600
500
400
300
200
100
02003 2004 2005 2006 2007 2008 2009 2010 2011
80
70
60
50
40
30
20
10
0
Signatoires Assets
Informe 2011 (ingles) 05/12/11 9:50 Página 4
5
CEO ForewordCorporations, investors and governments today are faced with a choice: to compete aggressively for finite resources, or toadvance towards a low-carbon economy that enables sustainable, profitable growth, whilst reducing reliance onincreasingly scarce materials.
Last year global energy-related carbon dioxide emissions reached a record high. The International Energy Agency estimatesmade for bleak reading but compounded the necessity to take bold and decisive action if we are to have any chance oflimiting temperature increase to the 2°C level agreed by world leaders to protect against catastrophic climate change.
What’s more, rising energy demands are competing for a limited supply of fossil fuels. The competition for increasinglyscarce natural resources is putting pressure on commodity prices and having a growing impact both socially andeconomically. It is clear that today, more than ever, we must build momentum to decouple economic growth fromemissions.
Managing carbon emissions and protecting the business from climate change impacts are fundamental to achievingsustainable and strong shareholder returns. Earlier this year, investment consultancy Mercer released a report concludingthat the best way for institutional investors to manage portfolio risk associated with climate change may be to shift 40% oftheir portfolios into climate-sensitive assets with an emphasis on those that can adapt to a low-carbon environment.
An important part of an investor’s strategy should be to engage with the companies in which they invest to encourageperformance improvement. Carbon Action is a new initiative launched by CDP this year. It is driven by a leading group ofinvestors to encourage their portfolio companies to reduce emissions by investing in emissions reducing activities with asatisfactory payback period. Carbon Action reflects a growing recognition that there is a huge range of carbon reducingactivities that companies can undertake that have a very clear business case. It is therefore in the interests of all investorsand not just the more active owners of investments to ensure these actions are taken.
As the management of carbon continues to move into companies’ core business strategies and mainstream investmentthinking, demand for primary corporate climate change information grows around the world. As well as working on behalf of551 institutional investors to gather relevant information from large corporations around the world, CDP is also working withglobal businesses and governments to strengthen the resilience and sustainability of their supply chains through the CDPSupply Chain program. CDP Cities has launched to help the world’s major cities reduce climate change risk and bolstereconomic growth; and CDP Water Disclosure is now in its second year of working with major global companies to improvewater management. A key part of CDP’s strategy is to ensure the effective use of data collected. To assist with thiscompanies are able to obtain tools that help them to measure, report and manage carbon more effectively, through CDPReporter Services.
It is through partnerships that CDP can achieve the largest impact. In Spain and Portugal we are delighted to be workingwith our local partners, ECODES, Euronatura and PWC. In addition, we highly value the continued support of our GlobalAdvisor, PwC, as well as that of Accenture, Microsoft, SAP and Bloomberg. These and our other partners around the worldare integral to the acceleration of CDP’s mission.
Whilst we wait patiently for much needed global regulation, business must continue to forge ahead, innovate and seek outopportunities by doing more with less. The decisions that perpetuate a legitimate, low-carbon and high growth economywill bring considerable value to those that have the foresight to make them. The information contained in this report and thecompanies’ responses assist in illuminating that path.
Paul SimpsonCEOCarbon Disclosure Projet
CEO Foreword
Informe 2011 (ingles) 05/12/11 9:50 Página 5
Letter from SpainClimate change is recognized as one of the biggest challenges of the 21st century. The economic model of recent decadeshas proven itself to be flawed and unsustainable and the current financial and economic crisis rather than addinguncertainty or acting as an excuse to avoid dealing with this challenge should spur us to bring about a change in theeconomic system that promotes the inevitable transition to a green economy, sustainable and low in carbon emissions.
This transition requires, however significant leadership and shared efforts by all relevant stakeholders. If we act together wewill make it possible for new production and consumption models that appropriately integrate the environmental componentto become prime drivers of economic growth, creating new areas of economic activity and new quality employmentopportunities. This will also place us on a path of greater competitiveness in the international arena, within a medium andlonger term time horizon.
In this new path, the role of the private sector is of paramount importance. The integration of climate change intocompanies’ strategic plans, will increase their competitiveness in the short term by identifying opportunities to reduce theircarbon footprint. Moreover, it will be possible to assess and anticipate the potential risks associated with the impacts ofclimate change.
And within a broader time horizon, in the context of an economy that must decouple itself from the emissions ofgreenhouse gases by 2050 in order to ensure sustainability, private sector is a key player expected to drive change bytaking advantage of opportunities created in strategic industries. As citizens and civil society more generally becomeincreasingly informed and aware, they are demanding this type of commitment from all the economic and industrial agents.
It is very satisfying to find evidence in the CDP 2011 results, that Spanish and Portuguese companies are engaged in thiscommon task and are making steady strides in the direction of more sustainable and low carbon models. This edition of thereport shows the increasingly high percentage of companies in our peninsula that are integrating climate change into theirbusiness strategies, that adopt proactive policies to reduce their emissions and that consider it a source of businessopportunities. This commitment to the real economy as well as a new approach to addressing business challenges isespecially gratifying at a time when the financial economy seems to dominate the scene. Therefore, it should be valued as agood indicator of the maturity of our private sector. However, further work is needed in this endeavor in order to convert theopportunities associated with climate change into a common reality.
Additionally, the public sector must go beyond its leadership role in setting reduction targets sufficiently ambitious toachieve the environmental objective of not exceeding a 2°C rise in temperature and in ensuring that carbon is priced at alevel that makes investments in clean technologies profitable. Governments must also put in place mechanisms that attractprivate investments into these new areas of activity by promoting public-private partnership. The policies that have beenuseful during the last century will not help us to solve the problems of the 21st century. The Government of Spain hasshown a firm commitment in the fight against climate change and has launched various initiatives to promote the transitiontowards a low carbon economy in our country. We are confident that in the coming years we will see a continuation of theseefforts and that the Spanish private sector, as evidenced in the results of CDP2011, will further contribute to the continuityand success of this venture. In order to achieve this, it is vital that companies get more involved, take on greater social,environmental and climate related commitments and that citizens and consumers become more keenly aware of this reality.Therefore, we would like to extend our gratitude to CDP as well as all the participating companies of the 2011 edition, bothin Portugal and Spain, for their efforts as well as the admirable results and encourage all involved to continue to work in thissame direction.
Teresa Ribera RodríguezSecretary of State for Climate Change in Spain
6
Carbon Disclosure Project 2011 – Iberia Report 125
Informe 2011 (ingles) 05/12/11 9:50 Página 6
Letter from Portugal
Climate change is an unprecedented global challenge that is impacting on economic and social development worldwide.The challenges ahead are of great magnitude, therefore all citizens; the public and the private sector; scientists and policy-makers, should engage in promoting and implementing a proper use of both scientific knowledge and the principles ofeconomic sustainability. In addition, it is crucial that all stakeholders identify and work with the solutions that the world isdemanding.
In spite of the current economic adverse situation, Portugal has an enormous wealth that deserves further investigation andshould be able to find a way out of the crisis by promoting and exploring the opportunities of a “greener economy”,achieving the objectives of energy security, sustainability and competitiveness. In fact, Governments and private sectorindustries must accelerate the transition to a low-carbon economy at a global level. To start with, they need to take intoaccount the climatic vulnerability of the current economic model. Secondly, they have to manage their resources and theiremissions in a more efficient way.
The Carbon Disclosure Project requests companies to disclose their greenhouse gas emissions and climate changestrategies on behalf of 551 signatories with US$71 trillion in assets. Company responses are being scored on the qualityand completeness of their carbon disclosure and on their carbon performance. At the same time, it is worth noting thatbusinesses themselves are moving in the right direction by undertaking their own assessments. In this framework, the CDPwill contribute to the internationalization of Portuguese companies by making public company responses and the Iberia 125report including the company scores on disclosure and performance available on the CDP website. Furthermore, CDP willpromote the visibility of Portuguese companies and this will render them more attractive to long-term investors who arecommitted to energy efficiency, renewable energy and low-carbon exposure.
The assessment of Portuguese companies will assist in formalizing and displaying its climate strategy. Such a strategyshould: a) take into account Portugal’s economic, geographic and social attributes; b) implement proactive mitigation andadaptation policies; and c) take advantage of the opportunities for change that are arising out of the current crisis. Followingthose recommendations - and having Portuguese emissions in 1990 as the reference - Portugal will be able to meet theEuropean target of reducing greenhouse gas emissions by 20% or 30% until 2020.
The negotiation of a future climate regime post 2012 is currently under way and in a moment like this, the MAMAOTacknowledges the importance of CDP assessing Portugal’s business sector efforts to mitigate and adapt to climatechange, and also by promoting the international visibility of Portuguese companies.
Assunção CristasMinister of Agriculture, Sea, Environment and Regional Planning
7
Letter from Portugal
Informe 2011 (ingles) 05/12/11 9:50 Página 7
Víctor Viñuales EdoCEO ECODES
8
Prologue from ECODESWe live in times of great uncertainty and of multiple crises. Spain, Portugal and many other countries are experiencing adeep and unprecedented economic and social crisis. Experts as well as ordinary citizens spend their mornings carefullyscrutinizing the evolving risk premium paid by their governments. Economic jargon is on the front pages of dailynewspapers. Days pass at a frenetic pace while there are weeks that seem like years... Therefore it is not surprising that themedia - and consequently the political class - live by and for the short-term.
Meanwhile, there are environmental problems that have been developing over many years that we must now deal with andthat will require a great and long-term effort from all of us. Indicators of environmental unsustainability are increasing acrossthe globe. The recent accident in Fukushima, Japan, for example, has demonstrated that the shift towards a global energysystem that is more efficient, safe and renewable is urgently needed. The British Petroleum oil spill leads us towards similarconclusions. Evidence of evolving climate change is becoming more worrisome. In short, the "environmental risk premium"is also growing.
The challenge that we now face is how to deal simultaneously with the urgent and important economic and financial crisis,the urgent and important social crisis and the urgent and important environmental crisis. All these crises coexist, overlapand are interdependent and should therefore be resolved in an integrated fashion. And in order to be able to succeed in thisendeavor, the firm commitment of companies is essential. They all must exercise their social responsibility and integratetheir internal search for value with the objective of creating value for society at large.
Companies which have voluntarily completed the Carbon Disclosure Project (CDP) questionnaire have demonstrated thatthey are working to tackle climate change. The CDP signatory financial institutions use this information when makinginvestment decisions, thus creating a virtuous circle that rewards the more proactive companies and that also promotes ashift towards the use of environmental policies in the tens of thousands of small and medium enterprises that are part oftheir supply chains. All of these companies are creating shared value for themselves and for society.
Carbon Disclosure Project has established itself as a remarkably powerful tool to encourage movement towardssustainability in millions of companies worldwide. And the good news is that this remains so despite the deep economic crisis that we are experiencing. The pages of this2011 CDP 125 Iberia Report are evidence of this fact. It is encouraging to note that in this period of crisis that we are living,the low-carbon economy that we so desperately need is already being built. Let's continue on this path.
Carbon Disclosure Project 2011 – Iberia Report 125
Informe 2011 (ingles) 05/12/11 9:50 Página 8
9
PwC Commentary
María Luz CastillaDirector of Sustainability and Climate Change, PwC Spain
PwC Commentary: The advance of an integrated reporting modelThe business drivers for long term success are understood to be increasingly non financial. Current methods of corporatereporting have led many stakeholders to question the relevance and reliability of annual financial reports as a basis formaking economic decisions. Sustainability and climate change reports have suffered similar weaknesses, usually appearingdisconnected from the organization's financial reports. A more integrated approach is needed.
The CDP initiative is advancing the consideration of climate change in the business and financial context. The 2011 Iberian125 responses to the CDP Investor questionnaire show that organizations are incorporating climate change into theirbusiness strategies. Corporations are acknowledging the opportunities presented by a low carbon and sustainable growthenvironment and are reporting on the actions and decisions being made to realize them. As well as strategy CDP also askscompanies to report on the integration of climate change into corporate risk management, opportunity development,remuneration, KPIs and internal and external reporting.
As the construct of a company´s value shifts towards the intangible the business community is disclosing significantly morenon-financial information that underpins how value is and will be created. Examples include low carbon products andservices, motivation of employees and engagement with suppliers and other stakeholders.
This shift in thinking is occurring at a time when global reporting frameworks continue to place heavy emphasis on financialdisclosure and performance. While financial systems were not designed to capture all of the non-financial inputs needed toreflect the contribution of business to society, there is a growing realization that a more progressive reporting model isneeded. A few leading companies are beginning to challenge established boundaries of how performance is measured andreported. Together with major corporate reporting associations these companies have also begun developing a frameworkfor the future integrated report.
Leading corporations are rethinking their business and reporting models, how they manage and drive sustainable, profitablegrowth and how they measure critical non-financial information. These new reporting models connect areas of corporateinformation; consider all risks whether economic, social or environmental; have an increased focus on the future andbusiness strategy; consider the short, medium and long-term; respond to stakeholder interests; and consider the widervalue chain. In turn, this shift in mindset appears to help corporations envision the future and build competitive advantage.
An important element in the new reporting model will be climate change. Reducing emissions can lead to innovation,identification of cost savings and development of commercial opportunity. Responding to CDP is a key step towards moremature corporate reporting and the consideration of climate change in the business context that is now the expectation ofthe capital markets.
Informe 2011 (ingles) 05/12/11 9:50 Página 9

11
Contents 2011 Carbon Disclosure ProjectMembers 1
2011 Carbon Disclosure ProjectSignatories 2
Foreword: Paul Simpson, CEO, Carbon Disclosure Project 5
Letter from Spain 6
Letter from Portugal 7
Prologue from Ecodes 8
Comment from PwC 9
Executive Summary 12
Towards a low carbon economic recovery 12
Key findings of CDP 2011 Iberia 125 13
Comment from BBVA 15
Comment from Telefónica 16
Political context of climate change for business 17
The politics of climate change in Spain 17
The politics of climate change in Portugal 18
Highlights in 2011 21
The business response to climate change 21
Business strategy and Board oversight 22
Emissions reduction targets 23
Emissions reduction initiatives 24
Emissions reductions 25
External verification of emissions inventories 26
2011 leaders 28
Sector analysis 31
Financials 32
Industrials 34
Utilities 36
Appendix I: Table of emissions, scores and sector information by company 38
Appendix II:Global key trends summary 44
Appendix III: Responses: Historical trends 46
Contents
Informe 2011 (ingles) 05/12/11 9:50 Página 11

12
Towards a low carboneconomic recovery
Although the impacts of the currenteconomic crisis are primarily financial,we are also experiencing anenvironmental and social crisis.Financial institutions and companies inSpain, Portugal and the rest of theworld are confronted with financialdifficulties as well as increasedcompetition for finite resources (energy,water, minerals, crops, etc.) and severesocial and employment challenges.
The preventative and mitigation actionswhich companies are taking to addressclimate change are particularly relevantin these circumstances, making iteasier for them to avoid risks, reducethe costs associated with energy andraw materials and develop newbusiness and employmentopportunities in the transition towardsa low carbon economy.
By promoting corporate transparencyon climate change policy and
practices, CDP seeks to encourageimprovements in their management ofclimate change. This year CDP sent itsannual questionnaire to the 125 largestlisted companies in Spain and Portugalasking them to measure and reportwhat climate change means for theirbusiness. The information provided bythe 50 companies that responded tothis questionnaire provides valuableinsight into the business strategiescompanies are using to prepare for aresource constrained world and showsa shift in company strategy to preparebetter for a low carbon economy andact on the business opportunities. Thereport assesses which are the leadingcompanies in each sector andinvestors, governments, researchersand interest groups, can use thesefinding and the responses fromcompanies to make better informeddecision.
In addition to a global focus CDP alsohas a regional approach; in 2011 theresponses from Spain and Portugalwere combined to form the Iberia 125
Executive Summary
Figure 3: Evolution of the sample (2008-2011)
SpainPortugal
2011 responding companies
0 10 20 30 40 50 60 70 80 90 100 110 120 130
35
2011 sample
85
2010 responding companies
34
2010 sample
85
2009 responding companies
35
2009 sample
85
13
40
12
40
7
20
2008 responding companies
25
2008 sample
35
“The emerging policyenvironment aroundemissions and climatechange is one of thedefining drivers of GrupoFerrovial’s businesssectors over the comingdecades. The number ofclimate related businessopportunities and risks areincreasing, and the time isripe for the Ferrovial todetermine actions to alignits business units’collective response to thischallenge”
FERROVIAL
Informe 2011 (ingles) 05/12/11 9:50 Página 12
13
Executive Summary
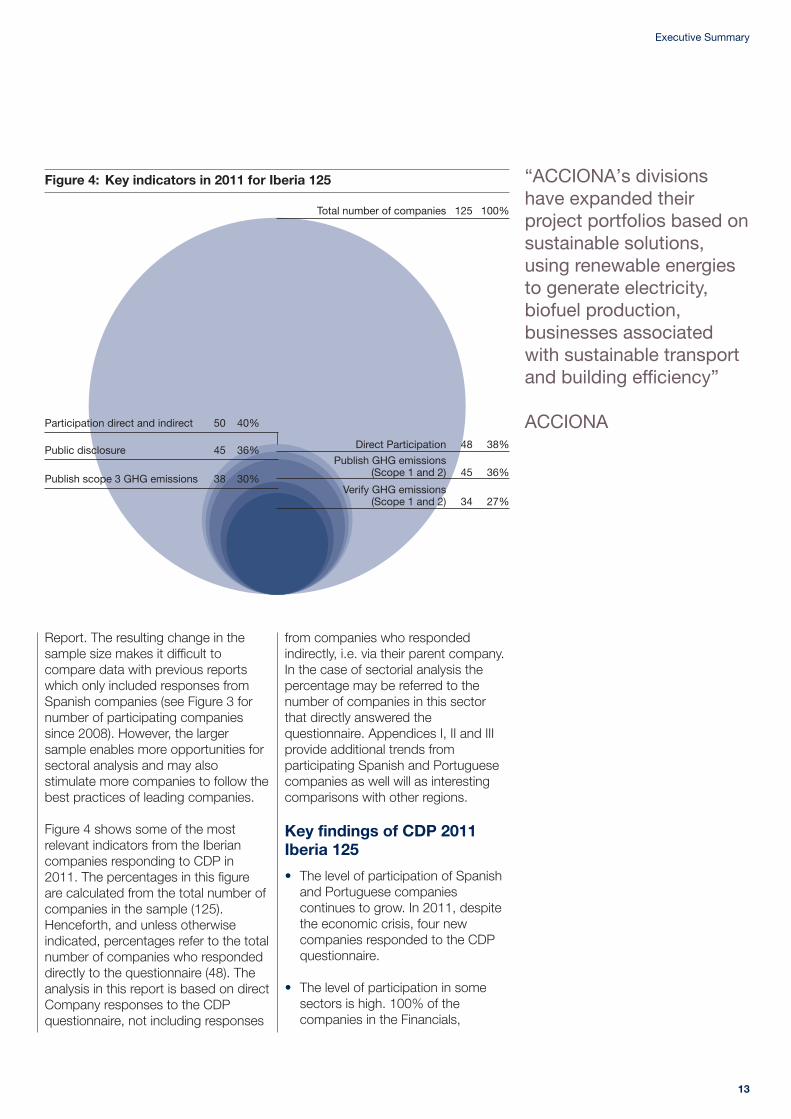
Report. The resulting change in thesample size makes it difficult tocompare data with previous reportswhich only included responses fromSpanish companies (see Figure 3 fornumber of participating companiessince 2008). However, the largersample enables more opportunities forsectoral analysis and may alsostimulate more companies to follow thebest practices of leading companies.
Figure 4 shows some of the mostrelevant indicators from the Iberiancompanies responding to CDP in2011. The percentages in this figureare calculated from the total number ofcompanies in the sample (125).Henceforth, and unless otherwiseindicated, percentages refer to the totalnumber of companies who respondeddirectly to the questionnaire (48). Theanalysis in this report is based on directCompany responses to the CDPquestionnaire, not including responses
from companies who respondedindirectly, i.e. via their parent company.In the case of sectorial analysis thepercentage may be referred to thenumber of companies in this sectorthat directly answered thequestionnaire. Appendices I, II and IIIprovide additional trends fromparticipating Spanish and Portuguesecompanies as well will as interestingcomparisons with other regions.
Key findings of CDP 2011Iberia 125
• The level of participation of Spanishand Portuguese companiescontinues to grow. In 2011, despitethe economic crisis, four newcompanies responded to the CDPquestionnaire.
• The level of participation in somesectors is high. 100% of thecompanies in the Financials,
Total number of companies 125 100%
Direct Participation 48 38%
Verify GHG emissions (Scope 1 and 2) 34 27%
Publish GHG emissions (Scope 1 and 2) 45 36%
Participation direct and indirect 50 40%
Public disclosure 45 36%
Publish scope 3 GHG emissions 38 30%
Figure 4: Key indicators in 2011 for Iberia 125 “ACCIONA’s divisionshave expanded theirproject portfolios based onsustainable solutions,using renewable energiesto generate electricity,biofuel production,businesses associatedwith sustainable transportand building efficiency”
ACCIONA
Informe 2011 (ingles) 05/12/11 9:50 Página 13

Carbon Disclosure Project 2011 – Iberia Report 125
14
Industrials and the Utilities sectorresponded to the 2011 CDPquestionnaire. Only two companiesin these sectors decided to maketheir responses not publiclyavailable.
• The carbon disclosure scores andthe carbon performance bandsreveal that some companies arereaching high levels of transparencyand performance. 38% (18) of theresponding companies achieved adisclosure score of greater than 70and reached a carbon performanceband of A, A- or B. While 13% (6) ofthe responding companies scoredeven higher and achieved a carbondisclosure score greater than 85and a carbon performance band ofA or A-.
• Although the level of emissionsverification for the Iberia 125 samplestands out from the rest of regionalsamples, only 40% of companiesthat verify their Scope 1 and 2emissions meet CDP’s newverification criteria.
• Companies in the Iberia 125 sampleare taking steps towards a lowcarbon economy. 96% (46) ofcompanies claim to have integratedclimate change into their overallbusiness strategy, and 79% (38)provide products and services thatenable the reduction of carbonemissions. In addition, 25 (52%) ofrespondents reduced their absolutegreenhouse gas emissions in thepast year.
Figure 5: Key trends indicators1
2011 (Iberia 125)2010 (Spain 85)
Board or other senior management oversight of climate change
Provide incentives for the management of climate change
Have emissions reductions targets
Have emissions reductions initiatives
Have products and services that enable GHG emissions reductions
Identify regulatory risks linked to climate change
Identify regulatory opportunities linked to climate change
Externally verify their emissions (scope 1)
Externally verify their emissions (scope 2)
0% 10% 20% 30% 40% 50% 60% 70% 80% 90% 100%
79%
87%
56%
53%
65%
71%
94%
84%
79%
72%
85%
81%
88%
84%
77%
69%
73%
63%
1 The percentage of total of responding companies. Pleasenote that between 2010 and 2011 the sample sizeincreased from 85 to 125 companies.
Informe 2011 (ingles) 05/12/11 9:50 Página 14
15
Climate Change and renewable energy: a sectorial approachJorge C. Sicilia Serrano, Chief Economist, BBVA
Climate change is a long-termthreat to the world, given theextraordinary acceleration ofcurrent global warming trends,which could have catastrophicconsequences for millions ofpeople. There is increasingevidence of the impact of hightemperatures on food production,and rising sea level, which may endup flooding areas that are currentlyinhabited. Scientists attribute theseobservations to an increasingconcentration of greenhouse gases(GHG) in the atmosphere.
Industrialization and humanactivities have been linked to thenet increase in GHG emissions as aresult of agricultural activities, fossilfuel burning and deforestation. Themain contributor to the increase inthis concentration is CO2, annualemissions of which increased by80% between 1970 and 2004,when they represented nearly 77%of greenhouse gas emissions fromhuman activity.
Taking urgent action is becomingmore and more pressing, asindicated by the latest study bythe Intergovernmental Panel onClimate Change (IPCC), accordingto which, the downward trend inCO2 emissions per unit of energysupplied, which took placebetween 1970 and the year 2000,turned positive after this date.According to this Agency of theUnited Nations, to keep the
increase in long-term averagetemperature between 2 and 2.4°C, global carbon emissions mustbe reduced by at least 50%between the year 2000 and 2050,and it might have to be evenmore. The costs will besubstantial: the InternationalEnergy Agency estimates that a50% emissions reduction scenariowill require an investment of $46trillion by 2050.
The role of governments inproviding the multilateral strategicplans is essential, as a result ofgrowing global energy demandexpected by a booming middleclass in emerging markets. Theburning of fossil fuels for powergeneration is the main source ofCO2 emissions, and therefore,governments and privatecompanies are focusing theirefforts on increasing the share ofrenewable sources in electricitygeneration, preparing for a lowcarbon future. This commitment isbeginning to be decided in bothdeveloped as well as emergingcountries.
The future of renewable energy ispromising. According to thespecial report on renewable energysources by the IPCC from 2011,renewable energies have "hugepotential in mitigating GHGemissions". Despite efforts by theUnited States and Europe torecover from the current financial
turmoil, global investment inrenewable energy has continued torise as China has entered thearena. The private sector andenergy companies have not beenexactly kept on the sidelines, aidedby government incentives ofsubsidies and stimulus funds.
BBVA is strategically committed toproviding funding and advice onrenewable energy operations, asector which it leads and whereonly in 2010 it financed andadvised the installation of over4,500 MW, increasing itsinvestment by 36% compared to2009.
In this process, BBVA has receivedthe most prestigious recognition inthe industry. In 2010 it was the topadvisor in the Mergers andAcquistions of Renewable Energyglobal ranking and received theBloomberg New Energy FinanceAward for reaching the top spot. Inturn, the database specialistDealogic again stresses thestrength of BBVA in fundingrenewable energy projects in thefirst half of 2011. BBVA gets thesecond spot in this ranking, for itspart in the funding major projects inEurope, Asia and the Americas. Bytype of renewable energy,according to the InfrastructureJournal, BBVA is in third placeglobally in wind energy and leadsthe rankings in solar andphotovoltaic power.
Climate Change and renewable energy: a sectorial approach
Informe 2011 (ingles) 05/12/11 9:50 Página 15
Carbon Disclosure Project 2011 – Iberia Report 125
16
The value of climate change for Telefónica: a business focus with an impact on resultsSince 2007 we have been workingon our strategy for climate changeand energy efficiency. In 2010 thecompany was awarded 90 pointsout of 100 in the CarbonDisclosure Leadership Index(CDLI). The fact that we are theonly Spanish company included inthe CDLI Global 500 for the year isthe source of considerable pride,but also makes us feel obliged toshare our experience with theother companies involved in CDPIberia 2011.
The first lesson learnt within theCDP focuses on the way we ascompanies need to manage therisks and opportunitiesassociated with climate change.It is therefore vital to perform acomprehensive analysis incombination with the audit,operations and businessdepartments. Two of the greatestrisks we have identified are:obligations in terms of reportingand emissions reductions and theimpact on our infrastructure ofextreme climatic events in coastalareas. We have performed aneconomic assessment of theserisks and have devised contingencyplans to mitigate them.
In order to identify businessopportunities for Telefónica, wework with the strategy andinnovation departments andcommercial channels so as tounderstand market trends in theshort, medium and long terms. We
thus firmly believe that there is abusiness opportunity for us as weassist our clients in improving theirenergy efficiency. In 2010 thecompany launched the GreenCustomer Experience model,offering individual users a greenmobile telephony experience fromthe point at which they considerpurchasing a device, throughoutand up to the end of its service life.This model also includes thedevelopment of green applicationsto encourage efficient habitsamong consumers.
Telefónica has also continued towork with the innovationdepartments to underpin theservices already offered in thefields of smart buildings, remotepresence, fleet management andvirtual hosting, and has beeninvolved in a number of electric carand smart city projects.
Another fundamental process in theefficient management of energyand carbon at Telefónica involvesquantifying and managing energyand emissions in a responsible andstructured manner. During 2010 weregistered a substantialimprovement in the processes todevelop the Group's energyconsumption and greenhouse gas(GHG) inventory, an essential factorin reaching the right decisions. Wehave adopted ISO 14064 and theGHG Protocol as our standards. Inparallel, AENOR, the Spanishstandardisation and verification
body, performed a specialistverification of all our operations.
Over the course of 2010 wedeveloped 44 energy efficiencyprojects globally across thenetwork, reducing our energyexpenditure by more than 7 millioneuros. These initiatives also helpedTelefónica reach the halfway stagein achieving the goal for 2015announced in 2008 of a 30%reduction in network electricalconsumption by equivalent access.
At Telefónica we place greatimportance on transparency in thefield of climate change. Telefónicaincludes information about itsstrategy and achievements in thisregard in the Annual Reportdelivered to shareholders, and in itsAnnual Sustainability Report. Italso has in place 2.0 channels forinformation and debate aboutenergy efficiency, green services,indicator measurements, etc.Likewise, as part of its socialawareness-raising initiatives, itworked with the ITU and GeSI onpublication of the "Use of ICTs toAddress Climate Change",launched at the Cancun ClimateChange Summit.
Telefónica has continued theseinitiatives in 2011, courtesy of itsClimate Change and EnergyEfficiency Office, with a strategybased on the management of therisks and opportunities associatedwith climate change and energy.
Informe 2011 (ingles) 05/12/11 9:51 Página 16
17
The politics of climatechange in Spain
Although it has made significantprogress in reducing its emissionsSpain is still short of meeting itsKyoto target for 2012. Spain’sgreenhouse gas (GHG) emissions in2010 were about 25% higher thanthe1990 base year and althoughlower than in 2009 (when they were30% above target) they aresubstantially short of Spain’s Kyotoobjective, which is to limit theincrease to15% of the 1990 levels forthe period between 2008 and 2012.Spain is the sixth largest emitter inthe EU-27, roughly in line with theoverall size of its population and itseconomy, and in 2009 accounted forabout 8% of total EU-27 GHGemissions.
Spain’s GHG emissionsperformance, both good and bad,has broadly followed the ups anddowns of the country’s economy.Between 1990 and 2008, emissionsincreased from road transport,electricity and heat production,construction and fuel use from bothindustry and households at a timewhen the economy was growing fastand house building expanded rapidlyduring the second decade of theperiod. Since 2009, however, GHGemissions have decreased, witheconomic activity declining during adeep recession and only staging afeeble recovery afterwards. Moreover,Spain’s population which previouslyexpanded rapidly due to immigrationduring the good economic yearsdeclined in 2011 which has also
contributed to reductions in GHGemissions.
However, increased use of renewableenergy and a decrease in the use ofcoal have also contributed to thereductions in GHG emissions. Spainhas made significant investments inboth energy efficiency and renewableenergy. In 2010, renewable energy,including wind power andhydroelectricity, exceeded 10% ofSpain’s primary energy supply andgenerated 32% of the nation’selectricity. Both the RenewableEnergy Plan 2005–2010 (PER) andthe Spanish Strategy for EnergySavings and Efficiency 2004–2012(“E4”) have contributed substantiallyto the objectives of Spain’s climatechange policy.
Spain has a target for renewables todeliver 40% of the electricity by 2020and in the latest Renewable EnergyPlan 2011−2020 (PER) renewablesare estimated to provide for 22.7% ofthe gross final energy consumptionby 2020.
Since 2004 Spain’s governmentemphasised the importance ofalternative energy for the Spanisheconomy, especially for job creation.The Spanish government introduceda number of laws and policiescovering environmental issues.Climate change policy currently fallsunder the Estrategia Española deCambio Climático y Energía Limpia(Spanish Climate Change and CleanEnergy Strategy), which covers theperiod to 2020 and includes 198measures and 75 indicators on
Political context of climate change for businesses
“Mitigating this risk atRepsol is first aboutreducing our GHGemissions and secondlyabout transparency andreporting to ensure thatstakeholders are able tojudge our efforts inaccordance with theirexpectations. With respectto reductions, theCompany has a GHGreduction objective that iswell on its way to beingmet and we areundertaking significantefforts in energy efficiencythat will allow us to adoptmore ambitious targets forthe future”
REPSOL
Informe 2011 (ingles) 05/12/11 9:51 Página 17

Carbon Disclosure Project 2011 – Iberia Report 125
18
mitigating and adapting to climatechange.
Its six strategies to reducegreenhouse gases are: sustainableenergy; sustainable transport;sustainable construction;management of waste and animalwaste; forestry and land use policy;and innovation. Spain alsointroduced the Sustainable EconomyLaw in 2011 which will contribute toregulations aimed at creating a lowcarbon economy. And the JointCommission Study on ClimateChange recently recommendedclimate change legislation whichincludes incorporating carbonemissions in state budgets, anddeveloping a tax system that helps tointernalize the costs associated withclimate change.
The EU ETS and the use of Kyotomechanisms also play an importantrole in Spain’s ability to meet itsKyoto Protocol target. The secondNational Allocation Plan (2008–2012), has more stringent criteriafor allowances allocation than thefirst plan and resulted in greaterannual emission reductions thanthe first trading period. Spain likethe entire international communityis looking towards the renewal ofthe emission reductioncommitments at the end of thecompliance period of the KyotoProtocol in 2012 and the outcomesof the COP17 in Durban.
The effects of the economic crisispersuaded the government toperform two environmental policy U-turns that worried investors in onecase and environmentalists in theother.
Investors in solar photovoltaicenergy were concerned when thegovernment, eager to cut its subsidybill as a way of reducing the publicsector budget deficit, decided inDecember 2010 to make retroactive
cuts in guaranteed subsidies for thesector. Environmentalists and someSpanish energy companies,meanwhile, protested when thegovernment decided to double itsaid to the Spanish coal miningsector in the coming years, givingcoal power preferential access tothe wholesale electricity market andtherefore disadvantaging suppliersfrom other sources, includingrenewables. Gas Natural Fenosa,Iberdrola and Endesa began legalaction against the EuropeanCommission’s decision to approvethe Spanish plan.
The Organisation for EconomicCooperation and Development(OECD) launched its Green GrowthStrategy in May 2011 which is in linewith Spain’s green job policy. Itrecommended that Spain should domore to reduce GHG emissions andimprove energy security throughreforming energy prices. Moreover, itstated that “Abolishing thesesubsidies would reduce the overallcost of stabilising GHGconcentrations and provide strongerincentives for the transition to newrenewable-energy sources. Spainstill subsidizes domestic coalproduction for power generation,although less heavily than in thepast. Petrol and diesel prices inSpain are amongst the lowest inOECD Member countries, as are itstax rates on vehicle fuels. Anincrease in fuel taxes, and abolitionof the differentiation between petroland diesel, would also providegreater incentives for reducingemissions and using more fuel-efficient vehicles, while alsocontributing to fiscal consolidationon the revenue side.”
With Spanish National electionscompleted in November 2011 theissue is whether policies will continueto foster the path towards a lowcarbon economy and a post Kyotoframework.
The politics of climatechange in Portugal
By Euronatura- Center forEnvironmental Law and SustainableDevelopment
Overview of National andInternational Regulation forPortugalUnder the Kyoto Protocol and theEuropean Union pledges, Portugalcommitted itself not to increase itsGHG emissions by more than 27%by 2012, using emissions registeredin 1990 as a reference. The KyotoProtocol GHG emissions monitoringmechanisms and the implementationmeasures have a key role in thefulfilment of the commitments agreedin the past and also in new reductioncommitments for 2020. The followingmain mechanisms have been put inplace in Portugal:
• The “National Program for ClimateChange”, which includes a set ofpolicies and GHG public sectormitigation measures.
• The “National Plan for theAllocation of GHG EmissionsLicenses”, which imposes caps onindustrial sites within nationalborders.
• The “Portuguese Carbon Fund”, agovernment financial instrument toacquire Kyoto Protocol emissioncredits in order to ensure Portugalfulfils its Protocol commitments; italso invests in domestic emissionsreduction projects.
The government information andmonitoring systems predict that thecountry will meet its Kyoto targets. Itis estimated that, in the 2008-2012commitment period of the KyotoProtocol, Portugal will be 1% belowthe agreed targets. That is equivalentto emitting 4,78Mt of CO2e less thanthe set target. This forecast stemsfrom the public policies andmitigation measures proposed in the
Informe 2011 (ingles) 05/12/11 9:51 Página 18
19
Political context of climate change for businesses
“National Program for ClimateChange”. In particular, it is due to therise of renewable energy productionand to an improvement in energyefficiency. However, it should betaken into account that the outcomesof this program are influenced byPortuguese economy’s declineduring recent years. Also the“Program for Energy Efficiency inBuildings” has had remarkableresults.
Beyond the 2012 Kyoto horizon,Portugal presently envisages the EU“Climate and Energy Package” as thebasis on which to build its climatepolicy. The current GovernmentProgram states that Portugal shouldaccomplish substantialimprovements in energy efficiency, forinstance, a 25% reduction in privateenergy consumption and a 30%decrease in public energyconsumption by 2020. In addition,the current Government agrees thatthe fossil fuel dependency has todecrease. At the same time, theExecutive’s ambition is that “in themedium-term, the country shouldreach the lowest energy intensity inthe EU”.
How climate change policyaffects companies’ performanceIn the last decade, Portuguesecompanies - following the path of EUStates - have become increasinglyconcerned about climate issues. Asa consequence, there has been atransition to production processesless exposed to energy prices.However, contrary to the clout thatinvestors and shareholders have indecision-making, customers and thepublic opinion still lack recognizablepower in pressing companies to joinand promote a low-carbon economy.
There is a significant group ofcompanies that already havevoluntarily incorporated emissionsmanagement in their strategies.Some of those companies have not
yet specified a clear objectiveregarding GHG emissions reductions.Nevertheless, companies in generalhave continuously invested in energyefficiency as well as in renewableenergy production. Therefore,Portuguese companies have madesome progress, paving the way foran effective management of climatechange.
Companies that are not part of theEU ETS and listed in the stockmarket do not specify political targetsand commitments whencommunicating their climate changestrategies. When defining GHGemission targets, they base it oninternal analysis and unilateralprojections that assess companies’abilities to decrease operationalcosts. In sum, the ambition behindthe objectives stems only from forceswithin the company. Anothercommon feature is that theformulation of energy consumptioncuts and GHG emissions strategyonly targets a fraction of thecompanies’ activity. Companieswhich are part of the EU ETS presenttargets according to regulations.Often, these companies’ inventoriesand mandatory objectives representtheir whole climate changemanagement strategy.
Pre-empting and adapting tofuture national regulationOnly 46 % (6) of the Portugueseresponding companies havevoluntary and strategic goals toreduce their carbon footprint oroverall energy consumption. The lackof more proactive and preventivemeasures being adopted mayindicate that decision-makers withincompanies do not expect furtherregulation in the short-term.
92% (12) of the Portuguesecompanies that answered the CDP2011 questionnaire are implementingenergy efficiency plans and carbonfootprint reduction strategies. It is
“CGD’s strategicprogramme “CaixaCarbono Zero”, in placesince 2007, defines theBank’s climate strategyand promotes specificactions on the followingareas: emissionsaccounting and reduction;carbon offsetting; marketopportunities and risksand public awareness.Opportunities and risksassociated with climatechange perceived by CGDhave so far been part of anoverall approach togovernance andcompliance”
CAIXA GERAL DEDEPOSITOS
Informe 2011 (ingles) 05/12/11 9:51 Página 19
Carbon Disclosure Project 2011 – Iberia Report 125
20
these companies that are taking thelead in attempting to assess theeconomic value of resources anddeveloping a sustainable and viableeconomic growth for business. Thisshows, on the one hand, that asystemic change in business modelsis already taking place and, on theother hand, that carbonmeasurement and financial issues areintertwined in the decision-makingprocess of companies leading theway in sustainability.
When business planning – whether ornot it comes under pressure fromregulations – takes into account theeconomic value of the use ofresources and their present andfuture scarcity, it reflects a greaterunderstanding of risks the companyfaces. Furthermore, there are alsoopportunities for companies thatunderstand the way markets areaffected by environmental issues andthe associated political climate;determining these opportunities is adriver of innovation that is alreadyleading companies to a reassessmentof the climate change implications oftheir products and services acrossthe value chain, resulting in newgreen sub-brands and products andaccess to markets that otherwisewould not have been tapped.
Capital and investment are alsoneeded in order to innovate and todevelop new technologies. At amoment when capital is a scarceresource in Europe, investors, assetowners and asset managers areresponsible for rewarding businessesthat have long-term strategicthinking. In the Portuguese context,socially responsible investment is
limited. Therefore, the challengeremains for Portugal to createconditions so that stakeholders cancreate a new group of like-mindedpeople and institutions pushing forthe development of climate changepolicy. That in itself is an opportunityto the financial sector, comprisinginvestors and banks, since theywould be able to develop products tofund the investments that leadingcompanies need to undertake.
In the near future, it is expected thatbusinesses in Portugal will be facedby three regulatory and politicalinstruments. Currently, they are in adevelopment stage and are inter-connected in a hierarchical manner:the “Low Carbon Road Map”, the“National Program for ClimateChange 2013-2020” and the “LowCarbon Sector Plans”. These policiesconstitute the first Portugueseclimate change regulatory frameworkthat some companies listed in thestock market, and not part of the EUETS, will need to adjust to. Thesekinds of governmental policies areurgently needed in a matter such asclimate change. Governments mustdeal with long-term issues byforeseeing the long-term risks andopportunities of current measures ina manner and on a timescale thatcompany planners are notaccustomed to. In addition, thesepolicies provide a platform forbuilding confidence in movingtowards a low carbon economy thatcan influence companies, investorsand society as a whole. Theseregulations could impact consumerpatterns and may make climatechange more of a priority issueamongst voters.
“We believe that ourbusiness and geographicdiversification along withour active lobbying andR&D&I programs isallowing us to significantlybenefit from anyintensification ofregulations”
ABENGOA
Informe 2011 (ingles) 05/12/11 9:51 Página 20
21
The business response toclimate change
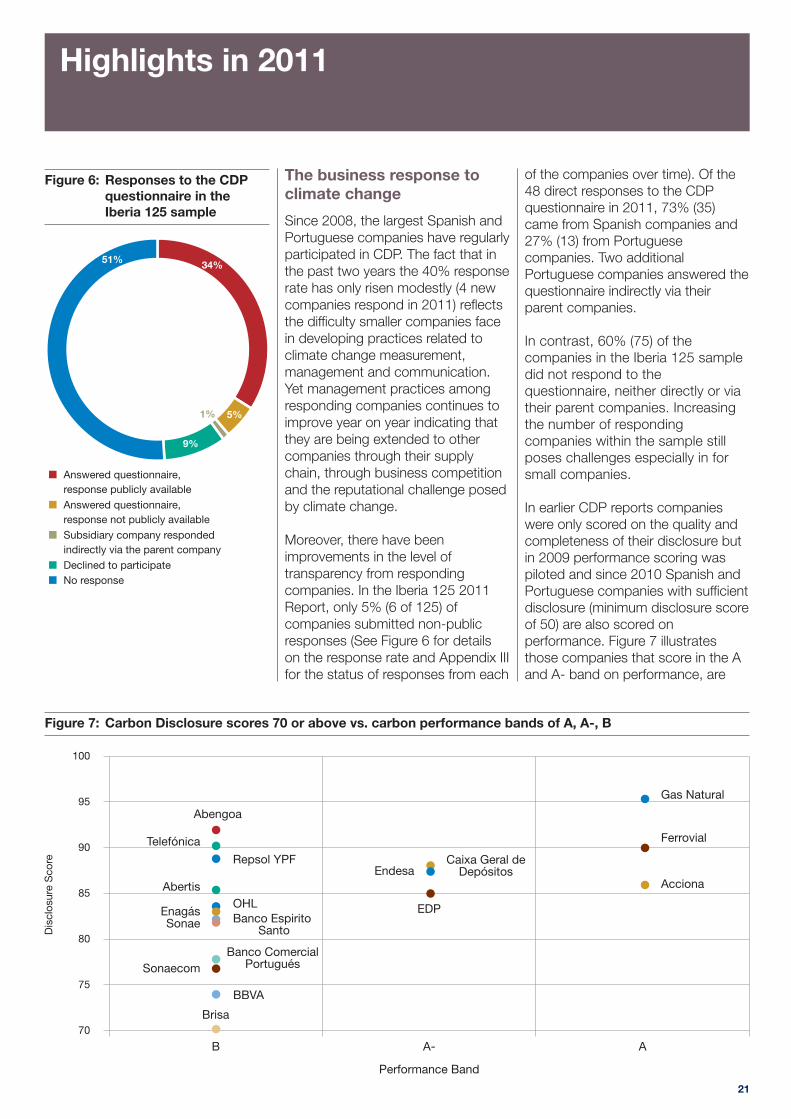
Since 2008, the largest Spanish andPortuguese companies have regularlyparticipated in CDP. The fact that inthe past two years the 40% responserate has only risen modestly (4 newcompanies respond in 2011) reflectsthe difficulty smaller companies facein developing practices related toclimate change measurement,management and communication.Yet management practices amongresponding companies continues toimprove year on year indicating thatthey are being extended to othercompanies through their supplychain, through business competitionand the reputational challenge posedby climate change.
Moreover, there have beenimprovements in the level oftransparency from respondingcompanies. In the Iberia 125 2011Report, only 5% (6 of 125) ofcompanies submitted non-publicresponses (See Figure 6 for detailson the response rate and Appendix IIIfor the status of responses from each
of the companies over time). Of the48 direct responses to the CDPquestionnaire in 2011, 73% (35)came from Spanish companies and27% (13) from Portuguesecompanies. Two additionalPortuguese companies answered thequestionnaire indirectly via theirparent companies.
In contrast, 60% (75) of thecompanies in the Iberia 125 sampledid not respond to thequestionnaire, neither directly or viatheir parent companies. Increasingthe number of respondingcompanies within the sample stillposes challenges especially in forsmall companies.
In earlier CDP reports companieswere only scored on the quality andcompleteness of their disclosure butin 2009 performance scoring waspiloted and since 2010 Spanish andPortuguese companies with sufficientdisclosure (minimum disclosure scoreof 50) are also scored onperformance. Figure 7 illustratesthose companies that score in the Aand A- band on performance, are
Highlights in 2011
Figure 6: Responses to the CDPquestionnaire in theIberia 125 sample
Figure 7: Carbon Disclosure scores 70 or above vs. carbon performance bands of A, A-, B
Dis
clos
ure
Sco
re
100
95
90
85
80
75
70
B
Performance Band
A- A
Abengoa
Repsol YPF
OHLBanco Espirito
Santo
Banco ComercialPortugués
Caixa Geral deDepósitos
Telefónica
AbertisEndesa
EnagásSonae
Sonaecom
Brisa
BBVA
EDP
Gas Natural
Ferrovial
Acciona
Informe 2011 (ingles) 05/12/11 9:51 Página 21
Carbon Disclosure Project 2011 – Iberia Report 125
22
also leading in terms of the qualityand completeness of their responsewith more than 85 points achievedon carbon disclosure. A total of 18Spanish and Portuguese companies(38%) have achieved a disclosurescore greater than 70 and fall withinthe A, A- or B performance band. Ofthese companies, 6 have adisclosure score of 85 and aboveand are in the performance band of Aor A-. There is therefore anopportunity in the next few years formore companies that are leading inthe quality and completeness of theirdisclosure to also improve in theirperformance, in other words there isa link between disclosure andperformance.
Business strategy and Boardoversight
Undoubtedly, the key for companiesto become leaders in climate changemanagement is the integration of thisissue into business strategy.
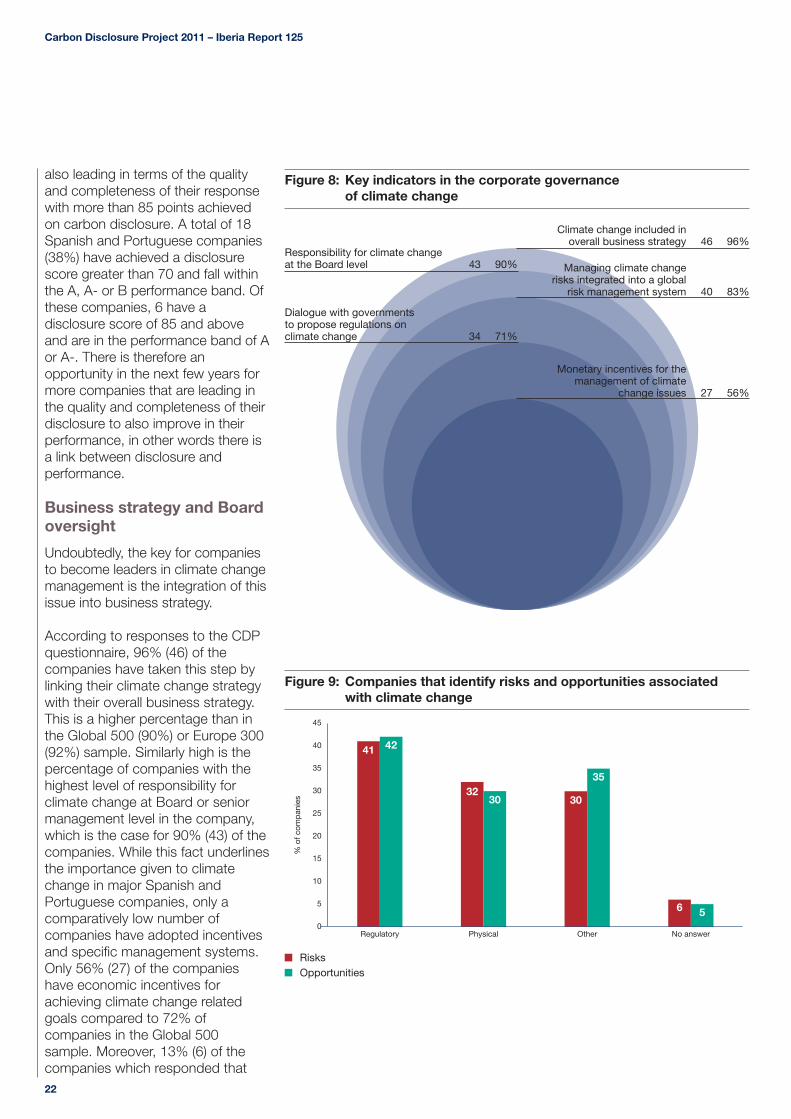
According to responses to the CDPquestionnaire, 96% (46) of thecompanies have taken this step bylinking their climate change strategywith their overall business strategy.This is a higher percentage than inthe Global 500 (90%) or Europe 300(92%) sample. Similarly high is thepercentage of companies with thehighest level of responsibility forclimate change at Board or seniormanagement level in the company,which is the case for 90% (43) of thecompanies. While this fact underlinesthe importance given to climatechange in major Spanish andPortuguese companies, only acomparatively low number ofcompanies have adopted incentivesand specific management systems.Only 56% (27) of the companieshave economic incentives forachieving climate change relatedgoals compared to 72% ofcompanies in the Global 500sample. Moreover, 13% (6) of thecompanies which responded that
Climate change included in overall business strategy 46 96%
Managing climate change risks integrated into a global
risk management system 40 83%
Monetary incentives for the management of climate
change issues 27 56%
Responsibility for climate change at the Board level 43 90%
Dialogue with governments to propose regulations on climate change 34 71%
Figure 8: Key indicators in the corporate governance of climate change
Figure 9: Companies that identify risks and opportunities associated with climate change
RisksOpportunities
45
40
35
30
25
20
15
10
5
0Regulatory
41 42
Physical
3230
Other
30
35
No answer
% o
f com
pan
ies
6 5
Informe 2011 (ingles) 05/12/11 9:51 Página 22
23
Highlights in 2011
climate change is integrated intotheir business strategy do not haverisk management systems in placeto assess the risks associated withclimate change. Companiesresponses in relation to incentivesand specific management systemssuggests that there is room forimprovement in the management ofclimate change, especially since themajority of the respondingcompanies are tackling the issue ofclimate change the Board level.
The percentage of respondingcompanies that have identified risksand opportunities associated withclimate change has grown slightlysince 2010. 85% (41) of respondingcompanies have identified at leastone type of risk associated withclimate change compared to 81% inthe previous year2. Similarly, thepercentage of firms that identifyopportunities has increased from84% to 88% a total of 42 companiesin 2011.
This shows that there is an increasedfocus on climate change as a factorthat can influence the future businessand performance of companies.
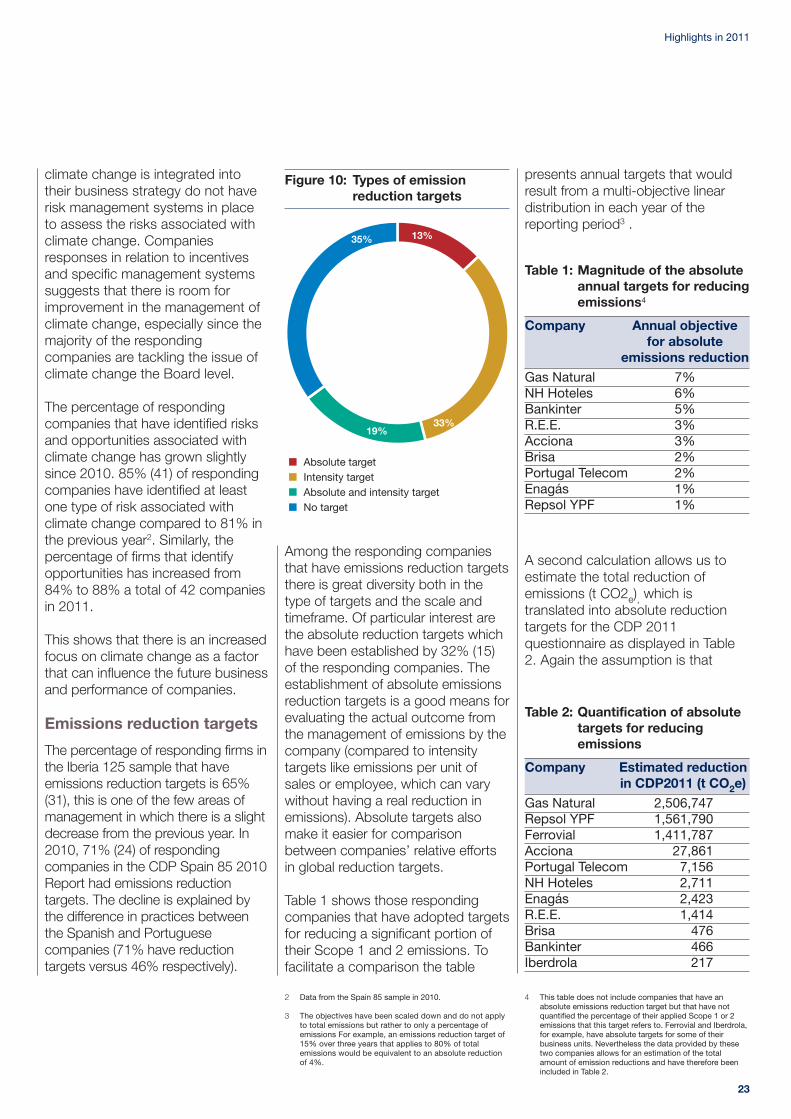
Emissions reduction targets
The percentage of responding firms inthe Iberia 125 sample that haveemissions reduction targets is 65%(31), this is one of the few areas ofmanagement in which there is a slightdecrease from the previous year. In2010, 71% (24) of respondingcompanies in the CDP Spain 85 2010Report had emissions reductiontargets. The decline is explained bythe difference in practices betweenthe Spanish and Portuguesecompanies (71% have reductiontargets versus 46% respectively).
Among the responding companiesthat have emissions reduction targetsthere is great diversity both in thetype of targets and the scale andtimeframe. Of particular interest arethe absolute reduction targets whichhave been established by 32% (15)of the responding companies. Theestablishment of absolute emissionsreduction targets is a good means forevaluating the actual outcome fromthe management of emissions by thecompany (compared to intensitytargets like emissions per unit ofsales or employee, which can varywithout having a real reduction inemissions). Absolute targets alsomake it easier for comparisonbetween companies’ relative effortsin global reduction targets.
Table 1 shows those respondingcompanies that have adopted targetsfor reducing a significant portion oftheir Scope 1 and 2 emissions. Tofacilitate a comparison the table
presents annual targets that wouldresult from a multi-objective lineardistribution in each year of thereporting period3 .
Figure 10: Types of emissionreduction targets
Table 1: Magnitude of the absoluteannual targets for reducingemissions4
Company Annual objectivefor absolute
emissions reductionGas Natural 7%NH Hoteles 6%Bankinter 5%R.E.E. 3%Acciona 3%Brisa 2%Portugal Telecom 2%Enagás 1%Repsol YPF 1%
Table 2: Quantification of absolutetargets for reducingemissions
Company Estimated reduction in CDP2011 (t CO2e)
Gas Natural 2,506,747Repsol YPF 1,561,790Ferrovial 1,411,787Acciona 27,861Portugal Telecom 7,156NH Hoteles 2,711Enagás 2,423R.E.E. 1,414Brisa 476Bankinter 466Iberdrola 217
4 This table does not include companies that have anabsolute emissions reduction target but that have notquantified the percentage of their applied Scope 1 or 2emissions that this target refers to. Ferrovial and Iberdrola,for example, have absolute targets for some of theirbusiness units. Nevertheless the data provided by thesetwo companies allows for an estimation of the totalamount of emission reductions and have therefore beenincluded in Table 2.
2 Data from the Spain 85 sample in 2010.
3 The objectives have been scaled down and do not applyto total emissions but rather to only a percentage ofemissions For example, an emissions reduction target of15% over three years that applies to 80% of totalemissions would be equivalent to an absolute reductionof 4%.
A second calculation allows us toestimate the total reduction ofemissions (t CO2e), which istranslated into absolute reductiontargets for the CDP 2011questionnaire as displayed in Table2. Again the assumption is that
Informe 2011 (ingles) 05/12/11 9:51 Página 23
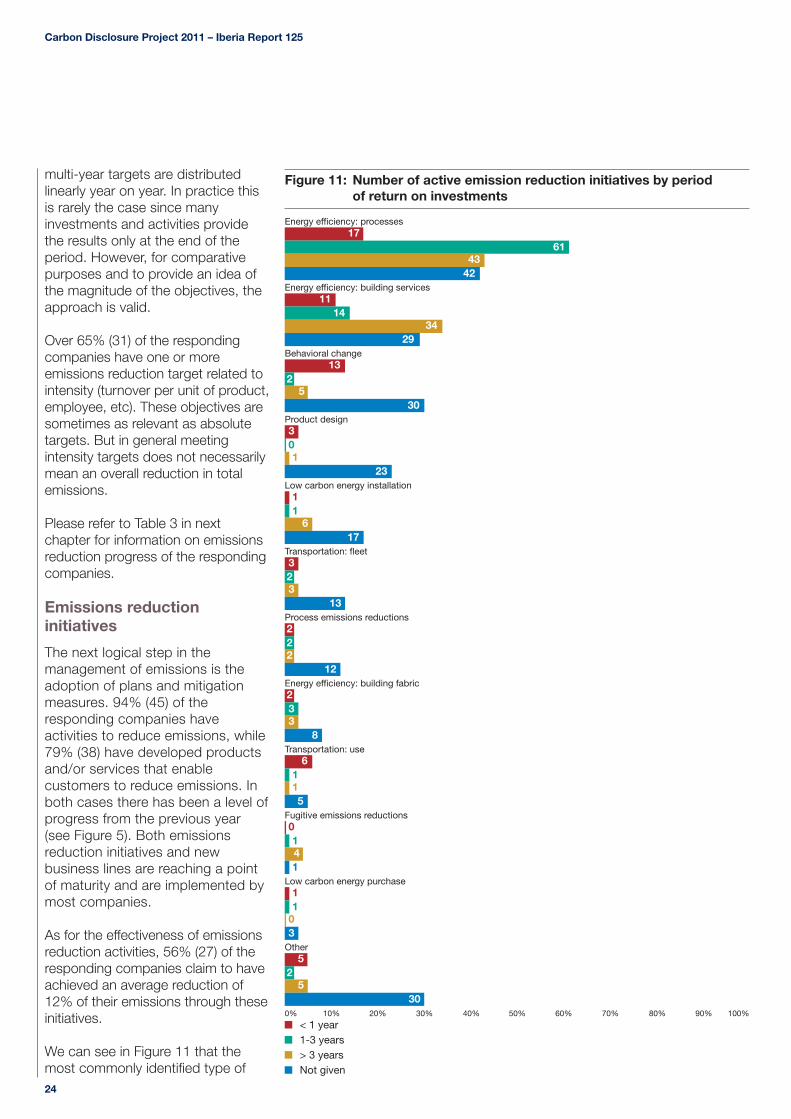
Carbon Disclosure Project 2011 – Iberia Report 125
24
multi-year targets are distributedlinearly year on year. In practice thisis rarely the case since manyinvestments and activities providethe results only at the end of theperiod. However, for comparativepurposes and to provide an idea ofthe magnitude of the objectives, theapproach is valid.
Over 65% (31) of the respondingcompanies have one or moreemissions reduction target related tointensity (turnover per unit of product,employee, etc). These objectives aresometimes as relevant as absolutetargets. But in general meetingintensity targets does not necessarilymean an overall reduction in totalemissions.
Please refer to Table 3 in nextchapter for information on emissionsreduction progress of the respondingcompanies.
Emissions reductioninitiatives
The next logical step in themanagement of emissions is theadoption of plans and mitigationmeasures. 94% (45) of theresponding companies haveactivities to reduce emissions, while79% (38) have developed productsand/or services that enablecustomers to reduce emissions. Inboth cases there has been a level ofprogress from the previous year(see Figure 5). Both emissionsreduction initiatives and newbusiness lines are reaching a pointof maturity and are implemented bymost companies.
As for the effectiveness of emissionsreduction activities, 56% (27) of theresponding companies claim to haveachieved an average reduction of12% of their emissions through theseinitiatives.
We can see in Figure 11 that themost commonly identified type of
Figure 11: Number of active emission reduction initiatives by period of return on investments
< 1 year1-3 years> 3 yearsNot given
Energy efficiency: processes
0% 10% 20% 30% 40% 50% 60% 70% 80% 90% 100%
1761
4342
Energy efficiency: building services11
1434
29Behavioral change
132
530
Product design301
23Low carbon energy installation
11
617
Transportation: fleet323
13Process emissions reductions222
12Energy efficiency: building fabric233
8Transportation: use
6115
Fugitive emissions reductions0141
Low carbon energy purchase11
03
Other5
25
30
Informe 2011 (ingles) 05/12/11 9:51 Página 24
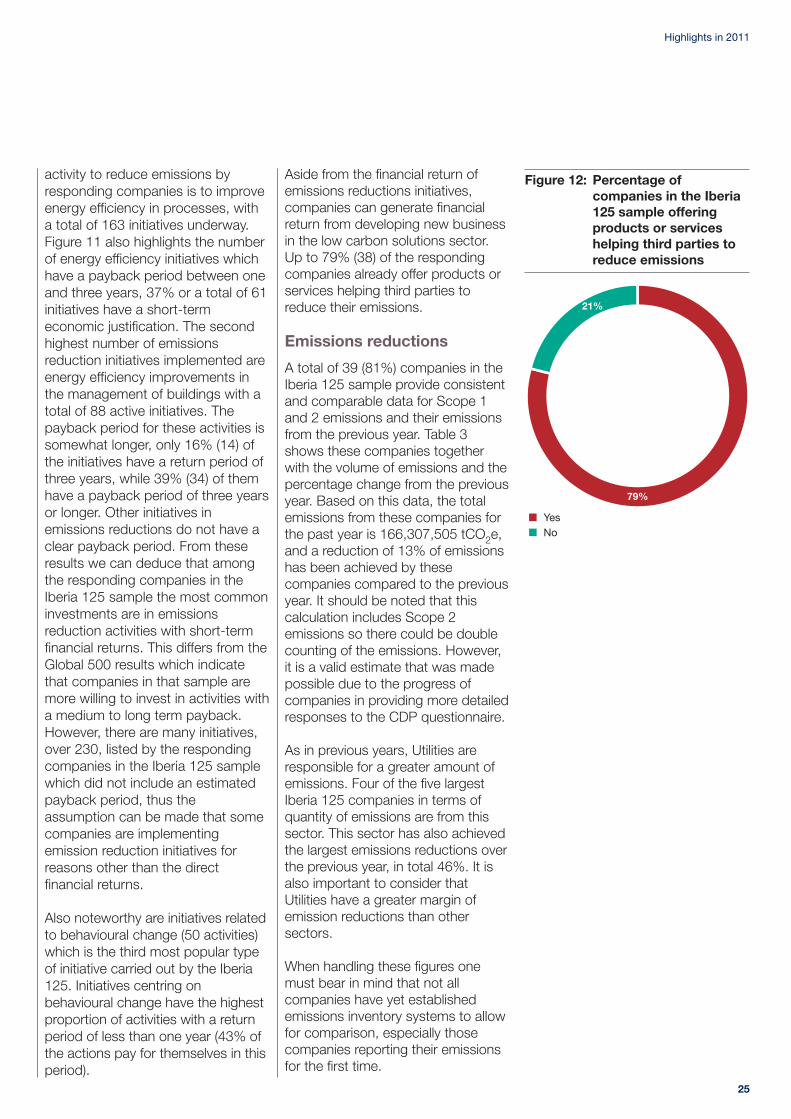
25
Highlights in 2011
activity to reduce emissions byresponding companies is to improveenergy efficiency in processes, witha total of 163 initiatives underway.Figure 11 also highlights the numberof energy efficiency initiatives whichhave a payback period between oneand three years, 37% or a total of 61initiatives have a short-termeconomic justification. The secondhighest number of emissionsreduction initiatives implemented areenergy efficiency improvements inthe management of buildings with atotal of 88 active initiatives. Thepayback period for these activities issomewhat longer, only 16% (14) ofthe initiatives have a return period ofthree years, while 39% (34) of themhave a payback period of three yearsor longer. Other initiatives inemissions reductions do not have aclear payback period. From theseresults we can deduce that amongthe responding companies in theIberia 125 sample the most commoninvestments are in emissionsreduction activities with short-termfinancial returns. This differs from theGlobal 500 results which indicatethat companies in that sample aremore willing to invest in activities witha medium to long term payback.However, there are many initiatives,over 230, listed by the respondingcompanies in the Iberia 125 samplewhich did not include an estimatedpayback period, thus theassumption can be made that somecompanies are implementingemission reduction initiatives forreasons other than the directfinancial returns.
Also noteworthy are initiatives relatedto behavioural change (50 activities)which is the third most popular typeof initiative carried out by the Iberia125. Initiatives centring onbehavioural change have the highestproportion of activities with a returnperiod of less than one year (43% ofthe actions pay for themselves in thisperiod).
Aside from the financial return ofemissions reductions initiatives,companies can generate financialreturn from developing new businessin the low carbon solutions sector.Up to 79% (38) of the respondingcompanies already offer products orservices helping third parties toreduce their emissions.
Emissions reductions
A total of 39 (81%) companies in theIberia 125 sample provide consistentand comparable data for Scope 1and 2 emissions and their emissionsfrom the previous year. Table 3shows these companies togetherwith the volume of emissions and thepercentage change from the previousyear. Based on this data, the totalemissions from these companies forthe past year is 166,307,505 tCO2e,and a reduction of 13% of emissionshas been achieved by thesecompanies compared to the previousyear. It should be noted that thiscalculation includes Scope 2emissions so there could be doublecounting of the emissions. However,it is a valid estimate that was madepossible due to the progress ofcompanies in providing more detailedresponses to the CDP questionnaire.
As in previous years, Utilities areresponsible for a greater amount ofemissions. Four of the five largestIberia 125 companies in terms ofquantity of emissions are from thissector. This sector has also achievedthe largest emissions reductions overthe previous year, in total 46%. It isalso important to consider thatUtilities have a greater margin ofemission reductions than othersectors.
When handling these figures onemust bear in mind that not allcompanies have yet establishedemissions inventory systems to allowfor comparison, especially thosecompanies reporting their emissionsfor the first time.
Figure 12: Percentage ofcompanies in the Iberia125 sample offeringproducts or serviceshelping third parties toreduce emissions
Informe 2011 (ingles) 05/12/11 9:51 Página 25
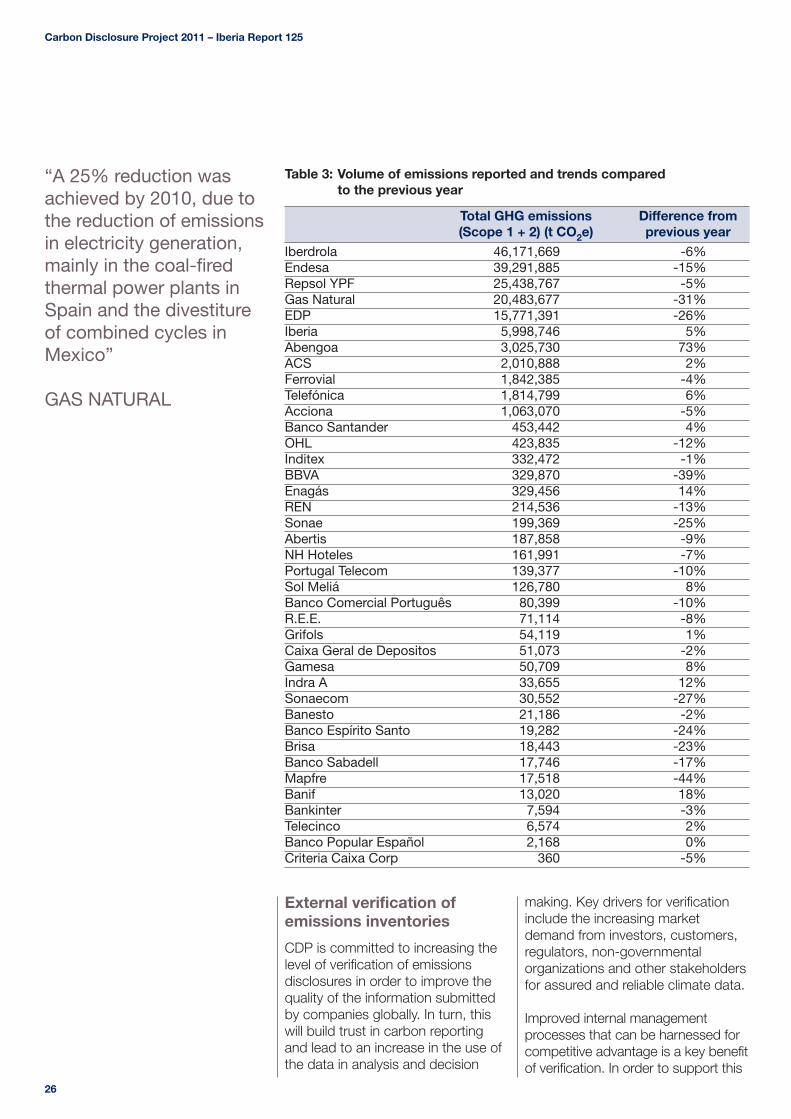
Carbon Disclosure Project 2011 – Iberia Report 125
26
External verification ofemissions inventories
CDP is committed to increasing thelevel of verification of emissionsdisclosures in order to improve thequality of the information submittedby companies globally. In turn, thiswill build trust in carbon reportingand lead to an increase in the use ofthe data in analysis and decision
making. Key drivers for verificationinclude the increasing marketdemand from investors, customers,regulators, non-governmentalorganizations and other stakeholdersfor assured and reliable climate data.
Improved internal managementprocesses that can be harnessed forcompetitive advantage is a key benefitof verification. In order to support this
“A 25% reduction wasachieved by 2010, due tothe reduction of emissionsin electricity generation,mainly in the coal-firedthermal power plants inSpain and the divestitureof combined cycles inMexico”
GAS NATURAL
Table 3: Volume of emissions reported and trends compared to the previous year
Total GHG emissions Difference from(Scope 1 + 2) (t CO2e) previous year
Iberdrola 46,171,669 -6%Endesa 39,291,885 -15%Repsol YPF 25,438,767 -5%Gas Natural 20,483,677 -31%EDP 15,771,391 -26%Iberia 5,998,746 5%Abengoa 3,025,730 73%ACS 2,010,888 2%Ferrovial 1,842,385 -4%Telefónica 1,814,799 6%Acciona 1,063,070 -5%Banco Santander 453,442 4%OHL 423,835 -12%Inditex 332,472 -1%BBVA 329,870 -39%Enagás 329,456 14%REN 214,536 -13%Sonae 199,369 -25%Abertis 187,858 -9%NH Hoteles 161,991 -7%Portugal Telecom 139,377 -10%Sol Meliá 126,780 8%Banco Comercial Português 80,399 -10%R.E.E. 71,114 -8%Grifols 54,119 1%Caixa Geral de Depositos 51,073 -2%Gamesa 50,709 8%Indra A 33,655 12%Sonaecom 30,552 -27%Banesto 21,186 -2%Banco Espírito Santo 19,282 -24%Brisa 18,443 -23%Banco Sabadell 17,746 -17%Mapfre 17,518 -44%Banif 13,020 18%Bankinter 7,594 -3%Telecinco 6,574 2%Banco Popular Español 2,168 0%Criteria Caixa Corp 360 -5%
Informe 2011 (ingles) 05/12/11 9:51 Página 26
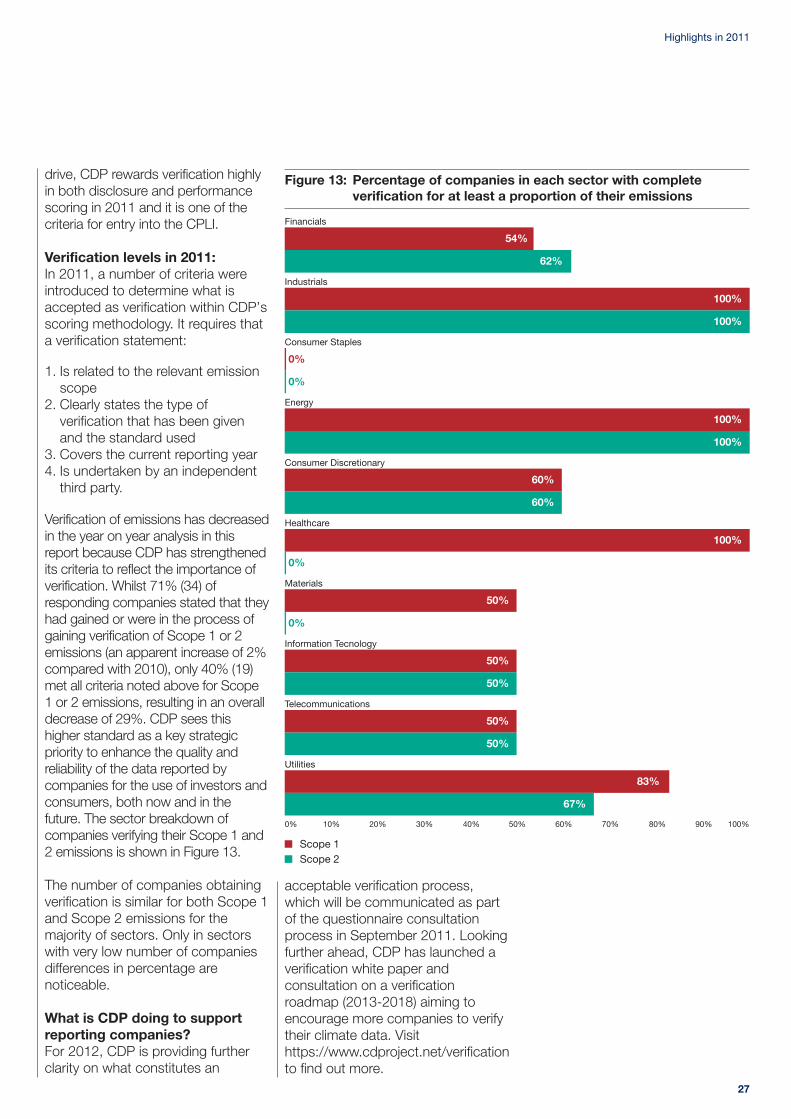
27
Highlights in 2011
drive, CDP rewards verification highlyin both disclosure and performancescoring in 2011 and it is one of thecriteria for entry into the CPLI.
Verification levels in 2011:In 2011, a number of criteria wereintroduced to determine what isaccepted as verification within CDP’sscoring methodology. It requires thata verification statement:
1. Is related to the relevant emissionscope
2. Clearly states the type ofverification that has been givenand the standard used
3. Covers the current reporting year 4. Is undertaken by an independent
third party.
Verification of emissions has decreasedin the year on year analysis in thisreport because CDP has strengthenedits criteria to reflect the importance ofverification. Whilst 71% (34) ofresponding companies stated that theyhad gained or were in the process ofgaining verification of Scope 1 or 2emissions (an apparent increase of 2%compared with 2010), only 40% (19)met all criteria noted above for Scope1 or 2 emissions, resulting in an overalldecrease of 29%. CDP sees thishigher standard as a key strategicpriority to enhance the quality andreliability of the data reported bycompanies for the use of investors andconsumers, both now and in thefuture. The sector breakdown ofcompanies verifying their Scope 1 and2 emissions is shown in Figure 13.
The number of companies obtainingverification is similar for both Scope 1and Scope 2 emissions for themajority of sectors. Only in sectorswith very low number of companiesdifferences in percentage arenoticeable.
What is CDP doing to supportreporting companies?For 2012, CDP is providing furtherclarity on what constitutes an
Figure 13: Percentage of companies in each sector with completeverification for at least a proportion of their emissions
Scope 1Scope 2
Financials
Industrials
Consumer Staples
Energy
Consumer Discretionary
Healthcare
Materials
Information Tecnology
Telecommunications
Utilities
0% 10% 20% 30% 40% 50% 60% 70% 80% 90% 100%
54%
62%
100%
100%
0%
0%
100%
100%
60%
60%
100%
0%
50%
0%
50%
50%
50%
50%
83%
67%
acceptable verification process,which will be communicated as partof the questionnaire consultationprocess in September 2011. Lookingfurther ahead, CDP has launched averification white paper andconsultation on a verificationroadmap (2013-2018) aiming toencourage more companies to verifytheir climate data. Visithttps://www.cdproject.net/verificationto find out more.
Informe 2011 (ingles) 05/12/11 9:51 Página 27
28
Introduction to the CarbonDisclosure Leadership Index(CDLI) and the CarbonPerformance LeadershipIndex (CPLI)
Each year company responses arereviewed, analyzed and scored for thequality of disclosure and performanceon actions taken to mitigate climatechange. This results in a disclosurescore and, where sufficient disclosureexists, a performance score.
Iberia 125 companies have beenscored by PwC.
Disclosure scores• Disclosure scores are an
assessment of the quality andcompleteness of a company’sresponse; they are not a measure ofa company’s performance in relationto climate change management
• Scores are plotted over a 100-pointnormalized scale
• Companies are assessed based ontheir level of disclosure of carbonemissions measurement techniquesand subsequent public disclosure
• Companies with the highestdisclosure scores are listed in theCDLI.
Performance bands• Where a company’s disclosure
score is 50 or more, its performancein mitigating carbon emissions isassessed and ranked in aperformance band
• For 2011 there are six performancebands (there were four bands in2010)
• Companies with the highestperformance bands that meetadditional ‘CPLI’ criteria are listed inthe CPLI.
Analysis of the CDLI and CPLI providesinsights into the characteristics andcommon trends among the leadingcompanies on carbon disclosure, andhighlights good practices in reporting,governance, risk management,emissions reductions and other areas.Interrelations between the CDLI andCPLI companies are analyzed todetermine if those companies withbetter data use it within the business todrive value adding activities.
2011 Leaders
“In Portugal EDP hascreated an ESCOcompany –EDP Serviços–that provides energyefficiency services. In2010, EDP has developed13 types of services thatreduce energyconsumption and CO2emissions. The expectedenergy consumptionreduction of the 2010projects are approximatelyone thousand Gigawatt-hour and the emissionsavoided are approximately380,000 CO2 Ton”
EDP
Informe 2011 (ingles) 05/12/11 9:51 Página 28
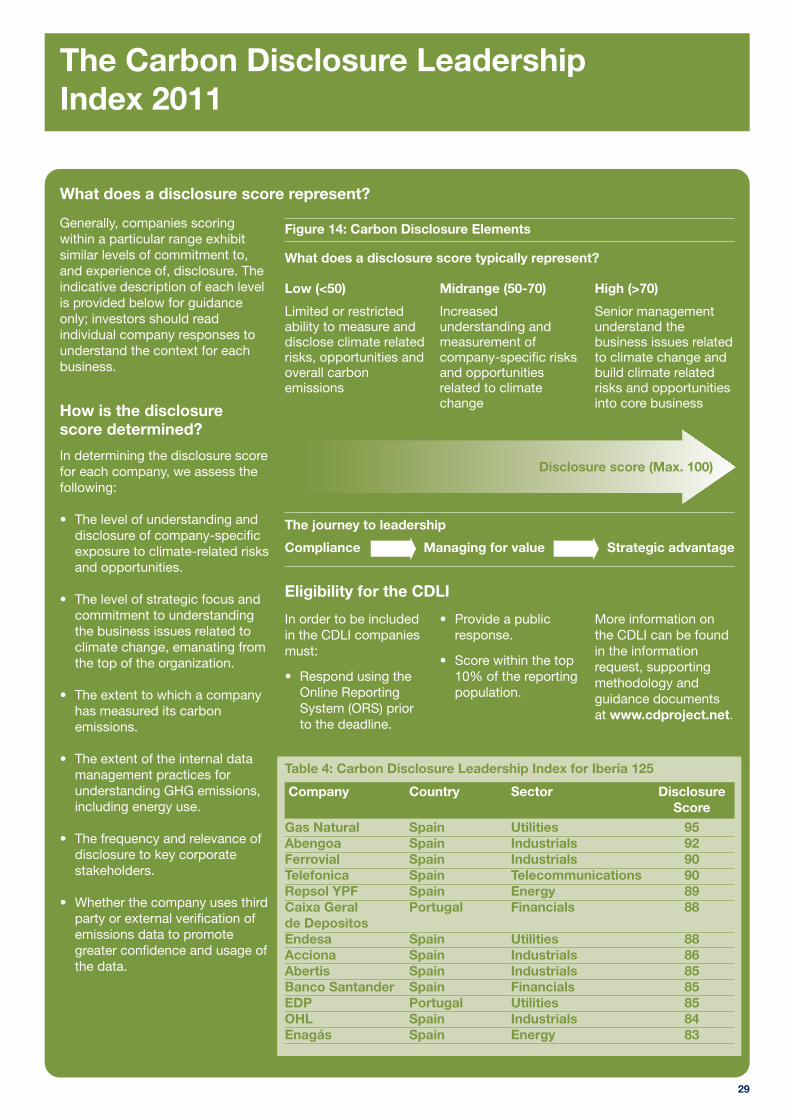
29
The Carbon Disclosure Leadership Index 2011
What does a disclosure score represent?
Generally, companies scoringwithin a particular range exhibitsimilar levels of commitment to,and experience of, disclosure. Theindicative description of each levelis provided below for guidanceonly; investors should readindividual company responses tounderstand the context for eachbusiness.
How is the disclosurescore determined?
In determining the disclosure scorefor each company, we assess thefollowing:
• The level of understanding anddisclosure of company-specificexposure to climate-related risksand opportunities.
• The level of strategic focus andcommitment to understandingthe business issues related toclimate change, emanating fromthe top of the organization.
• The extent to which a companyhas measured its carbonemissions.
• The extent of the internal datamanagement practices forunderstanding GHG emissions,including energy use.
• The frequency and relevance ofdisclosure to key corporatestakeholders.
• Whether the company uses thirdparty or external verification ofemissions data to promotegreater confidence and usage ofthe data.
Figure 14: Carbon Disclosure Elements
Eligibility for the CDLI
The journey to leadership
What does a disclosure score typically represent?
Compliance Managing for value Strategic advantage
Low (<50)
Limited or restrictedability to measure anddisclose climate relatedrisks, opportunities andoverall carbonemissions
Midrange (50-70)
Increasedunderstanding andmeasurement ofcompany-specific risksand opportunitiesrelated to climatechange
High (>70)
Senior managementunderstand thebusiness issues relatedto climate change andbuild climate relatedrisks and opportunitiesinto core business
In order to be includedin the CDLI companiesmust:
• Respond using theOnline ReportingSystem (ORS) priorto the deadline.
• Provide a publicresponse.
• Score within the top10% of the reportingpopulation.
More information onthe CDLI can be foundin the informationrequest, supportingmethodology andguidance documentsat www.cdproject.net.
Disclosure score (Max. 100)
Table 4: Carbon Disclosure Leadership Index for Iberia 125
Company Country Sector DisclosureScore
Gas Natural Spain Utilities 95Abengoa Spain Industrials 92Ferrovial Spain Industrials 90Telefonica Spain Telecommunications 90Repsol YPF Spain Energy 89Caixa Geral Portugal Financials 88de DepositosEndesa Spain Utilities 88Acciona Spain Industrials 86Abertis Spain Industrials 85Banco Santander Spain Financials 85EDP Portugal Utilities 85OHL Spain Industrials 84Enagás Spain Energy 83
Informe 2011 (ingles) 05/12/11 9:51 Página 29
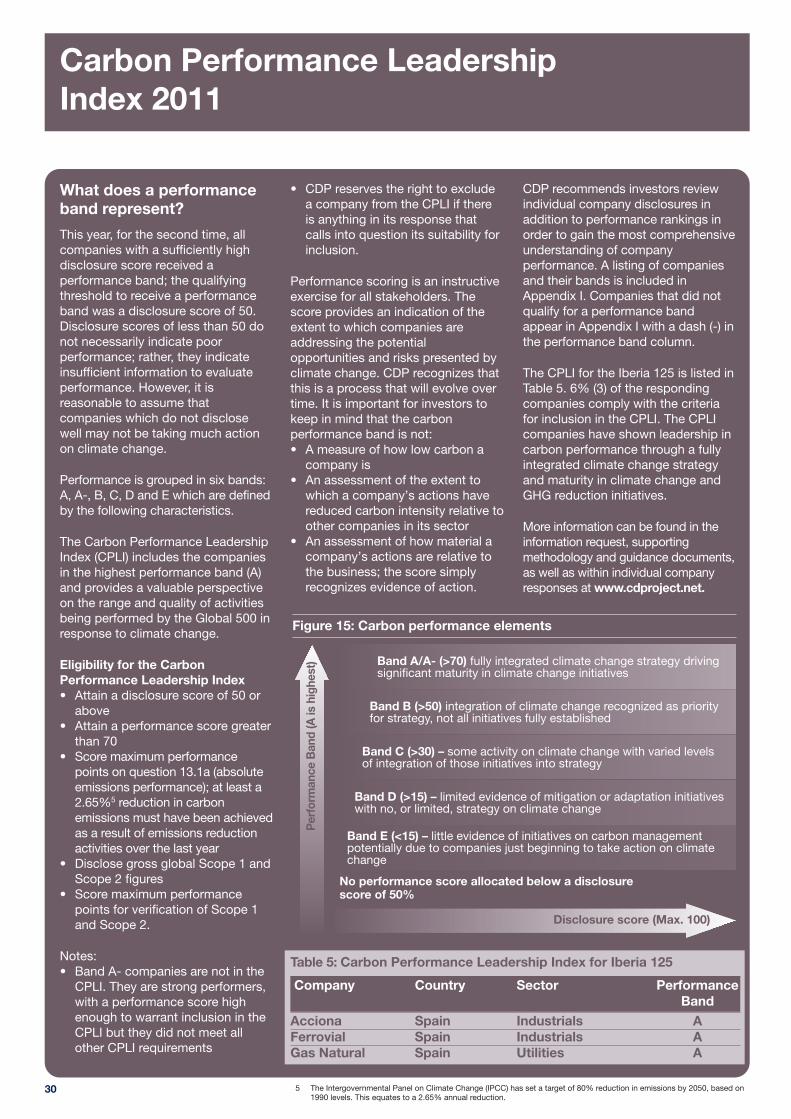
30
Carbon Performance Leadership Index 2011
Band A/A- (>70) fully integrated climate change strategy drivingsignificant maturity in climate change initiatives
Band B (>50) integration of climate change recognized as priority for strategy, not all initiatives fully established
Band C (>30) – some activity on climate change with varied levels of integration of those initiatives into strategy
Band D (>15) – limited evidence of mitigation or adaptation initiativeswith no, or limited, strategy on climate change
Band E (<15) – little evidence of initiatives on carbon managementpotentially due to companies just beginning to take action on climatechange
No performance score allocated below a disclosure score of 50%
Disclosure score (Max. 100)
Per
form
ance
Ban
d (A
is h
ighe
st)
Figure 15: Carbon performance elements
What does a performanceband represent?
This year, for the second time, allcompanies with a sufficiently highdisclosure score received aperformance band; the qualifyingthreshold to receive a performanceband was a disclosure score of 50.Disclosure scores of less than 50 donot necessarily indicate poorperformance; rather, they indicateinsufficient information to evaluateperformance. However, it isreasonable to assume thatcompanies which do not disclosewell may not be taking much actionon climate change.
Performance is grouped in six bands:A, A-, B, C, D and E which are definedby the following characteristics.
The Carbon Performance LeadershipIndex (CPLI) includes the companiesin the highest performance band (A)and provides a valuable perspectiveon the range and quality of activitiesbeing performed by the Global 500 inresponse to climate change.
Eligibility for the CarbonPerformance Leadership Index• Attain a disclosure score of 50 or
above• Attain a performance score greater
than 70• Score maximum performance
points on question 13.1a (absoluteemissions performance); at least a2.65%5 reduction in carbonemissions must have been achievedas a result of emissions reductionactivities over the last year
• Disclose gross global Scope 1 andScope 2 figures
• Score maximum performancepoints for verification of Scope 1and Scope 2.
Notes: • Band A- companies are not in the
CPLI. They are strong performers,with a performance score highenough to warrant inclusion in theCPLI but they did not meet allother CPLI requirements
• CDP reserves the right to excludea company from the CPLI if thereis anything in its response thatcalls into question its suitability forinclusion.
Performance scoring is an instructiveexercise for all stakeholders. Thescore provides an indication of theextent to which companies areaddressing the potentialopportunities and risks presented byclimate change. CDP recognizes thatthis is a process that will evolve overtime. It is important for investors tokeep in mind that the carbonperformance band is not:• A measure of how low carbon a
company is• An assessment of the extent to
which a company’s actions havereduced carbon intensity relative toother companies in its sector
• An assessment of how material acompany’s actions are relative tothe business; the score simplyrecognizes evidence of action.
CDP recommends investors reviewindividual company disclosures inaddition to performance rankings inorder to gain the most comprehensiveunderstanding of companyperformance. A listing of companiesand their bands is included inAppendix I. Companies that did notqualify for a performance bandappear in Appendix I with a dash (-) inthe performance band column.
The CPLI for the Iberia 125 is listed inTable 5. 6% (3) of the respondingcompanies comply with the criteriafor inclusion in the CPLI. The CPLIcompanies have shown leadership incarbon performance through a fullyintegrated climate change strategyand maturity in climate change andGHG reduction initiatives.
More information can be found in theinformation request, supportingmethodology and guidance documents,as well as within individual companyresponses at www.cdproject.net.
Table 5: Carbon Performance Leadership Index for Iberia 125
Company Country Sector Performance Band
Acciona Spain Industrials AFerrovial Spain Industrials AGas Natural Spain Utilities A
5 The Intergovernmental Panel on Climate Change (IPCC) has set a target of 80% reduction in emissions by 2050, based on1990 levels. This equates to a 2.65% annual reduction.
Informe 2011 (ingles) 05/12/11 9:51 Página 30

Resumen ejecutivo
31
All of the companies covered in theIberia 125 report can be categorizedinto 10 sectors based on the GlobalIndustry Classification Standard (GICS).The nature and scale of climate relatedrisks and opportunities are often bestcompared on a sector by sector basisand examining companies by sector
often provides insight into thechallenges faced by a particular sector.Of the 48 companies that respondedto the CDP questionnaire the largestnumber of responding companies canbe found the Financials (13), Industrials(10) and Utilities (6) sectors asillustrated in Figure 16.
Sector analysis
Figure 16: Number of responding companies by sector
Number of responding companies
Financials
0 2 4 6 8 10 12 14
13
Industrials
10
Utilities
6
Consumer Discretionary
5
Telecomunications
4
Energy
3
Information Tecnology
2
Consumer Staples
2
Materials
2
Healthcare
1
Informe 2011 (ingles) 05/12/11 9:51 Página 31
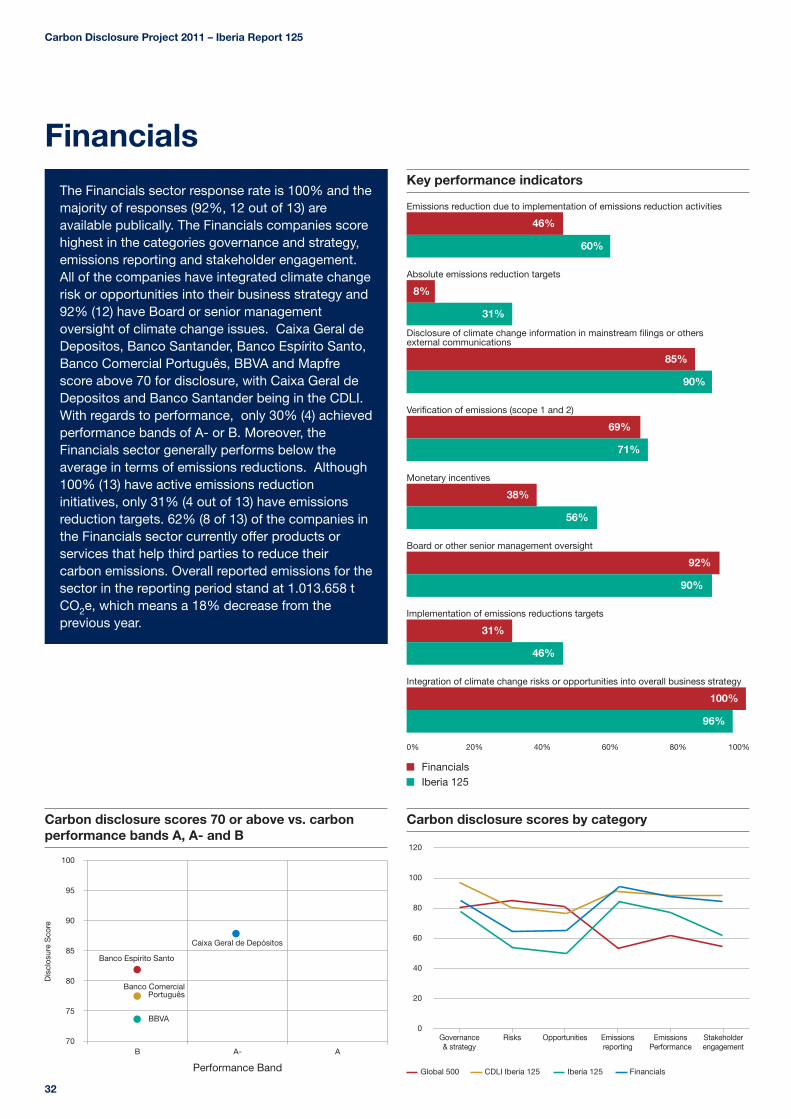
Carbon Disclosure Project 2011 – Iberia Report 125
32
The Financials sector response rate is 100% and themajority of responses (92%, 12 out of 13) areavailable publically. The Financials companies scorehighest in the categories governance and strategy,emissions reporting and stakeholder engagement.All of the companies have integrated climate changerisk or opportunities into their business strategy and92% (12) have Board or senior managementoversight of climate change issues. Caixa Geral deDepositos, Banco Santander, Banco Espírito Santo,Banco Comercial Português, BBVA and Mapfrescore above 70 for disclosure, with Caixa Geral deDepositos and Banco Santander being in the CDLI.With regards to performance, only 30% (4) achievedperformance bands of A- or B. Moreover, theFinancials sector generally performs below theaverage in terms of emissions reductions. Although100% (13) have active emissions reductioninitiatives, only 31% (4 out of 13) have emissionsreduction targets. 62% (8 of 13) of the companies inthe Financials sector currently offer products orservices that help third parties to reduce theircarbon emissions. Overall reported emissions for thesector in the reporting period stand at 1.013.658 tCO2e, which means a 18% decrease from theprevious year.
Key performance indicators
FinancialsIberia 125
Emissions reduction due to implementation of emissions reduction activities
0% 20% 40% 60% 80% 100%
46%
60%
Absolute emissions reduction targets
8%
31%
Disclosure of climate change information in mainstream filings or others external communications
85%
90%
Verification of emissions (scope 1 and 2)
69%
71%
Monetary incentives
38%
56%
Board or other senior management oversight
92%
90%
Implementation of emissions reductions targets
31%
46%
Integration of climate change risks or opportunities into overall business strategy
100%
96%
Carbon disclosure scores 70 or above vs. carbonperformance bands A, A- and B
Carbon disclosure scores by category
Dis
clos
ure
Sco
re
100
95
90
85
80
75
70
120
100
80
60
40
20
0
B A-
Performance Band
A
Banco Espirito Santo
Banco ComercialPortuguês
Caixa Geral de Depósitos
BBVA
Governance& strategy
Risks Opportunities Emissions reporting
Emissions Performance
Stakeholderengagement
Global 500 CDLI Iberia 125 Iberia 125 Financials
Financials
Informe 2011 (ingles) 05/12/11 9:51 Página 32
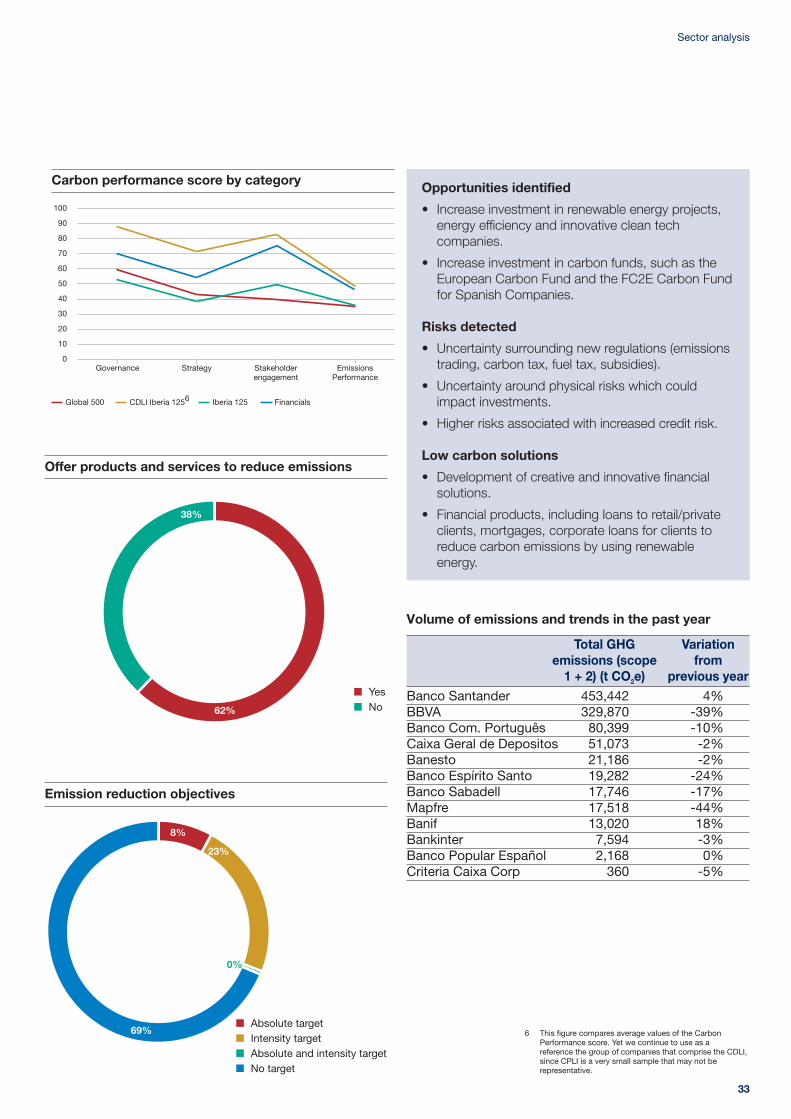
33
Sector analysis
Carbon performance score by category
100
90
80
70
60
50
40
30
20
10
0Governance Strategy Stakeholder
engagementEmissions
Performance
Global 500 CDLI Iberia 1256 Iberia 125 Financials
Offer products and services to reduce emissions
Emission reduction objectives
Volume of emissions and trends in the past year
Total GHG Variationemissions (scope from
1 + 2) (t CO2e) previous yearBanco Santander 453,442 4%BBVA 329,870 -39%Banco Com. Português 80,399 -10%Caixa Geral de Depositos 51,073 -2%Banesto 21,186 -2%Banco Espírito Santo 19,282 -24%Banco Sabadell 17,746 -17%Mapfre 17,518 -44%Banif 13,020 18%Bankinter 7,594 -3%Banco Popular Español 2,168 0%Criteria Caixa Corp 360 -5%
Opportunities identified
• Increase investment in renewable energy projects,energy efficiency and innovative clean techcompanies.
• Increase investment in carbon funds, such as theEuropean Carbon Fund and the FC2E Carbon Fundfor Spanish Companies.
Risks detected
• Uncertainty surrounding new regulations (emissionstrading, carbon tax, fuel tax, subsidies).
• Uncertainty around physical risks which couldimpact investments.
• Higher risks associated with increased credit risk.
Low carbon solutions
• Development of creative and innovative financialsolutions.
• Financial products, including loans to retail/privateclients, mortgages, corporate loans for clients toreduce carbon emissions by using renewableenergy.
6 This figure compares average values of the CarbonPerformance score. Yet we continue to use as areference the group of companies that comprise the CDLI,since CPLI is a very small sample that may not berepresentative.
Informe 2011 (ingles) 05/12/11 10:20 Página 33
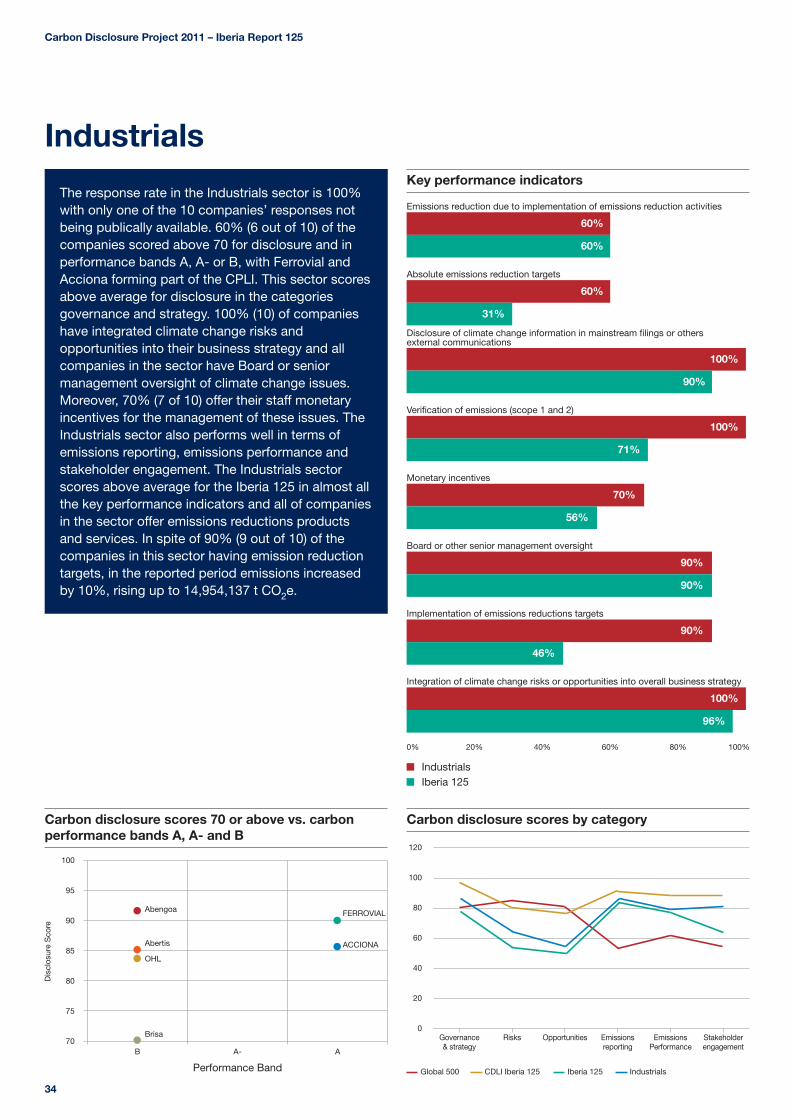
Carbon Disclosure Project 2011 – Iberia Report 125
34
The response rate in the Industrials sector is 100%with only one of the 10 companies’ responses notbeing publically available. 60% (6 out of 10) of thecompanies scored above 70 for disclosure and inperformance bands A, A- or B, with Ferrovial andAcciona forming part of the CPLI. This sector scoresabove average for disclosure in the categoriesgovernance and strategy. 100% (10) of companieshave integrated climate change risks andopportunities into their business strategy and allcompanies in the sector have Board or seniormanagement oversight of climate change issues.Moreover, 70% (7 of 10) offer their staff monetaryincentives for the management of these issues. TheIndustrials sector also performs well in terms ofemissions reporting, emissions performance andstakeholder engagement. The Industrials sectorscores above average for the Iberia 125 in almost allthe key performance indicators and all of companiesin the sector offer emissions reductions productsand services. In spite of 90% (9 out of 10) of thecompanies in this sector having emission reductiontargets, in the reported period emissions increasedby 10%, rising up to 14,954,137 t CO2e.
Key performance indicators
IndustrialsIberia 125
Emissions reduction due to implementation of emissions reduction activities
0% 20% 40% 60% 80% 100%
60%
60%
Absolute emissions reduction targets
60%
31%
Disclosure of climate change information in mainstream filings or others external communications
100%
90%
Verification of emissions (scope 1 and 2)
100%
71%
Monetary incentives
70%
56%
Board or other senior management oversight
90%
90%
Implementation of emissions reductions targets
90%
46%
Integration of climate change risks or opportunities into overall business strategy
100%
96%
Carbon disclosure scores 70 or above vs. carbonperformance bands A, A- and B
Dis
clos
ure
Sco
re
100
95
90
85
80
75
70B A-
Performance Band
A
Abertis
OHL
FERROVIAL
ACCIONA
Brisa
Abengoa
Carbon disclosure scores by category
120
100
80
60
40
20
0Governance& strategy
Risks Opportunities Emissions reporting
Emissions Performance
Stakeholderengagement
Global 500 CDLI Iberia 125 Iberia 125 Industrials
Industrials
Informe 2011 (ingles) 05/12/11 9:51 Página 34
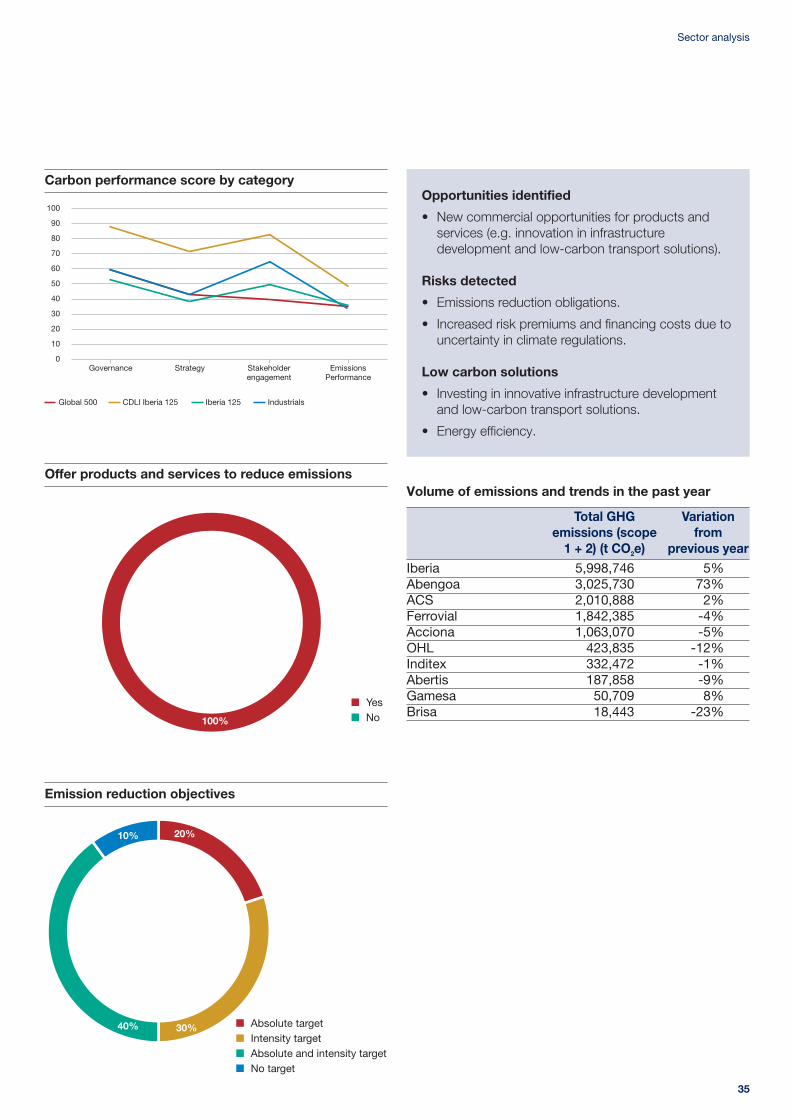
35
Sector analysis
Carbon performance score by category
100
90
80
70
60
50
40
30
20
10
0Governance Strategy Stakeholder
engagementEmissions
Performance
Global 500 CDLI Iberia 125 Iberia 125 Industrials
Offer products and services to reduce emissions
Opportunities identified
• New commercial opportunities for products andservices (e.g. innovation in infrastructuredevelopment and low-carbon transport solutions).
Risks detected
• Emissions reduction obligations.
• Increased risk premiums and financing costs due touncertainty in climate regulations.
Low carbon solutions
• Investing in innovative infrastructure developmentand low-carbon transport solutions.
• Energy efficiency.
Volume of emissions and trends in the past year
Total GHG Variationemissions (scope from
1 + 2) (t CO2e) previous yearIberia 5,998,746 5%Abengoa 3,025,730 73%ACS 2,010,888 2%Ferrovial 1,842,385 -4%Acciona 1,063,070 -5%OHL 423,835 -12%Inditex 332,472 -1%Abertis 187,858 -9%Gamesa 50,709 8%Brisa 18,443 -23%
Emission reduction objectives
Informe 2011 (ingles) 05/12/11 9:51 Página 35
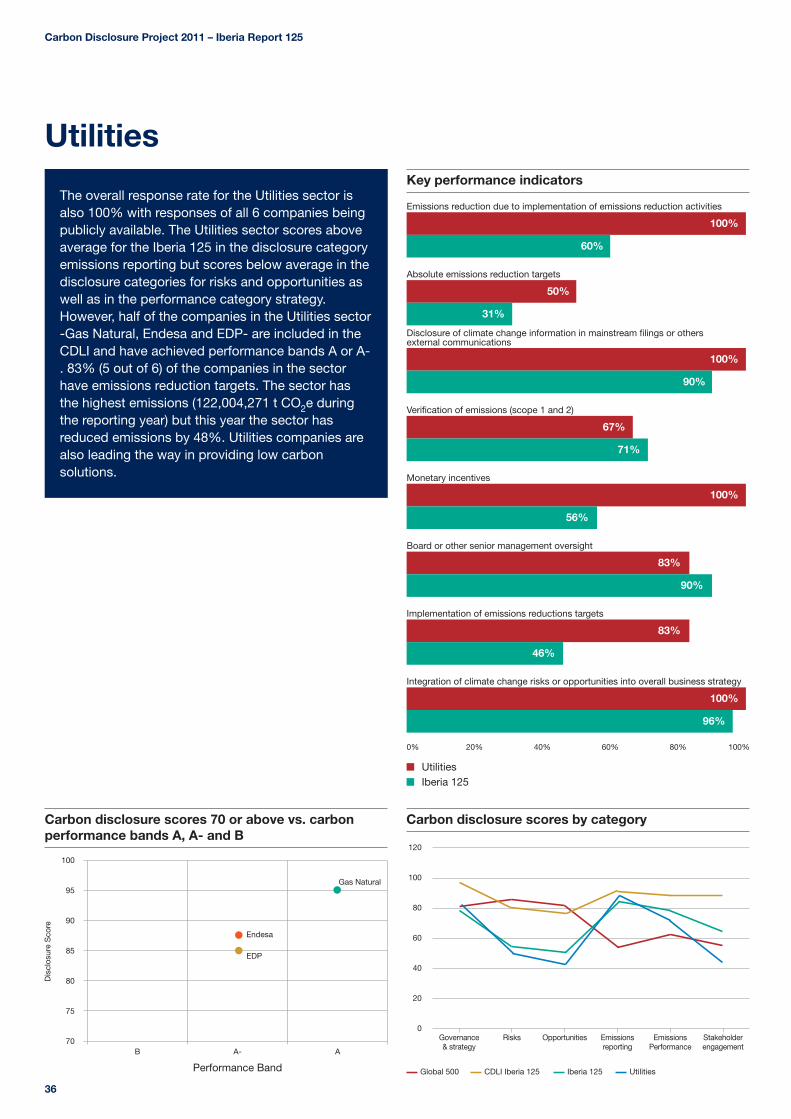
Carbon Disclosure Project 2011 – Iberia Report 125
36
The overall response rate for the Utilities sector isalso 100% with responses of all 6 companies beingpublicly available. The Utilities sector scores aboveaverage for the Iberia 125 in the disclosure categoryemissions reporting but scores below average in thedisclosure categories for risks and opportunities aswell as in the performance category strategy.However, half of the companies in the Utilities sector-Gas Natural, Endesa and EDP- are included in theCDLI and have achieved performance bands A or A-. 83% (5 out of 6) of the companies in the sectorhave emissions reduction targets. The sector hasthe highest emissions (122,004,271 t CO2e duringthe reporting year) but this year the sector hasreduced emissions by 48%. Utilities companies arealso leading the way in providing low carbonsolutions.
Key performance indicators
UtilitiesIberia 125
Emissions reduction due to implementation of emissions reduction activities
0% 20% 40% 60% 80% 100%
100%
60%
Absolute emissions reduction targets
50%
31%
Disclosure of climate change information in mainstream filings or others external communications
100%
90%
Verification of emissions (scope 1 and 2)
67%
71%
Monetary incentives
100%
56%
Board or other senior management oversight
83%
90%
Implementation of emissions reductions targets
83%
46%
Integration of climate change risks or opportunities into overall business strategy
100%
96%
Carbon disclosure scores 70 or above vs. carbonperformance bands A, A- and B
Dis
clos
ure
Sco
re
100
95
90
85
80
75
70B A-
Performance Band
A
Endesa
EDP
Gas Natural
Carbon disclosure scores by category
120
100
80
60
40
20
0Governance& strategy
Risks Opportunities Emissions reporting
Emissions Performance
Stakeholderengagement
Global 500 CDLI Iberia 125 Iberia 125 Utilities
Utilities
Informe 2011 (ingles) 05/12/11 9:51 Página 36
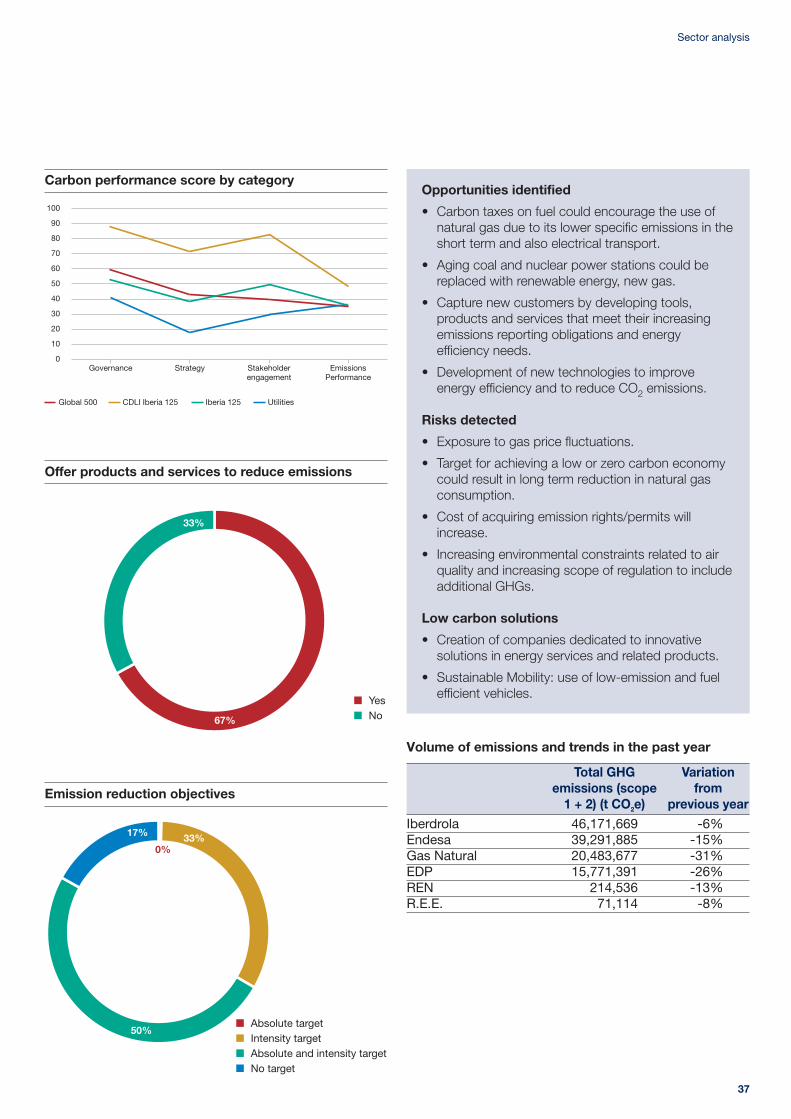
37
Sector analysis
Carbon performance score by category
100
90
80
70
60
50
40
30
20
10
0Governance Strategy Stakeholder
engagementEmissions
Performance
Global 500 CDLI Iberia 125 Iberia 125 Utilities
Offer products and services to reduce emissions
Volume of emissions and trends in the past year
Total GHG Variationemissions (scope from
1 + 2) (t CO2e) previous yearIberdrola 46,171,669 -6%Endesa 39,291,885 -15%Gas Natural 20,483,677 -31%EDP 15,771,391 -26%REN 214,536 -13%R.E.E. 71,114 -8%
Emission reduction objectives
Opportunities identified
• Carbon taxes on fuel could encourage the use ofnatural gas due to its lower specific emissions in theshort term and also electrical transport.
• Aging coal and nuclear power stations could bereplaced with renewable energy, new gas.
• Capture new customers by developing tools,products and services that meet their increasingemissions reporting obligations and energyefficiency needs.
• Development of new technologies to improveenergy efficiency and to reduce CO2 emissions.
Risks detected
• Exposure to gas price fluctuations.
• Target for achieving a low or zero carbon economycould result in long term reduction in natural gasconsumption.
• Cost of acquiring emission rights/permits willincrease.
• Increasing environmental constraints related to airquality and increasing scope of regulation to includeadditional GHGs.
Low carbon solutions
• Creation of companies dedicated to innovativesolutions in energy services and related products.
• Sustainable Mobility: use of low-emission and fuelefficient vehicles.
Informe 2011 (ingles) 05/12/11 9:51 Página 37
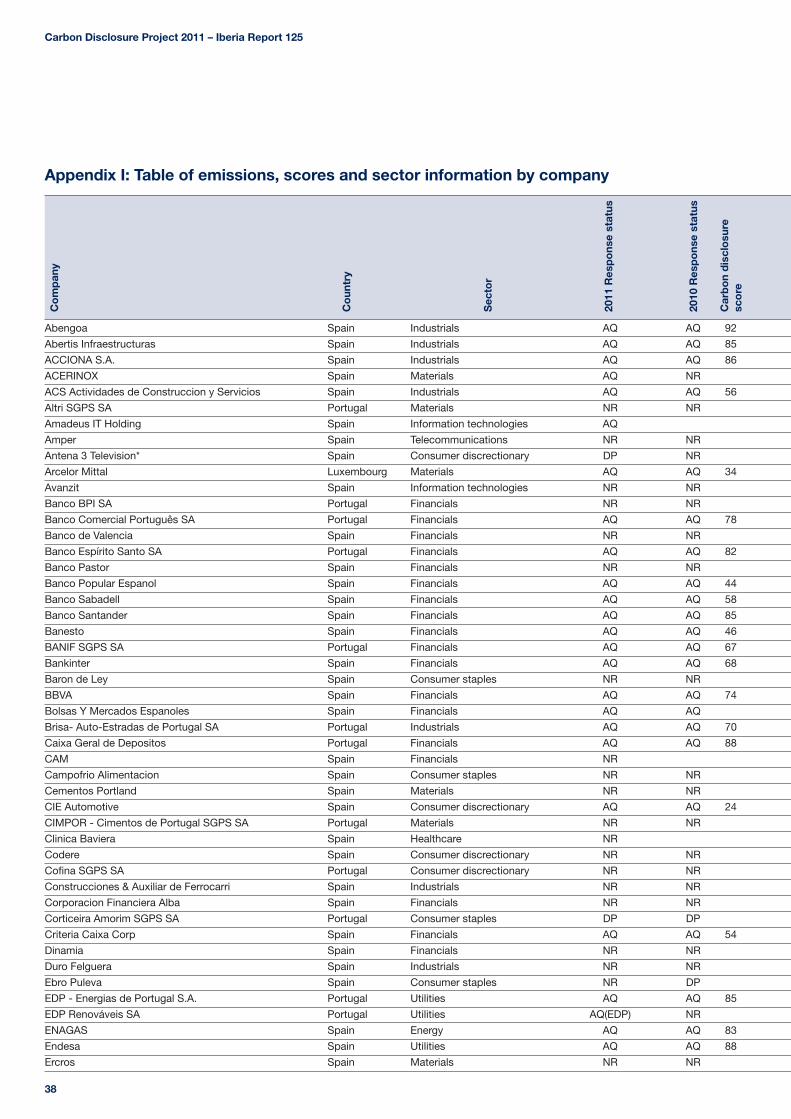
Carbon Disclosure Project 2011 – Iberia Report 125
38
Abengoa Spain Industrials AQ AQ 92
Abertis Infraestructuras Spain Industrials AQ AQ 85
ACCIONA S.A. Spain Industrials AQ AQ 86
ACERINOX Spain Materials AQ NR
ACS Actividades de Construccion y Servicios Spain Industrials AQ AQ 56
Altri SGPS SA Portugal Materials NR NR
Amadeus IT Holding Spain Information technologies AQ
Amper Spain Telecommunications NR NR
Antena 3 Television* Spain Consumer discrectionary DP NR
Arcelor Mittal Luxembourg Materials AQ AQ 34
Avanzit Spain Information technologies NR NR
Banco BPI SA Portugal Financials NR NR
Banco Comercial Português SA Portugal Financials AQ AQ 78
Banco de Valencia Spain Financials NR NR
Banco Espírito Santo SA Portugal Financials AQ AQ 82
Banco Pastor Spain Financials NR NR
Banco Popular Espanol Spain Financials AQ AQ 44
Banco Sabadell Spain Financials AQ AQ 58
Banco Santander Spain Financials AQ AQ 85
Banesto Spain Financials AQ AQ 46
BANIF SGPS SA Portugal Financials AQ AQ 67
Bankinter Spain Financials AQ AQ 68
Baron de Ley Spain Consumer staples NR NR
BBVA Spain Financials AQ AQ 74
Bolsas Y Mercados Espanoles Spain Financials AQ AQ
Brisa- Auto-Estradas de Portugal SA Portugal Industrials AQ AQ 70
Caixa Geral de Depositos Portugal Financials AQ AQ 88
CAM Spain Financials NR
Campofrio Alimentacion Spain Consumer staples NR NR
Cementos Portland Spain Materials NR NR
CIE Automotive Spain Consumer discrectionary AQ AQ 24
CIMPOR - Cimentos de Portugal SGPS SA Portugal Materials NR NR
Clinica Baviera Spain Healthcare NR
Codere Spain Consumer discrectionary NR NR
Cofina SGPS SA Portugal Consumer discrectionary NR NR
Construcciones & Auxiliar de Ferrocarri Spain Industrials NR NR
Corporacion Financiera Alba Spain Financials NR NR
Corticeira Amorim SGPS SA Portugal Consumer staples DP DP
Criteria Caixa Corp Spain Financials AQ AQ 54
Dinamia Spain Financials NR NR
Duro Felguera Spain Industrials NR NR
Ebro Puleva Spain Consumer staples NR DP
EDP - Energias de Portugal S.A. Portugal Utilities AQ AQ 85
EDP Renováveis SA Portugal Utilities AQ(EDP) NR
ENAGAS Spain Energy AQ AQ 83
Endesa Spain Utilities AQ AQ 88
Ercros Spain Materials NR NR
Co
untr
y
Sec
tor
2011
Res
po
nse
stat
us
2010
Res
po
nse
stat
us
Car
bo
n d
iscl
osu
resc
ore
Co
mp
any
Appendix I: Table of emissions, scores and sector information by company
Informe 2011 (ingles) 05/12/11 9:51 Página 38
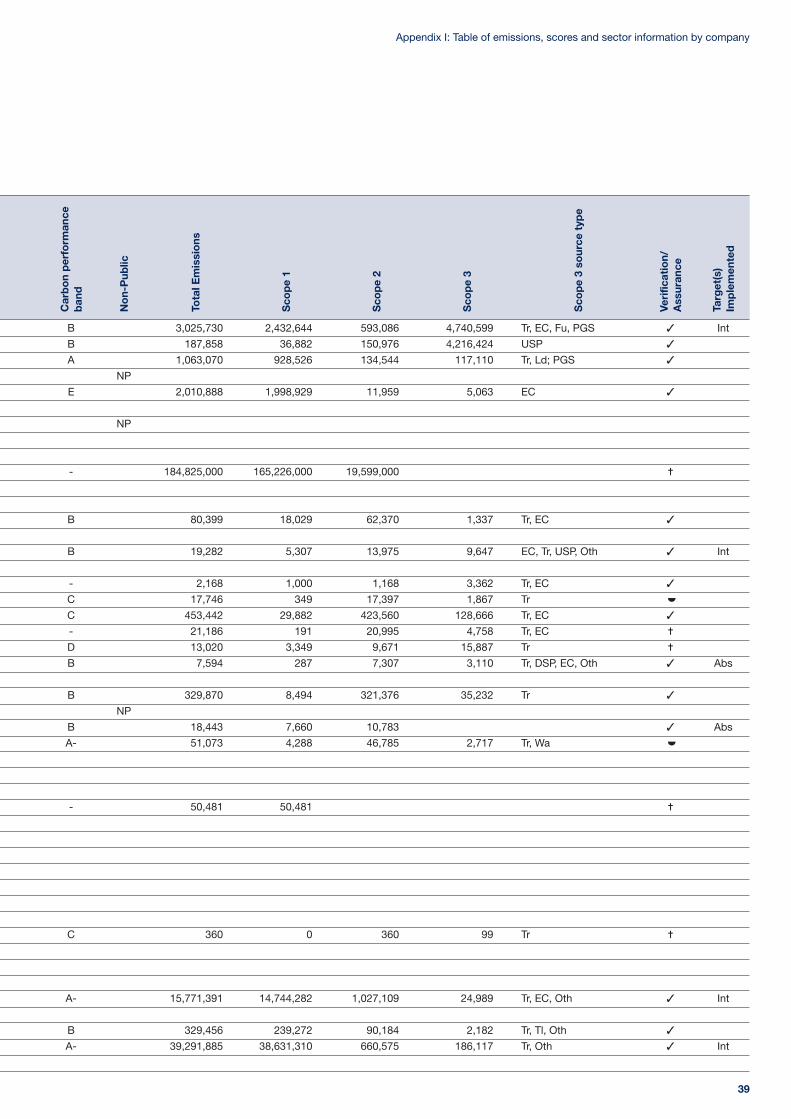
39
Appendix I: Table of emissions, scores and sector information by company
B 3,025,730 2,432,644 593,086 4,740,599 Tr, EC, Fu, PGS 3 Int
B 187,858 36,882 150,976 4,216,424 USP 3
A 1,063,070 928,526 134,544 117,110 Tr, Ld; PGS 3
NP
E 2,010,888 1,998,929 11,959 5,063 EC 3
NP
- 184,825,000 165,226,000 19,599,000 =
B 80,399 18,029 62,370 1,337 Tr, EC 3
B 19,282 5,307 13,975 9,647 EC, Tr, USP, Oth 3 Int
- 2,168 1,000 1,168 3,362 Tr, EC 3
C 17,746 349 17,397 1,867 Tr
C 453,442 29,882 423,560 128,666 Tr, EC 3
- 21,186 191 20,995 4,758 Tr, EC =
D 13,020 3,349 9,671 15,887 Tr =
B 7,594 287 7,307 3,110 Tr, DSP, EC, Oth 3 Abs
B 329,870 8,494 321,376 35,232 Tr 3
NP
B 18,443 7,660 10,783 3 Abs
A- 51,073 4,288 46,785 2,717 Tr, Wa
- 50,481 50,481 =
C 360 0 360 99 Tr =
A- 15,771,391 14,744,282 1,027,109 24,989 Tr, EC, Oth 3 Int
B 329,456 239,272 90,184 2,182 Tr, Tl, Oth 3
A- 39,291,885 38,631,310 660,575 186,117 Tr, Oth 3 Int
ww
Car
bo
n p
erfo
rman
ceb
and
No
n-P
ublic
Tota
l Em
issi
ons
Sco
pe
1
Sco
pe
2
Sco
pe
3
Sco
pe
3 so
urce
typ
e
Veri
ficat
ion/
Ass
uran
ce
Targ
et(s
)Im
ple
men
ted
Informe 2011 (ingles) 05/12/11 9:51 Página 39

Carbon Disclosure Project 2011 – Iberia Report 125
40
Espirito Santo Financial Group S.A. Luxembourg Financials AQ(Banco Espirito Santo) DP
Faes Farma Spain Healthcare NR NR
FERROVIAL Spain Industrials AQ AQ 90
Fersa Energias Renovables Spain Utilities NR NR
FINIBANCO,SGPS Portugal Financials NR NR
Fluidra Spain Consumer discrectionary DP NR
Fomento de Construcciones y Contratas Spain Industrials AQ AQ
Galp Energia SGPS SA Portugal Energy AQ NR
Gamesa Corporación Tecnológica, S.A. Spain Industrials AQ AQ 46
Gas Natural SDG SA Spain Utilities AQ AQ 95
GLINTT-Global Intelligent Technologies SGPS SA Portugal Information technologies DP NR
GRIFOLS Spain Healthcare AQ AQ 60
Grupo Catalana Occidente Spain Financials NR NR
Grupo Empresarial ENCE Spain Materials NR NR
Grupo Soares da Costa SGPS SA Portugal Industrials DP DP
Iberdrola Spain Utilities AQ AQ 78
Iberdrola Renovables Spain Utilities DP DP
Iberia Lineas Aereas de Espana SA Spain Industrials AQ AQ 57
Iberpapel Gestión Spain Materials NR
Ibersol SGPS SA Portugal Consumer discrectionary NR DP
Impresa SGPS SA Portugal Consumer discrectionary NR DP
Inapa - Investimentos Particip Gestao SA Portugal Materials NR NR
Inditex Spain Consumer discrectionary AQ AQ 57
INDRA A Spain Information technologies AQ AQ 60
Inmobiliaria Colonial Spain Financials NR
Jazztel Spain Information technologies NR NR
Jerónimo Martins SGPS SA Portugal Consumer staples AQ AQ 52
Laboratorios Almirall Spain Healthcare NR NR
Laboratorios Farmaceuticos Rovi Spain Healthcare NR NR
MAPFRE Spain Financials AQ AQ 72
MARTIFER SGPS SA Portugal Industrials DP DP
MEDIA CAPITAL Portugal Consumer discrectionary NR NR
Miquel Y Costas* Spain Materials NR NR
Mota-Engil Portugal Industrials DP NR
Natra Spain Healthcare NR NR
NH Hoteles Spain Consumer discrectionary AQ AQ 72
NOVABASE, SGPS Portugal Information technologies NR NR
Obrascon Huarte Lain (OHL) Spain Industrials AQ AQ 84
Papeles y Cartones de Europa Spain Materials NR NR
Pescanova Spain Consumer staples NR
Portucel Soporcel Group Portugal Materials DP DP
Portugal Telecom Portugal Telecommunications AQ AQ 69
Prim Spain Healthcare NR NR
Promotora de Informaciones Spain Consumer discrectionary NR NR
Prosegur Spain Industrials NR NR
R.E.E. Spain Utilities AQ AQ 60
Realia Business Spain Financials NR NR
REDITUS, SGPS Portugal Information technologies NR NR
REN - Redes Energéticas Nacionais Portugal Utilities AQ NP 69
Co
untr
y
Sec
tor
2011
Res
po
nse
stat
us
2010
Res
po
nse
stat
us
Car
bo
n d
iscl
osu
resc
ore
Co
mp
any
Informe 2011 (ingles) 05/12/11 9:51 Página 40
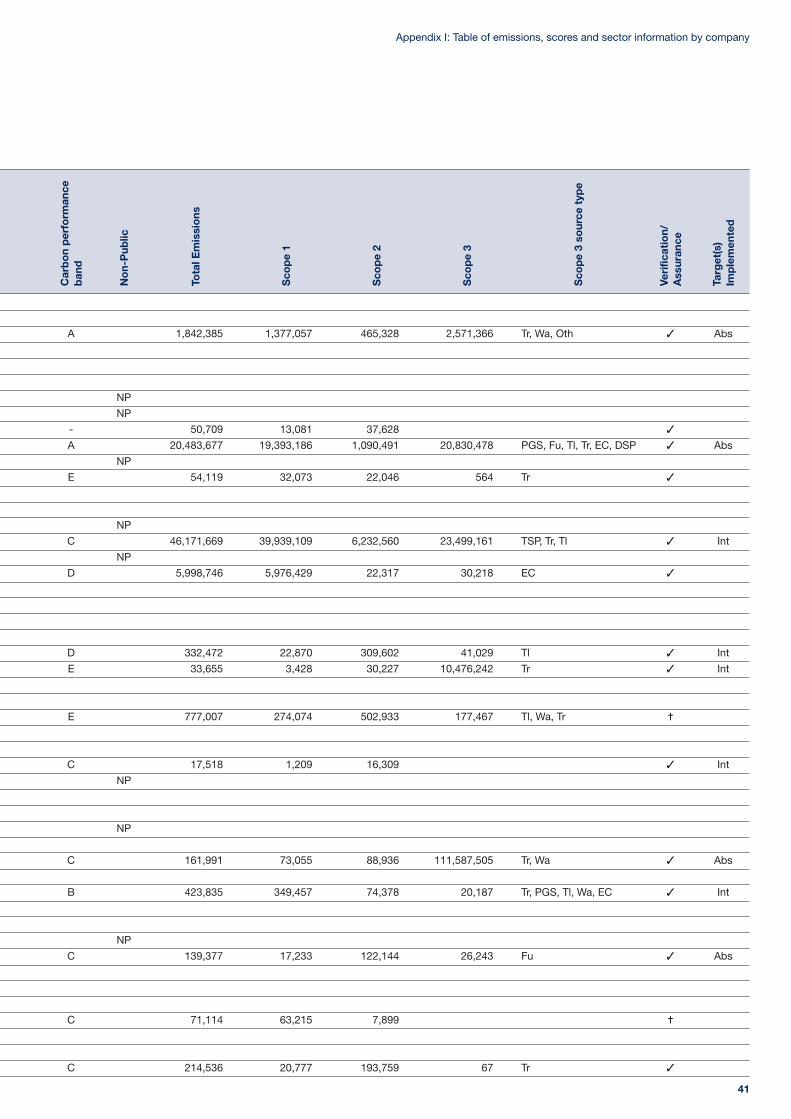
41
Appendix I: Table of emissions, scores and sector information by company
A 1,842,385 1,377,057 465,328 2,571,366 Tr, Wa, Oth 3 Abs
NP
NP
- 50,709 13,081 37,628 3
A 20,483,677 19,393,186 1,090,491 20,830,478 PGS, Fu, Tl, Tr, EC, DSP 3 Abs
NP
E 54,119 32,073 22,046 564 Tr 3
NP
C 46,171,669 39,939,109 6,232,560 23,499,161 TSP, Tr, Tl 3 Int
NP
D 5,998,746 5,976,429 22,317 30,218 EC 3
D 332,472 22,870 309,602 41,029 Tl 3 Int
E 33,655 3,428 30,227 10,476,242 Tr 3 Int
E 777,007 274,074 502,933 177,467 Tl, Wa, Tr =
C 17,518 1,209 16,309 3 Int
NP
NP
C 161,991 73,055 88,936 111,587,505 Tr, Wa 3 Abs
B 423,835 349,457 74,378 20,187 Tr, PGS, Tl, Wa, EC 3 Int
NP
C 139,377 17,233 122,144 26,243 Fu 3 Abs
C 71,114 63,215 7,899 =
C 214,536 20,777 193,759 67 Tr 3
Car
bo
n p
erfo
rman
ceb
and
No
n-P
ublic
Tota
l Em
issi
ons
Sco
pe
1
Sco
pe
2
Sco
pe
3
Sco
pe
3 so
urce
typ
e
Veri
ficat
ion/
Ass
uran
ce
Targ
et(s
)Im
ple
men
ted
Informe 2011 (ingles) 05/12/11 9:51 Página 41
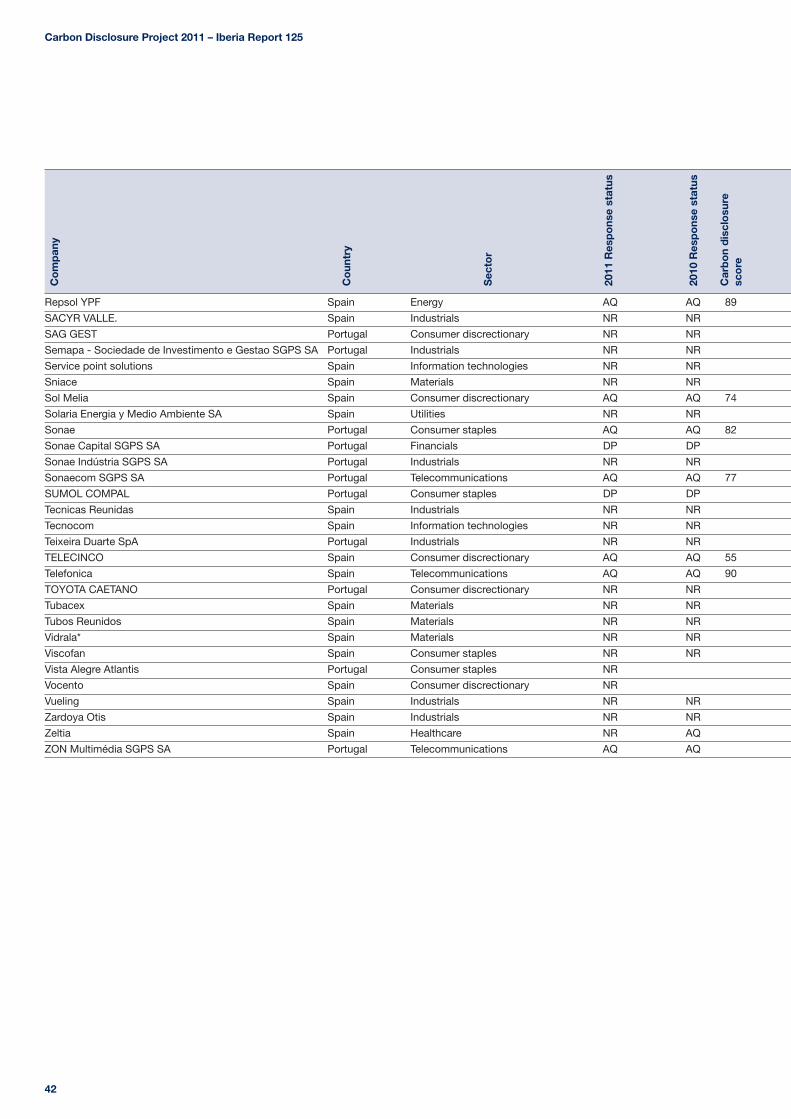
Carbon Disclosure Project 2011 – Iberia Report 125
42
Repsol YPF Spain Energy AQ AQ 89
SACYR VALLE. Spain Industrials NR NR
SAG GEST Portugal Consumer discrectionary NR NR
Semapa - Sociedade de Investimento e Gestao SGPS SA Portugal Industrials NR NR
Service point solutions Spain Information technologies NR NR
Sniace Spain Materials NR NR
Sol Melia Spain Consumer discrectionary AQ AQ 74
Solaria Energia y Medio Ambiente SA Spain Utilities NR NR
Sonae Portugal Consumer staples AQ AQ 82
Sonae Capital SGPS SA Portugal Financials DP DP
Sonae Indústria SGPS SA Portugal Industrials NR NR
Sonaecom SGPS SA Portugal Telecommunications AQ AQ 77
SUMOL COMPAL Portugal Consumer staples DP DP
Tecnicas Reunidas Spain Industrials NR NR
Tecnocom Spain Information technologies NR NR
Teixeira Duarte SpA Portugal Industrials NR NR
TELECINCO Spain Consumer discrectionary AQ AQ 55
Telefonica Spain Telecommunications AQ AQ 90
TOYOTA CAETANO Portugal Consumer discrectionary NR NR
Tubacex Spain Materials NR NR
Tubos Reunidos Spain Materials NR NR
Vidrala* Spain Materials NR NR
Viscofan Spain Consumer staples NR NR
Vista Alegre Atlantis Portugal Consumer staples NR
Vocento Spain Consumer discrectionary NR
Vueling Spain Industrials NR NR
Zardoya Otis Spain Industrials NR NR
Zeltia Spain Healthcare NR AQ
ZON Multimédia SGPS SA Portugal Telecommunications AQ AQ
Co
untr
y
Sec
tor
2011
Res
po
nse
stat
us
2010
Res
po
nse
stat
us
Car
bo
n d
iscl
osu
resc
ore
Co
mp
any
Informe 2011 (ingles) 05/12/11 9:51 Página 42
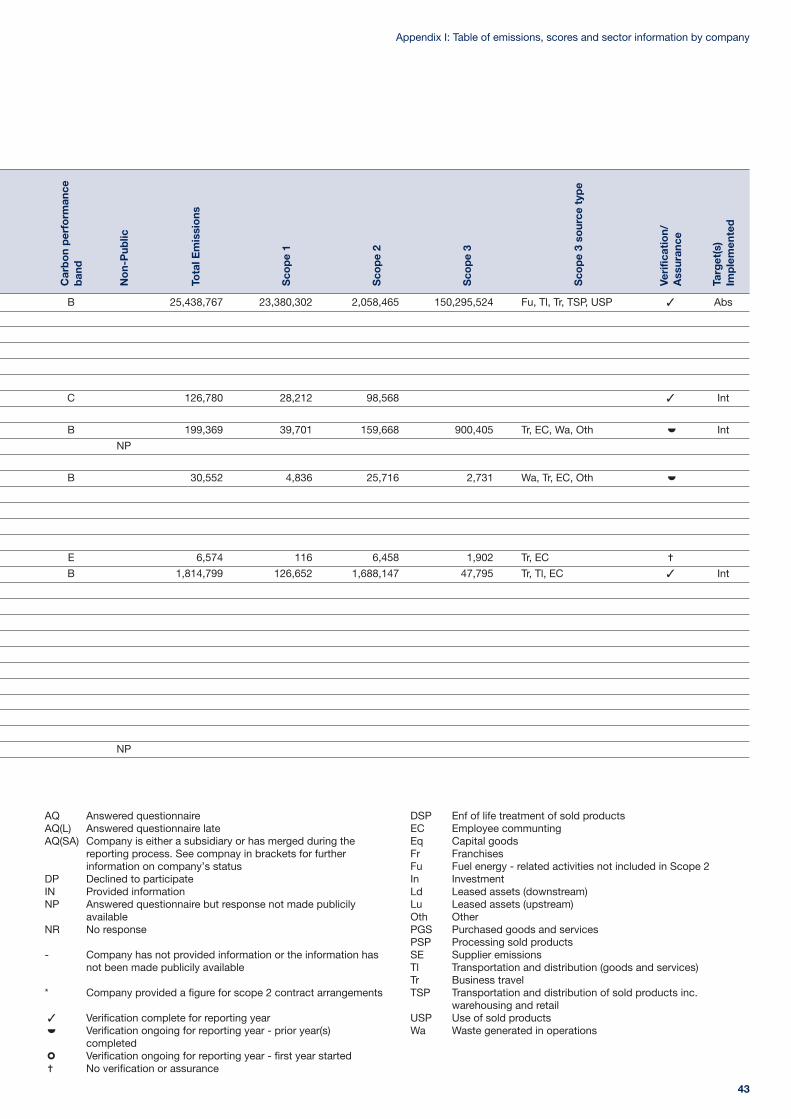
43
Appendix I: Table of emissions, scores and sector information by company
B 25,438,767 23,380,302 2,058,465 150,295,524 Fu, Tl, Tr, TSP, USP 3 Abs
C 126,780 28,212 98,568 3 Int
B 199,369 39,701 159,668 900,405 Tr, EC, Wa, Oth Int
NP
B 30,552 4,836 25,716 2,731 Wa, Tr, EC, Oth
E 6,574 116 6,458 1,902 Tr, EC =
B 1,814,799 126,652 1,688,147 47,795 Tr, Tl, EC 3 Int
NP
ww
AQ Answered questionnaireAQ(L) Answered questionnaire lateAQ(SA) Company is either a subsidiary or has merged during the
reporting process. See compnay in brackets for furtherinformation on company’s status
DP Declined to participateIN Provided informationNP Answered questionnaire but response not made publicily
availableNR No response
- Company has not provided information or the information hasnot been made publicily available
* Company provided a figure for scope 2 contract arrangements
3 Verification complete for reporting yearVerification ongoing for reporting year - prior year(s)completedVerification ongoing for reporting year - first year started
= No verification or assurance
DSP Enf of life treatment of sold productsEC Employee communtingEq Capital goodsFr FranchisesFu Fuel energy - related activities not included in Scope 2In InvestmentLd Leased assets (downstream)Lu Leased assets (upstream)Oth OtherPGS Purchased goods and servicesPSP Processing sold productsSE Supplier emissionsTl Transportation and distribution (goods and services)Tr Business travelTSP Transportation and distribution of sold products inc.
warehousing and retailUSP Use of sold productsWa Waste generated in operationsw
Car
bo
n p
erfo
rman
ceb
and
No
n-P
ublic
Tota
l Em
issi
ons
Sco
pe
1
Sco
pe
2
Sco
pe
3
Sco
pe
3 so
urce
typ
e
Veri
ficat
ion/
Ass
uran
ce
Targ
et(s
)Im
ple
men
ted
Informe 2011 (ingles) 05/12/11 9:51 Página 43
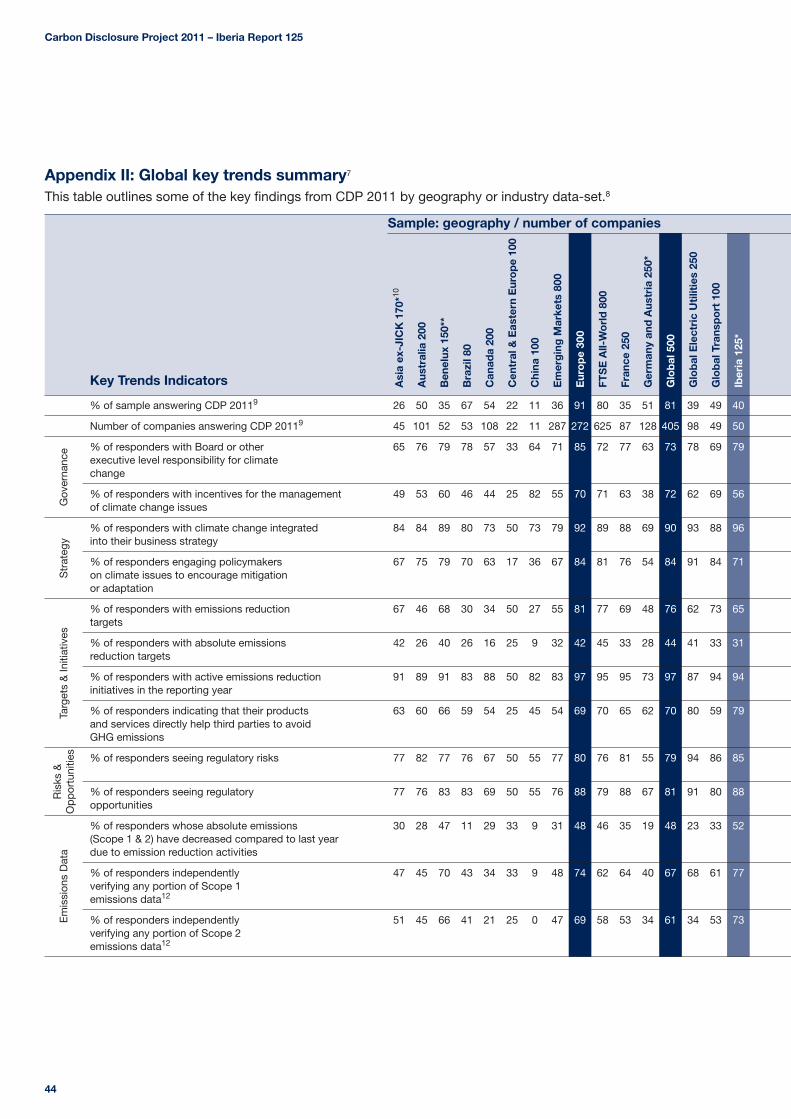
% of sample answering CDP 20119 26 50 35 67 54 22 11 36 91 80 35 51 81 39 49 40
Number of companies answering CDP 20119 45 101 52 53 108 22 11 287 272 625 87 128 405 98 49 50
% of responders with Board or other 65 76 79 78 57 33 64 71 85 72 77 63 73 78 69 79executive level responsibility for climatechange
% of responders with incentives for the management 49 53 60 46 44 25 82 55 70 71 63 38 72 62 69 56of climate change issues
% of responders with climate change integrated 84 84 89 80 73 50 73 79 92 89 88 69 90 93 88 96into their business strategy
% of responders engaging policymakers 67 75 79 70 63 17 36 67 84 81 76 54 84 91 84 71on climate issues to encourage mitigationor adaptation
% of responders with emissions reduction 67 46 68 30 34 50 27 55 81 77 69 48 76 62 73 65targets
% of responders with absolute emissions 42 26 40 26 16 25 9 32 42 45 33 28 44 41 33 31reduction targets
% of responders with active emissions reduction 91 89 91 83 88 50 82 83 97 95 95 73 97 87 94 94initiatives in the reporting year
% of responders indicating that their products 63 60 66 59 54 25 45 54 69 70 65 62 70 80 59 79and services directly help third parties to avoidGHG emissions
% of responders seeing regulatory risks 77 82 77 76 67 50 55 77 80 76 81 55 79 94 86 85
% of responders seeing regulatory 77 76 83 83 69 50 55 76 88 79 88 67 81 91 80 88opportunities
% of responders whose absolute emissions 30 28 47 11 29 33 9 31 48 46 35 19 48 23 33 52(Scope 1 & 2) have decreased compared to last yeardue to emission reduction activities
% of responders independently 47 45 70 43 34 33 9 48 74 62 64 40 67 68 61 77verifying any portion of Scope 1emissions data12
% of responders independently 51 45 66 41 21 25 0 47 69 58 53 34 61 34 53 73verifying any portion of Scope 2emissions data12
Carbon Disclosure Project 2011 – Iberia Report 125
44
Gov
erna
nce
Str
ateg
yTa
rget
s &
Initi
ativ
esR
isks
&O
pp
ortu
nitie
sE
mis
sion
s D
ata
Appendix II: Global key trends summary7
This table outlines some of the key findings from CDP 2011 by geography or industry data-set.8
Key Trends Indicators
Sample: geography / number of companies
Asi
a ex
-JIC
K 1
70*10
Aus
tral
ia 2
00
Ben
elux
150
**
Bra
zil 8
0
Can
ada
200
Cen
tral
& E
aste
rn E
uro
pe
100
Chi
na 1
00
Em
erg
ing
Mar
kets
800
Eur
op
e 30
0
FTS
E A
ll-W
orl
d 8
00
Fran
ce 2
50
Ger
man
y an
d A
ustr
ia 2
50*
Glo
bal
500
Glo
bal
Ele
ctri
c U
tilit
ies
250
Glo
bal
Tra
nsp
ort
100
Iber
ia 1
25*
Informe 2011 (ingles) 05/12/11 9:51 Página 44
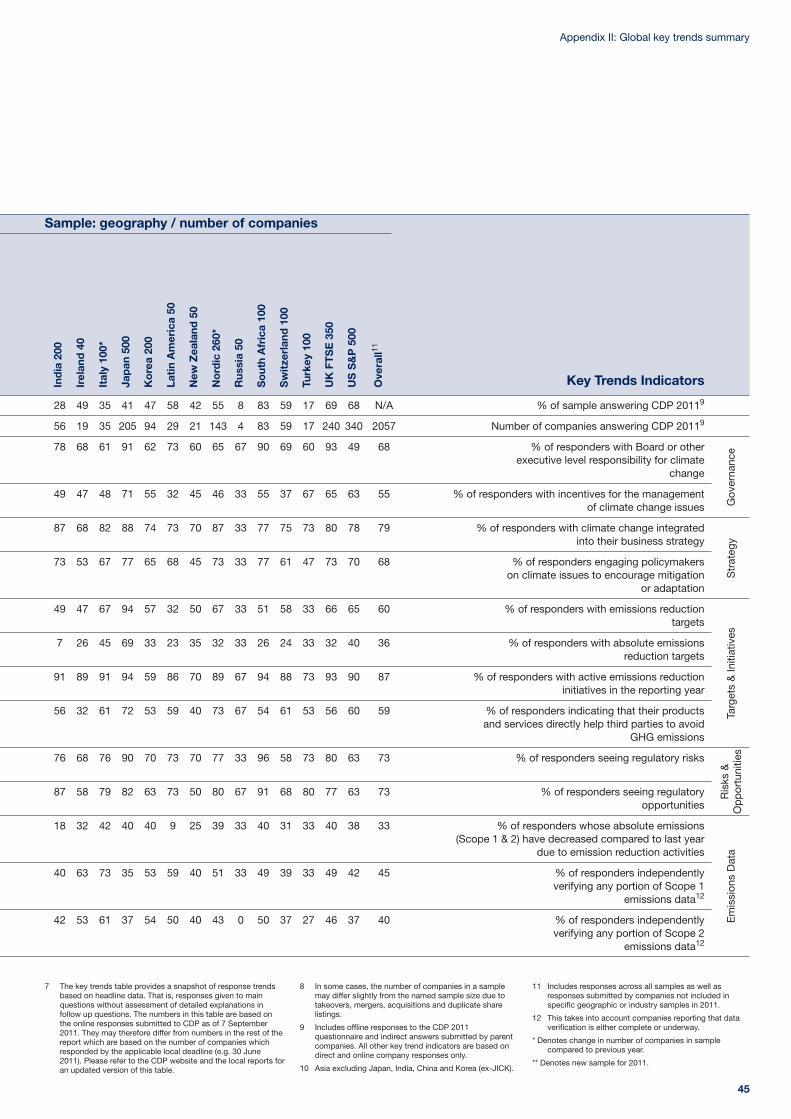
28 49 35 41 47 58 42 55 8 83 59 17 69 68 N/A % of sample answering CDP 20119
56 19 35 205 94 29 21 143 4 83 59 17 240 340 2057 Number of companies answering CDP 20119
78 68 61 91 62 73 60 65 67 90 69 60 93 49 68 % of responders with Board or otherexecutive level responsibility for climate
change
49 47 48 71 55 32 45 46 33 55 37 67 65 63 55 % of responders with incentives for the managementof climate change issues
87 68 82 88 74 73 70 87 33 77 75 73 80 78 79 % of responders with climate change integratedinto their business strategy
73 53 67 77 65 68 45 73 33 77 61 47 73 70 68 % of responders engaging policymakerson climate issues to encourage mitigation
or adaptation
49 47 67 94 57 32 50 67 33 51 58 33 66 65 60 % of responders with emissions reductiontargets
7 26 45 69 33 23 35 32 33 26 24 33 32 40 36 % of responders with absolute emissionsreduction targets
91 89 91 94 59 86 70 89 67 94 88 73 93 90 87 % of responders with active emissions reductioninitiatives in the reporting year
56 32 61 72 53 59 40 73 67 54 61 53 56 60 59 % of responders indicating that their productsand services directly help third parties to avoid
GHG emissions
76 68 76 90 70 73 70 77 33 96 58 73 80 63 73 % of responders seeing regulatory risks
87 58 79 82 63 73 50 80 67 91 68 80 77 63 73 % of responders seeing regulatoryopportunities
18 32 42 40 40 9 25 39 33 40 31 33 40 38 33 % of responders whose absolute emissions(Scope 1 & 2) have decreased compared to last year
due to emission reduction activities
40 63 73 35 53 59 40 51 33 49 39 33 49 42 45 % of responders independentlyverifying any portion of Scope 1
emissions data12
42 53 61 37 54 50 40 43 0 50 37 27 46 37 40 % of responders independentlyverifying any portion of Scope 2
emissions data12
45
Appendix II: Global key trends summary
Gov
erna
nce
Str
ateg
yTa
rget
s &
Initi
ativ
esR
isks
&O
pp
ortu
nitie
sE
mis
sion
s D
ata
7 The key trends table provides a snapshot of response trendsbased on headline data. That is, responses given to mainquestions without assessment of detailed explanations infollow up questions. The numbers in this table are based onthe online responses submitted to CDP as of 7 September2011. They may therefore differ from numbers in the rest of thereport which are based on the number of companies whichresponded by the applicable local deadline (e.g. 30 June2011). Please refer to the CDP website and the local reports foran updated version of this table.
8 In some cases, the number of companies in a samplemay differ slightly from the named sample size due totakeovers, mergers, acquisitions and duplicate sharelistings.
9 Includes offline responses to the CDP 2011questionnaire and indirect answers submitted by parentcompanies. All other key trend indicators are based ondirect and online company responses only.
10 Asia excluding Japan, India, China and Korea (ex-JICK).
11 Includes responses across all samples as well asresponses submitted by companies not included inspecific geographic or industry samples in 2011.
12 This takes into account companies reporting that dataverification is either complete or underway.
* Denotes change in number of companies in samplecompared to previous year.
** Denotes new sample for 2011.
Key Trends IndicatorsInd
ia 2
00
Irel
and
40
Ital
y 10
0*
Jap
an 5
00
Ko
rea
200
Lati
n A
mer
ica
50
New
Zea
land
50
No
rdic
260
*
Rus
sia
50
So
uth
Afr
ica
100
Sw
itze
rlan
d 1
00
Turk
ey 1
00
UK
FT
SE
350
US
S&
P 5
00
Ove
rall11
Sample: geography / number of companies
Informe 2011 (ingles) 05/12/11 9:51 Página 45
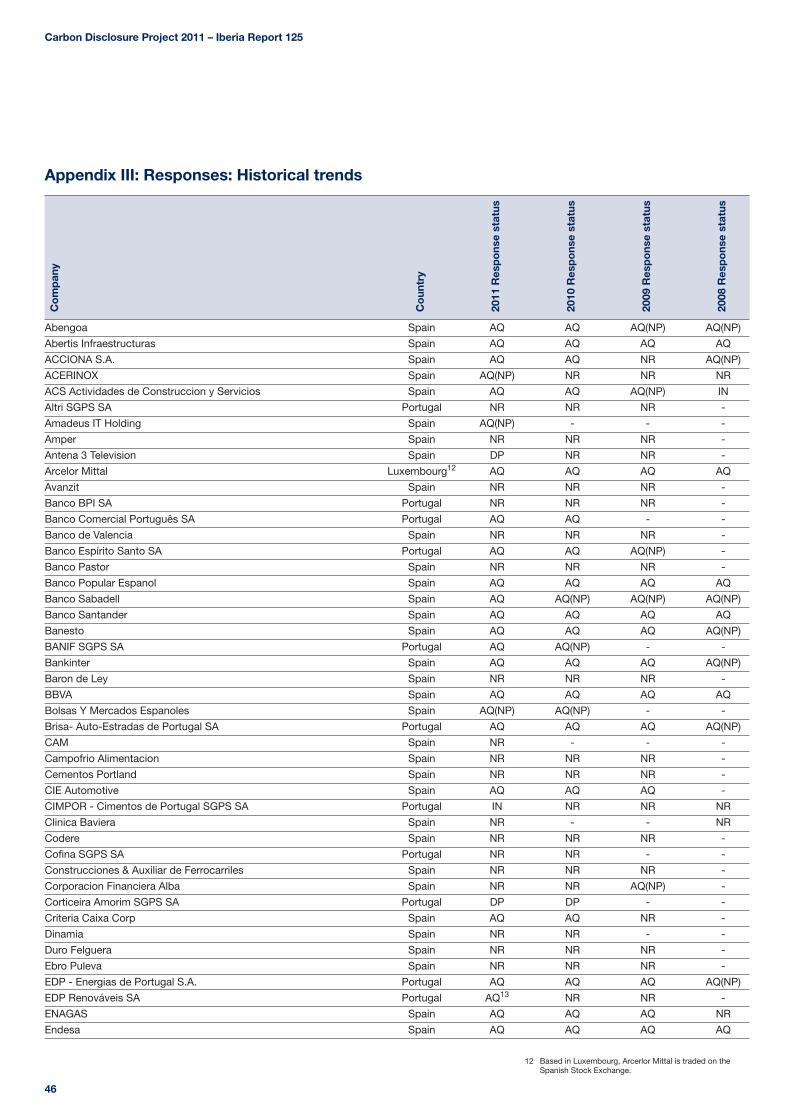
Carbon Disclosure Project 2011 – Iberia Report 125
46
Abengoa Spain AQ AQ AQ(NP) AQ(NP)
Abertis Infraestructuras Spain AQ AQ AQ AQ
ACCIONA S.A. Spain AQ AQ NR AQ(NP)
ACERINOX Spain AQ(NP) NR NR NR
ACS Actividades de Construccion y Servicios Spain AQ AQ AQ(NP) IN
Altri SGPS SA Portugal NR NR NR -
Amadeus IT Holding Spain AQ(NP) - - -
Amper Spain NR NR NR -
Antena 3 Television Spain DP NR NR -
Arcelor Mittal Luxembourg12 AQ AQ AQ AQ
Avanzit Spain NR NR NR -
Banco BPI SA Portugal NR NR NR -
Banco Comercial Português SA Portugal AQ AQ - -
Banco de Valencia Spain NR NR NR -
Banco Espírito Santo SA Portugal AQ AQ AQ(NP) -
Banco Pastor Spain NR NR NR -
Banco Popular Espanol Spain AQ AQ AQ AQ
Banco Sabadell Spain AQ AQ(NP) AQ(NP) AQ(NP)
Banco Santander Spain AQ AQ AQ AQ
Banesto Spain AQ AQ AQ AQ(NP)
BANIF SGPS SA Portugal AQ AQ(NP) - -
Bankinter Spain AQ AQ AQ AQ(NP)
Baron de Ley Spain NR NR NR -
BBVA Spain AQ AQ AQ AQ
Bolsas Y Mercados Espanoles Spain AQ(NP) AQ(NP) - -
Brisa- Auto-Estradas de Portugal SA Portugal AQ AQ AQ AQ(NP)
CAM Spain NR - - -
Campofrio Alimentacion Spain NR NR NR -
Cementos Portland Spain NR NR NR -
CIE Automotive Spain AQ AQ AQ -
CIMPOR - Cimentos de Portugal SGPS SA Portugal IN NR NR NR
Clinica Baviera Spain NR - - NR
Codere Spain NR NR NR -
Cofina SGPS SA Portugal NR NR - -
Construcciones & Auxiliar de Ferrocarriles Spain NR NR NR -
Corporacion Financiera Alba Spain NR NR AQ(NP) -
Corticeira Amorim SGPS SA Portugal DP DP - -
Criteria Caixa Corp Spain AQ AQ NR -
Dinamia Spain NR NR - -
Duro Felguera Spain NR NR NR -
Ebro Puleva Spain NR NR NR -
EDP - Energias de Portugal S.A. Portugal AQ AQ AQ AQ(NP)
EDP Renováveis SA Portugal AQ13 NR NR -
ENAGAS Spain AQ AQ AQ NR
Endesa Spain AQ AQ AQ AQ
Co
untr
y
2011
Res
po
nse
stat
us
2010
Res
po
nse
stat
us
2009
Res
po
nse
stat
us
2008
Res
po
nse
stat
us
Co
mp
any
Appendix III: Responses: Historical trends
12 Based in Luxembourg, Arcerlor Mittal is traded on theSpanish Stock Exchange.
Informe 2011 (ingles) 05/12/11 9:51 Página 46
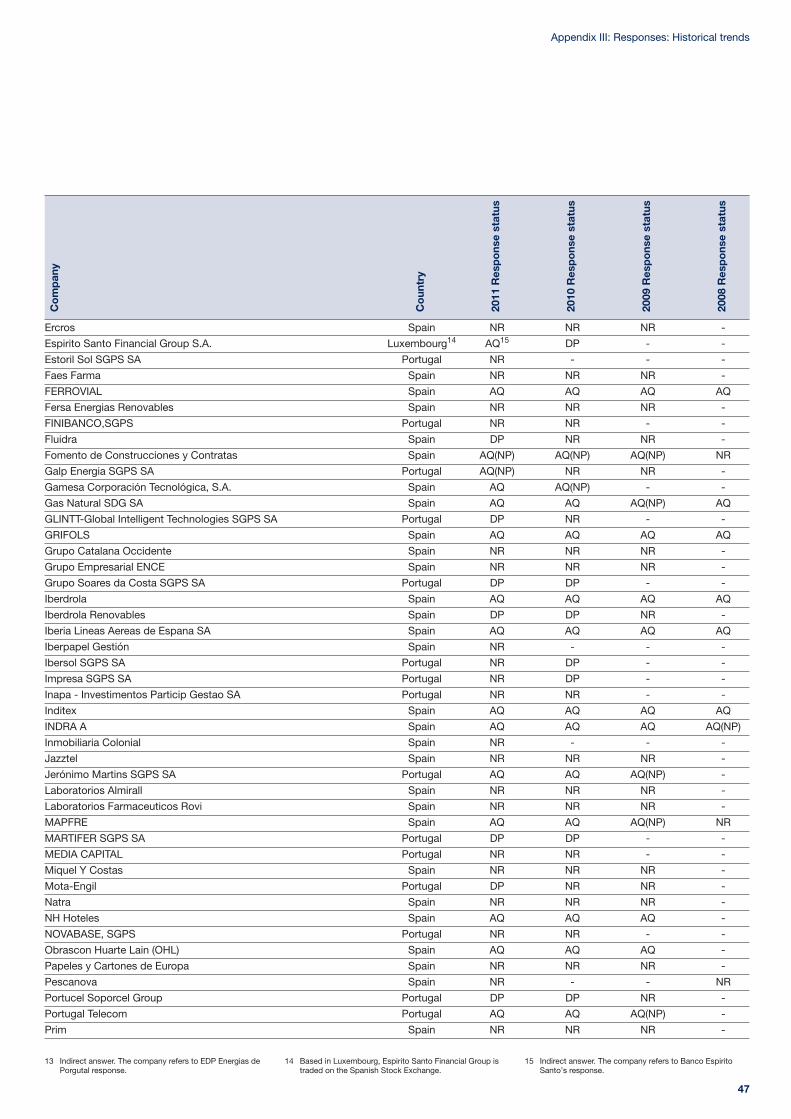
47
Appendix III: Responses: Historical trends
Ercros Spain NR NR NR -
Espirito Santo Financial Group S.A. Luxembourg14 AQ15 DP - -
Estoril Sol SGPS SA Portugal NR - - -
Faes Farma Spain NR NR NR -
FERROVIAL Spain AQ AQ AQ AQ
Fersa Energias Renovables Spain NR NR NR -
FINIBANCO,SGPS Portugal NR NR - -
Fluidra Spain DP NR NR -
Fomento de Construcciones y Contratas Spain AQ(NP) AQ(NP) AQ(NP) NR
Galp Energia SGPS SA Portugal AQ(NP) NR NR -
Gamesa Corporación Tecnológica, S.A. Spain AQ AQ(NP) - -
Gas Natural SDG SA Spain AQ AQ AQ(NP) AQ
GLINTT-Global Intelligent Technologies SGPS SA Portugal DP NR - -
GRIFOLS Spain AQ AQ AQ AQ
Grupo Catalana Occidente Spain NR NR NR -
Grupo Empresarial ENCE Spain NR NR NR -
Grupo Soares da Costa SGPS SA Portugal DP DP - -
Iberdrola Spain AQ AQ AQ AQ
Iberdrola Renovables Spain DP DP NR -
Iberia Lineas Aereas de Espana SA Spain AQ AQ AQ AQ
Iberpapel Gestión Spain NR - - -
Ibersol SGPS SA Portugal NR DP - -
Impresa SGPS SA Portugal NR DP - -
Inapa - Investimentos Particip Gestao SA Portugal NR NR - -
Inditex Spain AQ AQ AQ AQ
INDRA A Spain AQ AQ AQ AQ(NP)
Inmobiliaria Colonial Spain NR - - -
Jazztel Spain NR NR NR -
Jerónimo Martins SGPS SA Portugal AQ AQ AQ(NP) -
Laboratorios Almirall Spain NR NR NR -
Laboratorios Farmaceuticos Rovi Spain NR NR NR -
MAPFRE Spain AQ AQ AQ(NP) NR
MARTIFER SGPS SA Portugal DP DP - -
MEDIA CAPITAL Portugal NR NR - -
Miquel Y Costas Spain NR NR NR -
Mota-Engil Portugal DP NR NR -
Natra Spain NR NR NR -
NH Hoteles Spain AQ AQ AQ -
NOVABASE, SGPS Portugal NR NR - -
Obrascon Huarte Lain (OHL) Spain AQ AQ AQ -
Papeles y Cartones de Europa Spain NR NR NR -
Pescanova Spain NR - - NR
Portucel Soporcel Group Portugal DP DP NR -
Portugal Telecom Portugal AQ AQ AQ(NP) -
Prim Spain NR NR NR -
Co
untr
y
2011
Res
po
nse
stat
us
2010
Res
po
nse
stat
us
2009
Res
po
nse
stat
us
2008
Res
po
nse
stat
us
Co
mp
any
13 Indirect answer. The company refers to EDP Energias dePorgutal response.
14 Based in Luxembourg, Espirito Santo Financial Group istraded on the Spanish Stock Exchange.
15 Indirect answer. The company refers to Banco EspiritoSanto’s response.
Informe 2011 (ingles) 05/12/11 9:51 Página 47
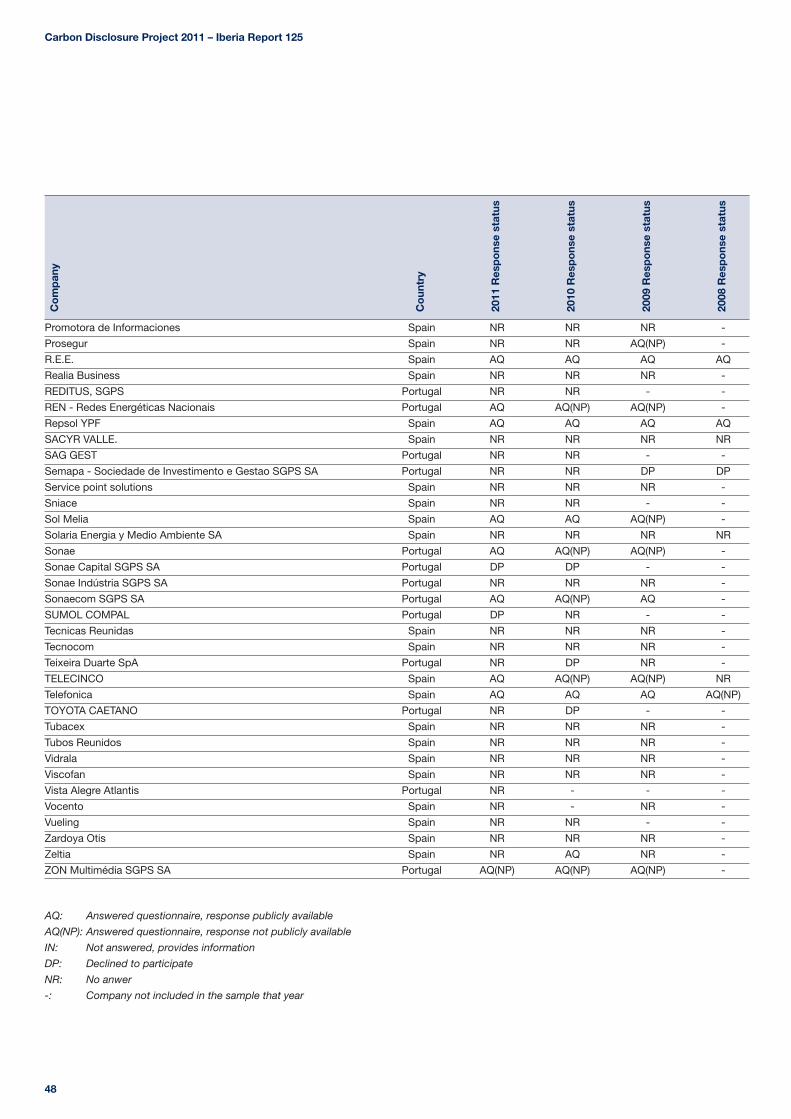
Carbon Disclosure Project 2011 – Iberia Report 125
48
Promotora de Informaciones Spain NR NR NR -
Prosegur Spain NR NR AQ(NP) -
R.E.E. Spain AQ AQ AQ AQ
Realia Business Spain NR NR NR -
REDITUS, SGPS Portugal NR NR - -
REN - Redes Energéticas Nacionais Portugal AQ AQ(NP) AQ(NP) -
Repsol YPF Spain AQ AQ AQ AQ
SACYR VALLE. Spain NR NR NR NR
SAG GEST Portugal NR NR - -
Semapa - Sociedade de Investimento e Gestao SGPS SA Portugal NR NR DP DP
Service point solutions Spain NR NR NR -
Sniace Spain NR NR - -
Sol Melia Spain AQ AQ AQ(NP) -
Solaria Energia y Medio Ambiente SA Spain NR NR NR NR
Sonae Portugal AQ AQ(NP) AQ(NP) -
Sonae Capital SGPS SA Portugal DP DP - -
Sonae Indústria SGPS SA Portugal NR NR NR -
Sonaecom SGPS SA Portugal AQ AQ(NP) AQ -
SUMOL COMPAL Portugal DP NR - -
Tecnicas Reunidas Spain NR NR NR -
Tecnocom Spain NR NR NR -
Teixeira Duarte SpA Portugal NR DP NR -
TELECINCO Spain AQ AQ(NP) AQ(NP) NR
Telefonica Spain AQ AQ AQ AQ(NP)
TOYOTA CAETANO Portugal NR DP - -
Tubacex Spain NR NR NR -
Tubos Reunidos Spain NR NR NR -
Vidrala Spain NR NR NR -
Viscofan Spain NR NR NR -
Vista Alegre Atlantis Portugal NR - - -
Vocento Spain NR - NR -
Vueling Spain NR NR - -
Zardoya Otis Spain NR NR NR -
Zeltia Spain NR AQ NR -
ZON Multimédia SGPS SA Portugal AQ(NP) AQ(NP) AQ(NP) -
Co
untr
y
2011
Res
po
nse
stat
us
2010
Res
po
nse
stat
us
2009
Res
po
nse
stat
us
2008
Res
po
nse
stat
us
Co
mp
any
AQ: Answered questionnaire, response publicly available
AQ(NP): Answered questionnaire, response not publicly available
IN: Not answered, provides information
DP: Declined to participate
NR: No anwer
-: Company not included in the sample that year
Informe 2011 (ingles) 05/12/11 9:51 Página 48
Report writer:
Strategic partners:
Iberia scoring Partner:
Sponsor partner:
Portugal partner:
Sponsor:
Ecología y DesarrolloPza. San Bruno, 950001 Zaragoza
PwCPaseo de la Castellana, 259B28046 Madrid
BBVAPº Castellana, 8128046 Madrid
EuronaturaLargo das Pimenteiras 6A, 1600-576 Lisboa
Collaborators:
TelefónicaRonda de la Comunicación, s/n.28050 Madrid
InditexAvenida de la Diputación, s/n15142 Arteixo (A Coruña)
MAPFRE, S.A.Pº Recoletos, 2528004 Madrid
GHG emissions from this publication have been offset through CeroCO2 projects of emissions reduction and absorption. www.ceroco2.org
Carbon Disclosure Project 2011
This report and all of the responses from public companies are available at www.cdproject.net
The contents of this report may be freely used provided that its source is clearly acknowledged.
Portada 2011 (ingles) 05/12/11 8:34 Página 3
December 2011
Important Notice
The contents of this report may be used by anyone providing acknowledgement is given to Carbon Disclosure Project (CDP). This does not represent a license torepackage or resell any of the data reported to CDP and presented in this report. If you intend to do this, you need to obtain express permission from CDP beforedoing so.
ECODES and CDP prepared the data and analysis in this report based on responses to the CDP 2011 information request. ECODES and CDP do not guarantee theaccuracy or completeness of this information. ECODES and CDP make no representation or warranty, express or implied, and accept no liability concerning the fairness,accuracy, or completeness of the information and opinions contained herein or for any consequences of you or anyone else acting, or refraining to act, in reliance on theinformation contained in this publication or for any decision based on it. You should not act upon the information contained in this publication without obtaining specificprofessional advice. All information and views expressed herein by CDP and/or ECODES are based on their judgment at the time of this report and are subject to changewithout notice due to economic, political, industry and firm-specific factors. Guest commentaries where included in this report reflect the views of their respectiveauthors; their inclusion is not an endorsement of them.
ECODES and CDP and their affiliated member firms or companies, or their respective shareholders, members, partners, principals, directors, officers and/or employees,may have a position in the securities of the companies discussed herein. The securities of the companies mentioned in this document may not be eligible for sale in somestates or countries, nor suitable for all types of investors; their value and the income they produce may fluctuate and/or be adversely affected by exchange rates.
‘Carbon Disclosure Project’ and ‘CDP’ refers to Carbon Disclosure Project, a United Kingdom company limited by guarantee, registered as a United Kingdom charitynumber 1122330.
© 2011 Carbon Disclosure Project & ECODES. All rights reserved.
CDP contacts
Diana GuzmánSouthern Europe [email protected]
Elina FolfeAccount Manager [email protected]
Sue HowellsHead of Global Operations
Daniel TurnerHead of Disclosure
Marcus NortonHead of Investor CDP and CDP Water Disclosure
Frances WayProgram Director
Carbon Disclosure Project40 Bowling Green LaneLondon, EC1R 0NEUnited KingdomTel: +44 (0) 20 7970 5660Fax: +44 (0) 20 7691 [email protected]
Víctor Viñ[email protected]
Aurelio GarcíaResearch [email protected]
Michele [email protected] [email protected] [email protected] [email protected]
Plaza San Bruno, 950001 ZaragozaEspañaTel: + 34 976 298282Fax: +34 976 203092
ECODES contacts
María Luz Castilla Director, Sustainability &Climate Change [email protected]
Pablo [email protected] [email protected] [email protected]
Marga de [email protected] [email protected]
Claudia [email protected] de Llera [email protected]
PwC Spainwww.pwc.es/sostenibilidad
Tel: 902 021 111+34 915 684 400
Torre PwC. Paseo de la Castellana, 259 BMadrid 28046
Avenida Diagonal, 640Barcelona 08017
PwC Portugal www.pwc.com/pt
Tel: +351 213 599 000
Palácio SottomayorRua Sousa Martins 1 -2ºLisbon 1069-316
PwC contacts
Hugo CostaExecutive [email protected]
André [email protected]
[email protected] das Pimenteiras, 6A1600-576 LisboaPortugal
EURONATURA contacts
Portada 2011 (ingles) 05/12/11 8:34 Página 4