cdc’s methodology for measuring indirect …€™s methodology for measuring indirect employment...
TRANSCRIPT
CDC’s methodology for measuring indirect
employment changes
Alice Kehoe*, Rene Kim +, Alex MacGillivray* & Tias
van Moorsel +
* CDC + Steward Redqueen
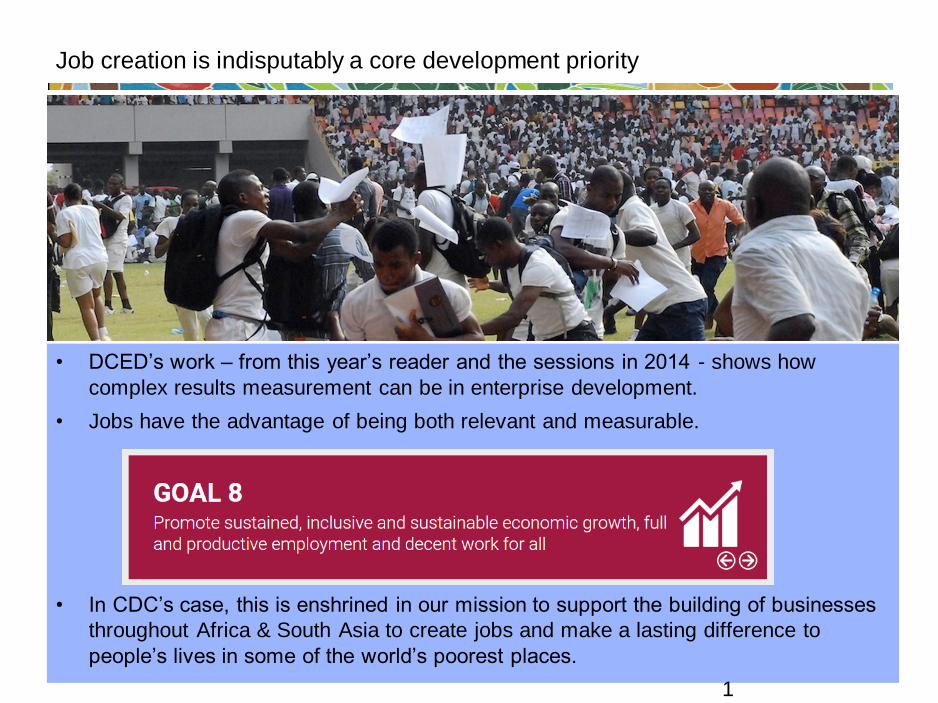
Job creation is indisputably a core development priority
• DCED’s work – from this year’s reader and the sessions in 2014 - shows how
complex results measurement can be in enterprise development.
• Jobs have the advantage of being both relevant and measurable.
• In CDC’s case, this is enshrined in our mission to support the building of businesses
throughout Africa & South Asia to create jobs and make a lasting difference to
people’s lives in some of the world’s poorest places.
1
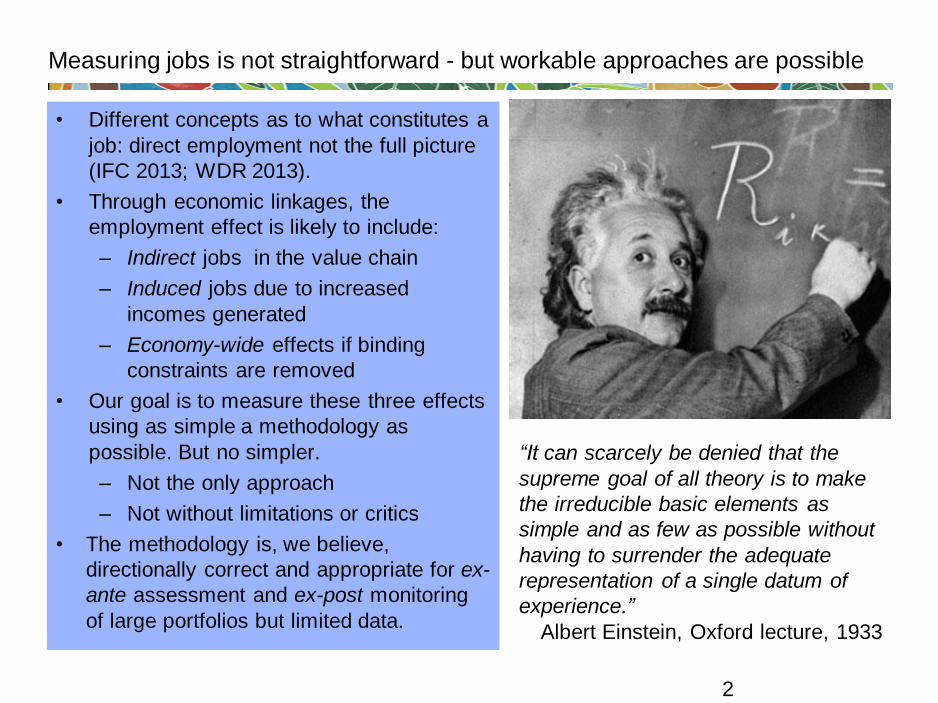
Measuring jobs is not straightforward - but workable approaches are possible
• Different concepts as to what constitutes a
job: direct employment not the full picture
(IFC 2013; WDR 2013).
• Through economic linkages, the
employment effect is likely to include:
– Indirect jobs in the value chain
– Induced jobs due to increased
incomes generated
– Economy-wide effects if binding
constraints are removed
• Our goal is to measure these three effects
using as simple a methodology as
possible. But no simpler.
– Not the only approach
– Not without limitations or critics
• The methodology is, we believe,
directionally correct and appropriate for ex-
ante assessment and ex-post monitoring
of large portfolios but limited data.
2
“It can scarcely be denied that the
supreme goal of all theory is to make
the irreducible basic elements as
simple and as few as possible without
having to surrender the adequate
representation of a single datum of
experience.”
Albert Einstein, Oxford lecture, 1933
3
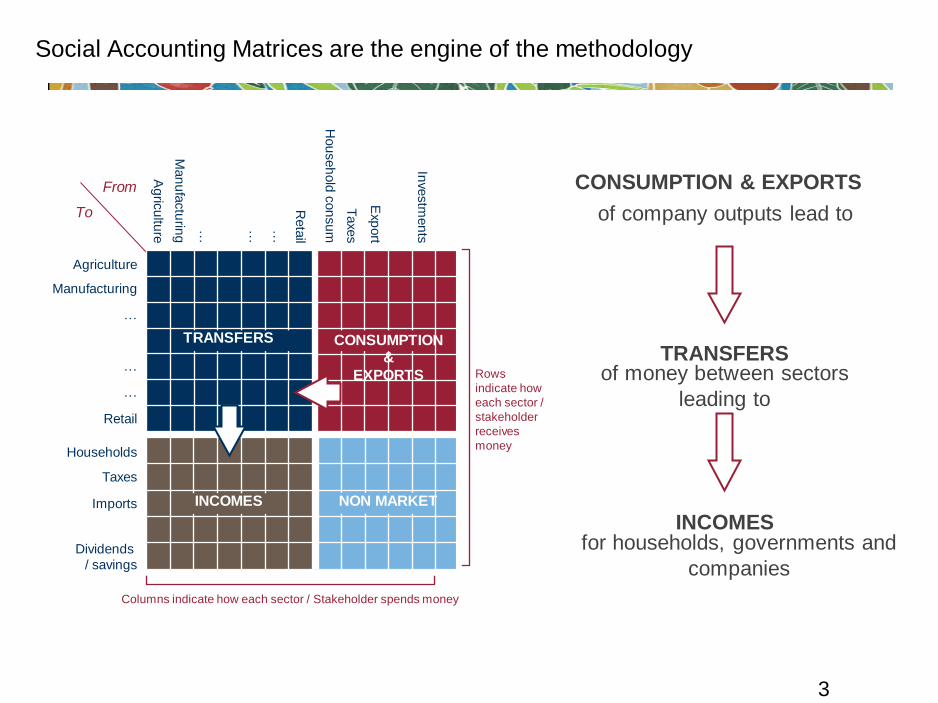
CONSUMPTION & EXPORTS
of company outputs lead to
TRANSFERS of money between sectors
leading to
INCOMES for households, governments and
companies
Social Accounting Matrices are the engine of the methodology
…
…
…
Manufacturing
Agriculture
Retail
Households
Taxes
Imports
Dividends
/ savings
Taxe
s
…
…
…
Man
ufa
ctu
ring
Ag
ricu
lture
Reta
il
Hou
seh
old
con
su
m
Exp
ort
Inve
stm
en
ts
Columns indicate how each sector / Stakeholder spends money
Rows
indicate how
each sector /
stakeholder
receives
money
From
To
INCOMES NON MARKET
TRANSFERS CONSUMPTION &
EXPORTS
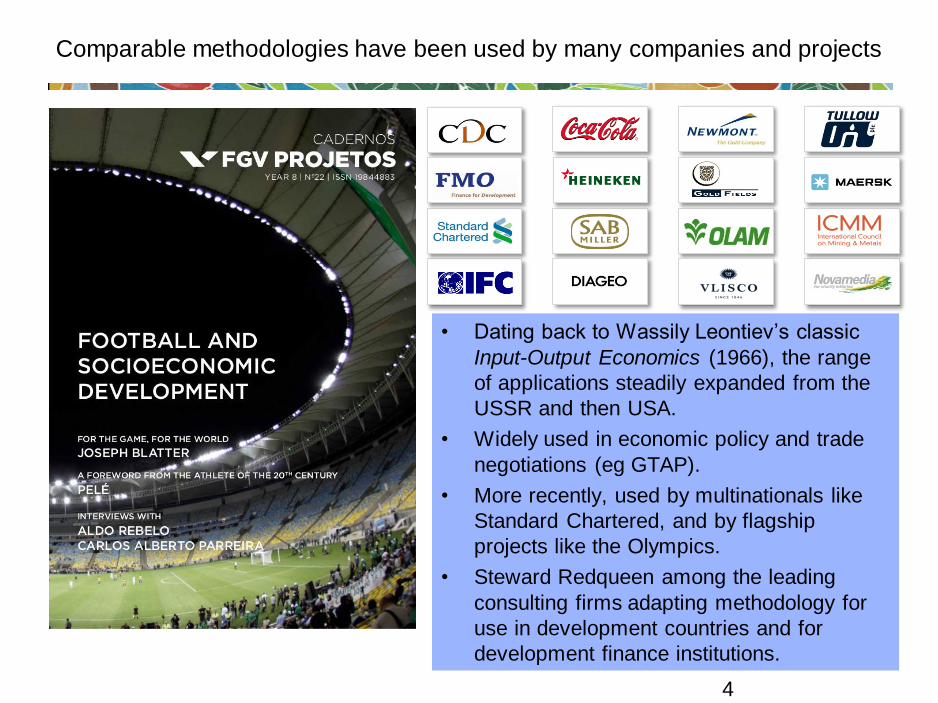
Comparable methodologies have been used by many companies and projects
4
• Dating back to Wassily Leontiev’s classic
Input-Output Economics (1966), the range
of applications steadily expanded from the
USSR and then USA.
• Widely used in economic policy and trade
negotiations (eg GTAP).
• More recently, used by multinationals like
Standard Chartered, and by flagship
projects like the Olympics.
• Steward Redqueen among the leading
consulting firms adapting methodology for
use in development countries and for
development finance institutions.
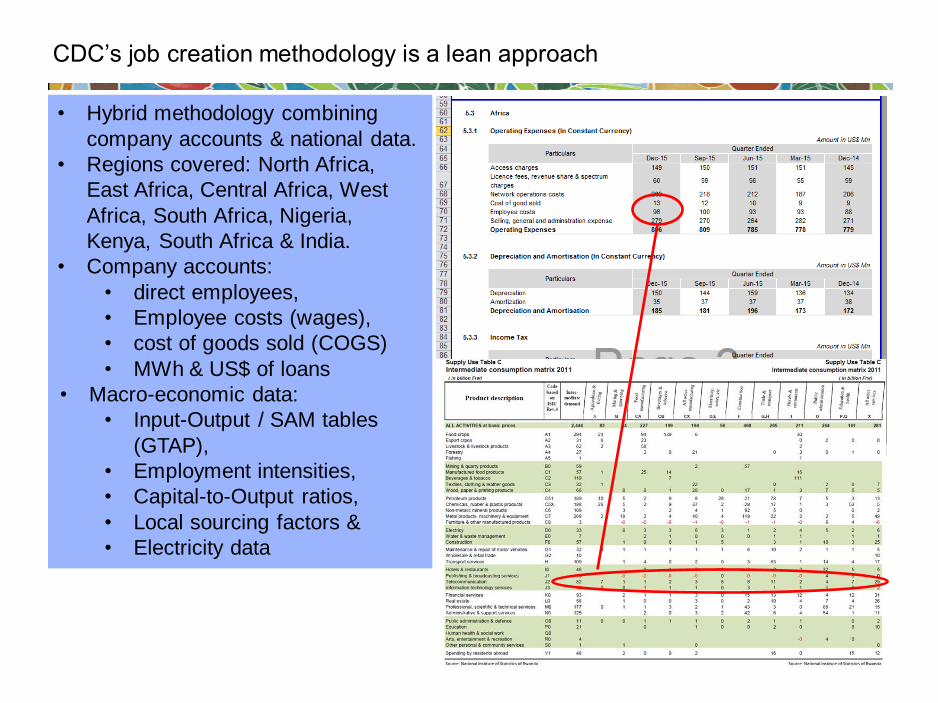
CDC’s job creation methodology is a lean approach
• Hybrid methodology combining
company accounts & national data.
• Regions covered: North Africa,
East Africa, Central Africa, West
Africa, South Africa, Nigeria,
Kenya, South Africa & India.
• Company accounts:
• direct employees,
• Employee costs (wages),
• cost of goods sold (COGS)
• MWh & US$ of loans
• Macro-economic data:
• Input-Output / SAM tables
(GTAP),
• Employment intensities,
• Capital-to-Output ratios,
• Local sourcing factors &
• Electricity data
+
Company annual data
National I/O tables
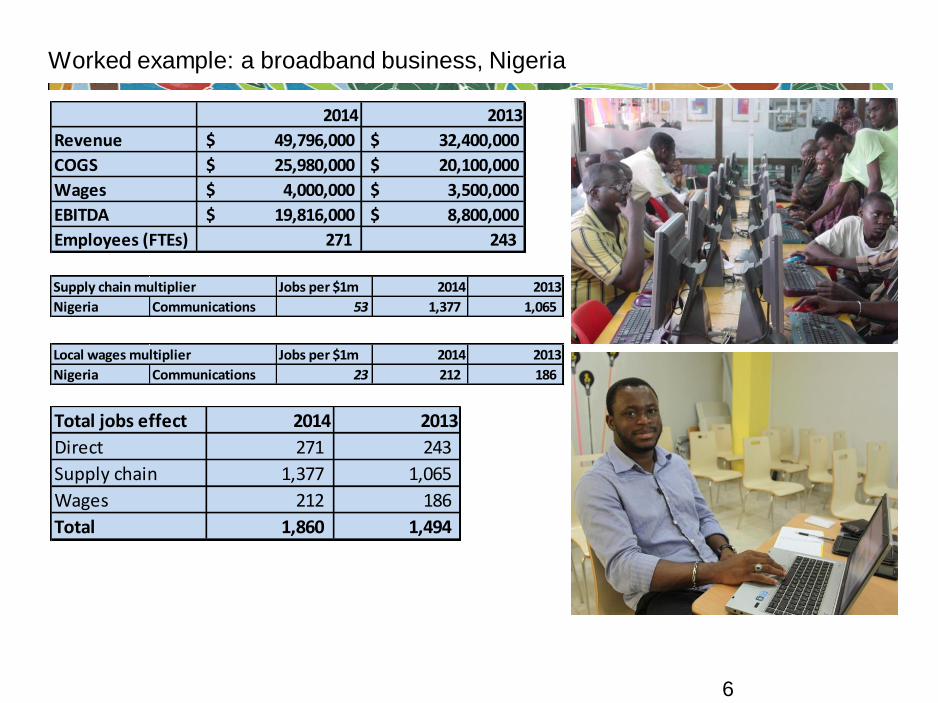
Worked example: a broadband business, Nigeria
6
2014 2013
Revenue 49,796,000$ 32,400,000$
COGS 25,980,000$ 20,100,000$
Wages 4,000,000$ 3,500,000$
EBITDA 19,816,000$ 8,800,000$
Employees (FTEs) 271 243
Supply chain multiplier Jobs per $1m 2014 2013
Nigeria Communications 53 1,377 1,065
Local wages multiplier Jobs per $1m 2014 2013
Nigeria Communications 23 212 186
Total jobs effect 2014 2013
Direct 271 243
Supply chain 1,377 1,065
Wages 212 186
Total 1,860 1,494
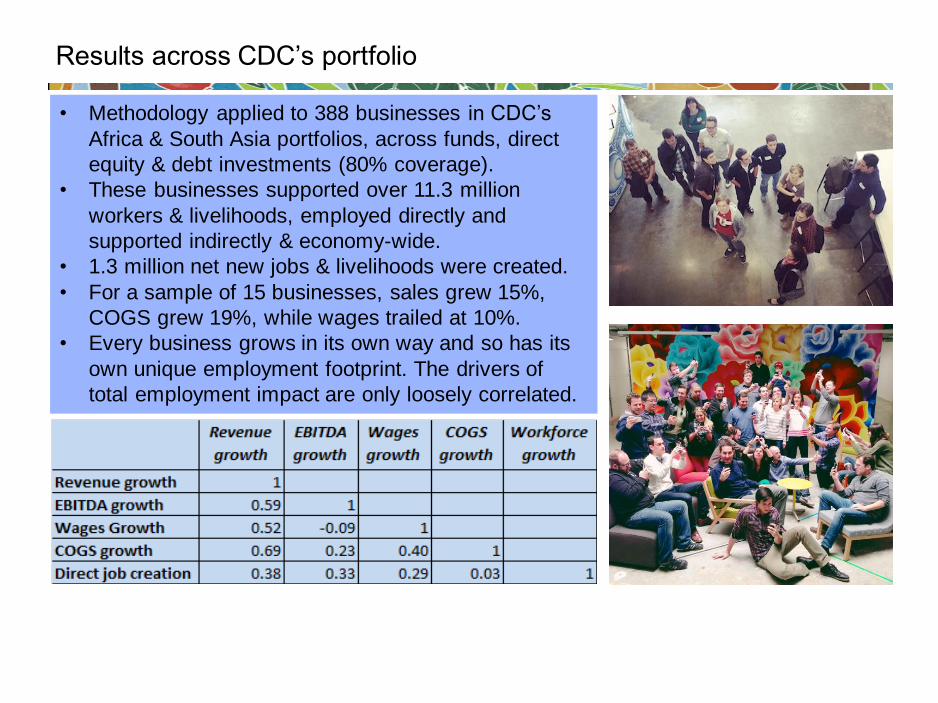
Results across CDC’s portfolio
• Methodology applied to 388 businesses in CDC’s
Africa & South Asia portfolios, across funds, direct
equity & debt investments (80% coverage).
• These businesses supported over 11.3 million
workers & livelihoods, employed directly and
supported indirectly & economy-wide.
• 1.3 million net new jobs & livelihoods were created.
• For a sample of 15 businesses, sales grew 15%,
COGS grew 19%, while wages trailed at 10%.
• Every business grows in its own way and so has its
own unique employment footprint. The drivers of
total employment impact are only loosely correlated.
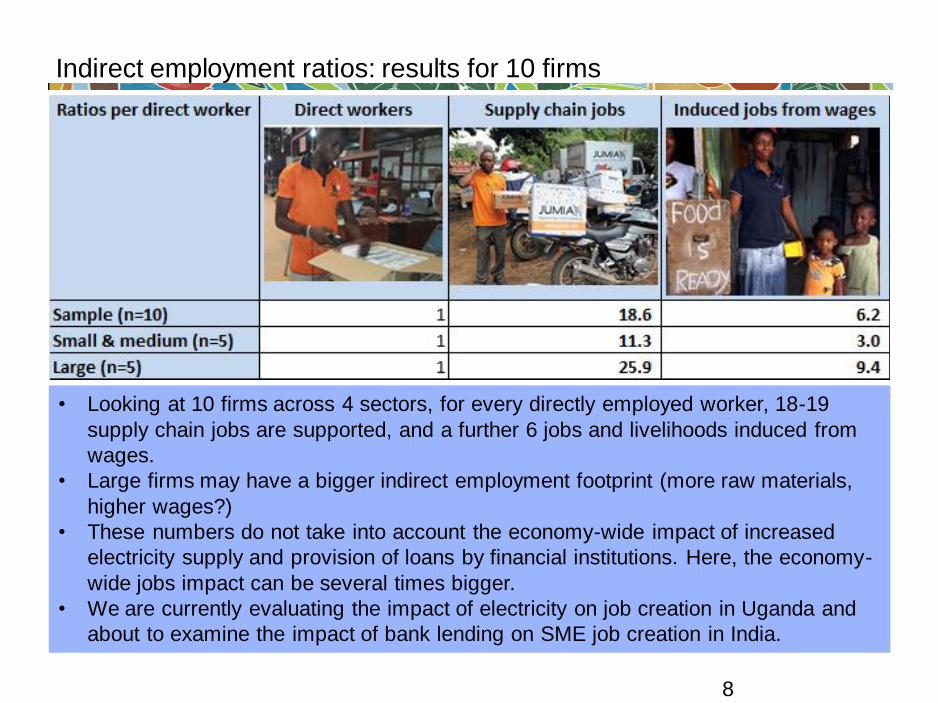
Indirect employment ratios: results for 10 firms
8
• Looking at 10 firms across 4 sectors, for every directly employed worker, 18-19
supply chain jobs are supported, and a further 6 jobs and livelihoods induced from
wages.
• Large firms may have a bigger indirect employment footprint (more raw materials,
higher wages?)
• These numbers do not take into account the economy-wide impact of increased
electricity supply and provision of loans by financial institutions. Here, the economy-
wide jobs impact can be several times bigger.
• We are currently evaluating the impact of electricity on job creation in Uganda and
about to examine the impact of bank lending on SME job creation in India.
Challenges for the 2018 seminar
• Attribution
– Investor’s stake in the business (debt vs
equity)
–Role of management & workers
–Displacement among competitors
• Updating SAMs to GTAP 2011
• Understanding economy-wide elasticities of
electricity and infrastructure to GDP
• Job quality
–Health & safety
–Wages
–Gender & youth breakdown
–bottom 40% of income distribution
• Ex-post validation in field studies
• Consistency with other development partners
using similar approaches
• Ultimately, it’s always about real people’s
livelihoods
9