cd equisearch p pvt ltd - business...
TRANSCRIPT

CD Equisearch P
Equities Derivatives Commoditie
Shriram Transport Finance Company Ltd.
No. of shares (crore) 22.7
Mkt cap (Rs crs) 21502
Current price (Rs)(08/7/2015) 948
Price target (Rs) 1082
52 week H/L (Rs.) 1287/761
Book value (Rs.)(FV. 10) 408
P/BV (16e/17e) 2.1/1.9
P/E (16e/17e) 17.1/14.9
Beta 1.1
EPS Growth ( FY15/16e/17e) -24.3/22.5/14.3
ROE ( FY15/16e /17e) 11.1/12.3/12.6
Daily Volume (avg. weekly) 59750
BSE Code 511218
NSE Code SRTRANSFIN
Bloomberg SHTF IN
Reuters SRTR.BO
Shareholding pattern % Promoters 26.1
MFs / Banks / FIs 4.2
Foreign 51.4
Govt. Holding 0.00
Non-Promoter Corp. 12.1
Total Public 6.2
Total 100.0
As on March 31, 2015
Recommendation
Accumulate
Analyst
Priyanka Somani
Phone: + 91 (33) 4488 0043
E- mail: [email protected]
Figures in Rs crs
Net Interest Income
Non Interest Income
Pre-Provision Profits
Net Profit
EPS
EPS growth (%)
Pvt Ltd
ities Distribution of Mutual Funds Dis
Ltd.
14.3
6
SRTRANSFIN
FY13 FY14 FY15
3719.38 3751.54 4193.44
237.64 526.44 311.52
3057.62 3216.46 3304.93
1463.43 1357.94 1028.44
64.50 59.85 45.33
11.5 -7.2 -24.3
Company Background
Shriram Transport Finance Company Ltd
NBFC with strong competitive advantage in pre
vehicle (CV) financing (especially 5-12 year old vehicles).
Quarterly Highlights
• On a consolidated basis, STFC reported a total income of Rs 2421 crores
in Q4 FY15 versus Rs 2150 crores in Q4 FY14 which is a growth of
12.6%.The finance cost for the quarter grew by 15
crores (Rs 1083.35 in Q4 FY14). The net profit for the quarter declined
by 73.3% to Rs 84.23 crore from Rs 314.89
equipment finance subsidiary.
• On a standalone basis, STFC reported a total income of Rs 2310.69
crores in Q4 FY15 versus Rs 2005.37 crores in Q4 F
growth of 15.23%. The finance cost for the quarter grew by 16.75% to Rs
1184.30 crores (Rs 1014.38 in Q4 FY14).The net profit for the quarter
increased by 7.4% to Rs 316.73 crore from Rs 294.96 crore in Q4 FY14.
• Shriram Equipment Finance Company Limited, a subsidiary of
reported a net loss of Rs 237.13 crores in Q4 FY15 versus a net profit of
Rs 16.48 crores in Q4 FY14 as a result of higher provisioning for NPAs.
The assets under management declined from Rs 3418.39 crores in Q4
FY14 to Rs 2998.58 crores in Q4 FY15 (a de growth
• We believe that the commercial vehicle cycle has bottomed out and
second half of FY16 will witness a pickup in demand. We have revised
our EPS estimates of FY16 from Rs 68.72 to Rs 55.5 (refer to o
previous report dated Jan 7, 2015). Our FY17 EPS target is projected at
Rs 63.43.
• The stock currently trades at 2.1x FY16e book v
and 1.9x FY17e book value (14.9x FY17e
that the stock is reasonably valued, though asset quality concerns with
respect to equipment finance business remain
‘Accumulate’ with a target of Rs 1082 (previous target 1237
been achieved subsequent to our report dated Jan 7, 2015) based on 2.2
FY17e BV (17x FY17e EPS), within a time horiz
July 09, 2015
istribution of Life Insurance
FY16e FY17e
4440.25 5085.22
458.70 500.00
3615.64 4128.66
1259.43 1439.18
55.50 63.43
22.5 14.3
(STFC) is one of India’s leading
NBFC with strong competitive advantage in pre-owned commercial
12 year old vehicles).
STFC reported a total income of Rs 2421 crores
in Q4 FY15 versus Rs 2150 crores in Q4 FY14 which is a growth of
The finance cost for the quarter grew by 15.6% to Rs 1252.80
crores (Rs 1083.35 in Q4 FY14). The net profit for the quarter declined
Rs 84.23 crore from Rs 314.89 in Q4 FY14 due to the loss in
On a standalone basis, STFC reported a total income of Rs 2310.69
crores in Q4 FY15 versus Rs 2005.37 crores in Q4 FY14 which is a
ce cost for the quarter grew by 16.75% to Rs
1184.30 crores (Rs 1014.38 in Q4 FY14).The net profit for the quarter
increased by 7.4% to Rs 316.73 crore from Rs 294.96 crore in Q4 FY14.
Shriram Equipment Finance Company Limited, a subsidiary of STFC,
reported a net loss of Rs 237.13 crores in Q4 FY15 versus a net profit of
Rs 16.48 crores in Q4 FY14 as a result of higher provisioning for NPAs.
The assets under management declined from Rs 3418.39 crores in Q4
(a de growth of 12.3%).
We believe that the commercial vehicle cycle has bottomed out and
up in demand. We have revised
from Rs 68.72 to Rs 55.5 (refer to our
, 2015). Our FY17 EPS target is projected at
x FY16e book value (17.1x FY16e EPS)
Y17e EPS). At current levels, we feel
valued, though asset quality concerns with
uipment finance business remain. We recommend
(previous target 1237, which had
been achieved subsequent to our report dated Jan 7, 2015) based on 2.2x
e EPS), within a time horizon of 9-12 months.
CD Equisearch Pvt Ltd
Equities Derivatives Commoditie
0
10000
20000
30000
40000
50000
60000
70000
80000
90000
FY12 FY13 FY14 FY15 FY16e
Source: CD Equisearch , STFC
Recommendation
Financials
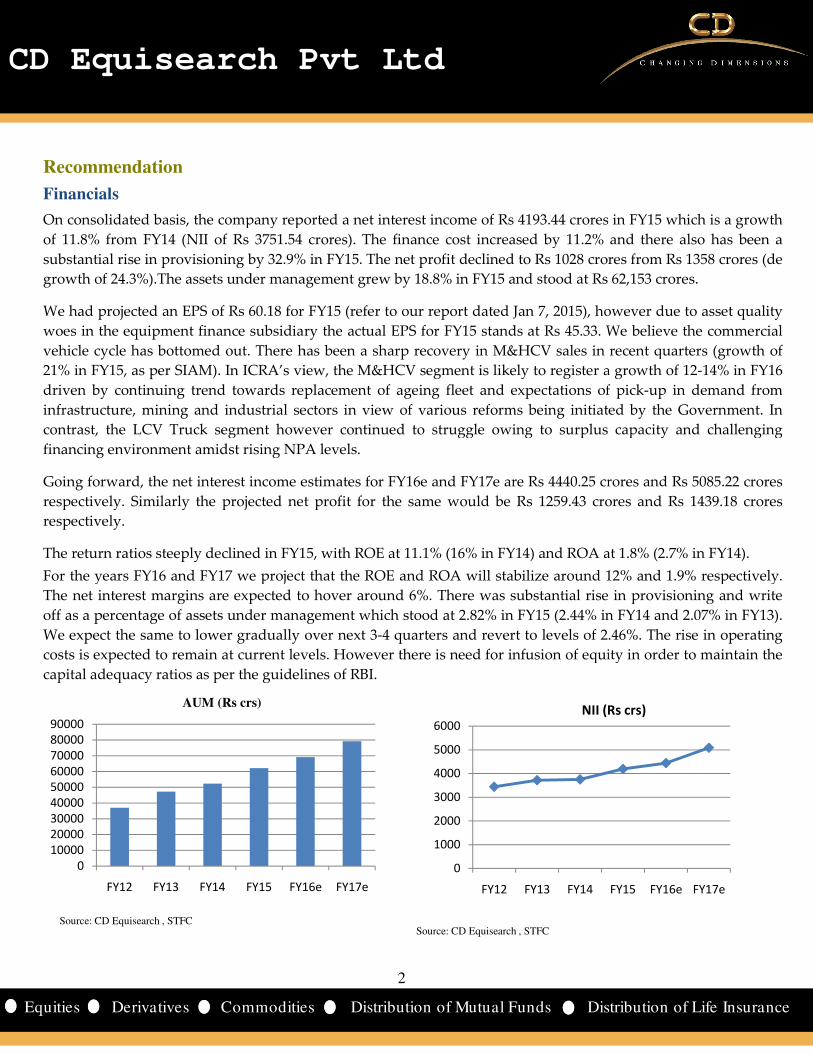
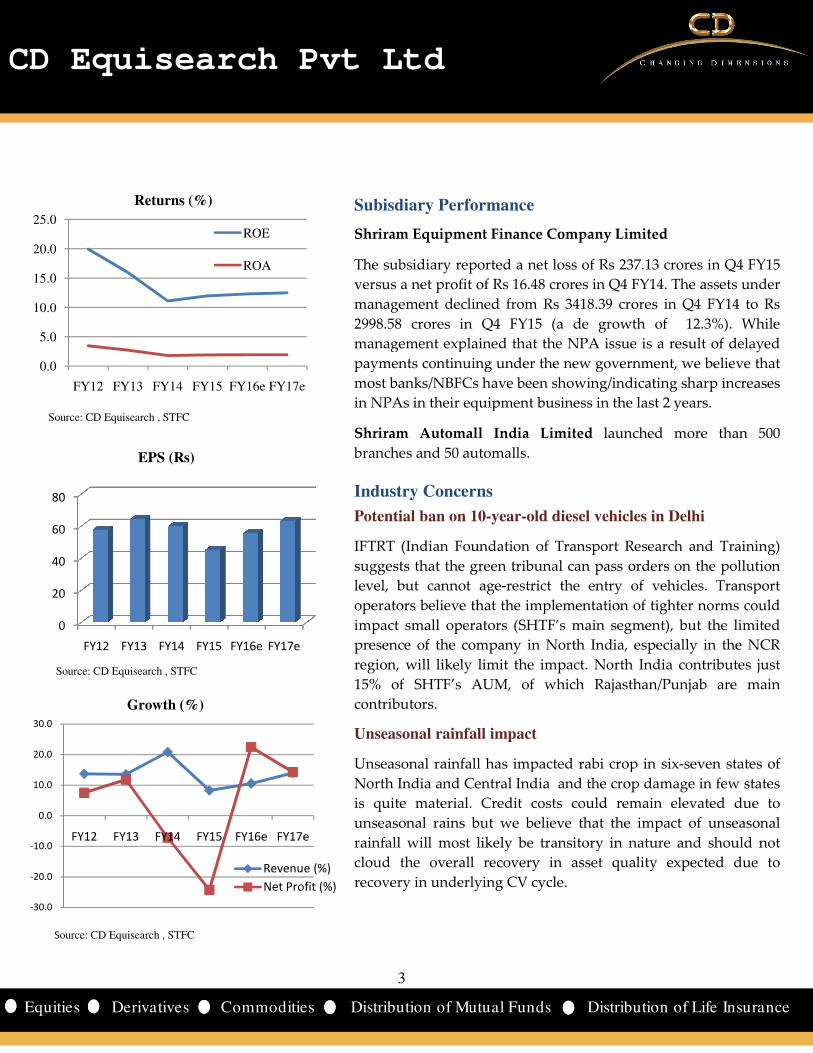
On consolidated basis, the company reported a net interest income of Rs 4193.44 crores in F
of 11.8% from FY14 (NII of Rs 3751.54 crores).
substantial rise in provisioning by 32.9% i
growth of 24.3%).The assets under management grew by 18.8
We had projected an EPS of Rs 60.18 for FY15 (refer to our report dated Jan
woes in the equipment finance subsidiary the actual EPS for FY15 stands at Rs 45.33. We believe the commercial
vehicle cycle has bottomed out. There has been a
21% in FY15, as per SIAM). In ICRA’s view, the M&HCV segment is likely to regi
driven by continuing trend towards replacement of ageing fleet and expectations of pick
infrastructure, mining and industrial sectors in view of various reforms being initiated by the Government. In
contrast, the LCV Truck segment however continued to struggle owing to surplus capacity and challenging
financing environment amidst rising NPA levels.
Going forward, the net interest income estimates for FY16e and FY17e are Rs 4440.25 crores and Rs 5085.22 crores
respectively. Similarly the projected net profit for the same would be Rs 1259.43 crores and Rs 1439.18 crores
respectively.
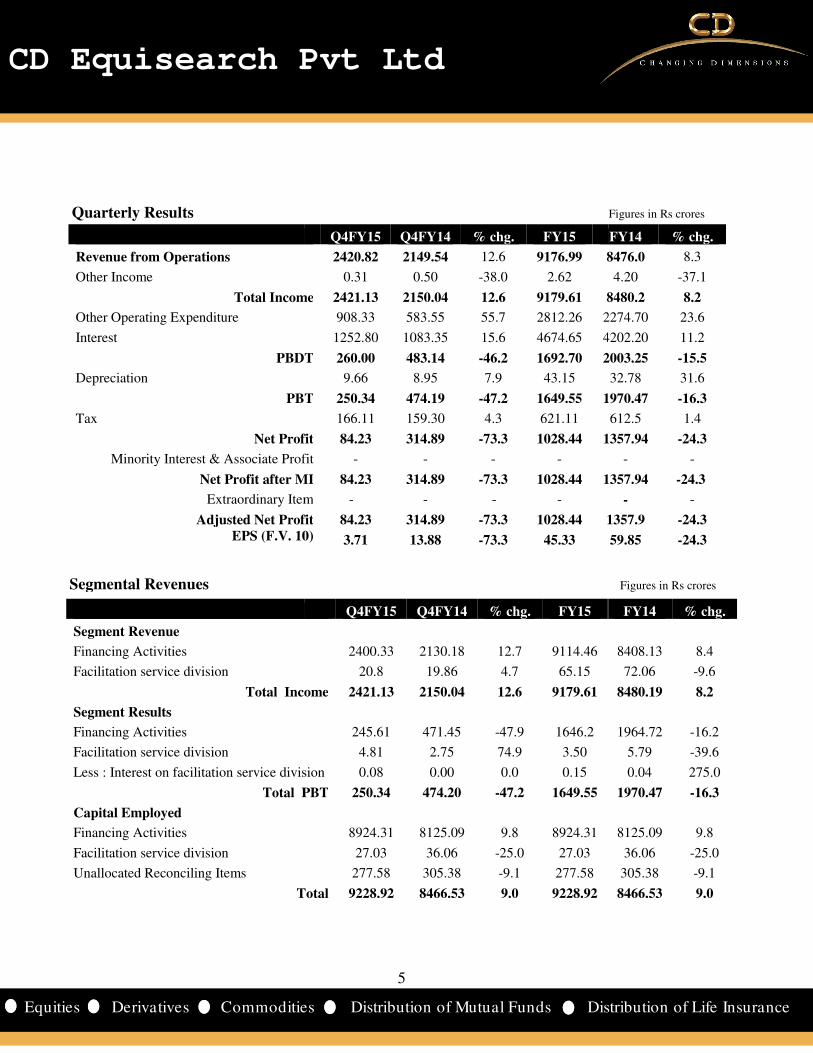
The return ratios steeply declined in FY15,
For the years FY16 and FY17 we project that the ROE and ROA will stabilize around 12% and 1.9% respectively.
The net interest margins are expected to hover around 6%. There was substantial ris
off as a percentage of assets under management which stood at 2.82% in FY15 (2.44% in FY14 and 2.07% in FY13).
We expect the same to lower gradually over next 3
costs is expected to remain at current levels. However there is need for infusion of equity in order to maintain the
capital adequacy ratios as per the guidelines of RBI.
AUM (Rs crs)
2
CD Equisearch Pvt Ltd
ities Distribution of Mutual Funds Dist
FY16e FY17e
, the company reported a net interest income of Rs 4193.44 crores in F
.54 crores). The finance cost increased by 11.2% and there also has been a
32.9% in FY15. The net profit declined to Rs 1028 crores from Rs 1358 crores (de
sets under management grew by 18.8% in FY15 and stood at Rs
We had projected an EPS of Rs 60.18 for FY15 (refer to our report dated Jan 7, 2015), however due to asset quality
woes in the equipment finance subsidiary the actual EPS for FY15 stands at Rs 45.33. We believe the commercial
here has been a sharp recovery in M&HCV sales in recent quarters
. In ICRA’s view, the M&HCV segment is likely to register a growth of 12
driven by continuing trend towards replacement of ageing fleet and expectations of pick
sectors in view of various reforms being initiated by the Government. In
contrast, the LCV Truck segment however continued to struggle owing to surplus capacity and challenging
rising NPA levels.
est income estimates for FY16e and FY17e are Rs 4440.25 crores and Rs 5085.22 crores
respectively. Similarly the projected net profit for the same would be Rs 1259.43 crores and Rs 1439.18 crores
The return ratios steeply declined in FY15, with ROE at 11.1% (16% in FY14) and ROA at 1.8% (2.7% in FY14).
For the years FY16 and FY17 we project that the ROE and ROA will stabilize around 12% and 1.9% respectively.
The net interest margins are expected to hover around 6%. There was substantial rise in provisioning and write
under management which stood at 2.82% in FY15 (2.44% in FY14 and 2.07% in FY13).
We expect the same to lower gradually over next 3-4 quarters and revert to levels of 2.46%. The
expected to remain at current levels. However there is need for infusion of equity in order to maintain the
capital adequacy ratios as per the guidelines of RBI.
0
1000
2000
3000
4000
5000
6000
FY12 FY13 FY14
Source: CD Equisearch , STFC
NII (Rs
2
CD Equisearch Pvt Ltd
istribution of Life Insurance
, the company reported a net interest income of Rs 4193.44 crores in FY15 which is a growth
The finance cost increased by 11.2% and there also has been a
n FY15. The net profit declined to Rs 1028 crores from Rs 1358 crores (de
% in FY15 and stood at Rs 62,153 crores.
7, 2015), however due to asset quality
woes in the equipment finance subsidiary the actual EPS for FY15 stands at Rs 45.33. We believe the commercial
sales in recent quarters (growth of
ster a growth of 12-14% in FY16
driven by continuing trend towards replacement of ageing fleet and expectations of pick-up in demand from
sectors in view of various reforms being initiated by the Government. In
contrast, the LCV Truck segment however continued to struggle owing to surplus capacity and challenging
est income estimates for FY16e and FY17e are Rs 4440.25 crores and Rs 5085.22 crores
respectively. Similarly the projected net profit for the same would be Rs 1259.43 crores and Rs 1439.18 crores
with ROE at 11.1% (16% in FY14) and ROA at 1.8% (2.7% in FY14).
For the years FY16 and FY17 we project that the ROE and ROA will stabilize around 12% and 1.9% respectively.
e in provisioning and write
under management which stood at 2.82% in FY15 (2.44% in FY14 and 2.07% in FY13).
4 quarters and revert to levels of 2.46%. The rise in operating
expected to remain at current levels. However there is need for infusion of equity in order to maintain the
FY15 FY16e FY17e
NII (Rs crs)
CD Equisearch Pvt Ltd
Equities Derivatives Commoditie
0.0
5.0
10.0
15.0
20.0
25.0
FY12 FY13 FY14 FY15 FY16e FY17e
ROE
ROA
Source: CD Equisearch , STFC
Returns (%)
0
20
40
60
80
FY12 FY13 FY14 FY15 FY16e FY17e
Source: CD Equisearch , STFC
-30.0
-20.0
-10.0
0.0
10.0
20.0
30.0
FY12 FY13 FY14 FY15 FY16e FY17e
Revenue (%)
Net Profit (%)
Source: CD Equisearch , STFC
EPS (Rs)
Growth (%)
3
CD Equisearch Pvt Ltd
ities Distribution of Mutual Funds Dist
FY17e
FY17e
Revenue (%)
Net Profit (%)
Subisdiary Performance
Shriram Equipment Finance Company Limited
The subsidiary reported a net loss of Rs 237.13 crores in Q4
versus a net profit of Rs 16.48 crores in Q4 FY14. The assets
management declined from Rs 3418.39 crores in Q4 FY14 to
2998.58 crores in Q4 FY15 (a de growth of 12.3%).
management explained that the NPA i
payments continuing under the new government, we believe that
most banks/NBFCs have been showing/indicating sharp increases
in NPAs in their equipment business in the last 2 years.
Shriram Automall India Limited launched more t
branches and 50 automalls.
Industry Concerns
Potential ban on 10-year-old diesel vehicles in Delhi
IFTRT (Indian Foundation of Transport Research and Training)
suggests that the green tribunal can pass orders on
level, but cannot age-restrict the entry of vehicles. Transport
operators believe that the implementatio
impact small operators (SHTF’s main segment),
presence of the company in North India, especially in the NC
region, will likely limit the impact. North India contributes just
15% of SHTF’s AUM, of which Rajasthan/Punjab are main
contributors.
Unseasonal rainfall impact
Unseasonal rainfall has impacted rabi crop in six
North India and Central India and the c
is quite material. Credit costs could remain
unseasonal rains but we believe that the impact of
rainfall will most likely be transitory in nature a
cloud the overall recovery in asset quality expec
recovery in underlying CV cycle.
3
CD Equisearch Pvt Ltd
istribution of Life Insurance
Shriram Equipment Finance Company Limited
loss of Rs 237.13 crores in Q4 FY15
versus a net profit of Rs 16.48 crores in Q4 FY14. The assets under
Rs 3418.39 crores in Q4 FY14 to Rs
a de growth of 12.3%). While
management explained that the NPA issue is a result of delayed
payments continuing under the new government, we believe that
most banks/NBFCs have been showing/indicating sharp increases
in NPAs in their equipment business in the last 2 years.
launched more than 500
old diesel vehicles in Delhi
(Indian Foundation of Transport Research and Training)
een tribunal can pass orders on the pollution
he entry of vehicles. Transport
operators believe that the implementation of tighter norms could
small operators (SHTF’s main segment), but the limited
company in North India, especially in the NCR
. North India contributes just
Rajasthan/Punjab are main
Unseasonal rainfall has impacted rabi crop in six-seven states of
and the crop damage in few states
rial. Credit costs could remain elevated due to
t we believe that the impact of unseasonal
likely be transitory in nature and should not
sset quality expected due to

CD Equisearch Pvt Ltd
Equities Derivatives Commoditie
Valuations
The poor show of results (due to higher NPA
correction in the price of the stock post Q4 FY15
has already got on the path of recovery.
achievable. Asset under management is expected to touch
respectively in the years FY16 and FY17. The upgrade in credit ratings
the funding costs substantially, going forward.
Instruments/Facility
Long Term Bank Facilities
Non-Convertible Debentures
Subordinated Debentures
Fixed Deposits Programme
The company has announced amalgamation of
itself. We believe that the asset quality concerns in the same is expected to persist over next 2
led us to lower our financial targets with reference to our previous
income target for the year FY16 is lowered from Rs 4590.25 to Rs 4440.25
from Rs 68.72 to Rs 55.5 on account of higher provisioning and contingency though the pre pro
has not changed substantially (previous target Rs 3765 crore and current target Rs 3615.64 crore for FY16).
The stock currently trades at 2.1x FY16e book
At current levels, we feel that the stock is reasonably
equipment finance business remain. We recommend ‘Accumulate’ with
(17x FY17e EPS), within a time horizon of 9
Cross Sectional Analysis
Asset Financing NBFCs Equity*
M&M Financial Services 114
Sundaram Finance 111
Cholamandalam Inv 144
Shriram Transport Fin. 227
Source: STFC, CD Equisearch
*Rs in crores, the companies in the matrix are not directly comparable as their loan book/asset under management
4
CD Equisearch Pvt Ltd
ities Distribution of Mutual Funds Dist
oor show of results (due to higher NPAs in the equipment finance subsidiary) in Q4
Q4 FY15 results .The commercial vehicle cycle we feel has bottomed out and
We feel that AUM growth of 11.2% for FY16e and 14.6
achievable. Asset under management is expected to touch Rs 70000 (approx) crore and Rs 80000 crore
respectively in the years FY16 and FY17. The upgrade in credit ratings by CRISIL in July 2015
going forward.
Upgraded Rating Previous Rating
CRISIL AA+/Stable CRISIL AA/Positive
CRISIL AA+/Stable CRISIL AA/Positive
CRISIL AA+/Stable CRISIL AA/Positive
FAAA/Stable FAA+/Positive
announced amalgamation of its equipment finance subsidiary (which is wholly owned by it) with
itself. We believe that the asset quality concerns in the same is expected to persist over next 2
led us to lower our financial targets with reference to our previous report (dated January 7, 2015). The net interest
d from Rs 4590.25 to Rs 4440.25. We have lowered the EPS target of FY16
from Rs 68.72 to Rs 55.5 on account of higher provisioning and contingency though the pre pro
has not changed substantially (previous target Rs 3765 crore and current target Rs 3615.64 crore for FY16).
x FY16e book value (17.1x FY16e EPS) and 1.9 x FY17e book value (14.9x FY17e
we feel that the stock is reasonably valued, though asset quality concerns with respect to
We recommend ‘Accumulate’ with a target of Rs 1082 based on 2.2x FY17 BV
(17x FY17e EPS), within a time horizon of 9-12 months.
FV CMP Mcap* IO* ROE(%)
2 280 15925 6061 15.3
10 1568 17420 4294 15.3
10 696 10005 3715 14.0
10 948 21502 9180 11.1
, the companies in the matrix are not directly comparable as their loan book/asset under management weights to various sectors differ.
4
CD Equisearch Pvt Ltd
istribution of Life Insurance
FY15 has caused adequate
The commercial vehicle cycle we feel has bottomed out and
We feel that AUM growth of 11.2% for FY16e and 14.6% for FY17e is
crore and Rs 80000 crore (approx)
by CRISIL in July 2015 is expected to lower
Previous Rating
CRISIL AA/Positive
CRISIL AA/Positive
CRISIL AA/Positive
FAA+/Positive
its equipment finance subsidiary (which is wholly owned by it) with
itself. We believe that the asset quality concerns in the same is expected to persist over next 2-3 quarters which has
report (dated January 7, 2015). The net interest
. We have lowered the EPS target of FY16
from Rs 68.72 to Rs 55.5 on account of higher provisioning and contingency though the pre provision profit target
has not changed substantially (previous target Rs 3765 crore and current target Rs 3615.64 crore for FY16).
FY17e book value (14.9x FY17e EPS).
valued, though asset quality concerns with respect to
a target of Rs 1082 based on 2.2x FY17 BV
ROE(%) P/BV P/E
15.3 2.7 17.5
15.3 4.6 30.3
14.0 3.2 22.5
11.1 2.3 20.9
weights to various sectors differ.
CD Equisearch Pvt Ltd
Equities Derivatives Commoditie
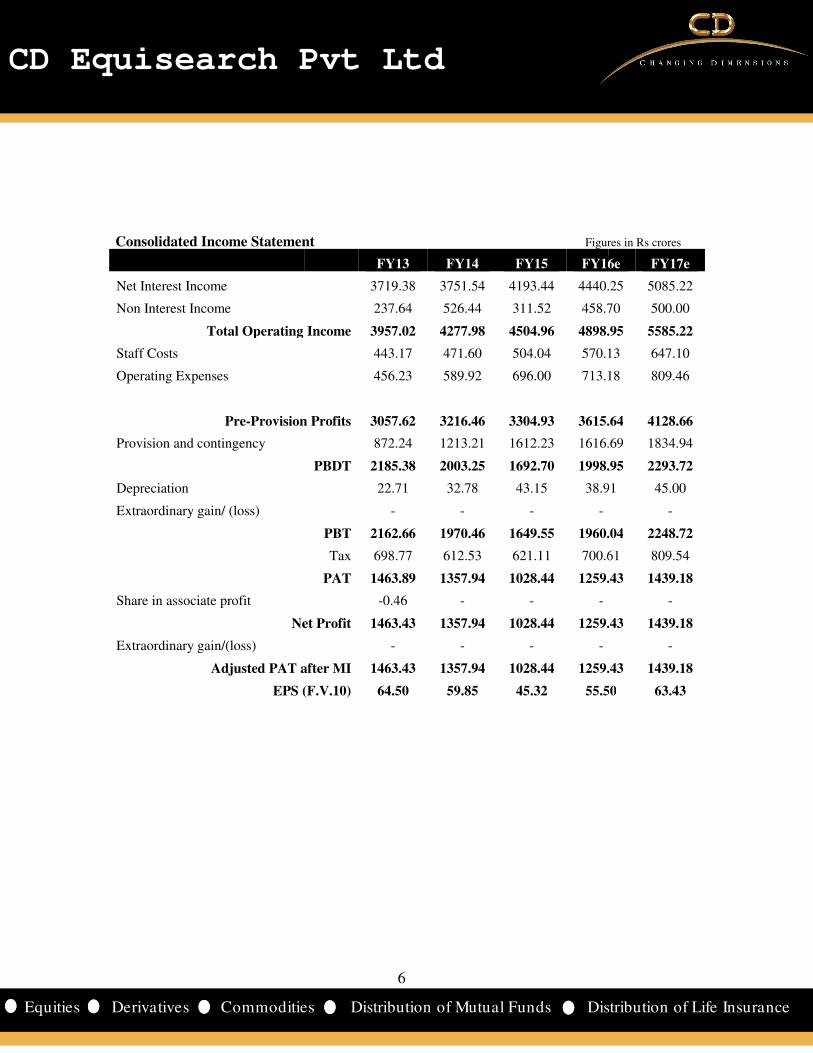
Quarterly Results
Segment Revenue
Financing Activities
Facilitation service division
Total Income
Segment Results
Financing Activities
Facilitation service division
Less : Interest on facilitation service division
Total PBT
Capital Employed
Financing Activities
Facilitation service division
Unallocated Reconciling Items
Total
Segmental Revenues
Revenue from Operations
Other Income
Total Income
Other Operating Expenditure
Interest
PBDT
Depreciation
PBT
Tax
Net Profit
Minority Interest & Associate Profit
Net Profit after MI
Extraordinary Item
Adjusted Net Profit
EPS (F.V. 10)
5
CD Equisearch Pvt Ltd
ities Distribution of Mutual Funds Dist
Q4FY15 Q4FY14 % chg. FY15
2400.33 2130.18 12.7 9114.46
20.8 19.86 4.7 65.15
Total Income 2421.13 2150.04 12.6 9179.61
245.61 471.45 -47.9 1646.2
4.81 2.75 74.9 3.50
division 0.08 0.00 0.0 0.15
Total PBT 250.34 474.20 -47.2 1649.55
8924.31 8125.09 9.8 8924.31
27.03 36.06 -25.0 27.03
277.58 305.38 -9.1 277.58
Total 9228.92 8466.53 9.0 9228.92
Q4FY15 Q4FY14 % chg. FY15
2420.82 2149.54 12.6 9176.99 8476.0
0.31 0.50 -38.0 2.62
Total Income 2421.13 2150.04 12.6 9179.61 8480.2
908.33 583.55 55.7 2812.26 2274.70
1252.80 1083.35 15.6 4674.65 4202.20
PBDT 260.00 483.14 -46.2 1692.70 2003.25
9.66 8.95 7.9 43.15
PBT 250.34 474.19 -47.2 1649.55 1970.47
166.11 159.30 4.3 621.11
Net Profit 84.23 314.89 -73.3 1028.44 1357.94
Minority Interest & Associate Profit - - - -
Net Profit after MI 84.23 314.89 -73.3 1028.44 1357.94
Extraordinary Item - - - -
Adjusted Net Profit 84.23 314.89 -73.3 1028.44 1357.9
EPS (F.V. 10) 3.71 13.88 -73.3 45.33
5
CD Equisearch Pvt Ltd
istribution of Life Insurance
Figures in Rs crores
FY14 % chg.
8408.13 8.4
72.06 -9.6
8480.19 8.2
1964.72 -16.2
5.79 -39.6
0.04 275.0
1970.47 -16.3
8125.09 9.8
36.06 -25.0
305.38 -9.1
8466.53 9.0
Figures in Rs crores
FY14 % chg.
8476.0 8.3
4.20 -37.1
8480.2 8.2
2274.70 23.6
4202.20 11.2
2003.25 -15.5
32.78 31.6
1970.47 -16.3
612.5 1.4
1357.94 -24.3
- -
1357.94 -24.3
- -
1357.9 -24.3
59.85 -24.3
CD Equisearch Pvt Ltd
Equities Derivatives Commoditie
Net Interest Income
Non Interest Income
Total Operating Income
Staff Costs
Operating Expenses
Pre-Provision Profits
Provision and contingency
Depreciation
Extraordinary gain/ (loss)
Share in associate profit
Net Profit
Extraordinary gain/(loss)
Adjusted PAT after MI
EPS (F.V.10)
Consolidated Income Statement
Rs in crores
6
CD Equisearch Pvt Ltd
ities Distribution of Mutual Funds Dist
FY13 FY14 FY15 FY16e
3719.38 3751.54 4193.44 4440.25
237.64 526.44 311.52 458.70
Total Operating Income 3957.02 4277.98 4504.96 4898.95
443.17 471.60 504.04 570.13
456.23 589.92 696.00 713.18
Provision Profits 3057.62 3216.46 3304.93 3615.64
872.24 1213.21 1612.23 1616.69
PBDT 2185.38 2003.25 1692.70 1998.95
22.71 32.78 43.15 38.91
- - - -
PBT 2162.66 1970.46 1649.55 1960.04
Tax 698.77 612.53 621.11 700.61
PAT 1463.89 1357.94 1028.44 1259.43
-0.46 - - -
Net Profit 1463.43 1357.94 1028.44 1259.43
- - - -
Adjusted PAT after MI 1463.43 1357.94 1028.44 1259.43
EPS (F.V.10) 64.50 59.85 45.32 55.50
Consolidated Income Statement Figures in Rs crores
6
CD Equisearch Pvt Ltd
istribution of Life Insurance
FY16e FY17e
4440.25 5085.22
458.70 500.00
4898.95 5585.22
570.13 647.10
713.18 809.46
3615.64 4128.66
1616.69 1834.94
1998.95 2293.72
38.91 45.00
-
1960.04 2248.72
700.61 809.54
1259.43 1439.18
-
1259.43 1439.18
-
1259.43 1439.18
55.50 63.43
Figures in Rs crores
CD Equisearch Pvt Ltd
Equities Derivatives Commoditie
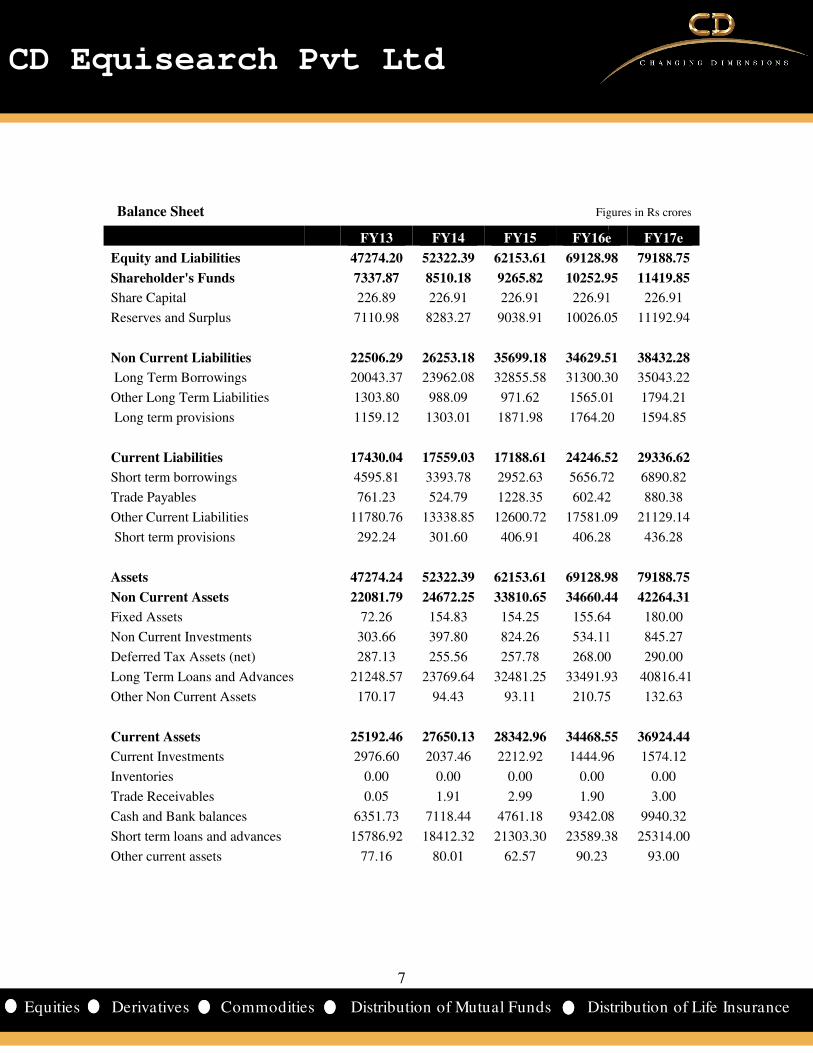
Equity and Liabilities
Shareholder's Funds
Share Capital
Reserves and Surplus
Non Current Liabilities
Long Term Borrowings
Other Long Term Liabilities
Long term provisions
Current Liabilities
Short term borrowings
Trade Payables
Other Current Liabilities
Short term provisions
Assets
Non Current Assets
Fixed Assets
Non Current Investments
Deferred Tax Assets (net)
Long Term Loans and Advances
Other Non Current Assets
Current Assets
Current Investments
Inventories
Trade Receivables
Cash and Bank balances
Short term loans and advances
Other current assets
Balance Sheet
7
CD Equisearch Pvt Ltd
ities Distribution of Mutual Funds Dist
FY13 FY14 FY15 FY16e
47274.20 52322.39 62153.61 69128.98
7337.87 8510.18 9265.82 10252.95
226.89 226.91 226.91 226.91
7110.98 8283.27 9038.91 10026.05
22506.29 26253.18 35699.18 34629.51
20043.37 23962.08 32855.58 31300.30
1303.80 988.09 971.62 1565.01
1159.12 1303.01 1871.98 1764.20
17430.04 17559.03 17188.61 24246.52
4595.81 3393.78 2952.63 5656.72
761.23 524.79 1228.35 602.42
11780.76 13338.85 12600.72 17581.09
292.24 301.60 406.91 406.28
47274.24 52322.39 62153.61 69128.98
22081.79 24672.25 33810.65 34660.44
72.26 154.83 154.25 155.64
303.66 397.80 824.26 534.11
287.13 255.56 257.78 268.00
21248.57 23769.64 32481.25 33491.93
170.17 94.43 93.11 210.75
25192.46 27650.13 28342.96 34468.55
2976.60 2037.46 2212.92 1444.96
0.00 0.00 0.00 0.00
0.05 1.91 2.99 1.90
6351.73 7118.44 4761.18 9342.08
15786.92 18412.32 21303.30 23589.38
77.16 80.01 62.57 90.23
Balance Sheet Figures in Rs crores
7
CD Equisearch Pvt Ltd
istribution of Life Insurance
FY16e FY17e
69128.98 79188.75
10252.95 11419.85
226.91 226.91
10026.05 11192.94
34629.51 38432.28
31300.30 35043.22
1565.01 1794.21
1764.20 1594.85
24246.52 29336.62
5656.72 6890.82
602.42 880.38
17581.09 21129.14
406.28 436.28
69128.98 79188.75
34660.44 42264.31
155.64 180.00
534.11 845.27
268.00 290.00
33491.93 40816.41
210.75 132.63
34468.55 36924.44
1444.96 1574.12
0.00
3.00
9342.08 9940.32
23589.38 25314.00
93.00
Figures in Rs crores
CD Equisearch Pvt Ltd
Equities Derivatives Commoditie
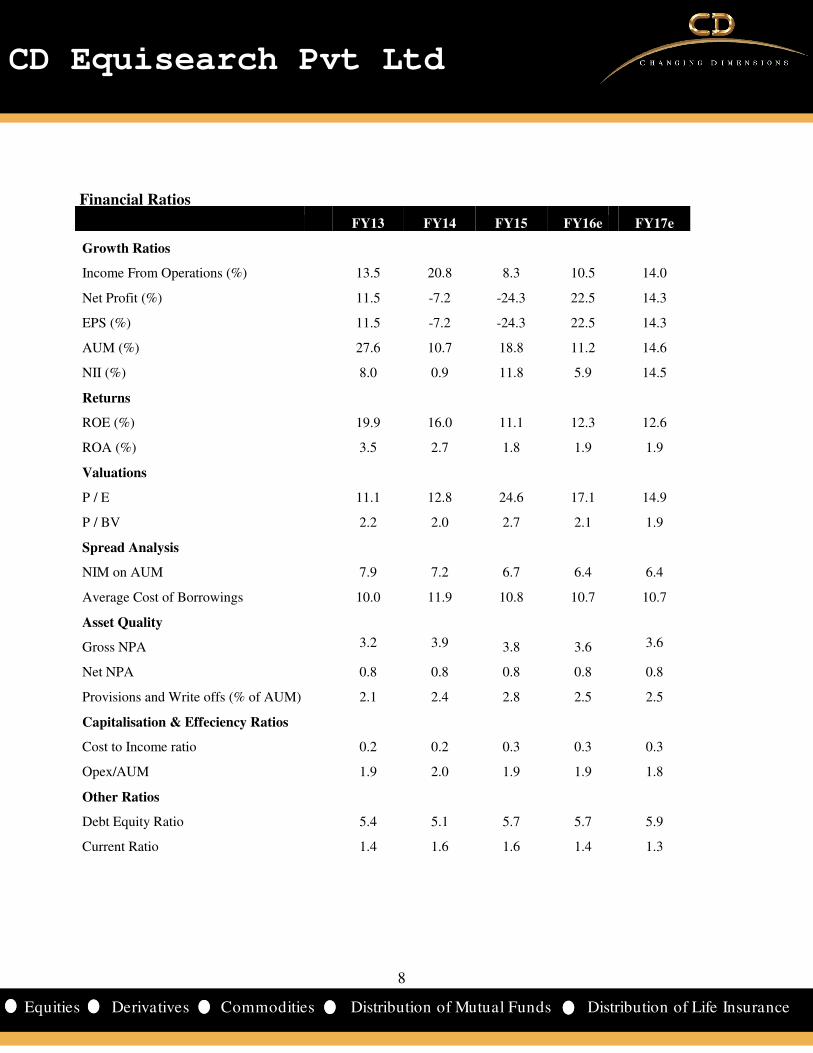
Growth Ratios
Income From Operations (%)
Net Profit (%)
EPS (%)
AUM (%)
NII (%)
Returns
ROE (%)
ROA (%)
Valuations
P / E
P / BV
Spread Analysis
NIM on AUM
Average Cost of Borrowings
Asset Quality
Gross NPA
Net NPA
Provisions and Write offs (% of AUM)
Capitalisation & Effeciency Ratios
Cost to Income ratio
Opex/AUM
Other Ratios
Debt Equity Ratio
Current Ratio
Financial Ratios
8
CD Equisearch Pvt Ltd
ities Distribution of Mutual Funds Dist
FY13 FY14 FY15 FY16e
13.5 20.8 8.3 10.5
11.5 -7.2 -24.3 22.5
11.5 -7.2 -24.3 22.5
27.6 10.7 18.8 11.2
8.0 0.9 11.8 5.9
19.9 16.0 11.1 12.3
3.5 2.7 1.8 1.9
11.1 12.8 24.6 17.1
2.2 2.0 2.7 2.1
7.9 7.2 6.7 6.4
10.0 11.9 10.8 10.7
3.2 3.9 3.8 3.6
0.8 0.8 0.8 0.8
2.1 2.4 2.8 2.5
0.2 0.2 0.3 0.3
1.9 2.0 1.9 1.9
5.4 5.1 5.7 5.7
1.4 1.6 1.6 1.4
8
CD Equisearch Pvt Ltd
istribution of Life Insurance
FY17e
14.0
14.3
14.3
14.6
14.5
12.6
1.9
14.9
1.9
6.4
10.7
3.6
0.8
2.5
0.3
1.8
5.9
1.3
CD Equisearch Pvt Ltd
Equities Derivatives Commoditie
DISCLOSURE & DISCLAIMER: CD Equisearch Private Limited (hereinafter referred to as India Limited, Bombay Stock Exchange Limited and Metropolitan Stock Exchange of India Limited (Formerly known as MCX Stock Exchange Limited). CD Equi is also registered as Depository Participant withAdvisor. The associates of CD Equi are engaged in activities relating to NBFCBroking, Real Estate, etc. CD Equi has applied for registration under SEBI (Research Analysts) R
• No disciplinary action has been taken against CD Equi by any of the regulatory authorities.
• CD Equi/its associates/research analysts do not have any financial interest/beneficial interest of more t
percent/material conflict of interest in the subject company(s)
• CD Equi/its associates/research analysts have not received any compensation from the subject company(s) during the past twelve months.
• CD Equi/its research analysts has not served as
has not been engaged in market making activity of the company covered by analysts This document is solely for the personal information of the recipient and must not be singularly used ainvestment decision. Nothing in this document should be construed as investment or financial advice. Each recipient of this document should make such investigations as they deem necessary to arrive at an independent evaluation of an invethe securities of the companies referred to in this document (including the merits and risks involved) and should consult theown advisors to determine the merits and risks of such an investment. Reports based on technical and derivative analysis center on studying charts of a stock's price movement, outstanding positions and trading volume, as opposed to focusing on a company's fundamentals and as such, may not match with a report on a company's fundamentals. The information in this document has been printed on the basis of publicly available information, internal data and other
reliable sources believed to be true but we do not represent that it is accurate or complete and it should not be relied on asuch, as this document is for general guidance only. CD Equi or any of its affiliates/group companies shall not be in any way responsible for any loss or damage that may arise to any person from any inadvertent error in the information contained in threport. CD Equi has not independently verified all the information contained within this document. Accordingly, we cannot testify nor make any representation or warranty, express or implied, to the accuracy, contents or data contained within this document. While, CD Equi endeavors to update on a reasonable basis the information discussed in this material, there may be regulatory compliance or other reasons that prevent us from doing so. This document is being supplied to you solely for your information and its contents, information or data mayredistributed or passed on, directly or indirectly. Neither, CD Equi nor its directors, employees or affiliates shall be liabloss or damage that may arise from or in connection with the use of this information.CD Equisearch Private Limited (CIN: U67120WB1995PTC071521)Registered Office: 37, Shakespeare Sarani, 1st Floor, Kolkata Corporate Office: 10, Vasawani Mansion, 2nd Floor, Dinshaw Wachha Road, Churchgate, Mumb2283 0652/0653; Fax: +91(22) 2283, 2276 Website: www.cdequi.com; Email: [email protected] Regn No.: NSE-CM: INB230781137, NSE-FOINF010781133, MCX-SX-CM: INB-260781134, MCX180-2002
9
CD Equisearch Pvt Ltd
ities Distribution of Mutual Funds Dist
CD Equisearch Private Limited (hereinafter referred to as ‘CD Equi’) is a Member registered with National Stock Exchange of India Limited, Bombay Stock Exchange Limited and Metropolitan Stock Exchange of India Limited (Formerly known as MCX Stock Exchange Limited). CD Equi is also registered as Depository Participant with CDSL and AMFI registered Mutual Fund Advisor. The associates of CD Equi are engaged in activities relating to NBFC-ND - Financing and Investment, Commodity
CD Equi has applied for registration under SEBI (Research Analysts) Regulations, 2014. Further, CD Equi hereby declares that
No disciplinary action has been taken against CD Equi by any of the regulatory authorities.
CD Equi/its associates/research analysts do not have any financial interest/beneficial interest of more t
percent/material conflict of interest in the subject company(s).
CD Equi/its associates/research analysts have not received any compensation from the subject company(s) during the
CD Equi/its research analysts has not served as an officer, director or employee of company covered by analysts and
has not been engaged in market making activity of the company covered by analysts.
This document is solely for the personal information of the recipient and must not be singularly used ainvestment decision. Nothing in this document should be construed as investment or financial advice. Each recipient of this document should make such investigations as they deem necessary to arrive at an independent evaluation of an invethe securities of the companies referred to in this document (including the merits and risks involved) and should consult theown advisors to determine the merits and risks of such an investment.
ysis center on studying charts of a stock's price movement, outstanding positions and trading volume, as opposed to focusing on a company's fundamentals and as such, may not match with a report on a
t has been printed on the basis of publicly available information, internal data and other
reliable sources believed to be true but we do not represent that it is accurate or complete and it should not be relied on aguidance only. CD Equi or any of its affiliates/group companies shall not be in any way
responsible for any loss or damage that may arise to any person from any inadvertent error in the information contained in thrified all the information contained within this document. Accordingly, we cannot
testify nor make any representation or warranty, express or implied, to the accuracy, contents or data contained within this
a reasonable basis the information discussed in this material, there may be regulatory compliance or other reasons that prevent us from doing so.
This document is being supplied to you solely for your information and its contents, information or data mayredistributed or passed on, directly or indirectly. Neither, CD Equi nor its directors, employees or affiliates shall be liabloss or damage that may arise from or in connection with the use of this information.
Private Limited (CIN: U67120WB1995PTC071521) Floor, Kolkata – 700 017; Phone: +91(33) 4488 0000; Fax: +91(33) 2289 2557Floor, Dinshaw Wachha Road, Churchgate, Mumbai
[email protected] FO: INF230781137, NSE-CD: INE230781135, BSE-CM: INB010781133, BSE
260781134, MCX-SX-FO: INF260781134, MCX-SX-CD: INE260781137, DP: IN
9
CD Equisearch Pvt Ltd
istribution of Life Insurance
) is a Member registered with National Stock Exchange of India Limited, Bombay Stock Exchange Limited and Metropolitan Stock Exchange of India Limited (Formerly known as MCX
CDSL and AMFI registered Mutual Fund Financing and Investment, Commodity
egulations, 2014. Further, CD Equi hereby declares that –
No disciplinary action has been taken against CD Equi by any of the regulatory authorities.
CD Equi/its associates/research analysts do not have any financial interest/beneficial interest of more than one
CD Equi/its associates/research analysts have not received any compensation from the subject company(s) during the
an officer, director or employee of company covered by analysts and
This document is solely for the personal information of the recipient and must not be singularly used as the basis of any investment decision. Nothing in this document should be construed as investment or financial advice. Each recipient of this document should make such investigations as they deem necessary to arrive at an independent evaluation of an investment in the securities of the companies referred to in this document (including the merits and risks involved) and should consult their
ysis center on studying charts of a stock's price movement, outstanding positions and trading volume, as opposed to focusing on a company's fundamentals and as such, may not match with a report on a
t has been printed on the basis of publicly available information, internal data and other
reliable sources believed to be true but we do not represent that it is accurate or complete and it should not be relied on as guidance only. CD Equi or any of its affiliates/group companies shall not be in any way
responsible for any loss or damage that may arise to any person from any inadvertent error in the information contained in this rified all the information contained within this document. Accordingly, we cannot
testify nor make any representation or warranty, express or implied, to the accuracy, contents or data contained within this
a reasonable basis the information discussed in this material, there may be regulatory
This document is being supplied to you solely for your information and its contents, information or data may not be reproduced, redistributed or passed on, directly or indirectly. Neither, CD Equi nor its directors, employees or affiliates shall be liable for any
700 017; Phone: +91(33) 4488 0000; Fax: +91(33) 2289 2557; ai – 400 020; Phone: +91(22)
CM: INB010781133, BSE-FO: CD: INE260781137, DP: IN-DP-CDSL-