cct programs, the economy, and presidential ... -...
TRANSCRIPT
1
CCT Programs, the Economy, and Presidential Elections in Latin America1
PLEASE, DO NOT CITE!
(prepared for presentation at the Seminar of NECI – USP)
May 20, 2013
Diego Sanches Corrêa
Abstract
Numerous recent country studies show that beneficiaries of CCT programs vote for
incumbents at higher rates. It is reasonable to expect that, as a consequence, those incumbents
will have a better national performance in the next election. This article warns against such an
extrapolation. It analyzes an original cross-national dataset with information for eighty-four
Latin American presidential elections that took place between 1990 and 2010. My results reveal
that CCT programs have not improved incumbents’ electoral performances in the region,
contradicting common claims of the literature. They also confirm the classic economic voting
hypothesis that incumbents are held accountable in the polls for their economic performance.
1 I greatly appreciate the accessibility and advice of my former PhD advisor José Cheibub
during the time I was doing the research that led to this article. I also want to thank Professors
Matthew Winters, Damarys Canache, and Rodolfo Hoffman, as well as three anonymous
referees, for their insightful comments and critiques. All shortcomings the reader may find in this
article are of my own responsibility.
2
Do presidents who invest in Conditional Cash Transfer (CCT) programs improve their
electoral performances when they run for reelection?2 Recent academic studies have consistently
found that beneficiaries of these programs vote for incumbents at higher rates (Díaz-Cayeros et
al. 2009; Queirolo 2010; Zucco 2013; De la O 2013) and that incumbents’ vote shares tend to
increase in subnational areas with higher CCT coverage (Serdán 2006; Nicolau and Peixoto
2007; Zucco 2008; Nupia 2011). An easy extrapolation from these findings would be to conclude
that incumbents who invest in CCT programs improve their overall electoral performances when
they run for reelection. The plausibility of this hypothesis has led some scholars to inadvertently
“make the jump”, but it has not been properly tested by the literature up to this date.
Perhaps because CCT programs are a very specific kind of social policy that has become
predominant in only one geographic region of the world, Latin America, their potential to affect
electoral results has not been subjected to as much scholarly scrutiny as the effects of general
economic variables, such as GDP growth, inflation, and unemployment. However, if CCT
programs have the potential to improve incumbents’ electoral prospects, these large and effective
redistributive policies could be providing presidents with a way out of what McDonald and
Budge (2005, 93) call a “consistent, stable, and generalizable finding that does emerge from
studies of comparative voting - governments everywhere seem consistently to lose votes in the
2 Conditional Cash Transfer (CCT) programs are one of the most popular forms of
income redistribution in Latin America. Their most basic characteristic is that beneficiaries
receive a regular amount of cash from the government as long as they comply with health and
education conditionalities. I do not spend much time describing the characteristics of these
programs in this article, as it has been done ad nauseam by virtually all of the authors studying
their political effects.
3
current as opposed to the previous election”. Do CCT programs really make incumbents
electorally more successful, contradicting a systematic finding of a literature that has already
become classic?
In this article, I claim that they do not. CCT programs, like any other redistributive
policy, do not lead to Pareto improvements in the allocation of society’s resources. While
beneficiaries receive all of the benefits and vote for incumbents as a consequence, non-
beneficiaries pay their costs and may decide to vote for candidates less committed to the poor.
Added to that, government’s intervention in the economy for the sake of income redistribution is
something citizens may support or reject on strictly ideological grounds. Here, my objective is to
demonstrate that the extrapolation from findings at the individual and subnational levels of
analysis to claims about phenomena observed at the national level is unwarranted. Latin
American presidents who invested in CCT programs are neither electorally more successful than
those who did not, nor electorally more successful than they had been in previous elections.
Paldam’s (1991, 19) assertion that “it does cost votes to rule” is not put in check by the recent
spread of CCT programs in Latin America.
In order to demonstrate this, I collected electoral, political, and economic data for all of
the eighteen Iberian American democracies, sixteen of which currently invest in CCT programs.
The last military dictatorship formally fell seventeen days before the turn of the decade 1989-90,
when the Chileans elected Patricio Aylwin president, and Cuba remains the only country in the
region that does not hold regular and competitive elections. Despite setbacks in a few countries,
democratic institutions slowly consolidated, and eighty-four presidential elections were carried
out between 1990 and 2010. These elections are the units of analysis in the dataset. For each of
them, I have information on the incumbent’s electoral performance, on the economic conjuncture
4
of the years preceding the election, on characteristics of the government that ruled the country
until then, and on investments made in CCT programs.
In the next section, I briefly discuss the two strands of the literature this article addresses.
On the one hand, by demonstrating that CCT programs do not affect incumbents’ electoral
performances, I am directly dialoguing with scholars studying the electoral effects of these
programs. On the other hand, when I show that the economy strongly affected electoral results in
the Latin America of the 1990s and 2000s, I am also approaching the economic voting literature.
In the second section, I introduce my criterion for distinguishing between universal and
geographically targeted CCT programs and describe the method I employ to estimate their
coverage in election years. In the third section, I estimate the effect of CCT programs on
incumbents’ vote swings, controlling for commonly used economic variables. The firm
assumption behind these and all of the other models reported in this article is that citizens
respond to changes in the material conditions of their lives when casting their votes. These
models demonstrate that CCT programs are not associated with incumbents’ electoral
performances, whereas economic variables are. In the fourth section, I verify if CCT programs
affect incumbents’ vote swings at least in more favorable political contexts. Specifically, I
account for the possibility that voters reward incumbents for investing in CCT programs only in
contexts where they supposedly have higher opportunities and ability to do so. My results
provide no evidence in support of this hypothesis. In the fifth and last section, I restrict my
analysis to programs that have reached universal coverage and demonstrate that my findings are
robust to alternative specifications of the main explanatory variable.
5
CCT programs, the economy, and presidential elections
The recent proliferation of studies associating investments in CCT programs with
incumbents’ electoral performances started in the wake of the Brazilian 2006 presidential
election. A strong positive correlation between the municipal coverage of Bolsa Família, the
largest CCT program in the world, and vote shares of the incumbent candidate Lula led several
political scientists and economists to propose a causal association between the two. Soon,
statements that the program was the most important determinant of the 2006 electoral results
became mainstream. The only study claiming that the economy had a stronger impact on that
election (Shikida et al. 2009) was never taken seriously by the academic community, as it was
systematically contradicted by a flood of empirical research pointing to the other direction
(Nicolau and Peixoto 2007; Hunter and Power 2007; Zucco 2008; Soares and Terron 2008;
Cânedo-Pinheiro 2009; Licio et al. 2009; Marques et al. 2009).3 Most of the models reported in
these studies controls for economic variables, just to conclude that they are either insignificant or
weak predictors of incumbents’ electoral support.
Research has not been restricted to Brazil. Serdán (2006) found that in the 2006 election,
the Mexican incumbent candidate Felipe Calderón performed better in municipalities with larger
coverage of the CCT program Oportunidades than President Vicente Fox had done in 2000. A
few years later, Díaz-Cayeros et al. (2009) analyzed exit poll data and found that Oportunidades
beneficiaries were 11% more likely to have voted for Calderón than non-beneficiaries.
Manacorda et al. (2011) found that beneficiaries of the Uruguayan CCT program Plan de
3 See Bohn (2011) for a different view of the role of the Brazilian CCT program on the
2006 election. According to the author, the most important change in Lula’s electoral bases
occurred between 1998 and 2002, and not between 2002 and 2006.
6
Asistencia Nacional a la Emergencia Social (PANES) were more likely to support President
Tabaré Vázquez in opinion surveys, and Queirolo (2010) found that they were also more likely
to have voted for the incumbent candidate José Mujica in the 2009 election. Nupia (2011) found
that in the Colombian 2010 presidential election, the incumbent candidate Juan Manuel Santos
performed better in municipalities where the CCT program Familias en Acción covered a larger
proportion of the population than President Álvaro Uribe had done when he was reelected in
2006. Finally, Layton and Smith (2011) analyzed survey data of ten Latin American countries
and found that beneficiaries of CCT programs are systematically more likely to declare an
intention to vote for incumbents than non-beneficiaries.
There is little disagreement among the studies cited above. They consistently show that
CCT beneficiaries vote for incumbents at higher rates and that incumbents improve their
electoral performances in areas with higher CCT coverage. This article does not seek to put the
credibility of these findings in check. My objective is rather to verify if an extrapolation from
these results to inferences at the national level of analysis is warranted. Do vote gains among
poor voters lead to a better overall electoral performance? Below, I report results of the first-ever
cross-national analysis assessing the association between CCT programs and elections. They
demonstrate that CCT programs have not had any significant effect on incumbents’ electoral
performances, while classic economic indicators have.
The argument that the economy affects incumbents’ electoral performances is old, but it
has not been immune from criticism.4 So many scholars have found the influence of the economy
on elections to be mediated by political institutions, for example, that an influential author has
4 See Schneider and Frey (1998), Nannestad and Paldam (1994), Lewis-Beck and
Stegmaier (2000), and Anderson (2007) for thorough reviews of the economic voting literature.

7
titled one of his most recent articles “The End of Economic Voting?” (Anderson 2007). Without
providing a “yes or no” answer for the question enunciated in the title, the author’s concerns
reflect the consensus that took shape in the academic community after decades of knowledge
accumulation: the economy does not affect the electoral performance of incumbent candidates in
all countries similarly. Instead, voters only punish or reward those incumbents they clearly
perceive as responsible for the country’s economic situation. Heads of government who can
blame coalition partners or the opposition in the legislature for their failures in office are
relatively immune from voters’ sanctioning (Powell and Whitten 1993; Anderson 1995, 2000;
Duch and Stevenson 2008).
This article builds upon insights of this long tradition of scholarly research. The
economic voting literature had also relied exclusively on country studies, especially of the U.S.,
in its beginnings. The natural next step of studying the phenomenon through a cross-national
empirical framework was taken in the early 1990s, when studies by Paldam (1991), Remmer
(1991) and Powell and Whitten (1993) were published. Evidence generated by these
groundbreaking articles forced scholars to review the theoretical foundations on which economic
voting hypotheses were sustained. My results suggest that something similar must occur with the
study of CCT programs. Although my results do not necessarily contradict previous findings,
they warn against common conjectures about the global effects of CCT programs on presidential
elections and suggest that a few pieces are still missing in the bigger puzzle.
Coverage and Classification of CCT programs
Each case in my dataset corresponds to a presidential election and has information on
how the incumbent candidate performed in it and in the previous one. I make reference to

8
presidential administrations quite often, and by them I mean the period of time that passed
between those two presidential elections. Twelve of the eighty-four presidential administrations
subsumed in the dataset were interrupted before the end of the president’s constitutional term for
reasons of resignation or impeachment, and a non-elected temporary government ruled until a
new election was carried out. These cases also count as one presidential administration, despite
the fact that more than one head of government ruled in the period. The incumbent party is
always considered the one that won the previous election, not the one that replaced it
extraordinarily. Table 1 shows that nearly 35% of the Latin American presidential
administrations invested in CCT programs between 1990 and 2010.
[TABLE 1 ABOUT HERE]
Each of these programs went through a very specific process of institutionalization, and
five countries had already had experience with other CCT programs before the implementation
of the current ones. The Argentine Asignación Universal por Hijo evolved from Plan Familias
and Jefes y Jefas de Hogares; the Brazilian Bolsa Família evolved from Bolsa Escola and Bolsa
Alimentação; the Salvadoran Comunidades Solidarias evolved from Red Solidaria; the Mexican
Oportunidades evolved from the Programa de Educación, Salud y Alimentación (PROGRESA);
and the Uruguayan Asignaciones Familiares evolved from PANES. In Brazil, El Salvador, and
Mexico, new programs were implemented by presidents who inherited CCT programs from
administrations led by other parties. This was done, in part, to create a false impression of
discontinuity with the initiatives of their predecessors. In Argentina and Uruguay, institutional
adjustments that ended previous CCT programs and gave origin to the current ones were
9
relatively deeper, despite the fact that power remained in the hands of the same party. When the
second decade of the XXI century began, Venezuela was the only democracy in the Iberian
America that lacked any experience with these programs, and Nicaragua was the only country to
have terminated a CCT program without replacing it by another one.
Succinctly defined, CCT programs pay cash to poor families and impose health and/or
education conditionalities on their children. All of the programs listed in Table 1 share this basic
characteristic, but one could easily list numerous differences among them. They differ in terms
of amount of cash paid to beneficiaries, regularity of payments, specificities of conditionalities,
age ranges of eligible children, methods for assessing the poverty level of individuals, funding
sources, etc. Arguably, all of these differences should have minor consequences for aggregate
electoral results, compared to the impact of coverage. The hypothesis that motivates the analysis
reported below is that the higher the number of people receiving cash from the government is,
the more the incumbent is expected to improve his or her electoral performance in the next
election.
Following the standard practice, I utilize the number of households covered by CCT
programs divided by the total number of households as the indicator of coverage. Table 2 reports
coverage estimates at the end of the twenty-nine administrations that invested in these programs
between 1990 and 2010, based on official CCT statistics and census data. To reduce the
magnitude of over and underestimation, I rounded values down to the next half integer if the
census was carried out before the publication of the corresponding CCT statistics and rounded
them up otherwise. For the three cases in which a census was carried out in the same year as the
publication of CCT statistics (Mexico 2000, Honduras 2001, and Brazil 2010), I rounded the

10
estimate to the closest centesimal. Sources and dates for statistics on which these estimates are
based are listed in Appendix A.
[TABLE 2 ABOUT HERE]
Once the eligibility criteria are established by the government, CCT programs tend to
expand gradually until they reach full coverage. With nearly 100% of potential beneficiaries
covered, the only way CCT programs can keep expanding is through changes in their eligibility
criteria. In principle, governments cannot prevent families who fit the eligibility criteria from
receiving benefits, and this is the reason why these programs have been praised as universalistic.
However, the programs listed at the first half of Table 2 impose geographic restrictions on
accession, which can be interpreted as a sign of unfairness against poor families living in
uncovered areas. Geographic targeting does not necessarily make a program clientelistic, but it is
an undeniable indicator that the program does not cover all of the poor. Grievances may lead the
uncovered poor to support the opposition, offsetting electoral gains the incumbent expects to
obtain among covered families. For this reason, geographically targeted programs are
distinguished from universal ones in the dataset. I classified as universal only those programs
that covered at least 95% of the country’s second-level administrative divisions at the time of the
election.
It is likely that some of the programs labeled universal did not reach full coverage when
the presidential election was carried out. Determining how close each of them is from covering
100% of eligible families is a challenging task for two reasons. First, all countries but Brazil rely
on relatively complex proxy means tests to determine the poverty level of families and select

11
beneficiaries.5 In general, public social workers apply personal in-home questionnaires to
potential beneficiaries and, based on some kind of scoring system, decide if they fit the eligibility
criteria or not. Questionnaires and scoring systems vary, and their relative complexity makes it
hard for independent analysts to estimate the exact potential for CCT coverage in each country.
Second, all programs are affected by leakage (coverage of beneficiaries who do not fit the
eligibility criteria) and undercoverage (exclusion of families that fit the eligibility criteria), the
degree of which can be only roughly estimated. Latin American governments, sometimes in
cooperation with independent organizations, have been quite diligent in identifying and
eliminating these problems, and the general perception that CCT programs are well targeted is in
part the result of these efforts. However, monitoring tens of thousands, in some cases millions, of
beneficiaries is difficult, and reliance on complex instruments such as proxy means testing only
adds to the difficulty. For these two reasons (i.e., complexity of selection mechanisms and
pervasiveness of leakage/undercoverage), I decided to eschew the task of assessing how close
each of the programs I classified as universal really is from being universal. The only criterion I
use is reliance on geographic targeting, because this is an unquestionable sign that the
government systematically denies social assistance to some poor families for reasons other than
families’ actual needs.
5 The criterion employed in Brazil to select beneficiaries is strictly based on income.

12
Explaining Incumbents’ Performances: CCT Programs and the Economy
In order to assess the effects of CCT programs on Latin American elections, I calculated
vote shares of incumbent candidates6 in the first round of the eighty-four Latin American
presidential elections held between 1990 and 2010, dividing the number of votes they received
by the total number of valid votes.7 I followed the same procedure to calculate the vote shares of
presidents in the election held immediately before. Then, I subtracted the president’s vote share
in the previous election from the incumbent’s vote share in the current one and labeled this
difference the incumbent’s vote swing. All the information required to calculate vote shares and
vote swings was extracted primarily from national electoral courts’ websites and complemented
with data from Nohlen’s data handbooks (2005) - refer to Appendix B for the list of sources.
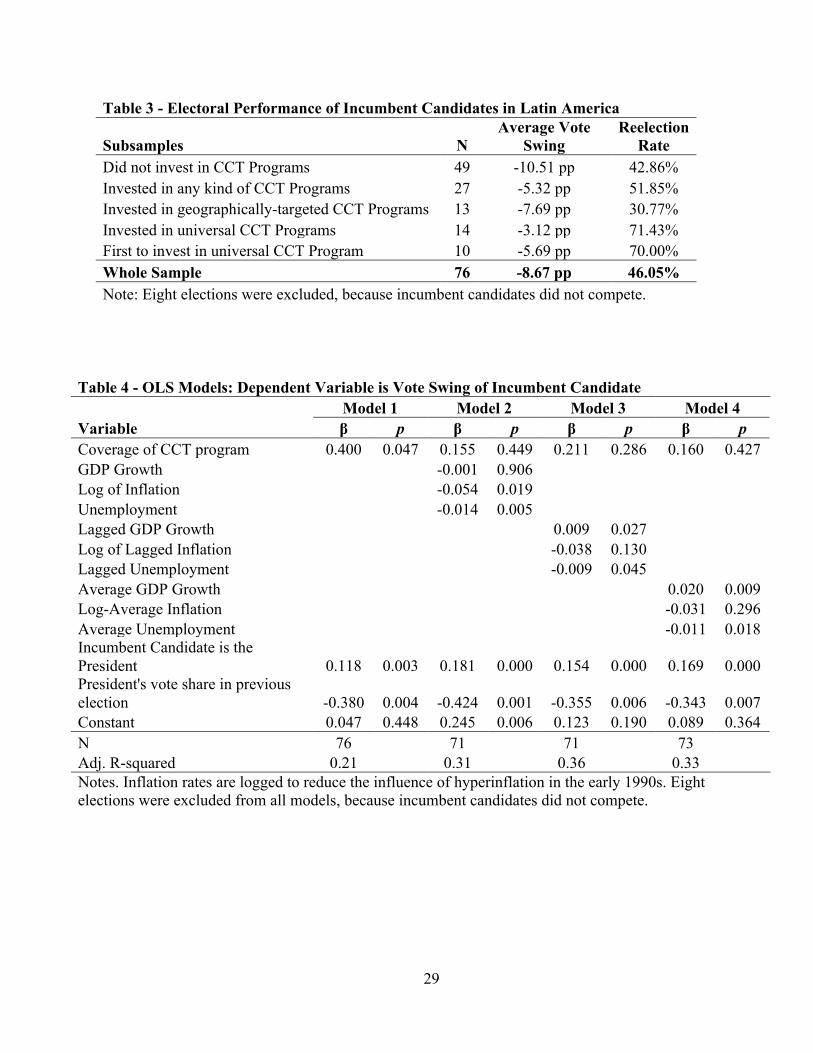
Table 3 provides some descriptive statistics of Latin American elections and conveys
important information. First of all, incumbent candidates tend to lose votes between elections, a
pattern that has been systematically observed all around the world (see Paldam 1991; Remmer
1991; Nannestad and Paldam 2002; McDonald and Budge 2005). They lost, on average, almost
nine percentage points of valid votes, and only nineteen incumbent candidates (25% of the
6 I considered incumbent candidates the president, the candidate of the president’s party,
or the candidate explicitly endorsed by the president. In only three cases, the incumbent
candidate did not belong to the incumbent’s party: Bolivia 1993, Colombia 2010, and Nicaragua
2006. Incumbent candidates did not compete in eight elections: Colombia 2002, Ecuador 1996
and 1998, Guatemala 1996, Nicaragua 1996, Peru 2001 and 2006, and Venezuela 1998.
7 Colombia is the only Latin American country where blank votes are considered valid. I
did not take those votes into account when calculating Colombian candidates’ vote shares,
however.
13
sample) improved their performances from one election to the other. Secondly, the table clearly
shows that presidents who invested in CCT programs performed better than other presidents,
especially when the program was universal.
[TABLE 3 ABOUT HERE]
The descriptive statistics presented in Table 3 provides some support for the hypothesis
that CCT programs improve incumbents’ overall electoral performances. However, these
programs are not the only potential determinants of electoral results. Table 4 reports results of
four linear regression models in which incumbents’ vote swings are the dependent variable.
Following the common practice, two control variables are included in these and all other models
reported throughout this article: the president’s vote share in the previous election and a dummy
variable indicating that the incumbent candidate was the acting president. The reason for
including the former is that it is much easier for incumbent candidates to lose votes when they
performed exceptionally well in the previous election. The coefficient of this variable should
always have a negative sign. The inclusion of the latter is due to the general understanding that
presidents have electoral advantages that no other candidate has (e.g., name recognition and
control of state resources), and that, consequently, they tend to perform better than other
candidates from incumbent parties when they run for reelection. The coefficient of this dummy
variable should always have a positive sign.
The models reported in Table 4 estimate the effect of CCT programs and three commonly
used economic variables (GDP growth, inflation, and unemployment) on incumbents’ vote
swings. The main explanatory variable is the estimate of coverage reported in Table 2, with
14
administrations that did not invest in CCT programs coded zero.8 Information on GDP growth
and inflation were extracted from the website of the International Monetary Fund (IMF). Data on
unemployment were collected from three sources, all of them incomplete: the Economic
Commission for the Latin America and the Caribbean (ECLAC), the World Bank, and the
International Labour Organization (ILO). Although there are some discrepancies in the ciphers
published by each of these sources, the correlation among them is always higher than 0.9 for
non-missing cases. I decided to work with ECLAC’s database because it has fewer missing
cases.
[TABLE 4 ABOUT HERE]
Coverage of CCT programs is significantly associated with incumbents’ vote swings only
in the model that does not control for economic variables, a finding that reflects the descriptive
statistics reported in Table 3. Model 1 predicts that covering an additional one hundredth of the
population will result in an extra 0.4 percentage point of valid votes for the incumbent in the
following election. When economic variables are included in the regression equation, however,
the explanatory power of CCT programs disappears. Model 2 controls for GDP growth, inflation,
8 I estimated the same models using three alternative explanatory variables: coverage of
universal programs (geographically targeted ones coded zero), a dummy variable indicating that
the president was one of the twenty-nine to have invested in any kind of CCT programs, and a
dummy variable indicating that the president was one of the fourteen to have invested in
universal CCT programs. Models using these alternative explanatory variables lead to similar
conclusions and are omitted here.

15
and unemployment in the election year, Model 3 controls for the same variables in the previous
year, and Model 4 controls for averages of these variables for the whole presidential term. The
signs of these economic variables are always in the expected direction, but only unemployment
is significant in all of the three models. Still, inflation is significant in Model 2, and GDP growth
in Models 3 and 4. Together, these models confirm classic hypotheses of the economic vote
literature, at the same time that they warn against common speculations about the effects of CCT
programs on aggregate electoral results.
One objection that could be raised against these results is that investments in CCT
programs and the economy are not independent from each other. If this is true, the estimates may
have produced large standard errors, leading me to wrongly conclude that CCT programs do not
affect electoral results, when they actually do. For example, it is reasonable to expect that CCT
programs expand during recessions, because more families fall into poverty. The Argentine Plan
Familias, the Uruguayan PANES, and the Honduran PRAF-II clearly fit in this category. On the
other hand, it is also reasonable to expect that CCT programs expand in times of prosperity,
because the government has more cash available to redistribute. The Colombian Famílias en
Acción, the Dominican Solidaridad, and the Bolivian Juancito Pinto expanded considerably
when these countries were doing relatively well. Each of these expectations implies opposite
associations between coverage of CCT programs and economic performance, one negative and
the other positive. Before more research is produced, whether there actually is a general
association between the economy and CCT programs remains an open question. Evidence from
the dataset on which my analysis is based suggests that Latin American governments have

16
invested in these programs under the most varied economic conditions, and I feel justified
assuming independence between them.9
Another possible objection against the results reported above is that they only take the
presence of CCT programs into consideration, instead of presidents’ efforts to expand them. For
example, at the end of President Lula’s first term in 2006, Bolsa Família covered about 19% of
Brazilian families, while at the end of his second term in 2010, it covered a little more than 22%.
Should we expect the program to have stronger effects in 2010 than it did four years before, just
because its coverage was larger? Or, on the contrary, should we expect the bulk of its electoral
effects to be felt in 2006, the election that followed its implementation? Table 4 shows that the
mere presence of CCT programs does not affect incumbents’ electoral performances when
economic indicators are controlled for. Let us hypothesize now that what matters for electoral
results is not continued investment in these programs, but incumbents’ efforts to expand them.
The higher the proportion of families included in CCT programs is, the better we expect the
incumbent candidate to perform in the following election.
In order to test this hypothesis, I estimated two linear regression models in which the
dependent variable remains incumbents’ vote swings. The main explanatory variable is not CCT
9 As an exploratory exercise, I estimated several regression models in which CCT
coverage was the dependent variable and different combinations of economic indicators the
independent ones. The only variable that seems to have some influence on investments in these
programs is inflation. The variables we would most expect to be significant, that is, GDP growth
and unemployment, did not get even close to it. Obviously, this was just a quick exploratory
exercise, and the potential for the economy to affect investments in income redistribution
remains an open question that deserves to be explored in the future.

17
programs’ coverage at the time of the election anymore, but the expansion of coverage relative to
the previous administration in percentage points. Economic variables are operationalized
analogously: the difference in the average GDP growth, inflation, and unemployment, relative to
the previous administration. The rationale is that presidents who manage to increase the average
GDP growth and decrease the average inflation and unemployment rate will perform better in the
following election.
[TABLE 5 ABOUT HERE]
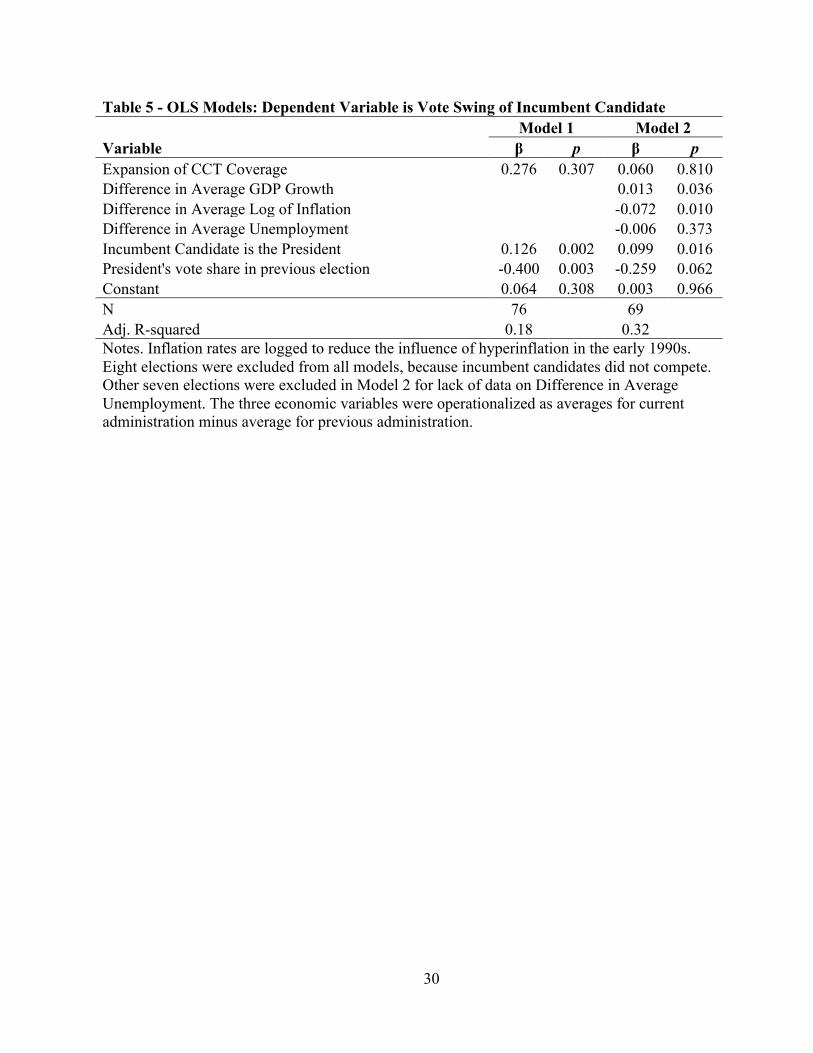
The results displayed in Table 5 are telling. Incumbents who expanded the coverage of
CCT programs did not perform any better in the following election than incumbents who did not.
The coefficient for expansion of CCT programs is insignificant in models with and without
controls. On the other hand, Model 2 shows that incumbents who achieved better economic
results relative to previous administrations improved their electoral prospects. The only
economic indicator that failed to reach statistical significance was unemployment.
Several Latin American cases attest to the primacy of economic determinants for
incumbents’ electoral success. In the Brazilian post-democratization era, for example, three
incumbent candidates were (re)elected with nearly the same proportion of votes they (or their
predecessors) had obtained in the previous election: Cardoso in 1998, Lula in 2006, and Rousseff
in 2010. The administrations that led to their electoral victories had also improved the average
economic growth by nearly the same amount: a little more than one percent of GDP. We see that
their economic and electoral performances closely match, but the opposite is true regarding
investments in CCT programs. Cardoso had not spent one cent in these programs when he was

18
reelected, whereas Lula expanded CCT coverage by eight percentage points in 2006 and by three
percentage points in 2010. The dissonance between investments in CCT programs and electoral
results in Brazil indicates that these programs have a weak explanatory power for incumbents’
aggregate electoral performances.
In Colombia, the electorally most successful incumbent candidate in the period of
analysis is Álvaro Uribe in 2006, when his national vote share increased ten percentage points
relative to what he obtained four years before. During his first term, the country’s average
growth had increased by more than four percent of GDP, but the coverage of Familias en Acción
expanded by merely 1.5 percentage points. During Uribe’s second term (2006-2010), CCT
coverage increased substantially, from about 5% to 22.5% of the population, at the same time
that the average GDP growth decreased from more than 5% to about 4%. Incumbent candidate
Juan Manuel Santos won the 2010 election, but lost almost six percentage points of valid votes
relative to Uribe four years before. Accordingly, one is better justified arguing that the results of
that election reflect the country’s slight economic downfall, instead of massive investments made
in Familias en Acción.
Many other Latin American examples could be invoked here to illustrate what Tables 4
and 5 show: the economy strongly affects incumbents’ overall electoral performances, while
investments in CCT programs do not. That is the general message of this section. But it is still
early for conclusions, as potentially important variables are missing in the models reported
above. In the next section, I investigate if not accounting for political and institutional factors
affected the results, in the way they usually do in cross-national analyses of economic voting.

19
CCT Programs and Political Contexts
It is possible that political institutions mediate the electoral effects of CCT programs. If
this is true, the results reported above are missing the fact that incumbent candidates are
rewarded for investing in these programs only in the presence of favorable political conditions.
Several studies in the economic voting literature, for example, have claimed that clarity of
responsibility is diluted in the presence of minority and coalition governments, because other
agents have decisive participation in policy making. In these political contexts, incumbents may
be shielded against voters’ sanctioning when the next election takes place (Powell and Whitten
1993; Anderson 1995, 2000; Duch and Stevenson 2008). Empirical evidence supporting these
claims comes primarily from parliamentary democracies. In presidential systems, where the
pattern of interaction between the Executive and Legislative is substantially different, other
factors may determine the ability of voters to hold incumbents accountable. In particular, voters
may have better opportunities to punish or reward incumbents for what they do in office when
legislative and executive elections are held concurrently, because, in these situations, voters’
attention is focused on national issues, rather than on candidates’ personal qualities (Samuels
2004; Hellwig and Samuels 2008; Samuels and Hellwig 2010).
The same rationale scholars provided to justify the inclusion of these variables in
analyses of the economic vote could also be used in the study of CCT programs. One could argue
that Latin American presidents have been rewarded for investments in those programs only when
other political actors clearly had a weak participation in the policy making process, as when the
incumbent party held all of the cabinet portfolios and the majority of seats in Congress. In these
cases, the president and his/her party can claim all of the credits for making these investments.
Even more relevant for presidential systems, it is possible that CCT programs paid off electorally

20
only when elections for both branches were held concurrently, because voters paid relatively
more attention to overall governmental performance, rather than to candidates’ individual
qualities. Since all of these factors were shown by the literature to influence voters’ ability to
hold incumbents accountable, they must be taken into consideration before we reach any final
conclusion.
In the models reported below, clarity of responsibility is controlled for by means of two
dummy variables: one indicating coalition governments (more than one party holds cabinet
portfolios) and one indicating minority governments (all parties with cabinet portfolios control
together less than 50% of seats in the lower/single chamber). All of the administrations that were
initially led by a coalition or by a single party ended the same way, with one exception: Ecuador
2002-2005.10 On the other hand, ten administrations (12% of the sample) changed their status
from majority to minority or vice-versa as a consequence of non-concurrent legislative
elections.11 For these twelve cases, I considered the status of the government following the last
10 Lucio Gutiérrez’s (2002-2005) administration in Ecuador started as a coalition of three
parties, but ended with only one holding a cabinet portfolio. Because Gutiérrez’s coalition
partners left the government less than a year after he took office, I coded his administration
single party.
11 Presidential administrations that changed their status from minority to majority as a
result of non-concurrent legislative elections are: Leonel Fernández in the Dominican Republic
(2004-2008), Rafael Correa in Ecuador (2006-2009), Alberto Fujimori in Peru (1990-1995), and
Hugo Chávez in Venezuela (1998-2000). The last three attained majority following elections for
their respective Constituent Assemblies. Administrations whose status changed from majority to
minority after non-concurrent elections are: Carlos Menem and Nestor Kirchner in Argentina

21
legislative election. The information required to code these variables were extracted from the
Political Handbook of the World (several years), Nohlen’s (2005) data handbooks, and the
Keesing’s World News Archive.
Besides indicators of clarity of responsibility, the models also control for a dummy
variable indicating that the presidential election was held concurrently with a legislative election.
As I previously mentioned, Samuels (2004) and Samuels and Hellwig (2008) argue that voters
have higher opportunities to sanction incumbent candidates when elections for both branches are
held concurrently. The effective number of parties in the lower/single chamber was also included
as a control variable, because it may affect the government’s capacity to build majority coalitions
and pass its legislation. Finally, a control was included for presidents’ ideology, because it
affects the policies prioritized by the government, as well as citizens’ expectations about its
performance. My indicator of ideology ranges from one to twenty, and the higher it is, the more
to the right the president’s ideology is located. This indicator is entirely based on information
collected by Wiesehomeier and Benoit (2009).12
(respectively, 1995-1999 and 2003-2007), Hipólito Mejía in the Dominican Republic (2000-
2004), Rodrigo Borjas in Ecuador (1988-1992), Alfredo Cristiani in El Salvador (1989-1994),
and Ernesto Zedillo in Mexico (1994-2000).
12 Wiesehomeier and Benoit (2009) coded the ideology of the major Latin American
political parties in 2006/2007, based on expert surveys. Nearly all of the parties that governed
between 1990 and 2010 are included in the authors’ list, and my indicator of ideology is
operationalized as the value assigned to them in their dataset. For the thirteen cases (15.5% of the
sample) in which the president’s party is not in the list, I either left it as a missing case, entered
the value of a party founded by former members of the president’s party, entered the value of the
22
In the first model reported in Table 6, interactions account for the possibility that the
effect of CCT programs on elections is mediated by clarity of responsibility. Combining the
indicators of coalition and minority governments leads to four categories of political context:
single-party majority (twenty cases), single-party minority (twenty-nine cases), coalition
majority (twenty-three cases), and coalition minority (twelve cases). The first of these four
categories is characterized by the highest clarity of responsibility and is the one where the
electoral effect of CCT programs is most likely to be statistically significant. In the second
model, I included an interaction between coverage of CCT programs and the indicator of
electoral concurrence, leading to two categories of political context: one in which the presidential
and legislative elections are held concurrently (seventy cases) and one in which they are not
(fourteen cases). The first of these categories is the one in which voters have the best opportunity
to held incumbents accountable for their performance in office and where the effect of CCT
programs is most likely to be significant.
[TABLE 6 AND TABLE 6 (CONT.) ABOUT HERE]
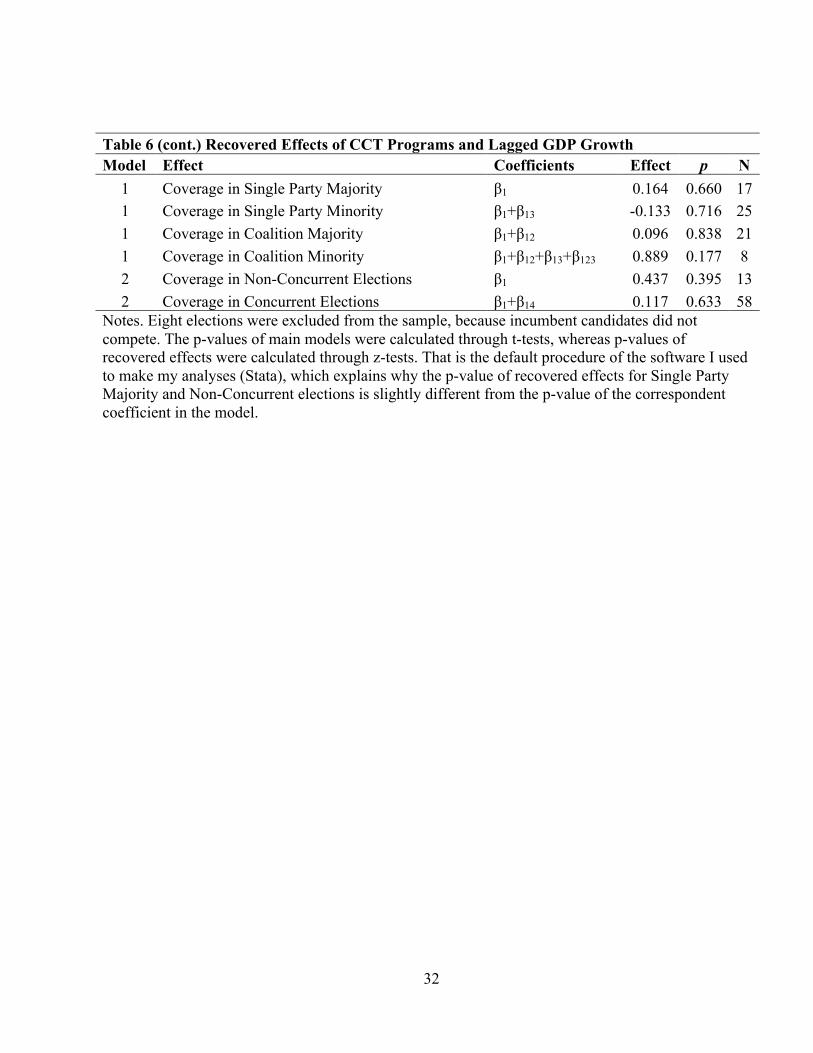
The recovered effects of CCT programs in each political context are reported in the
second part of the table. The crucial finding is that CCT programs are not significantly associated
with incumbents’ vote swings in any of them. All of the recovered effects failed to reach
largest party in the government coalition, or entered the value assigned to the president. Five of
these thirteen cases had already been excluded from my analysis, due to the fact that no
incumbent candidate competed. Specific information about these coding decisions are omitted
here to save space, but will be readily provided if requested.

23
statistical significance even at the 0.1 level. Regarding control variables, the only indicator of
economic performance that did not reach statistical significance is unemployment in the first
model. The effective number of parties and president’s ideology do not seem to have affected
incumbents’ performances either, but the latter variable was close to reach statistical significance
in the second model. The results reported above reaffirm that CCT programs do not affect
incumbents’ overall electoral performances, while the economy does
Restricting the analysis to universal CCT programs
Claims that CCT programs help incumbents to win elections have been based on
empirical evidence of countries that invested in large universal programs, such as Brazil,
Mexico, Colombia, and Uruguay. It is possible that universal programs are the only ones to have
had a significant pro-incumbent electoral effect in Latin America. If this is true, their effect
might have been masked in the models reported in Table 6, because the main explanatory
variable takes smaller geographically targeted programs into consideration. Although universal
programs are observed in all of the four political contexts subsumed in the first model of Table 6,
they do not amount to a large enough number of cases to produce meaningful estimates in
regressions with four interactions. Therefore, in the analysis reported below, countries are
divided in only two categories: single party majority (twenty cases) and all of the others (sixty-
four cases). If CCT programs really matter for incumbents’ electoral performances, presidents
who invest in them should perform electorally better than presidents who do not, at least under

24
circumstances of high clarity of responsibility. I also estimated a model interacting CCT
coverage with concurrence of elections, and the results are reported in Table 7.13
[TABLE 7 ABOUT HERE]
The models reported in the table show that universal CCT programs have not helped
incumbents to win elections in any kind of political context. The results reported in this and
previous sections represent a strong warning against common speculations that CCT programs’
help presidents to get reelected. The fact that the poor vote for incumbents who invest in these
programs does not mean that their chances of reelection increase.
Conclusion
Previous studies have provided strong empirical evidence that citizens receiving CCT
benefits vote for incumbents at higher rates. A direct and reasonable extrapolation from this
finding is the expectation that presidents who invest in CCT programs will perform better in the
next election relative to presidents who do not. I collected data for all of the eighty-four
presidential elections carried out in the Iberian America between 1990 and 2010, twenty-nine of
which followed administrations that invested in CCT programs. My results show that
investments in these programs are not associated with incumbents’ vote swings once we control
for economic variables. A significant electoral effect is not observed even in political contexts
13 If we restrict even more the main explanatory variable and include only the first
presidents to implement universal programs in each country, the coefficients reported in Table 7
change slightly, but lead to the same conclusions.
25
where voters supposedly have a higher ability and opportunity to hold incumbents accountable
for their deeds.
The results presented throughout this article rather create than solve puzzles. For
example, why would presidents invest massively in CCT programs if it does not benefit them
electorally? I can propose at least two reasons. First, incumbents may genuinely believe that
CCT programs pay off electorally, in the same way as everyone else does. Who would deny that
receiving extra cash from the government constitute a strong incentive for citizens to support
incumbents? I do not expect such a denial to be found among political scientists, the media, the
civil society, opposition leaders, or the actual government. On the other hand, the way non-
beneficiaries react to investments in these programs is less obvious, and this article is subtly
calling attention to it. Those who pay the costs of CCT programs might not be as satisfied with
this kind of investment as those who receive the benefits. If this is true or not, only future
research will tell. Digging deeper into the behavior of non-beneficiaries is the next step in the
major research project this article is articulated with.
Second, my results show that CCT programs neither help, nor hurt incumbents. Let us
assume that presidents care for the countries they govern, even if not as much as they care about
winning elections. Knowing that CCT programs improve enormously the living conditions of the
most vulnerable families in the population, why would presidents not invest in them? It will not
hurt their electoral prospects, after all. Moreover, in the most inegalitarian region of Earth,
redistributing income has reached the status of an emergency. In presidents’ psyche, solving an
urgent domestic problem may be among the top priorities, despite the fact that doing it will not
increase their vote share when the next election takes place. But I do not want to pretend to

26
understand the psyche of Latin American presidents. All I am capable of doing now is to
speculate and point possible directions to be followed by future research.
A second puzzle created by this article is the contradiction between my results and those
systematically found in country studies using subnational data. Zucco (2008), Canêdo-Pinheiro
(2009), and Nupia (2011), among other authors, included indicators of economic performance in
their analyses, but the explanatory power of these variables were found to be much weaker
compared to indicators of investments in CCT programs. The explanation for this contradiction
is probably the difference in the level of analysis. In subnational data, all units are under the
effect of the same incumbent, the same national economic performance, and the same national
CCT program. While the positive (negative) effects of a good (bad) national economic
performance are relatively balanced all across the country, targeted income redistribution implies
the transference of wealth from some areas to others. This potentially exacerbates the electoral
effects of CCT programs estimated at this level of analysis, at the same time that it blunts the
effects of the economy. In analyses of cross-national voting, each unit is affected by a different
incumbent, a different national CCT program, and a different economic environment.
Incumbents are expected to be punished where they do a bad job with the economy and rewarded
where they do not. Regarding targeted redistribution, within-country vote gains among
beneficiaries may be neutralized by vote losses among non-beneficiaries, and only the final
product of these counteracting effects, that is, the incumbent’s national vote share, enters the
dataset. The consequence is opposite to the one observed at the subnational level of analysis: the
effects of the economy are accentuated, while those of targeted redistribution are blunted. This is
an issue that certainly deserves much more attention than I am able to give here and that should
also be addressed by future research.

27
Tables
Table 1 - Number of Presidential Administrations that invested in CCT programs by country (01/01/1990 - 12/31/2010)
Country Total Terms
Invested in CCT Name of Current Program
Classification of Current Program
Argentina 4 2 (50%) Asignación Universal por Hijo Universal Bolivia 5 1 (20%) Juancito Pinto / Juana Azurduy Universal Brazil 5 3 (60%) Bolsa Família Universal Chile 4 2 (50%) Chile Solidario Universal Colombia 6 3 (50%) Familias en Acción Universal Costa Rica 6 1 (17%) Avancemos Universal Dom. Republic 6 1 (17%) Solidaridad Universal Ecuador 6 2 (33%) Bono de Desarrollo Humano Universal El Salvador 4 1 (25%) Comunidades Solidarias Geo-Targeted Guatemala (*) 5 0 (0%) Mi Familia Progresa Geo-Targeted Honduras 5 5 (100%) PRAF Geo-Targeted Mexico 3 2 (67%) Oportunidades Universal Nicaragua (**) 4 2 (50%) NA NA Panama 4 1 (25%) Red de Oportunidades Universal Paraguay 4 1 (25%) Tekoporã Geo-Targeted Peru 5 1 (20%) Juntos Geo-Targeted Uruguay 4 1 (25%) Asignaciones Familiares Universal Venezuela 4 0 (0%) NA NA Total 84 29 (34.5%) (*) The Mi Familia Progresa program was implemented in 2008, after the last Guatemalan presidential election of my sample. (**) The Nicaraguan Red de Protección Social operated from 2000 to 2006 and was discontinued by President Bolaños. Note. "Total Terms" indicates the number of presidential administrations subsumed in the dataset; "Invested in CCT" indicates the number and proportion of them that invested CCT programs; "Name of Current Program" indicates the name of the national CCT program(s), as of 12/31/2010; and "Classification of the Current Program" indicates the way I classify current programs based on criteria described further in this section.

28
Table 2 - Estimated Coverage (% of population) in Election Years Country Year Name of the Program Coverage Argentina 2003 Ingreso de Desarrollo Humano 2% Argentina 2007 Plan Familias 4.5% Colombia 2002 Familias en Acción 3.5% Colombia 2006 Familias en Acción 4.5% El Salvador 2009 Red Solidaria 6.5% Honduras 1993 Programa de Asignación Familiar (PRAF) 6% Honduras 1997 PRAF 4% Honduras 2001 PRAF/PRAF-II 8.1% Honduras 2005 PRAF/PRAF-II 9.5% Honduras 2009 PRAF/PRAF-III 10% Mexico 2000 PROGRESA 11.15% Nicaragua 2001 Red de Protección Social 1% Nicaragua 2005 Red de Protección Social 2.5% Paraguay 2008 Tekoporã 0.5% Peru 2006 Juntos 1% Bolivia 2009 Juancito Pinto/Juana Azurduy 22% (*) Brazil 2002 Bolsa Escola/Alimentação 11% Brazil 2006 Bolsa Família 19.5% Brazil 2010 Bolsa Família 22.25% Chile 2005 Chile Solidario 4% Chile 2009 Chile Solidario/Chile Crece Contigo 5% Colombia 2010 Familias en Acción 22.5% Costa Rica 2010 Avancemos 13% Dom. Republic 2008 Solidaridad 17% Ecuador 2006 Bono de Desarrollo Humano 31% Ecuador 2009 Bono de Desarrollo Humano 34.5% Mexico 2006 Oportunidades 19.5% Panama 2009 Red de Oportunidades 8.5% Uruguay 2009 Asignaciones Familiares 14% (*) Bolivia's estimate is total number of grantees divided by the population, because the government does not publish the number of beneficiary families as all the other countries do. The coverage of its programs is, therefore, highly underestimated in the table. Notes. Geographically targeted and universal programs are listed in the first and second halves of the table, respectively. All estimates are based on official CCT statistics and census data, except for Honduras and Nicaragua. Official CCT statistics for these two countries are lacking, and their estimates are based on data collected from IADB and ECLAC documents. For dates and sources, refer to Appendix A.
29
Table 3 - Electoral Performance of Incumbent Candidates in Latin America
Subsamples N Average Vote
Swing Reelection
Rate Did not invest in CCT Programs 49 -10.51 pp 42.86% Invested in any kind of CCT Programs 27 -5.32 pp 51.85% Invested in geographically-targeted CCT Programs 13 -7.69 pp 30.77% Invested in universal CCT Programs 14 -3.12 pp 71.43% First to invest in universal CCT Program 10 -5.69 pp 70.00% Whole Sample 76 -8.67 pp 46.05% Note: Eight elections were excluded, because incumbent candidates did not compete.
Table 4 - OLS Models: Dependent Variable is Vote Swing of Incumbent Candidate
Model 1 Model 2 Model 3 Model 4
Variable β p β p β p β p Coverage of CCT program 0.400 0.047 0.155 0.449 0.211 0.286 0.160 0.427 GDP Growth
-0.001 0.906
Log of Inflation
-0.054 0.019 Unemployment
-0.014 0.005
Lagged GDP Growth
0.009 0.027 Log of Lagged Inflation
-0.038 0.130
Lagged Unemployment
-0.009 0.045 Average GDP Growth
0.020 0.009
Log-Average Inflation
-0.031 0.296 Average Unemployment
-0.011 0.018
Incumbent Candidate is the President 0.118 0.003 0.181 0.000 0.154 0.000 0.169 0.000 President's vote share in previous election -0.380 0.004 -0.424 0.001 -0.355 0.006 -0.343 0.007 Constant 0.047 0.448 0.245 0.006 0.123 0.190 0.089 0.364 N 76
71
71
73
Adj. R-squared 0.21
0.31 0.36 0.33 Notes. Inflation rates are logged to reduce the influence of hyperinflation in the early 1990s. Eight elections were excluded from all models, because incumbent candidates did not compete.
30
Table 5 - OLS Models: Dependent Variable is Vote Swing of Incumbent Candidate
Model 1 Model 2
Variable β p β p Expansion of CCT Coverage 0.276 0.307 0.060 0.810 Difference in Average GDP Growth
0.013 0.036
Difference in Average Log of Inflation
-0.072 0.010 Difference in Average Unemployment
-0.006 0.373
Incumbent Candidate is the President 0.126 0.002 0.099 0.016 President's vote share in previous election -0.400 0.003 -0.259 0.062 Constant 0.064 0.308 0.003 0.966 N 76
69
Adj. R-squared 0.18
0.32 Notes. Inflation rates are logged to reduce the influence of hyperinflation in the early 1990s. Eight elections were excluded from all models, because incumbent candidates did not compete. Other seven elections were excluded in Model 2 for lack of data on Difference in Average Unemployment. The three economic variables were operationalized as averages for current administration minus average for previous administration.

31
Table 6 - OLS Models: Dependent Variable is Incumbent's Vote Swing
Model 1 Model 2
Variable β p β p β1 CCT Coverage 0.164 0.662 0.437 0.398 β2 Coalition government -0.038 0.055
β3 Minority government 0.007 0.049 β4 Concurrent Elections
-0.019 0.654
β12 CCT Coverage × Coalition -0.068 0.589 β13 CCT Coverage × Minority -0.297 0.515 β23 Coalition × Minority -0.091 0.077 β123 CCT Coverage × Coalition × Minority 1.090 0.859 β14 CCT Coverage × Concurrent Elections
-0.320 0.583
β5 Lagged GDP growth 0.008 0.057 0.007 0.085 β6 Log of Lagged Inflation -0.050 0.097 -0.063 0.030 β7 Lagged Unemployment -0.007 0.173 -0.012 0.019 β8 Effective number of parties -0.004 0.757 -0.012 0.219 β9 Ideology -0.006 0.180 -0.007 0.119 βA President is the incumbent candidate 0.128 0.010 0.152 0.001 βB President's vote share in the previous election -0.456 0.004 -0.424 0.003 β0 Constant 0.296 0.084 0.361 0.031
N 71 71
Adjusted R-squared 0.36 0.35
32
Table 6 (cont.) Recovered Effects of CCT Programs and Lagged GDP Growth Model Effect Coefficients Effect p N
1 Coverage in Single Party Majority β1 0.164 0.660 17 1 Coverage in Single Party Minority β1+β13 -0.133 0.716 25 1 Coverage in Coalition Majority β1+β12 0.096 0.838 21 1 Coverage in Coalition Minority β1+β12+β13+β123 0.889 0.177 8 2 Coverage in Non-Concurrent Elections β1 0.437 0.395 13 2 Coverage in Concurrent Elections β1+β14 0.117 0.633 58
Notes. Eight elections were excluded from the sample, because incumbent candidates did not compete. The p-values of main models were calculated through t-tests, whereas p-values of recovered effects were calculated through z-tests. That is the default procedure of the software I used to make my analyses (Stata), which explains why the p-value of recovered effects for Single Party Majority and Non-Concurrent elections is slightly different from the p-value of the correspondent coefficient in the model.

33
Table 7 - OLS Models: Dependent Variable is Incumbent's Vote Swing
Model 1 Model 2
Variable β p β p β1 CCT Coverage 0.049 0.873 0.289 0.566 β2 Single Party Majority Government 0.016 0.722
β3 Concurrent Elections
-0.022 0.601 β12 CCT Coverage × Single Party Majority 0.121 0.797
β13 CCT Coverage × Concurrent Elections
-0.214 0.710 β4 Lagged GDP growth 0.008 0.047 0.007 0.084 β5 Log of Lagged Inflation -0.060 0.044 -0.064 0.029 β6 Lagged Unemployment -0.010 0.036 -0.012 0.017 β7 Effective number of parties -0.006 0.606 -0.011 0.266 β8 Ideology -0.005 0.187 -0.007 0.130 β9 President is the incumbent candidate 0.143 0.003 0.155 0.001 βA President's vote share in the previous election -0.382 0.008 -0.415 0.004 β0 Constant 0.264 0.072 0.359 0.033
N 71 71
Adjusted R-squared 0.34 0.35 Recovering the Effect of CCT Programs and Lagged GDP Growth Model Effect Coefficients Effect p
1 Coverage in Single Party Majority β1+β12 0.170 0.639 1 Coverage in Less Clear Contexts β1 0.049 0.873 2 Coverage in Non-Concurrent Elections β1 0.289 0.564 2 Coverage in Concurrent Elections β1+β13 0.075 0.770
Notes. Eight elections were excluded from the sample, because incumbent candidates did not compete.
34
References
Anderson, Christopher
1995 Blaming the government: citizens and the economy in five European democracies.
New York, NY: M.E. Sharpe.
2000 “Economic voting and political context: a comparative perspective.” Electoral
Studies 19(2–3): 151–170.
2007 “The End of Economic Voting? Contingency Dilemmas and the Limits of
Democratic Accountability.” Annual Review of Political Science 10(1): 271–296.
Bohn, Simone R.
2011 “Social Policy and Vote in Brazil: Bolsa Família and the Shifts in Lula’s Electoral
Base” Latin American Research Review 46(1): 54-79.
Canêdo-Pinheiro, Maurício
2009 “Bolsa Família ou Desempenho da Economia? Determinantes da Reeleição de
Lula em 2006.” Paper Presented at the XXXVII Encontro Nacional de Economia.
Foz do Iguaçu. Brazil.
De la O, Ana L.
2013 “Do Conditional Cash Transfers Affect Electoral Behavior? Evidence from a
Randomized Experiment in Mexico.” American Journal of Political Science
57(1): 1-14.

35
Díaz-Cayeros, Alberto, Federico Estévez, and Beatriz Magaloni
2009 “Welfare Benefits, Canvassing, and Campaign Handouts.” In Consolidating
Mexico’s Democracy: The 2006 Presidential Campaign in Comparative
Perspective, edited by Jorge Domínguez, Chappell Lawson, and Alejandro
Moreno, 229-245. Baltimore, MD: The Johns Hopkins University Press.
Duch, Raymond M., and Randolph T. Stevenson
2008 The Economic Vote: How Political and Economic Institutions Condition Election
Results. New York, NY: Cambridge University Press.
Hellwig, Timothy, and David Samuels
2008 “Electoral Accountability and the Variety of Democratic Regimes.” British
Journal of Political Science 38(1): 65-90
Hunter, Wendy, and Timothy J. Power
2007 “Rewarding Lula: Executive Power, Social Policy, and the Brazilian Elections of
2006.” Latin American Politics & Society 49(1): 1–30.
Layton, Matthew L., and Erica S. Smith
2011 “Social Assistance Policies and the Presidential Vote in Latin America.”
AmericasBarometer Insights (66).
Lewis-Beck, Michael S., and Mary Stegmaier
2000 “Economic Determinants of Electoral Outcomes.” Annual Review of Political
Science 3(1): 183–219.
Licio, Elaine C., Lucio R. Rennó, and Henrique C. O. Castro
2009 “Bolsa Família e Voto na Eleição Presidencial de 2006: Em Busca do Elo
Perdido.” Opinião Pública 15(1): 31–54.

36
Manacorda, Marco, Edward Miguel, and Andrea Vigorito
2011 “Government Transfers and Political Support.” American Economic Journal:
Applied Economics 3(3): 1–28.
Marques, Rosa M., et al.
2009 “Discutindo o Papel do Programa Bolsa Família na Decisão das Eleições
Presidenciais Brasileiras de 2006.” Revista de Economia Política 29(1): 114–132.
McDonald, Michael D., and Ian Budge
2005 Elections, Parties, Democracy: Conferring the Median Mandate. New York, NY:
Oxford University Press.
Nannested, Peter, and Martin Paldam
1994 “The VP-function: A survey of the literature on vote and popularity functions
after 25 years.” Public Choice 79(3/4): 213–245.
2002 “The Cost of Ruling: a Foundation Stone for Two Theories.” In Economic Voting,
London and New York, NY: Routledge/ECPR, p. 17–44.
Nicolau, Jairo, and Vitor Peixoto
2007 “As bases municipais da votação de Lula em 2006.” In Cadernos do Fórum
Nacional, 5, Rio de Janeiro, Brazil: Instituto Nacional de Altos Estudos. Fórum
Nacional, p. 15–25.
Nohlen, Dieter
2005a Elections in the Americas: North America, Central America, and the Caribbean.
New York, NY: Oxford University Press.
2005b Elections in the Americas: South America. New York, NY: Oxford University
Press.
37
Nupia, Oskar
2011 “Anti-Poverty Programs and Presidential Election Outcomes: Familias En Acción
in Colombia.” Documents CEDE. ISSN 1657-5334. Universidad de los Andes.
Bogotá, Colombia.
Paldam, Martin
1991 “How Robust Is the Vote Function? A Study of Seventeen Nations over Four
Decades.” In Economics and Politics: The Calculus of Support, edited by Helmuth
Norpoth, Michael S. Lewis-Beck, and Jean-Dominique Lafay, 9-31. Ann Arbor -
MI: The University of Michigan Press.
Powell. Jr., G. Bingham, and Guy D. Whitten
1993 “A cross-national analysis of economic voting: Taking account of the political
context.” American Journal of Political Science 37(2): 391-414.
Queirolo, Rosario
2010 “El Rol de los Programas de Transferencias Monetarias en la Reelección del
Frente Amplio en 2009.” In Del Cambio a la Continuidad: Ciclo Electoral 2009-
2010 en Uruguay, edited by Daniel Buquet and Niki Johnson, 195-212,
Montevideo, Uruguay: Editorial Fin de Siglo, CLACSO & ICP.
Remmer, Karen L.
1991 “The Political Impact of Economic Crisis in Latin America in the 1980s.”
American Political Science Review 85(3): 777-800.
Samuels, David
2004 “Presidentialism and Accountability for the Economy in Comparative
Perspective” American Political Science Review 98(3): 425-436.

38
Samuels, David, and Timothy Hellwig
2010 “Electoral Accountability and the Clarity of Responsibility: A Conceptual and
Empirical Reassessment.” Journal of Elections, Public Opinion, and Parties 20(4):
393-414
Schneider, Friederich, and Bruno S. Frey
1988 “Politico-Economic Models of Macroeconomic Policy: A Review of Empirical
Evidence.” In Political Business Cycles: The Political Economy of Money,
Inflation, and Unemployment, edited by Thomas Willett, 239-275. Durham, NC:
Duke University Press.
Shikida, Claudio D., et al.
2009 “‘It is the economy, companheiro!’: an empirical analysis of Lula’s re-election
based on municipal data” Economics Bulletin 29(2): 977-992
Serdán, Alberto
2006 “Programas Sociales y Elecciones: Análisis de los Programas de Combate a la
Pobreza en Contextos Electorales Durante la Administración de Vicente Fox.”
Avances y Retrocesos, una Evaluación Ciudadana del Sexenio 2000-2006 (5)
Fundar, Centro de Análisis e Investigación. México DF.
Soares, Gláucio A. D., and Sonia L. Terron
2008 “Dois Lulas: A Geografia Eleitoral da Reeleição (Explorando Conceitos, Métodos
e Técnicas de Análise Geoespacial).” Opinião Pública 14(2): 269–301.
Wiesehomeier, Nina, and Kenneth Benoit
2009 “Presidents, Parties, and Policy Competition.” The Journal of Politics 71(4): 1435-
1447.
39
Zucco, Cesar
2008 “The President’s ‘New’ Constituency: Lula and the Pragmatic Vote in Brazil’s
2006 Presidential Elections.” Journal of Latin American Studies 40(1): 29–49.
2013 “When Pay Outs Pay Off: Conditional Cash Transfers and Voting Behavior in
Brazil 2002-2010.” American Journal of Political Science (forthcoming).

40
Appendix A - Sources and dates of information on CCT programs
Argentina
2003: Ministerio de Desarrollo Social
10/2007: Ministerio de Desarrollo Social (Resumen Ejecutivo 2007).
Bolivia
2009: Juancito Pinto: Ministerio de Educación
Juana Azurduy: Ministerio de Salud e Deportes (Logros 2009)
Note. Only the number of granted women and children is published, and not the number
of households.
Brazil
07/2002: Bolsa Escola: Sistema Bolsa Escola (SIBES) – Ministério da Educação
Bolsa Alimentação: Ministério da Saúde
12/2006: Ministério de Desenvolvimento Social e Combate à Fome
12/2010: Ministério de Desenvolvimento Social e Combate à Fome
Chile
2005: Secretaría Ejecutiva del Chile Solidario, Ministerio de Planificación
05/2009: Ministerio de Planificación.

41
Colombia
12/2002: Agencia Presidencial para la Acción Social y para la Cooperación Internacional
06/2006: Agencia Presidencial para la Acción Social y para la Cooperación Internacional
06/30/2010: Agencia Presidencial para la Acción Social y para la Cooperación
Internacional
Costa Rica
12/31/2009: Instituto Mixto de Ayuda Social
Dominican Republic
05/2008: Programa Solidaridad: Nómina de Beneficiários 05/2008
Ecuador
10/2006: Ministerio de Inclusion Económica y Social (Programa de Protección Social)
04/2009: Ministerio de Inclusion Económica y Social (Programa de Protección Social)
El Salvador
03/2009: Fondo de Inversión Social para el Desarrollo Local
Guatemala
04/31/2011: Mi Familia Progresa, Consejo de Cohesión Social
42
Honduras
1993: Inter-American Development Bank (11/10/1998 Loan Proposal)
1997: Inter-American Development Bank (11/10/1998 Loan Proposal)
2001: Economic Commission for Latin America and the Caribbean, United Nations
2005: Economic Commission for Latin America and the Caribbean, United Nations
2009: Economic Commission for Latin America and the Caribbean, United Nations
Mexico
05-06/2000: Secretaría de Desarrollo Social
05-06/2006: Secretaría de Desarrollo Social
Nicaragua
2001: Inter-American Development Bank (Informe de Terminación de Proyecto – Red de
Protección Social, Fase 1)
2006: Moore (2009). “Nicaragua’s Red de Protección Social: An Exemplary but Short-
Lived Conditional Cash Transfer Programme”. International Policy Centre for Inclusive Growth,
United Nations. Country Study 17.
Panama
2009: Ministerio de Desarrollo Social (Avance al Mes de Julio de 2010)
43
Paraguay
12/2007: Contraloría General de la Republica (Audit Report)
Peru
04/2006: Programa Juntos, Portal de Transparencia (Plan Operativo 2008)
03-04/2011: Programa Juntos, Porta de Transparencia (Plan Operativo 2011
Reformulado)
Uruguay
01-03/2009: Ministerio de Desarrollo Social, Observatorio Social de Programas e
Indicadores
44
Appendix B - Sources of information on presidential elections
Argentina: Ministerio del Interior (all elections).
Bolivia: Tribunal Supremo Electoral (all elections).
Brazil: Tribunal Superior Eleitoral (1994, 1998, 2002, 2006, 2010), Elections in the
Americas: A Data Handbook (1989).
Chile: Servicio Electoral (all elections).
Colombia: Source: Registraduría Nacional del Estado Civil (1998, 2002, 2006, 2010);
Elections in the Americas: A Data Handbook (1982, 1986, 1990, 1994).
Costa Rica: Tribunal Supremo de Elecciones (all elections).
Dominican Republic: Junta Central Electoral (all elections).
Ecuador: Consejo Nacional Electoral (2002, 2006, 2009); Elections in the Americas: A
Data Handbook (1984, 1988, 1992, 1996, 1998).
El Salvador: Tribunal Supremo Electoral (1994, 1999, 2004, 2009); Elections in the
Americas: A Data Handbook (1984, 1989).
Guatemala: Tribunal Supremo Electoral (1999, 2003, 2007); Elections in the Americas: A
Data Handbook (1982, 1985, 1990, 1995).
Honduras: Tribunal Supremo Electoral (all elections).
Mexico: Instituto Federal Electoral (1994, 2000, 2006); Elections in the Americas: A
Data Handbook (1982, 1988).
Nicaragua: Consejo Supremo Electoral (2001, 2006); Elections in the Americas: A Data
Handbook (1984, 1990, 1996).
45
Panama: Tribunal Electoral (1994, 1999, 2004, 2009), Elections in the Americas: A Data
Handbook (1989).
Paraguay: Justicia Electoral (1998, 2003, 2008); Elections in the Americas: A Data
Handbook (1989, 1993).
Peru: Oficina Nacional de Procesos Electorales (all elections).
Uruguay: Corte Electoral (all elections).
Venezuela: Consejo Nacional Electoral (all elections).