ccss math 1b
TRANSCRIPT
CCSS Math 1B
1. Algebra
1.1. Seeing structure in expressions 1.2. Reasoning with equations and inequalities
2. Functions 2.1. Linear, Quadratic, and Exponential Models
3. Statistics and Probability 3.1. Interpreting categorical and quantitative data
4. Geometry 4.1. Expressing geometric properties with equations 4.2. Congruence
CCSS Math 1B is part 2 of the the first course in a sequence of courses designed to provide students with a rigorous program of study in mathematics. Course content includes a continued focus on linear and exponential relationships, descriptive statistics, congruence, proof, constructions as well as connecting Algebra and Geometry through coordinates.The course is designed to remain fluid to adapt to student needs as well as provide teaching strategies that allow students more time to learn math. This approach to learning should include, but is not limited to, in-depth, hands-on opportunities for students to solve problems. Students who successfully complete CCSS Math 1A should enroll in CCSS Math 1B and will take the Integrated Mathematics 1 Performance-Based Assessment (PBA) and the End-of-Year Assessment (EOY) at the end of CCSS Math 1B course. Teacher recommendation required. For the CCSS Math 1A/Math 1B course, curriculum and instruction has been modified so that a CCSS Math 1 is a two-year course. The content will be rigorous as defined by the New Learning Standards. The teacher will use teaching strategies that allows students more time to learn math differently. This approach to learning should include, but is not limited to, in-depth, hands-on opportunities for students to solve problems. Students achieve the same expected understanding of mathematics as in a traditional one-year math class.
Approximate Math 1B topic timeline:
1st Quarter - ● Teachers should understand each student's current instructional level and prepare
appropriate intervention. ● Review linear equations and introduce reasoning with equations and inequalities.
2nd Quarter -
1
CCSS Math 1B
● Exploration of functions with an emphasis on the linear and exponential functions. Students will explore systems of equations
3rd Quarter -
● Data analysis interpreting categorical and quantitative data including standard deviation.
4th Quarter -
● Expressing geometric properties with equations and investigating congruence topics.
Standards of Mathematical Practice
Mathematically proficient students: 1. Make sense of problems and persevere in solving them. 2. Reason abstractly and quantitatively. 3. Construct viable arguments and critique the reasoning of others. 4. Model with mathematics 5. Use appropriate tools strategically. 6. Attend to precision. 7. Look for and make use of structure. 8. Look for and express regularity in repeated reasoning.
From the K-8 Math Standards Progression. Key Advances from Grades K-8
● Students build on previous work with solving linear equations and systems of linear equations in two ways: (a) They extend to more formal solution methods, including attending to the structure of linear expressions, and (b) they solve linear inequalities.
● Students formalize their understanding of the definition of a function, particularly their understanding of linear functions, emphasizing the structure of linear expressions. Students also begin to work on exponential functions, comparing them to linear functions.
● Work with congruence and similarity motions that started in grades 6-8 progresses. Students also consider sufficient conditions for congruence of triangles.
● Work with the bivariate data and scatter plots in grades 6-8 is extended to working with lines of best fit.
Fluency Recommendations
A/G High school students should become fluent in solving characteristic problems involving the analytic geometry of lines, such as finding the equation of a line given a point and a slope. This fluency can support students in solving less routine mathematical
2

CCSS Math 1B
problems involving linearity, as well as in modeling linear phenomena (including modeling using systems of linear inequalities in two variables). G HIgh school students should become fluent in using geometric transformation to represent relationships among geometric objects. This fluency provides a powerful tool for visualizing relationships, as well as a foundation for exploring ideas both within geometry (e.g., symmetry) and outside of geometry (e.g., transformations of graphs). S Students should be able to create a visual representation of a data set that is useful in understanding possible relationships among variables.
3
CCSS Math 1B
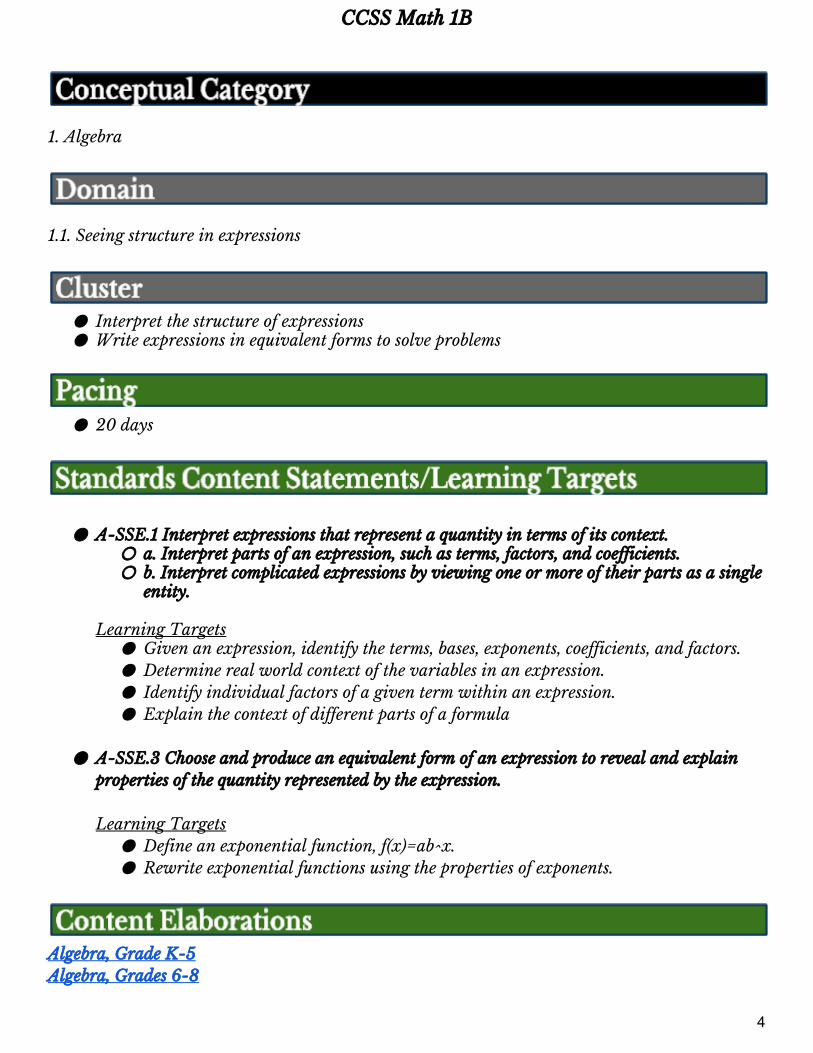
1. Algebra
1.1. Seeing structure in expressions
● Interpret the structure of expressions ● Write expressions in equivalent forms to solve problems
● 20 days
● A-SSE.1 Interpret expressions that represent a quantity in terms of its context. ○ a. Interpret parts of an expression, such as terms, factors, and coefficients. ○ b. Interpret complicated expressions by viewing one or more of their parts as a single
entity. Learning Targets
● Given an expression, identify the terms, bases, exponents, coefficients, and factors. ● Determine real world context of the variables in an expression. ● Identify individual factors of a given term within an expression. ● Explain the context of different parts of a formula
● A-SSE.3 Choose and produce an equivalent form of an expression to reveal and explain
properties of the quantity represented by the expression.
Learning Targets ● Define an exponential function, f(x)=ab^x. ● Rewrite exponential functions using the properties of exponents.
Algebra, Grade K-5 Algebra, Grades 6-8
4
CCSS Math 1B
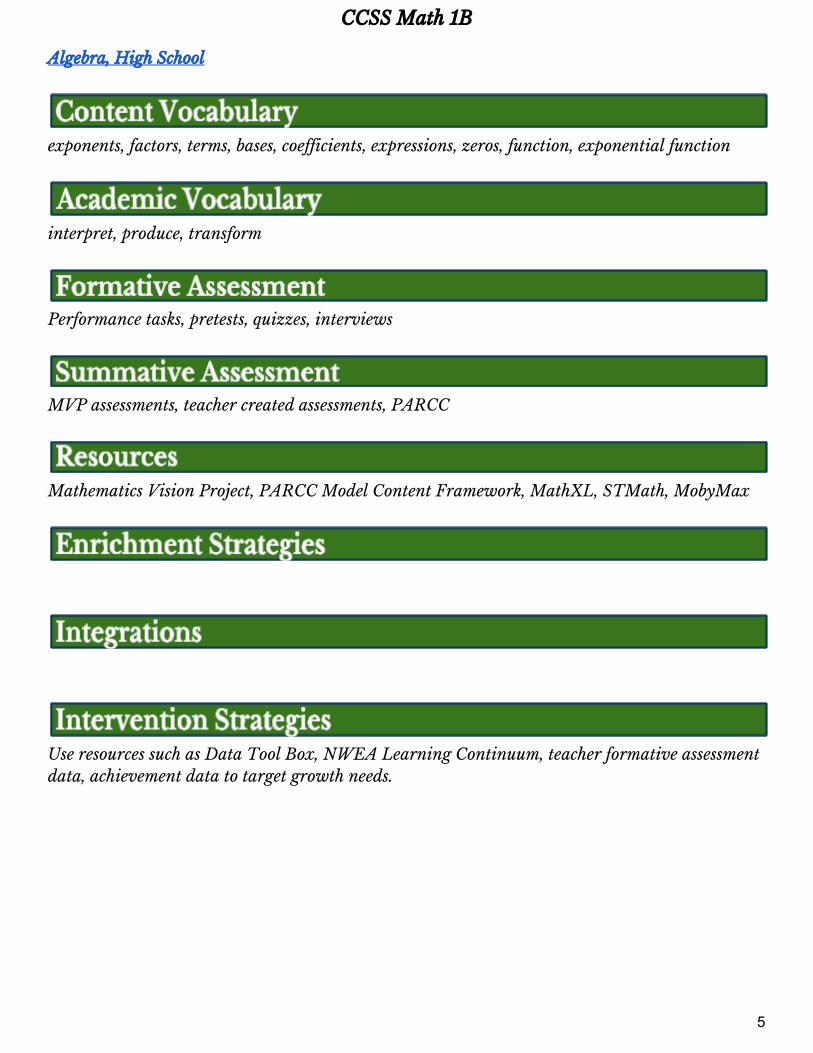
Algebra, High School
exponents, factors, terms, bases, coefficients, expressions, zeros, function, exponential function
interpret, produce, transform
Performance tasks, pretests, quizzes, interviews
MVP assessments, teacher created assessments, PARCC
Mathematics Vision Project, PARCC Model Content Framework, MathXL, STMath, MobyMax
Use resources such as Data Tool Box, NWEA Learning Continuum, teacher formative assessment data, achievement data to target growth needs.
5
CCSS Math 1B
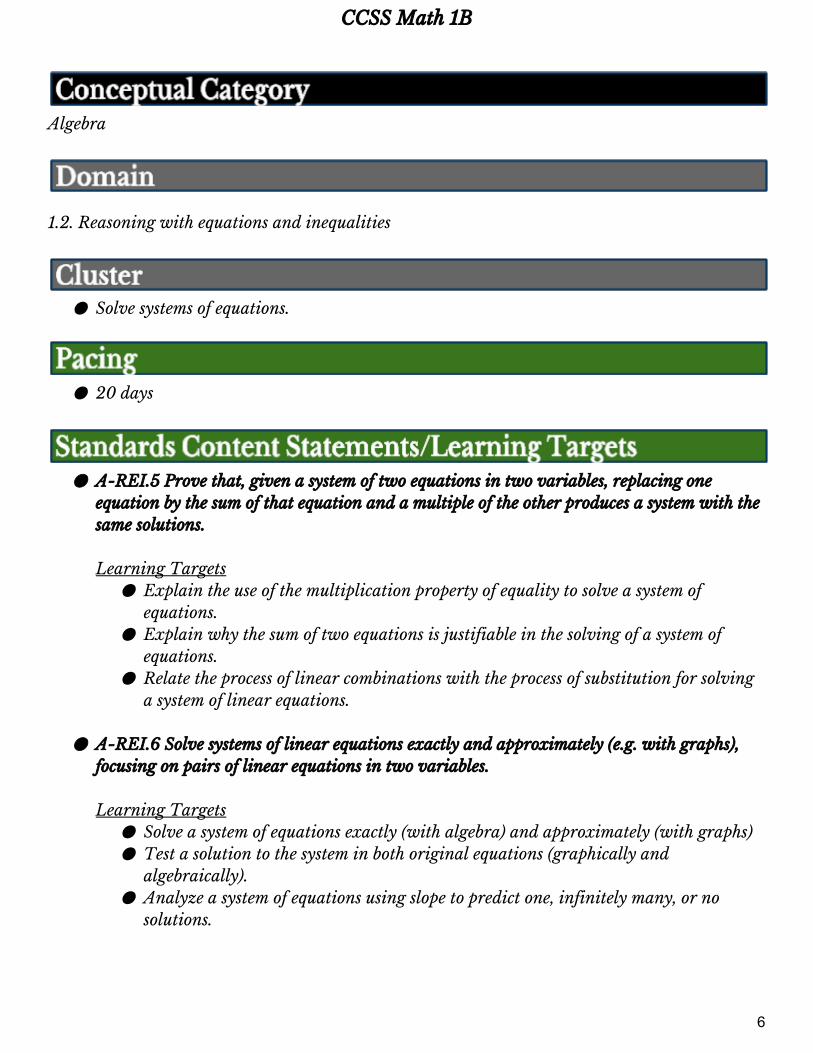
Algebra
1.2. Reasoning with equations and inequalities
● Solve systems of equations.
● 20 days
● A-REI.5 Prove that, given a system of two equations in two variables, replacing one
equation by the sum of that equation and a multiple of the other produces a system with the same solutions.
Learning Targets
● Explain the use of the multiplication property of equality to solve a system of equations.
● Explain why the sum of two equations is justifiable in the solving of a system of equations.
● Relate the process of linear combinations with the process of substitution for solving a system of linear equations.
● A-REI.6 Solve systems of linear equations exactly and approximately (e.g. with graphs),
focusing on pairs of linear equations in two variables.
Learning Targets ● Solve a system of equations exactly (with algebra) and approximately (with graphs) ● Test a solution to the system in both original equations (graphically and
algebraically). ● Analyze a system of equations using slope to predict one, infinitely many, or no
solutions.
6
CCSS Math 1B
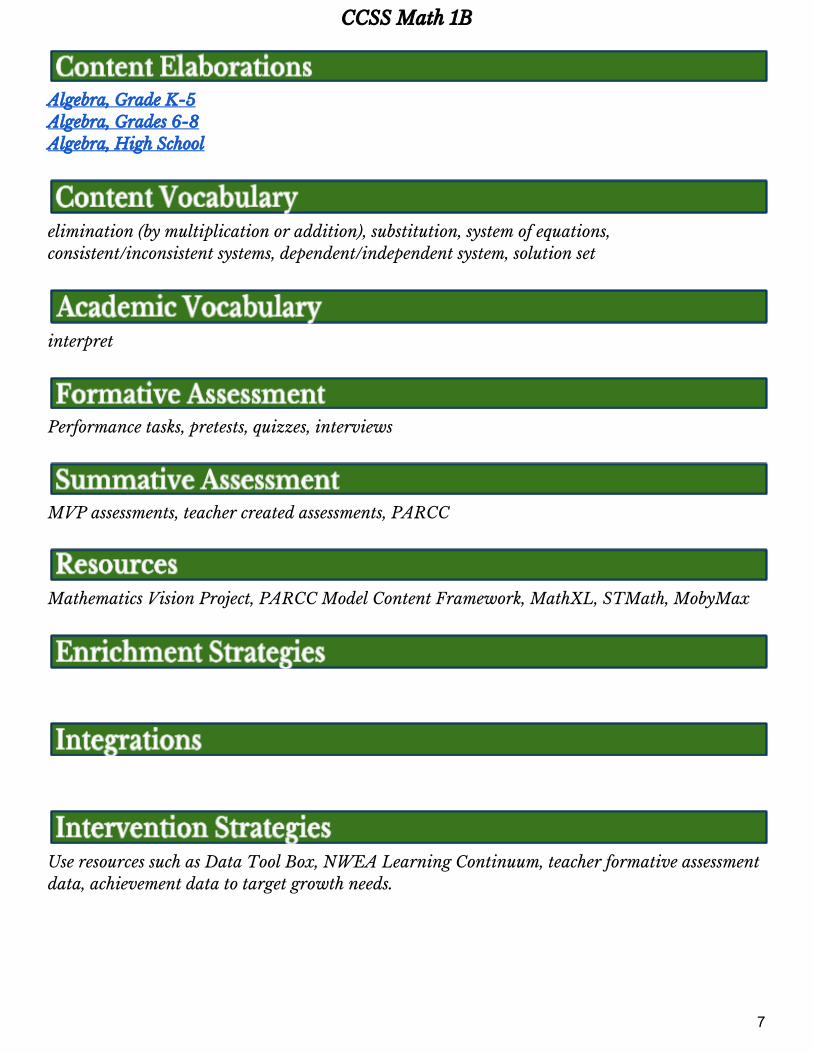
Algebra, Grade K-5 Algebra, Grades 6-8 Algebra, High School
elimination (by multiplication or addition), substitution, system of equations, consistent/inconsistent systems, dependent/independent system, solution set
interpret
Performance tasks, pretests, quizzes, interviews
MVP assessments, teacher created assessments, PARCC
Mathematics Vision Project, PARCC Model Content Framework, MathXL, STMath, MobyMax
Use resources such as Data Tool Box, NWEA Learning Continuum, teacher formative assessment data, achievement data to target growth needs.
7
CCSS Math 1B
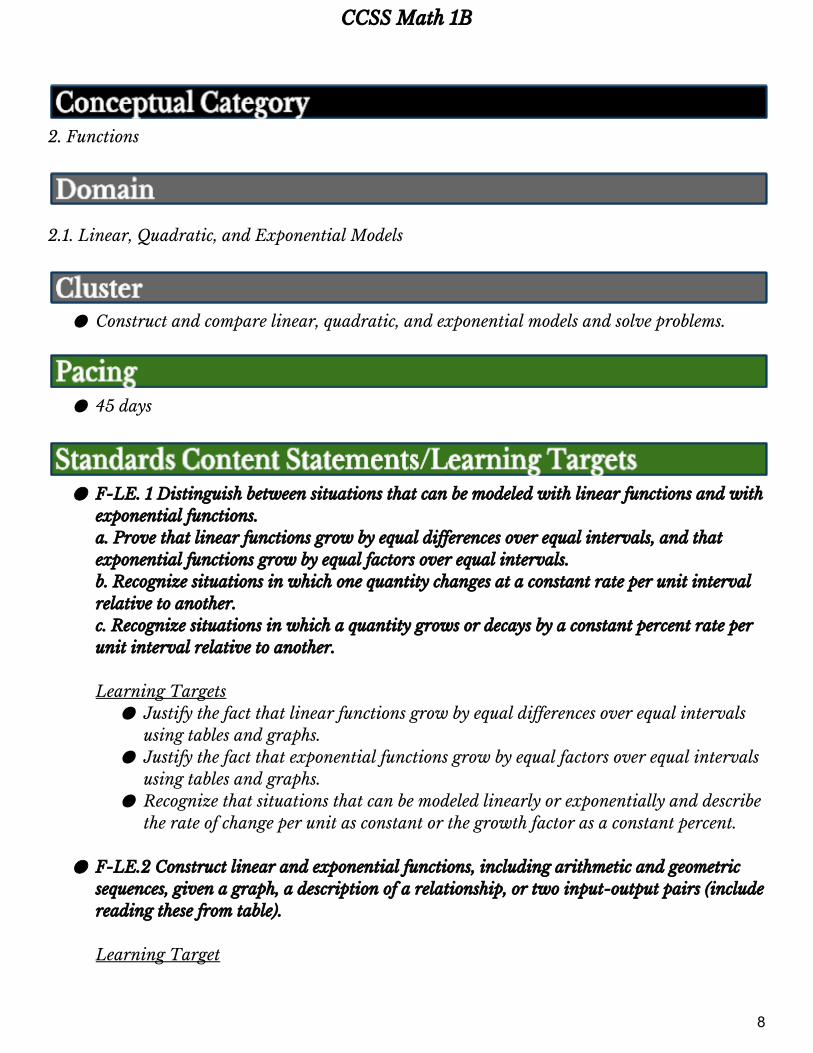
2. Functions
2.1. Linear, Quadratic, and Exponential Models
● Construct and compare linear, quadratic, and exponential models and solve problems.
● 45 days
● F-LE. 1 Distinguish between situations that can be modeled with linear functions and with
exponential functions. a. Prove that linear functions grow by equal differences over equal intervals, and that exponential functions grow by equal factors over equal intervals. b. Recognize situations in which one quantity changes at a constant rate per unit interval relative to another. c. Recognize situations in which a quantity grows or decays by a constant percent rate per unit interval relative to another. Learning Targets
● Justify the fact that linear functions grow by equal differences over equal intervals using tables and graphs.
● Justify the fact that exponential functions grow by equal factors over equal intervals using tables and graphs.
● Recognize that situations that can be modeled linearly or exponentially and describe the rate of change per unit as constant or the growth factor as a constant percent.
● F-LE.2 Construct linear and exponential functions, including arithmetic and geometric
sequences, given a graph, a description of a relationship, or two input-output pairs (include reading these from table).
Learning Target
8
CCSS Math 1B
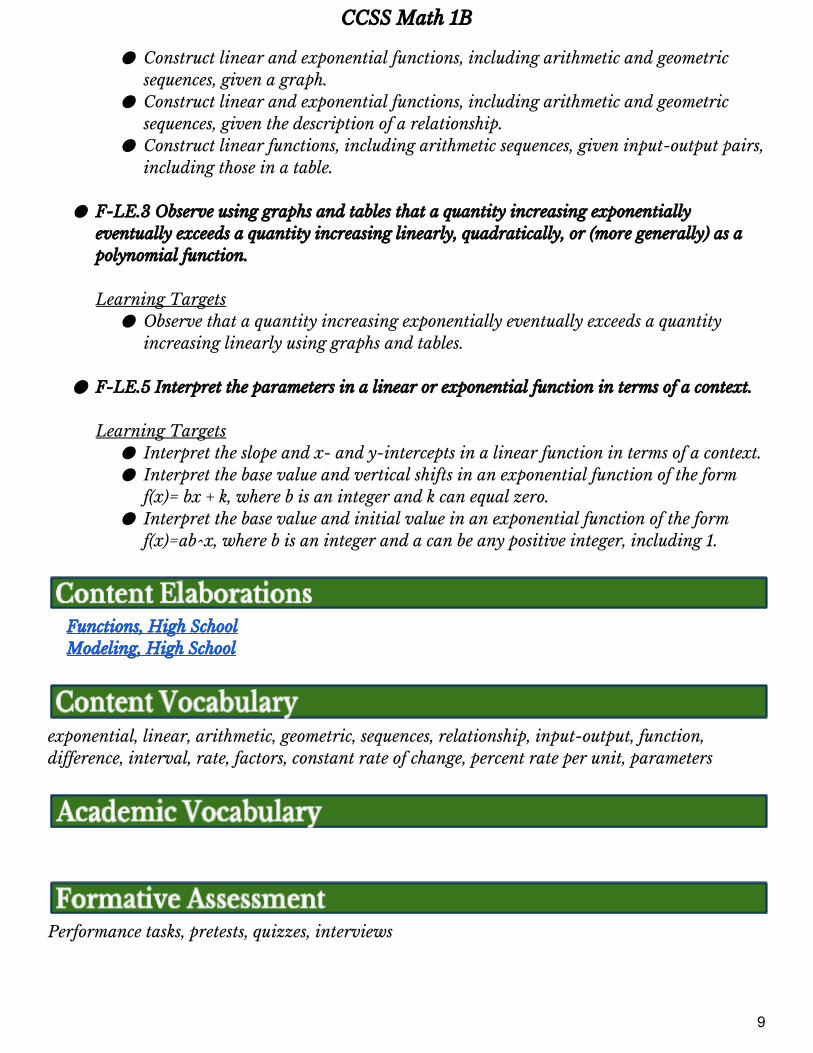
● Construct linear and exponential functions, including arithmetic and geometric sequences, given a graph.
● Construct linear and exponential functions, including arithmetic and geometric sequences, given the description of a relationship.
● Construct linear functions, including arithmetic sequences, given input-output pairs, including those in a table.
● F-LE.3 Observe using graphs and tables that a quantity increasing exponentially
eventually exceeds a quantity increasing linearly, quadratically, or (more generally) as a polynomial function.
Learning Targets
● Observe that a quantity increasing exponentially eventually exceeds a quantity increasing linearly using graphs and tables.
● F-LE.5 Interpret the parameters in a linear or exponential function in terms of a context.
Learning Targets
● Interpret the slope and x- and y-intercepts in a linear function in terms of a context. ● Interpret the base value and vertical shifts in an exponential function of the form
f(x)= bx + k, where b is an integer and k can equal zero. ● Interpret the base value and initial value in an exponential function of the form
f(x)=ab^x, where b is an integer and a can be any positive integer, including 1.
Functions, High School Modeling, High School
exponential, linear, arithmetic, geometric, sequences, relationship, input-output, function, difference, interval, rate, factors, constant rate of change, percent rate per unit, parameters
Performance tasks, pretests, quizzes, interviews
9
CCSS Math 1B
MVP assessments, teacher created assessments, PARCC
Mathematics Vision Project, PARCC Model Content Framework, MathXL, STMath, MobyMax
Use resources such as Data Tool Box, NWEA Learning Continuum, teacher formative assessment data, achievement data to target growth needs.
10
CCSS Math 1B
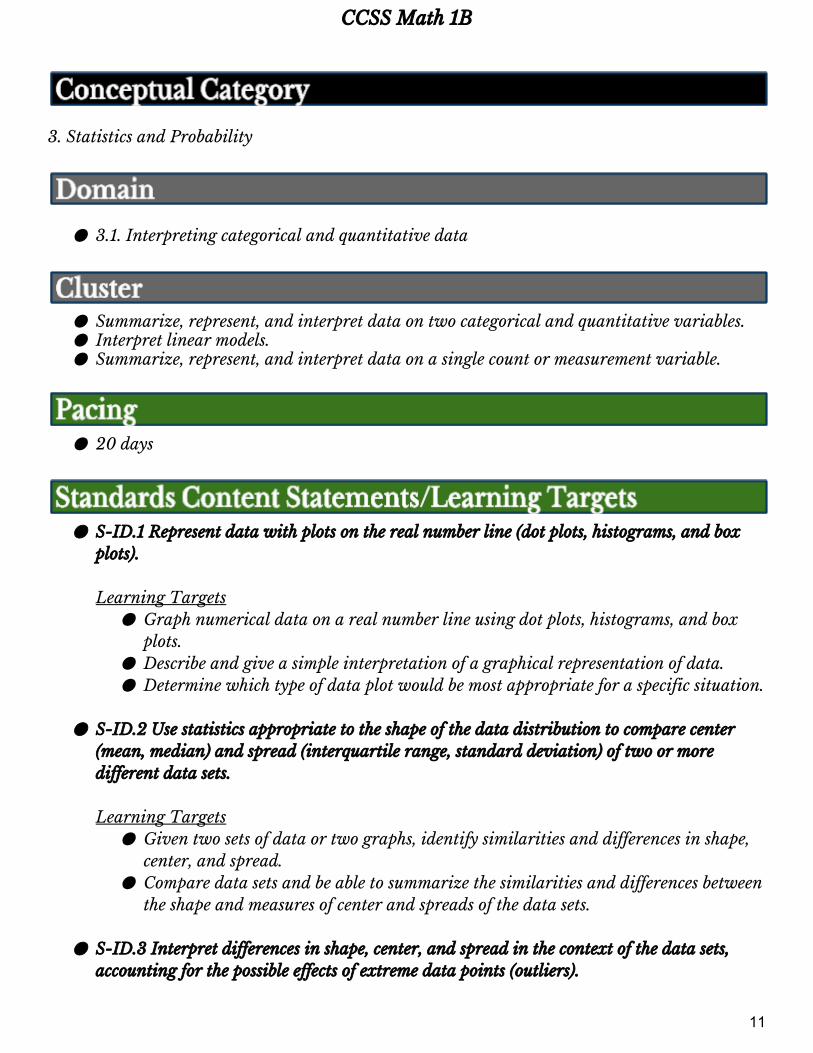
3. Statistics and Probability
● 3.1. Interpreting categorical and quantitative data
● Summarize, represent, and interpret data on two categorical and quantitative variables. ● Interpret linear models. ● Summarize, represent, and interpret data on a single count or measurement variable.
● 20 days
● S-ID.1 Represent data with plots on the real number line (dot plots, histograms, and box
plots).
Learning Targets ● Graph numerical data on a real number line using dot plots, histograms, and box
plots. ● Describe and give a simple interpretation of a graphical representation of data. ● Determine which type of data plot would be most appropriate for a specific situation.
● S-ID.2 Use statistics appropriate to the shape of the data distribution to compare center
(mean, median) and spread (interquartile range, standard deviation) of two or more different data sets.
Learning Targets
● Given two sets of data or two graphs, identify similarities and differences in shape, center, and spread.
● Compare data sets and be able to summarize the similarities and differences between the shape and measures of center and spreads of the data sets.
● S-ID.3 Interpret differences in shape, center, and spread in the context of the data sets,
accounting for the possible effects of extreme data points (outliers).
11
CCSS Math 1B
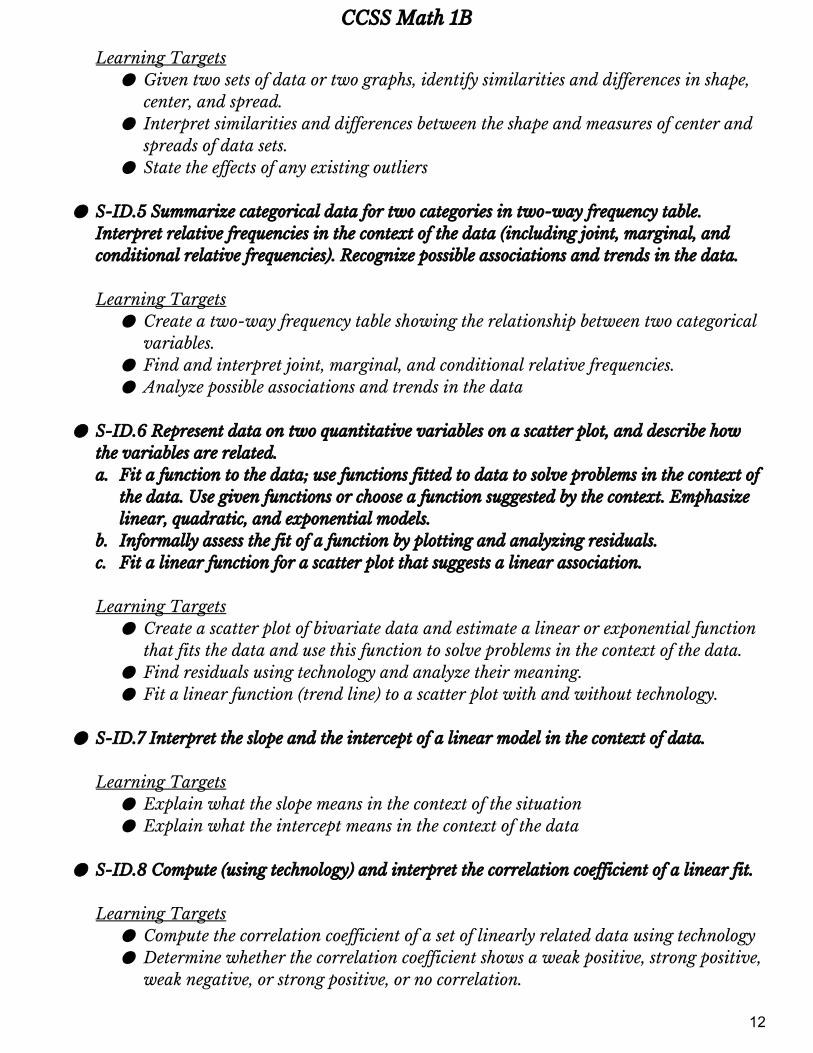
Learning Targets ● Given two sets of data or two graphs, identify similarities and differences in shape,
center, and spread. ● Interpret similarities and differences between the shape and measures of center and
spreads of data sets. ● State the effects of any existing outliers
● S-ID.5 Summarize categorical data for two categories in two-way frequency table.
Interpret relative frequencies in the context of the data (including joint, marginal, and conditional relative frequencies). Recognize possible associations and trends in the data. Learning Targets
● Create a two-way frequency table showing the relationship between two categorical variables.
● Find and interpret joint, marginal, and conditional relative frequencies. ● Analyze possible associations and trends in the data
● S-ID.6 Represent data on two quantitative variables on a scatter plot, and describe how
the variables are related. a. Fit a function to the data; use functions fitted to data to solve problems in the context of
the data. Use given functions or choose a function suggested by the context. Emphasize linear, quadratic, and exponential models.
b. Informally assess the fit of a function by plotting and analyzing residuals. c. Fit a linear function for a scatter plot that suggests a linear association.
Learning Targets
● Create a scatter plot of bivariate data and estimate a linear or exponential function that fits the data and use this function to solve problems in the context of the data.
● Find residuals using technology and analyze their meaning. ● Fit a linear function (trend line) to a scatter plot with and without technology.
● S-ID.7 Interpret the slope and the intercept of a linear model in the context of data.
Learning Targets
● Explain what the slope means in the context of the situation ● Explain what the intercept means in the context of the data
● S-ID.8 Compute (using technology) and interpret the correlation coefficient of a linear fit.
Learning Targets
● Compute the correlation coefficient of a set of linearly related data using technology ● Determine whether the correlation coefficient shows a weak positive, strong positive,
weak negative, or strong positive, or no correlation.
12
CCSS Math 1B
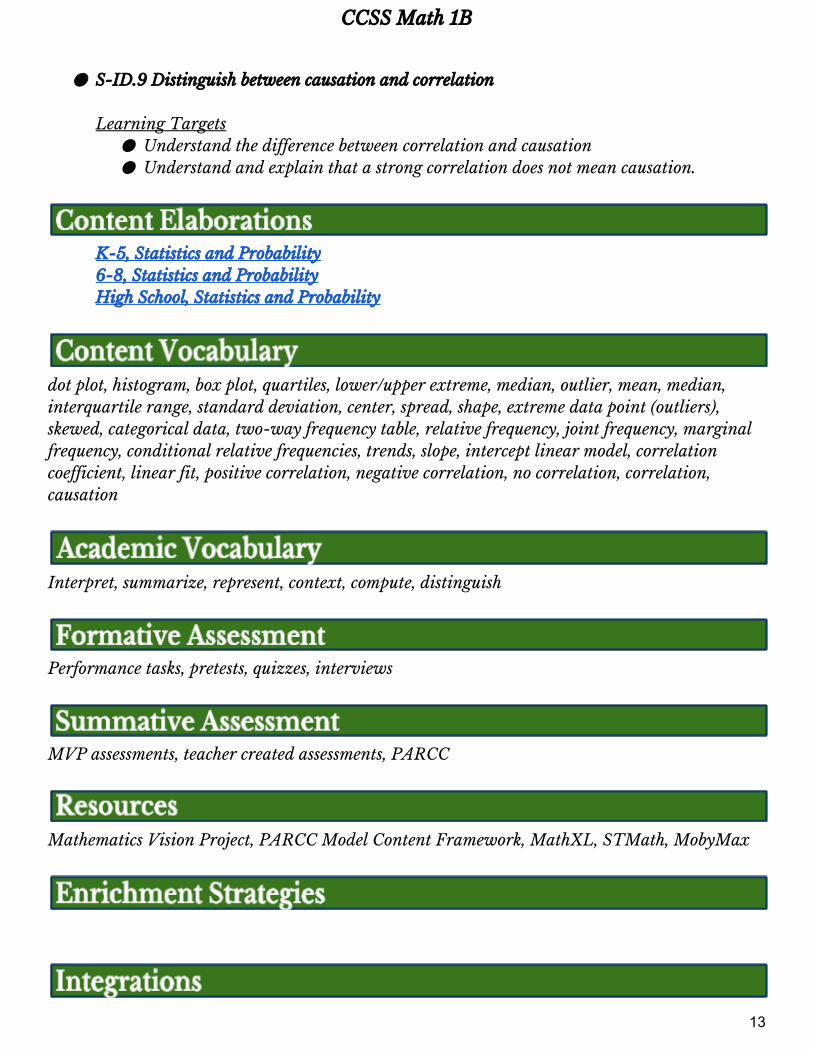
● S-ID.9 Distinguish between causation and correlation
Learning Targets
● Understand the difference between correlation and causation ● Understand and explain that a strong correlation does not mean causation.
K-5, Statistics and Probability 6-8, Statistics and Probability High School, Statistics and Probability
dot plot, histogram, box plot, quartiles, lower/upper extreme, median, outlier, mean, median, interquartile range, standard deviation, center, spread, shape, extreme data point (outliers), skewed, categorical data, two-way frequency table, relative frequency, joint frequency, marginal frequency, conditional relative frequencies, trends, slope, intercept linear model, correlation coefficient, linear fit, positive correlation, negative correlation, no correlation, correlation, causation
Interpret, summarize, represent, context, compute, distinguish
Performance tasks, pretests, quizzes, interviews
MVP assessments, teacher created assessments, PARCC
Mathematics Vision Project, PARCC Model Content Framework, MathXL, STMath, MobyMax
13
CCSS Math 1B
Use resources such as Data Tool Box, NWEA Learning Continuum, teacher formative assessment data, achievement data to target growth needs.
14
CCSS Math 1B
4. Geometry
4.1. Expressing geometric properties with equations
● Use coordinates to prove simple geometric theorems algebraically
● 20 days
● G-GPE.4 Use coordinates to prove simple geometric theorems algebraically.
Learning Targets
● Use coordinates to prove simple geometric theorems algebraically, focusing on lines, segments, and angles.
● Prove that points in a plane determine defined geometric figures.
● G-GPE.5 Prove the slope criteria for parallel and perpendicular lines and use them to solve geometric problems (e.g. find the equation of a line parallel or perpendicular to a given line that passes through a given point).
Learning Targets
● Prove that the slopes of parallel lines are equal ● Prove that the product of the slopes of perpendicular lines is -1 ● Use slope criteria for parallel and perpendicular lines to solve geometric problems ● Write the equation of a line parallel or perpendicular to a given line, passing
through a given point.
● G-GPE.7Use coordinates to compute perimeters of polygons and areas of triangles and rectangles (e.g. using the distance formula).
Learning Targets
15
CCSS Math 1B
● Use the distance formula to compute perimeters of polygons and areas of triangles and rectangles.
K-6, Geometry Secondary, Geometry - Not Yet Available
perimeter, polygon, area, distance formula, parallel, perpendicular, reciprocal, altitude, diagonal, bisector, perpendicular bisector, median, midpoint, pythagorean theorem
Performance tasks, pretests, quizzes, interviews
MVP assessments, teacher created assessments, PARCC
Mathematics Vision Project, PARCC Model Content Framework, MathXL, STMath, MobyMax
Use resources such as Data Tool Box, NWEA Learning Continuum, teacher formative assessment data, achievement data to target growth needs.
16
CCSS Math 1B
Geometry
4.2. Congruence
● Understand congruence in terms of rigid motions ● Prove geometric theorems
● 45 days
● G-CO.6 Use geometric descriptions of rigid motions to transform figures and to predict the
effect of a given rigid motion on a given figure; given two figures, use the definition of congruence in terms of rigid motions to decide if they are congruent.
Learning Targets I can:
● Transform figures using geometric descriptions of rigid motions. ● Predict the effect of rotating, reflecting, or translating a given figure. ● Justify the congruence of two figures using properties of rigid motions.
● G-CO.7 Use the definition of congruence in terms of rigid motions to show that two
triangles are congruent if and only if corresponding pairs of sides and corresponding pairs of angles are congruent.
Learning Targets I can:
● Identify corresponding parts of two triangles. ● Show that two triangles are congruent if and only if corresponding pairs of sides
and corresponding pairs of angles are congruent (CPCTC).
● G-CO.8 Explain how the criteria for triangle congruence (ASA, SAS, and SSS) follow from the definition of congruence in terms of rigid motions.
17
CCSS Math 1B
Learning Targets I can:
● Identify the minimum conditions necessary for triangle congruence (ASA, SAS, and SSS).
● Understand, explain, and demonstrate why ASA, SAS, or SSS are sufficient to show congruence.
● Understand, explain, and demonstrate why SSA and AAA are not sufficient to show congruence.
● G-CO.9 Prove theorems about lines and angles. Theorems include: vertical angles are
congruent; when a transversal crosses parallel lines, alternate interior angles are congruent and corresponding angles are congruent; points on a perpendicular bisector of a line segment are exactly those equidistant from the segment’s endpoints.
Learning Targets I can:
● Identify and use properties of congruence and equality (reflexive, symmetric, transitive) in proofs.
● Use theorems, postulates, or definitions to prove theorems about lines and angles.
● G-CO.10 Prove theorems about triangles. Theorems include: measures of interior angles of a triangle sum to 180; base angles of isosceles triangles are congruent; the segment joining midpoints of two sides of a triangle is parallel to the third side and half the length; the medians of a triangle meet at a point.
Learning Targets I can:
● Use theorems, postulates, or definitions to prove theorems about triangles including: a. Measures of interior angles of a triangle sum to 180 degrees. b. Base angles of isosceles triangles are congruent.
● G-CO.11 Prove theorems about parallelograms. Theorems include: opposite sides are
congruent, opposite angles are congruent, the diagonals of a parallelogram bisect each other, and conversely, rectangles are parallelograms with congruent diagonals.
Learning Targets I can:
● Use theorems, postulates, or definitions to prove theorems about parallelograms, including:
a. Opposite sides are congruent b. Opposite angles are congruent c. Diagonals bisect each other d. Rectangles are parallelograms with congruent diagonals
18
CCSS Math 1B
K-6, Geometry Secondary, Geometry - Not Yet Available
rigid motion, congruent, rotate, translate, reflect, if and only if (iff), corresponding, ASA, SAS, SSS, AAA, SSA, included angle, included side, corresponding parts, quadrilateral, parallelogram, rectangle, diagonals, distance formula, midpoint formula, slope, bisector, congruence properties, midpoint, midsegment, isosceles triangle, median, centroid, coordinate proof, adjacent, consecutive/non-consecutive, Law of Syllogism (transitive property), theorem, linear pair, vertical angles, alternate interior angles, alternate exterior angles, same-side interior angles, corresponding angles, perpendicular bisector, supplementary angles, complementary angles, equidistant
transform, predict
Performance tasks, pretests, quizzes, interviews
MVP assessments, teacher created assessments, PARCC
Mathematics Vision Project, PARCC Model Content Framework, MathXL, STMath, MobyMax
19
CCSS Math 1B
Use resources such as Data Tool Box, NWEA Learning Continuum, teacher formative assessment data, achievement data to target growth needs.
20