ccrd data tables - central coast regional district€¦ · xls file · web view ·...
TRANSCRIPT

DEMOGRAPHIC CHARACTERISTICS DATA SOURCES:Five Year Projection
Population 1996 2006 2008 2009 2010 2011 2012 1996 Census ProfileTotal Population 3,921 3,189 3,285 3,293 3,299 3,304 3,304
Population by Age Group Pop Projections 2009-2013Under - 19 1,300 910 Population Estimates and Projections (P.E.O.P.L.E. 32) By Standard Age Groups
20 - 34 910 570 Estimates (July 1): 1986 - 2007 35 - 54 1,185 1,010 Projections - P.E.O.P.L.E. 32 (July 1): 2007 - 203655 - 74 455 57575 - Older 75 120 On file: /PEOPLE Projections 2008-20121.xls
% Distribution by Age GroupUnder - 19 33% 29% Migration20 - 34 23% 18%35 - 54 30% 32%55 - 74 12% 18%75 - Older 2% 4%
Median Age 37.5Households
Number 1,330 1,185Median Household Income 35,517 34,746Household Income Distribution
Under - $40,000 57% 54%$40,000 - $49,999 12% 14%$50,000 - $79,999 21% 22%$80,000 - Above 10% 11%
2007 2006 2005 2004 2003Net Migration Last Five Years Available -52 -58 -29 8 179Population Education Attainment (15+ Years of Age) 2006 #Total 15+ population 2,505 100% No certificate, diploma or degree 1,005 40% Certificate, diploma or degree High school certificate or equivalent 680 27% Apprenticeship or trades certificate or diploma 230 9% College, CEGEP or other non-university certificate or diploma 275 11% University certificate, diploma or degree University certificate or diploma below bachelor level 75 3% University certificate or degree Bachelor's degree 150 6% University certificate or diploma above bachelor level 40 2% Degree in medicine, dentistry, veterinary medicine or optometry 10 0% Master's degree 40 2% Earned doctorate 0 0%
http://www.bcstats.gov.bc.ca/data/cen96/profiles/CSD45000.pdf
http://www.bcstats.gov.bc.ca/data/pop/popstart.asp
http://www.bcstats.gov.bc.ca/data/pop/mig/rdcomp07.pdf
2006_%
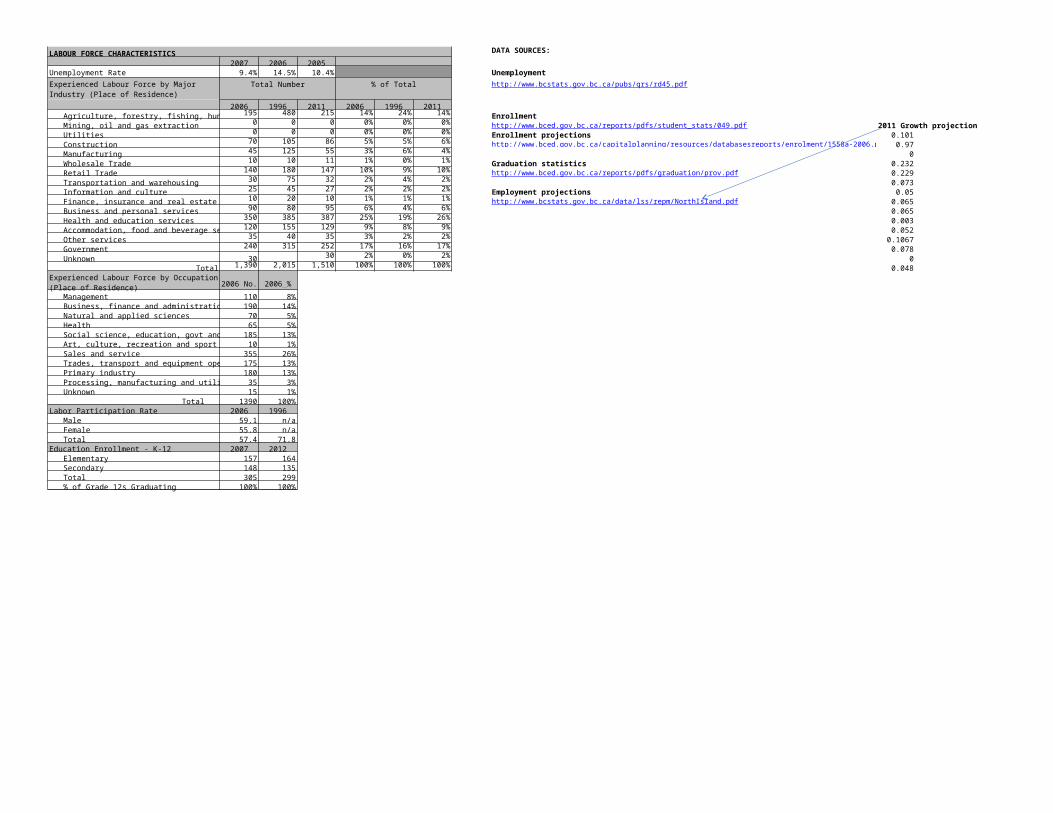
LABOUR FORCE CHARACTERISTICS DATA SOURCES:2007 2006 2005
Unemployment Rate 9.4% 14.5% 10.4% UnemploymentTotal Number % of Total http://www.bcstats.gov.bc.ca/pubs/qrs/rd45.pdf
2006 1996 2011 2006 1996 2011Agriculture, forestry, fishing, hunting 195 480 215 14% 24% 14% EnrollmentMining, oil and gas extraction 0 0 0 0% 0% 0% http://www.bced.gov.bc.ca/reports/pdfs/student_stats/049.pdf 2011 Growth projectionUtilities 0 0 0 0% 0% 0% Enrollment projections 0.101Construction 70 105 86 5% 5% 6% 0.97Manufacturing 45 125 55 3% 6% 4% 0Wholesale Trade 10 10 11 1% 0% 1% Graduation statistics 0.232Retail Trade 140 180 147 10% 9% 10% 0.229Transportation and warehousing 30 75 32 2% 4% 2% 0.073Information and culture 25 45 27 2% 2% 2% Employment projections 0.05Finance, insurance and real estate 10 20 10 1% 1% 1% 0.065Business and personal services 90 80 95 6% 4% 6% 0.065Health and education services 350 385 387 25% 19% 26% 0.003Accommodation, food and beverage services 120 155 129 9% 8% 9% 0.052Other services 35 40 35 3% 2% 2% 0.1067Government 240 315 252 17% 16% 17% 0.078Unknown 30 30 2% 0% 2% 0
Total 1,390 2,015 1,510 100% 100% 100% 0.048
2006 No.Management 110 8%Business, finance and administration 190 14%Natural and applied sciences 70 5%Health 65 5%Social science, education, govt and religion 185 13%Art, culture, recreation and sport 10 1%Sales and service 355 26%Trades, transport and equipment operators 175 13%Primary industry 180 13%Processing, manufacturing and utilities 35 3%Unknown 15 1%
Total 1390 100%Labor Participation Rate 2006 1996
Male 59.1 n/aFemale 55.8 n/aTotal 57.4 71.8
Education Enrollment - K-12 2007 2012Elementary 157 164Secondary 148 135Total 305 299% of Grade 12s Graduating 100% 100%
Experienced Labour Force by Major Industry (Place of Residence)
http://www.bced.gov.bc.ca/capitalplanning/resources/databasesreports/enrolment/1558a-2006.pdf
http://www.bced.gov.bc.ca/reports/pdfs/graduation/prov.pdf
http://www.bcstats.gov.bc.ca/data/lss/repm/NorthIsland.pdf
Experienced Labour Force by Occupation (Place of Residence) 2006_%

DATA SOURCES:HIGHER EDUCATIONAL RESOURCES
Student headcount (colleges):Name of Institution Location Undergraduate Enrollment (2007) Graduate Enrollment (2007) http://www.aved.gov.bc.ca/datawarehouse/documents/full_report.pdf
Main Campus Nearest Campus Total Full-Time Part-Time Total Full-Time Part-TimeUniversity of British Columbia Vancouver Vancouver 36,370 25,770 10,600 7,820 6,760 1,060 University enrollment:Simon Fraser University Burnaby Burnaby 21,800 11,410 10,390 4,230 3,250 980 University of Victoria Victoria Victoria 16,500 11,010 5,490 2,390 2,090 300 University of Northern BC Prince George Quesnel 2,980 2,120 860 520 380 140 Thompson Rivers University Kamloops Williams Lake 7,400 5,460 1,940 80 50 30 British Columbia Institute of Technology Burnaby Burnaby 48,000 32,000 16,000 North Island College Courtenay Bella Coola 9,849
http://www.aucc.ca/can_uni/our_universities/index_e.html#British

DATA SOURCES:
AVERAGE SALARY BY SELECTED OCCUPATION 2007 Service CanadaOccupation Average High Low
Professional Note: data for Vancouver Island Coast regionAccountant 23.95 35.10 15.35Manager (Business) 28.20 44.56 18.87Programmer/Analyst 26.61 32.82 19.71Engineer (Civil) 21.84 28.15 16.00
RetailRetail Store Clerk 11.76 19.23 8.70Stock Room Clerk 10.60 19.75 8.95Hospitality Clerk 12.45 16.00 10.00
ClericalCustomer Service Rep. 11.99 19.38 8.75Telesales Rep. 10.50 14.25 8.50Data Entry Clerk 15.44 26.57 8.00Executive Secretary 19.31 27.00 14.00Accounting Clerk 16.87 22.22 10.50Word Processor 17.76 24.00 12.00
UnskilledGeneral Labourer 10.96 13.00 8.00Warehouse Person 12.95 19.85 9.00Material Handler 11.14 25.45 10.00
Semi-SkilledMachine Operator 24.25 32.00 14.50Equipment Operator 25.65 32.00 18.35
SkilledMachine Maintenance 18.02 25.03 14.00Tool & Die 28.58 32.42 24.73Machinist 24.80 30.00 16.20Welder 24.25 32.00 14.50
TechnicalNumerical Control Machine Programmer 20.33 26.13 12.59Electronic Technician 21.73 33.37 14.63Medical Laboratory Technician 30.92 32.25 20.54Network Technician 19.00 28.00 14.00
http://www.labourmarketinformation.ca/standard.asp?ppid=81&lcode=E&prov=59&gaid=25566&occ=1111&job=&search_key=2&search_type=&employer_potential=&new_search=

DATA SOURCES:
WORKERS COMPENSATION & UNEMPLOYMENT INSURANCE Invest BC websiteWorkers Compensation
Maximum Gross Earnings Insured $62,400Average Cost for All Industries per $100 Payroll $1.90Average Cost for Office Workers per $100 Payroll $0.30Maximum Weekly Benefit $808
Unemployment InsuranceTaxable Base $39,000Maximum Annual Employer Contribution $1,021Premium per $100 of insurable earnings
Employee Contributions $2.62Employer Contributions $1.87Maximum Weekly Benefit $413
http://investbc.gov.bc.ca/CommunityProfiles/Display/default.aspx?page=payroll&pCommunityID=581
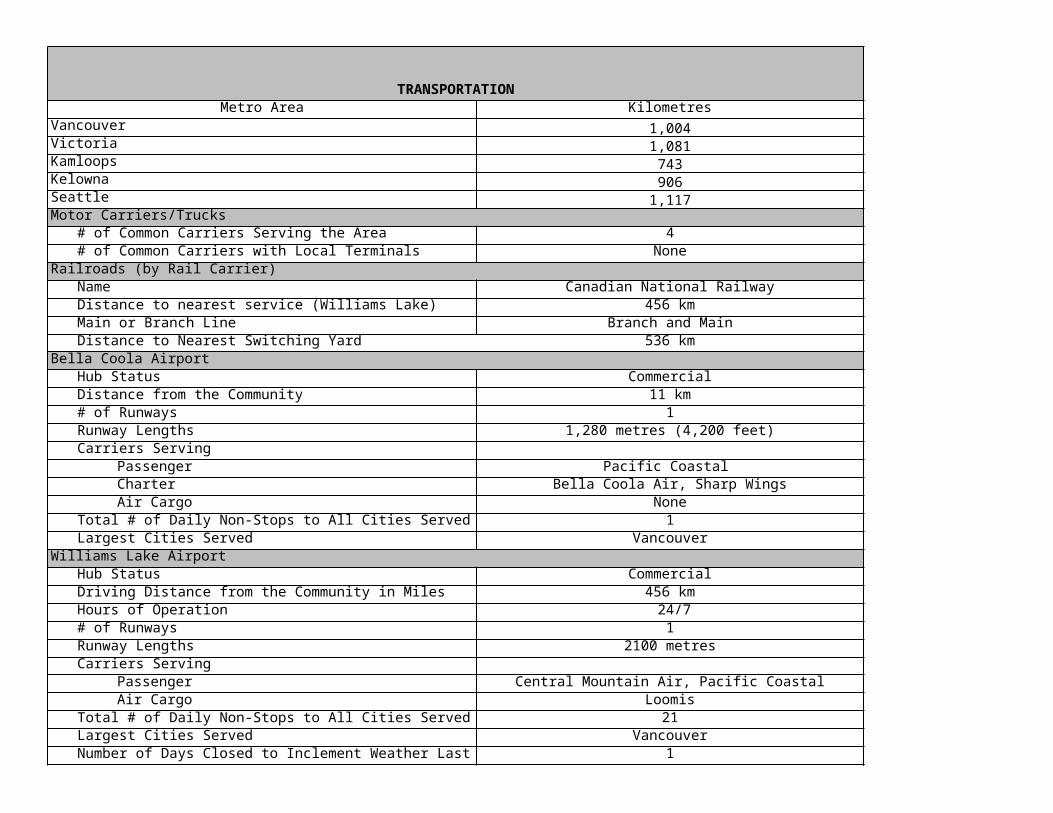
TRANSPORTATIONMetro Area Kilometres
Vancouver 1,004Victoria 1,081Kamloops 743Kelowna 906Seattle 1,117Motor Carriers/Trucks
# of Common Carriers Serving the Area 4# of Common Carriers with Local Terminals None
Railroads (by Rail Carrier)Name Canadian National RailwayDistance to nearest service (Williams Lake) 456 kmMain or Branch Line Branch and MainDistance to Nearest Switching Yard 536 km
Bella Coola AirportHub Status CommercialDistance from the Community 11 km# of Runways 1Runway Lengths 1,280 metres (4,200 feet)Carriers Serving
Passenger Pacific Coastal Charter Bella Coola Air, Sharp WingsAir Cargo None
Total # of Daily Non-Stops to All Cities Served 1Largest Cities Served Vancouver
Williams Lake AirportHub Status CommercialDriving Distance from the Community in Miles 456 kmHours of Operation 24/7# of Runways 1Runway Lengths 2100 metresCarriers Serving
Passenger Central Mountain Air, Pacific CoastalAir Cargo Loomis
Total # of Daily Non-Stops to All Cities Served 21Largest Cities Served VancouverNumber of Days Closed to Inclement Weather Last 3 Years 1

Vancouver International AirportHub Status InternationalDriving Distance from the Community in Miles 1004 kmHours of Operation 24/7# of Runways 3Runway Lengths 3,018 m, 3,597 m, 2,225 mCarriers Serving
Passenger 51Air Cargo 18
Total # of Weekly Non-Stops to All Cities Served 63Total # of Weekly Non-Stop Flights to Largest Cities
Tokyo 21Seoul 14New York 21Mexico City 7
Number of Days Closed to Inclement Weather Last 3 Years 0Port of Vancouver
Distance to Community 1004 kmType of Port OceanChannel Depth Minimum 10 metres (33 feet)Turning Basin UnlimitedBarging Facilities YesGeneral Cargo Facilities YesContainerized Facilities YesStorage Facilities YesHighways Serving Port #1, #1A, #7A, #99A, 17Railways Serving Port CP Rail, CN Rail, Burlington Northern Sante Fe
Custom Port of Entry in the AreaName Prince George Airport
Site LocationType of Entry Point Airport
Warehouses# of Bonded Warehouses in the Area 0# of Public Warehouses in the Area (Williams Lake) 3
280 Victoria Street, Prince George BC, V2L 4X3 Ph: 250.561.5282

TAXATION DATA SOURCES:Corporate Income Tax Small Business Mfg Non-Mfg Corporate Taxes
FederalRate (range) 11.0% 19.5% 19.5%Formula (e.g. Sales, Property & Payroll) N/A
ProvincialRate (range) 3.5% 11.5% 11.5%Formula (e.g. Sales, Property & Payroll) Sales/Payroll Sales/Payroll Sales/PayrollFederal Taxes Deductible No No NoAccelerated Depreciation Permitted Yes Yes Yes
Local British Columbia has no local income taxesTotal Federal and Provincial Corporate Income Tax 14.5% 31.0% 31.0%Personal Income Tax Federal Provincial Local
Earned Income 15%-29% 5.24%-14.7% N/AUnearned Income (e.g. Dividend) 0%-19.58% 0%-31.58% N/ACapital Gains 7.75%-14.5% 7.75%-21.85% N/A
Local Occupation Tax (Paid by Employee) Rate BasisCity Residents N/ANon-City Residents N/A
Local Wage Tax (Paid by Employer) Rate BasisCity Residents N/ANon-City Residents N/A
Sales/Use Tax RateFederal Goods and Service Tax (GST) 5.0%Provincial Sales Tax (PST) 7.0%Local Sales Tax N/ATotal 7.0% GST on business inputs is fully recoverable
Sales Tax Rate by Utility:Electric Power 7.0% GST is fully recoverableNatural Gas 7.0% GST is fully recoverableFuel Oil 7.0% GST is fully recoverableWater 0.0%Sewer 0.0%Hazardous Waste Disposal 7.0% GST is fully recoverable
TelephoneLocal 7.0% GST is fully recoverableLong Distance In Province 7.0% GST is fully recoverableLong Distance Out of Province 7.0% GST is fully recoverable
Machinery & Equipment Subject to Sales/Use TaxProduction 0.0%
http://www.kpmg.ca/en/services/tax/documents/Substantively_Enacted%20Rates_GeneralQ1_2008.pdfhttp://www.kpmg.ca/en/services/tax/documents/2008_2009CCPCApr08.pdfhttp://www.pwc.com/ca/eng/ins-sol/publications/tff_0607.pdf

Non-Production 7.0% GST is fully recoverablePollution Control 0.0% GST is fully recoverableOffice Furniture/Fixtures/Equipment 0.0% GST is fully recoverable
Sales/Use Tax (Yes or No) onOffice Building Construction Materials 7.0% GST is fully recoverableIndustrial Building Construction Materials 7.0% GST is fully recoverableManufacturers' Raw Materials 0.0%Standard Software 7.0% GST is fully recoverableCustom Software 7.0% GST is fully recoverable
Intangible PropertyAccounts Receivable 0.0%Capital Stock 0.0%Stock Bond Transaction Fee 0.0%
Real Property Tax Rates Per $1,000 of Assessed Value Business Industry Utilities ResidentialArea C 4.9848 6.9176 7.1211 2.0346
Personal Property Tax Rates per $100N/A
State Property Tax Effective Rate per $100N/A
Subject to Personal Property TaxN/A

http://www.kpmg.ca/en/services/tax/documents/Substantively_Enacted%20Rates_GeneralQ1_2008.pdfhttp://www.kpmg.ca/en/services/tax/documents/2008_2009CCPCApr08.pdfhttp://www.pwc.com/ca/eng/ins-sol/publications/tff_0607.pdf

UTILITIESWater & Sewer
Water AvailabilityMajor Source Wells Surface water Wells Surface water & wells% of Population Increase Served from the Source 100% 100% 100% 100%
Water TreatmentName of Provider no treated water no treated water no treated water no treated waterRated Capacity (mgd)Average Daily Demand (mgd)Peak Demand (mgd)Chemical Breakdown of WaterCost per 1000 GallonsWater Connection Fee $1,400 - $1,600 $3,000 $1,000 n/a
Sewer Treatment (Septic Service Only) Ocean Falls
Name of Provider n/a (individual)Type of Service septic sewerRated Capacity (mgd) n/aAverage Daily Demand (mgd) n/aPeak Demand (mgd) n/aCost per 1000 Gallons n/aSewer Connection Fee n/a
Electric Power Bella Coola Valley Outer CoastName of Company BC Hydro BC Hydro
Communities Served 95% of all BC communitiesCompany-Net Importer or Exporter of Power Net seller of 1,161 Gwh (year ending Mar 2008) n/a% of Reserve Margin Including Generation & Net Purchases n/a
Name of Power Pool Membership n/aElectric Power Deregulated Wholesale competition allowed.Average Cost per kWh (Canadian dollars) Small Medium Large
Industrial (2006) 5.1 5.07 3.69Natural Gas
Name of Provider noneAverage Cost for Industrial Users ($ per mcf) n/aFirm Contract Rates n/aInterruptible Service Rates n/a
TelecommunicationsProvider TelusAddress #5 - 3777 Kingsway, Burnaby, BC V5H 3Z7
Bella Coola (Townsite) Waterworks
Hagensborg Waterworks Improvement District
Nusatsum Waterworks Improvement District
Ocean Falls, Denny Island, Bella Bella
Ocean Falls Improvement District
Ocean Falls, Denny Island, Bella Bella
surplusFormal membership in WSCC, WSPP, Power Pool of Alberta, and Mapp. Also active in in SPP and
CalPX.
28% load factor300 kW & 120,000
kWh56% load factor
1,000 kW & 400,000 kWh85% load factor
50,000 kVh

ServicesSwitch Technology is Digital or Analog DigitalFiber Service Provided No Monitored Remotely or On-Site RemotelyISDN Available NoADSL Available NoADS2 Available from this Switch NoCentral Office on Self-Healing Fiber Ring NoDual Feed from 2 Separate Switching Offices Likely Available No
Internet Service Provider Central Coast Communications SocietyAddress Box 278, Bella Coola, BC V0T 1C0Services
Dial-up YesBroadband Yes

GOVERNMENTRegional Government
Name Central Coast Regional District# of Elected Officials 5Top Elected Officials
Name Brian LandeTitle ChairNext Election Date November 15, 2008
Provincial Government RepresentationForm (Structure) Legislative AssemblyTotal Members of Legislative Assembly (MLA) 1
Electoral District Name North CoastName of MLA Gary CoonsParty Affiliation New Democratic Party (NDP)Next Election Date May 12, 2009
Federal Government Representation
Form (Structure)Total Members of Parliament (MP) 1
Riding Name Skeena-Bulkley ValleyName of MP Nathan CullenParty Affiliation NDPNext Election Date October, 2012
Senate
Bicameral Parliament (House of Commons and Senate)
In Canada, there are ordinarily 105 Senators appointed by the Governor General on the advice of the Prime Minister. Senators are chosen to represent the various provinces and territories of Canada and are appointed until the age of 75. British Columbia currently has six senators: Sen. Jack Austin, Sen. Pat Carney, Sen. Ross Fitzpatrick, Sen. Mobina Jaffer, Sen. Larry W. Campbell, and Sen. Gerry St. Germain.
QUALITY OF LIFE DATA SOURCES:Climate (Bella Coola) Climate
High Low AverageJuly 22.1 11.4 16.8January 1.6 -3.7 -1 Housing
Annual AverageRainfall in Inches 58.7Snowfall in Inches 63 Education
0
Personal Income Tax (RATE in Ranges) Rate Range
Federal 15%-29%Provincial 5.24%-14.7%Local None Health and Crime
Local Occupation Tax Rate Range BasisCity Residents NoneNon-City Residents None
Sales TaxFederal Rate 5%Exemptions GST on business inputs is fully recoverableProvincial Rate 7%Exemptions
HousingNumber of Homes on the Market Single Family Townhouses CondominiumsAverage Selling Prices 294,000 n/a n/a
18
Average monthly rental (2006) 510Apartment Vacancy % n/a
EducationNumber of School Districts 1
Central Coast No. 49
Elementary School Enrollment 130Secondary School Enrollment 146Spending per Student (2008/09)
Total 5,851Instructional n/a
Student Teacher RatiosKindergarten 16.1Grade 1 - 3 18.6Grade 4 - 7 16.5Grade 8 - 12 11.2
7th Grade FSA Results (2005/06) % students meeting or exceeding requirementCentral Coast BC
Reading Comprehension 20 90Numeracy 38 74Writing 33 87
Average Daily Temperature (oC) http://www.climate.weatheroffice.ec.gc.ca/climate_normals
http://www.mls.ca
Elevation (Mean Feet Above Sea Level) http://www.bced.gov.bc.ca/reporting/enrol/student.php
http://www.bced.gov.bc.ca/reports/pdfs/class_size/2007/049.pdf
http://www.bced.gov.bc.ca/keyinfo/pdfs/ski_plusglossary.pdf http://www.bced.gov.bc.ca/k12funding/funding/07-08/fullyear/sd49-full-year-0708.pdf
http://www.vch.ca/facilities/hospitals/ns.htm http://www.bcstats.gov.bc.ca/data/sep/lha/Lha_49.pdf http://secure.cihi.ca/cihiweb/
Professional services, production machinery and equipment, direct materials, catalysts,
reagents, software development equipment, construction labour
Number of single family homes for sale
Central City & Selected Suburban School Districts

Grade 12 Provincial Exam pass rateCentral Coast BC
Communications 88 91English 92 93
Higher Education (Provide for Each Institution)Institution Name Address City
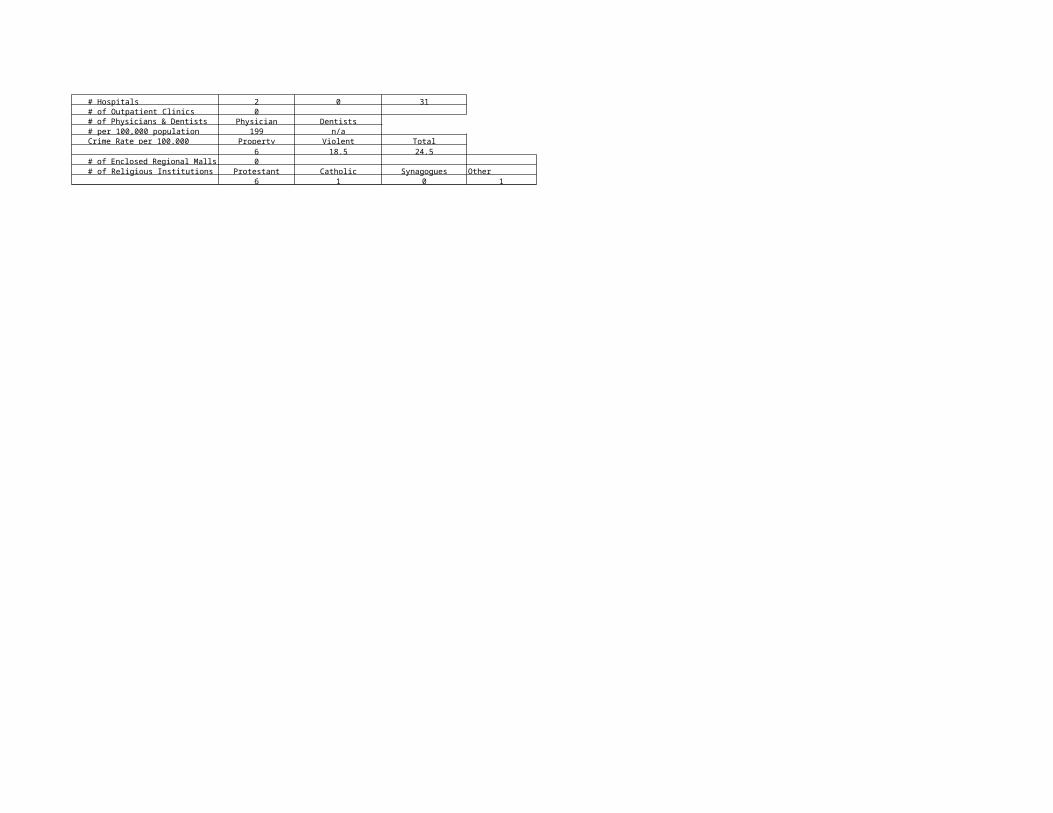
see Table 8Health Care
# of Hospitals # of Teaching Hospitals # of Beds# Hospitals 2 0 31# of Outpatient Clinics 0# of Physicians & Dentists in BC Physician Dentists# per 100,000 population 199 n/aCrime Rate per 100,000 Inhabitants Property Violent Total
6 18.5 24.5# of Enclosed Regional Malls 0# of Religious Institutions Protestant Catholic Synagogues Other
6 1 0 1

Profile for Canada, Provinces, Territories, Census Divisions and Census Subdivisions, 2006 Census
File Name: 94-581-XCB2006001.ivt
Values: Values
Population, 2001 - 100% data 3781 143 697 516 -Population, 2006 - 100% data 3189 138 556 421 -Population percentage change, 2001 to 2006 -15.7 -3.5 -20.2 -18.4 -Land area in square kilometres, 2006 24556.35 19876.88 3987.48 304.14 -Total population by sex and age groups - 100% dat 3190 135 555 420 - Male, total 1615 75 285 215 - 0 to 4 years 130 5 25 15 - 5 to 9 years 115 5 15 15 - 10 to 14 years 120 0 20 10 - 15 to 19 years 110 0 20 15 - 20 to 24 years 95 0 5 5 - 25 to 29 years 85 5 0 10 - 30 to 34 years 95 5 15 10 - 35 to 39 years 100 5 15 15 - 40 to 44 years 135 5 25 15 - 45 to 49 years 135 10 35 15 - 50 to 54 years 130 10 30 15 - 55 to 59 years 115 15 15 20 - 60 to 64 years 70 0 15 15 - 65 to 69 years 60 10 10 10 - 70 to 74 years 55 0 15 10 - 75 to 79 years 25 0 5 5 - 80 to 84 years 15 0 0 5 - 85 years and over 10 0 0 0 - Female, total 1575 60 275 205 - 0 to 4 years 120 5 15 10 - 5 to 9 years 90 0 10 5 - 10 to 14 years 105 0 5 10 - 15 to 19 years 120 5 20 15 - 20 to 24 years 105 0 5 10 - 25 to 29 years 80 0 10 5 - 30 to 34 years 110 10 15 10 - 35 to 39 years 115 0 25 10 - 40 to 44 years 120 5 15 15 - 45 to 49 years 125 0 25 25 - 50 to 54 years 150 15 25 20 - 55 to 59 years 100 5 30 20 - 60 to 64 years 80 0 20 10 - 65 to 69 years 55 5 20 10 - 70 to 74 years 40 5 5 15 - 75 to 79 years 35 0 10 10 - 80 to 84 years 20 0 5 10 - 85 years and over 15 0 0 0 -Total population 15 years and over by legal marital 2505 120 465 350 - Never legally married (single) 1025 35 145 85 - Legally married (and not separated) 1040 60 230 205 -
Central Coast (5945) 02020
Central Coast A (5945006) RDA
Central Coast C (5945010) RDA
Central Coast D (5945012) RDA
Central Coast E (5945014) RDA

Separated, but still legally married 145 0 20 20 - Divorced 155 20 45 25 - Widowed 140 0 25 20 -Total population 15 years and over by common-law 2505 120 465 355 - Not in a common-law relationship 2070 105 395 310 - In a common-law relationship 430 20 65 40 -Total number of census families in private househ 935 40 160 140 40 Size of census family: 2 persons 490 25 95 100 45 Size of census family: 3 persons 200 10 15 20 0 Size of census family: 4 persons 155 0 40 0 0 Size of census family: 5 or more persons 85 0 10 20 0Total number of census families in private househ 935 40 160 140 40 Total couple families by family structure and numb 720 35 150 105 30 Married couples 500 30 120 95 15 Without children at home 255 20 70 70 15 With children at home 250 10 50 25 0 1 child 95 0 15 15 0 2 children 95 0 25 0 0 3 or more children 55 0 10 10 0 Common-law couples 215 10 30 15 20 Without children at home 95 0 15 0 20 With children at home 115 0 15 10 0 1 child 40 0 0 0 0 2 children 50 0 10 0 0 3 or more children 25 0 0 10 0 Total lone-parent families by sex of parent and nu 215 0 10 35 10 Female parent 155 0 0 20 10 1 child 100 0 10 20 0 2 children 40 0 0 0 0 3 or more children 15 0 0 0 0 Male parent 60 0 10 10 0 1 child 35 0 0 10 0 2 children 20 0 0 10 0 3 or more children 0 0 0 0 0Total number of children at home - 20% sample da 1015 25 135 120 10 Under six years of age 280 10 60 10 0 6 to 14 years 385 10 35 65 0 15 to 17 years 120 0 30 10 0 18 to 24 years 140 0 10 15 10 25 years and over 90 0 0 20 0Average number of children at home per census fa 1.1 0.5 0.8 0.9 0Total number of persons in private households - 2 3140 130 540 410 130 Number of persons not in census families 470 30 95 35 45 Living with relatives 120 10 0 0 20 Living with non-relatives only 50 10 0 0 0 Living alone 300 20 90 40 20 Number of census family persons 2670 100 445 370 85Average number of persons per census family 2.9 2.9 2.8 2.6 2.2Total number of persons aged 65 years and over - 320 20 60 85 35 Number of persons not in census families aged 6 90 10 15 20 10 Living with relatives 25 0 0 0 0 Living with non-relatives only 0 0 0 0 0 Living alone 65 0 15 20 10 Number of census family persons aged 65 years 230 10 45 65 25

Total number of occupied private dwellings - 20% 1180 60 250 180 65Average number of rooms per dwelling 5.7 4.8 6 6 5Average number of bedrooms per dwelling 2.8 2.2 2.5 2.6 2.5Total number of occupied private dwellings by hou 1185 60 250 180 65 Owned 705 40 200 125 30 Rented 340 20 50 50 35 Band housing 135 0 0 0 0Total number of occupied private dwellings by cond 1180 60 250 180 65 Regular maintenance only 335 35 105 75 20 Minor repairs 415 20 95 85 20 Major repairs 430 10 45 20 20Total number of occupied private dwellings by peri 1185 60 250 180 65 Period of construction, before 1946 95 0 30 45 10 Period of construction, 1946 to 1960 105 15 20 50 10 Period of construction, 1961 to 1970 105 0 35 10 20 Period of construction, 1971 to 1980 270 10 65 40 15 Period of construction, 1981 to 1985 180 10 40 20 0 Period of construction, 1986 to 1990 145 0 10 0 0 Period of construction, 1991 to 1995 135 0 25 0 0 Period of construction, 1996 to 2000 90 0 20 15 0 Period of construction, 2001 to 2006 55 0 0 0 10Total number of occupied private dwellings by struc 1180 60 255 175 - Single-detached house 955 35 240 130 - Semi-detached house 90 20 5 35 - Row house 30 0 0 5 - Apartment, duplex 40 0 0 0 - Apartment, building that has five or more storeys 0 0 0 0 - Apartment, building that has fewer than five store 25 5 0 0 - Other single-attached house 5 0 0 5 - Movable dwelling 35 0 5 5 -Total number of private households by household s 1185 60 250 180 - 1 person 305 20 85 40 - 2 persons 390 30 110 85 - 3 persons 170 5 20 25 - 4 to 5 persons 250 10 35 25 - 6 or more persons 70 0 10 5 -Number of persons in private households 3140 125 540 410 -Average number of persons in private households 2.6 2.2 2.2 2.3 -Total number of private households by household 1185 65 250 180 65 One-family households 795 40 155 140 45 Multiple-family households 65 0 0 0 0 Non-family households 325 20 90 40 25Total population by mother tongue - 20% sample d 3180 140 555 420 130 Single responses 3165 140 555 415 130 English 2930 125 530 370 120 French 20 10 10 10 0 Non-official languages 215 10 15 35 10 Algonquin 0 0 0 0 0 Atikamekw 0 0 0 0 0 Blackfoot 0 0 0 0 0 Carrier 0 0 0 0 0 Chilcotin 0 0 0 0 0 Chipewyan 0 0 0 0 0 Cree 0 0 0 0 0

Siouan languages (Dakota/Sioux) 10 0 0 0 0 Dene 0 0 0 0 0 Dogrib 0 0 0 0 0 Gitksan 0 0 0 0 0 Inuinnaqtun 0 0 0 0 0 Inuktitut, n.i.e. 0 0 0 0 0 Kutchin-Gwich'in (Loucheux) 0 0 0 0 0 Malecite 0 0 0 0 0 Mi'kmaq 0 0 0 0 0 Mohawk 0 0 0 0 0 Montagnais-Naskapi 0 0 0 0 0 Nisga'a 0 0 0 0 0 North Slave (Hare) 0 0 0 0 0 Ojibway 0 0 0 0 0 Oji-Cree 0 0 0 0 0 Shuswap 10 0 0 0 0 South Slave 0 0 0 0 0 Tlingit 0 0 0 0 0 Italian 0 0 0 0 0 Portuguese 0 0 0 0 0 Romanian 10 0 0 0 0 Spanish 10 0 0 0 0 Danish 20 0 0 20 0 Dutch 0 0 0 0 0 Flemish 0 0 0 0 0 Frisian 0 0 0 0 0 German 10 0 10 0 0 Norwegian 20 0 0 10 10 Swedish 10 0 0 0 0 Yiddish 0 0 0 0 0 Bosnian 0 0 0 0 0 Bulgarian 0 0 0 0 0 Croatian 0 0 0 0 0 Czech 0 0 0 0 0 Macedonian 0 0 0 0 0 Polish 0 0 0 0 0 Russian 0 0 0 0 0 Serbian 0 0 0 0 0 Serbo-Croatian 0 0 0 0 0 Slovak 0 0 0 0 0 Slovenian 0 0 0 0 0 Ukrainian 0 0 0 0 0 Latvian 0 0 0 0 0 Lithuanian 0 0 0 0 0 Estonian 0 0 0 0 0 Finnish 0 0 0 0 0 Hungarian 0 0 0 0 0 Greek 0 0 0 0 0 Armenian 0 0 0 0 0 Turkish 0 0 0 0 0 Amharic 0 0 0 0 0 Arabic 0 0 0 0 0 Hebrew 0 0 0 0 0 Maltese 0 0 0 0 0

Somali 0 0 0 0 0 Tigrigna 0 0 0 0 0 Bengali 0 0 0 0 0 Gujarati 0 0 0 0 0 Hindi 0 0 0 0 0 Kurdish 0 0 0 0 0 Panjabi (Punjabi) 0 0 0 0 0 Pashto 0 0 0 0 0 Persian (Farsi) 0 0 0 0 0 Sindhi 0 0 0 0 0 Sinhala (Sinhalese) 0 0 0 0 0 Urdu 0 0 0 0 0 Malayalam 0 0 0 0 0 Tamil 0 0 0 0 0 Telugu 0 0 0 0 0 Japanese 0 0 0 0 0 Korean 0 0 0 0 0 Cantonese 0 0 0 0 0 Chinese, n.o.s. 0 0 0 0 0 Mandarin 0 0 0 0 0 Taiwanese 0 0 0 0 0 Lao 0 0 0 0 0 Khmer (Cambodian) 0 0 0 0 0 Vietnamese 0 0 0 0 0 Bisayan languages 0 0 0 0 0 Ilocano 0 0 0 0 0 Malay 0 0 0 0 0 Tagalog (Pilipino, Filipino) 0 0 0 0 0 Akan (Twi) 0 0 0 0 0 Swahili 0 0 0 0 0 Creoles 0 0 0 0 0 Other languages 115 0 0 0 0 Multiple responses 10 0 0 10 0 English and French 0 0 0 0 0 English and non-official language 10 0 0 0 0 French and non-official language 0 0 0 0 0 English, French and non-official language 0 0 0 0 0Total population by knowledge of official language 3175 135 555 425 130 English only 3135 125 540 410 130 French only 0 0 0 0 0 English and French 50 10 15 10 0 Neither English nor French 0 0 0 0 0Total population by first official language spoken 3175 140 555 420 130 English 3155 130 550 415 130 French 25 0 0 10 0 English and French 0 0 0 0 0 Neither English nor French 0 0 0 0 0Official language minority - (number) 20 0 10 10 0Official language minority - (percentage) 0.6 0 1.8 2.4 0Total population by language spoken most often a 3175 135 555 420 130 Single responses 3170 140 555 420 130 English 3135 135 545 420 130 French 0 0 0 0 0 Non-official languages 35 0 10 0 0

Algonquin 0 0 0 0 0 Atikamekw 0 0 0 0 0 Blackfoot 0 0 0 0 0 Carrier 0 0 0 0 0 Chilcotin 0 0 0 0 0 Chipewyan 0 0 0 0 0 Cree 0 0 0 0 0 Siouan languages (Dakota/Sioux) 0 0 0 0 0 Dene 0 0 0 0 0 Dogrib 0 0 0 0 0 Gitksan 0 0 0 0 0 Inuinnaqtun 0 0 0 0 0 Inuktitut, n.i.e. 0 0 0 0 0 Kutchin-Gwich'in (Loucheux) 0 0 0 0 0 Malecite 0 0 0 0 0 Mi'kmaq 0 0 0 0 0 Mohawk 0 0 0 0 0 Montagnais-Naskapi 0 0 0 0 0 Nisga'a 0 0 0 0 0 North Slave (Hare) 0 0 0 0 0 Ojibway 0 0 0 0 0 Oji-Cree 0 0 0 0 0 Shuswap 0 0 0 0 0 South Slave 0 0 0 0 0 Tlingit 0 0 0 0 0 Italian 0 0 0 0 0 Portuguese 0 0 0 0 0 Romanian 0 0 0 0 0 Spanish 0 0 0 0 0 Danish 0 0 0 0 0 Dutch 0 0 0 0 0 Flemish 0 0 0 0 0 Frisian 0 0 0 0 0 German 0 0 0 0 0 Norwegian 0 0 0 0 0 Swedish 0 0 0 0 0 Yiddish 0 0 0 0 0 Bosnian 0 0 0 0 0 Bulgarian 0 0 0 0 0 Croatian 0 0 0 0 0 Czech 0 0 0 0 0 Macedonian 0 0 0 0 0 Polish 0 0 0 0 0 Russian 0 0 0 0 0 Serbian 0 0 0 0 0 Serbo-Croatian 0 0 0 0 0 Slovak 0 0 0 0 0 Slovenian 0 0 0 0 0 Ukrainian 0 0 0 0 0 Latvian 0 0 0 0 0 Lithuanian 0 0 0 0 0 Estonian 0 0 0 0 0 Finnish 0 0 0 0 0 Hungarian 0 0 0 0 0

Greek 0 0 0 0 0 Armenian 0 0 0 0 0 Turkish 0 0 0 0 0 Amharic 0 0 0 0 0 Arabic 0 0 0 0 0 Hebrew 0 0 0 0 0 Maltese 0 0 0 0 0 Somali 0 0 0 0 0 Tigrigna 0 0 0 0 0 Bengali 0 0 0 0 0 Gujarati 0 0 0 0 0 Hindi 0 0 0 0 0 Kurdish 0 0 0 0 0 Panjabi (Punjabi) 0 0 0 0 0 Pashto 0 0 0 0 0 Persian (Farsi) 0 0 0 0 0 Sindhi 0 0 0 0 0 Sinhala (Sinhalese) 0 0 0 0 0 Urdu 0 0 0 0 0 Malayalam 0 0 0 0 0 Tamil 0 0 0 0 0 Telugu 0 0 0 0 0 Japanese 0 0 0 0 0 Korean 0 0 0 0 0 Cantonese 0 0 0 0 0 Chinese, n.o.s. 0 0 0 0 0 Mandarin 0 0 0 0 0 Taiwanese 0 0 0 0 0 Lao 0 0 0 0 0 Khmer (Cambodian) 0 0 0 0 0 Vietnamese 0 0 0 0 0 Bisayan languages 0 0 0 0 0 Ilocano 0 0 0 0 0 Malay 0 0 0 0 0 Tagalog (Pilipino, Filipino) 0 0 0 0 0 Akan (Twi) 0 0 0 0 0 Swahili 0 0 0 0 0 Creoles 0 0 0 0 0 Other languages 25 0 10 0 0 Multiple responses 10 0 10 0 0 English and French 0 0 0 0 0 English and non-official language 10 0 0 0 0 French and non-official language 0 0 0 0 0 English, French and non-official language 0 0 0 0 0Algonquin - Various non-official languages spoken 0 0 0 0 0Atikamekw 0 0 0 0 0Blackfoot 0 0 0 0 0Carrier 0 0 0 0 0Chilcotin 0 0 0 0 0Chipewyan 0 0 0 0 0Cree 0 0 0 0 0Siouan languages (Dakota/Sioux) 10 0 0 0 0Dene 0 0 0 0 0Dogrib 0 0 0 0 0

Gitksan 0 0 0 0 0Inuinnaqtun 0 0 0 0 0Inuktitut, n.i.e. 0 0 0 0 0Kutchin-Gwich'in (Loucheux) 0 0 0 0 0Malecite 0 0 0 0 0Mi'kmaq 0 0 0 0 0Mohawk 0 0 0 0 0Montagnais-Naskapi 0 0 0 0 0Nisga'a 0 0 0 0 0North Slave (Hare) 0 0 0 0 0Ojibway 0 0 0 0 0Oji-Cree 0 0 0 0 0Shuswap 10 0 0 0 0South Slave 0 0 0 0 0Tlingit 0 0 0 0 0Italian 0 0 0 0 0Portuguese 0 0 0 10 0Romanian 10 0 0 0 0Spanish 15 10 10 0 0Danish 0 0 0 0 0Dutch 10 0 0 0 0Flemish 0 0 0 0 0Frisian 0 0 0 0 0German 15 0 10 0 0Norwegian 30 0 0 20 0Swedish 0 0 0 0 0Yiddish 0 0 0 0 0Bosnian 0 0 0 0 0Bulgarian 0 0 0 0 0Croatian 0 0 0 0 0Czech 0 0 0 0 0Macedonian 0 0 0 0 0Polish 0 0 0 0 0Russian 0 0 0 0 0Serbian 0 0 0 0 0Serbo-Croatian 0 0 0 0 0Slovak 0 0 0 0 0Slovenian 0 0 0 0 0Ukrainian 0 0 0 0 0Latvian 0 0 0 0 0Lithuanian 0 0 0 0 0Estonian 0 0 0 0 0Finnish 0 0 0 0 0Hungarian 0 0 10 0 0Greek 0 0 0 0 0Armenian 0 0 0 0 0Turkish 0 0 0 0 0Amharic 0 0 0 0 0Arabic 0 0 0 0 0Hebrew 0 0 0 0 0Maltese 0 0 0 0 0Somali 0 0 0 0 0Tigrigna 0 0 0 0 0Bengali 0 0 0 0 0

Gujarati 0 0 0 0 0Hindi 0 0 0 0 0Kurdish 0 0 0 0 0Panjabi (Punjabi) 0 0 0 0 0Pashto 0 0 0 0 0Persian (Farsi) 0 0 0 0 0Sindhi 0 0 0 0 0Sinhala (Sinhalese) 0 0 0 0 0Urdu 0 0 0 0 0Malayalam 0 0 0 0 0Tamil 0 0 0 0 0Telugu 0 0 0 0 0Japanese 20 0 0 0 20Korean 0 0 0 0 0Cantonese 20 0 0 0 20Chinese, n.o.s. 0 0 0 0 0Mandarin 0 0 0 0 0Taiwanese 0 0 0 0 0Lao 0 0 0 0 0Khmer (Cambodian) 0 0 0 0 0Vietnamese 0 0 0 0 0Bisayan languages 0 0 0 0 0Ilocano 0 0 0 0 0Malay 0 0 0 0 0Tagalog (Pilipino, Filipino) 0 0 0 0 0Akan (Twi) 0 0 0 0 0Swahili 0 0 0 0 0Creoles 0 0 0 0 0Other languages 180 10 15 0 0Total - Mobility status 1 year ago - 20% sample dat 3120 135 550 420 130 Non-movers 2705 120 515 370 70 Movers 420 15 35 45 60 Non-migrants 260 0 30 15 45 Migrants 160 10 10 25 20 Internal migrants 155 10 10 30 20 Intraprovincial migrants 145 10 10 25 20 Interprovincial migrants 10 0 0 0 0 External migrants 10 0 0 0 0Total - Mobility status 5 years ago - 20% sample da 2940 130 505 410 130 Non-movers 1965 85 315 225 70 Movers 975 45 185 185 65 Non-migrants 585 10 50 145 40 Migrants 390 40 135 40 20 Internal migrants 380 35 135 40 20 Intraprovincial migrants 340 30 115 45 20 Interprovincial migrants 45 0 20 0 0 External migrants 10 0 0 0 0Total population by citizenship - 20% sample data 3180 140 555 420 130 Canadian citizens 3140 135 545 420 130 Canadian citizens under age 18 825 20 130 90 0 Canadian citizens age 18 and over 2315 115 415 325 130 Not Canadian citizens 40 10 0 10 0Total population by immigrant status and place of 3180 140 555 420 130 Non-immigrants 3015 110 490 375 120

Born in province of residence 2690 75 360 285 95 Born outside province of residence 325 35 135 90 25 Immigrants 160 25 60 45 10 United States of America 75 0 30 20 0 Central America 0 0 0 0 0 Caribbean and Bermuda 0 0 0 0 0 South America 0 0 0 0 0 Europe 75 10 25 20 10 Western Europe 10 0 0 0 0 Eastern Europe 0 0 10 0 0 Southern Europe 0 0 0 0 0 Italy 0 0 0 0 0 Other Southern Europe 0 0 0 0 0 Northern Europe 60 10 20 20 10 United Kingdom 40 10 15 10 0 Other Northern Europe 20 0 0 10 10 Africa 0 0 0 0 0 Western Africa 0 0 0 0 0 Eastern Africa 0 0 0 0 0 Northern Africa 0 0 0 0 0 Central Africa 0 0 0 0 0 Southern Africa 0 0 0 0 0 Asia and the Middle East 10 10 0 0 0 West Central Asia and the Middle East 0 0 0 0 0 Eastern Asia 0 0 0 0 0 China, People's Republic of 0 0 0 0 0 Hong Kong, Special Administrative Region 0 0 0 0 0 Other Eastern Asia 0 0 0 0 0 Southeast Asia 0 0 0 0 0 Philippines 0 0 0 0 0 Other Southeast Asia 10 10 0 0 0 Southern Asia 0 0 0 0 0 India 0 0 0 0 0 Other Southern Asia 0 0 0 0 0 Oceania and other 10 0 0 0 0 Non-permanent residents 10 10 0 0 0Total recent immigrants by selected places of birt 0 0 0 0 0 United States of America 10 0 0 0 0 Central America 0 0 0 0 0 Caribbean and Bermuda 0 0 0 0 0 South America 0 0 0 0 0 Europe 0 0 0 0 0 Western Europe 0 0 0 0 0 Eastern Europe 0 0 0 0 0 Southern Europe 0 0 0 0 0 Italy 0 0 0 0 0 Other Southern Europe 0 0 0 0 0 Northern Europe 0 0 0 0 0 United Kingdom 0 0 0 0 0 Other Northern Europe 0 0 0 0 0 Africa 0 0 0 0 0 Western Africa 0 0 0 0 0 Eastern Africa 0 0 0 0 0 Northern Africa 0 0 0 0 0

Central Africa 0 0 0 0 0 Southern Africa 0 0 0 0 0 Asia and the Middle East 10 10 0 0 0 West Central Asia and the Middle East 0 0 0 0 0 Eastern Asia 0 0 0 0 0 China, People's Republic of 0 0 0 0 0 Hong Kong, Special Administrative Region 0 0 0 0 0 Other Eastern Asia 0 0 0 0 0 Southeast Asia 0 0 0 0 0 Philippines 0 0 0 0 0 Other Southeast Asia 0 0 0 0 0 Southern Asia 0 0 0 0 0 India 0 0 0 0 0 Other Southern Asia 0 0 0 0 0 Oceania and other 0 0 0 0 0Total immigrant population by period of immigratio 160 25 60 45 10 Before 1961 50 0 20 15 0 1961 to 1970 40 10 10 10 0 1971 to 1980 30 0 25 10 0 1981 to 1990 15 0 0 10 0 1991 to 2000 10 10 0 0 0 1991 to 1995 10 10 0 0 0 1996 to 2000 10 0 0 0 0 2001 to 2006 0 0 0 0 0Total immigrant population by age at immigration 160 25 60 45 0 Under 5 years 20 0 15 0 0 5 to 14 years 35 10 15 0 0 15 to 24 years 60 0 15 25 10 25 to 44 years 40 10 10 10 0 45 years and over 0 0 0 0 0Total population 15 years and older by generation 2500 125 455 345 130 1st generation 165 25 65 45 10 2nd generation 260 30 95 85 15 3rd generation or more 2070 60 300 210 110Total population by Aboriginal and non-Aboriginal i 3180 135 555 420 130 Total Aboriginal identity population 1990 10 55 15 65 North American Indian single response 1920 10 40 20 40 Métis single response 40 10 15 0 20 Inuit single response 0 0 0 0 0 Multiple Aboriginal identity responses 0 0 0 0 0 Aboriginal responses not included elsewhere 25 0 10 0 0 Non-Aboriginal identity population 1185 125 500 400 70Total population by Registered Indian status - 20% 3180 135 555 420 130 Registered Indian 1840 0 30 0 0 Not a Registered Indian 1335 135 525 415 130Total population 15 years and over by labour force 2500 125 455 340 130 In the labour force 1435 95 315 215 85 Employed 1160 85 290 180 40 Unemployed 275 10 25 35 40 Not in the labour force 1060 30 145 130 45Participation rate 57.4 76 69.2 63.2 65.4Employment rate 46.4 68 63.7 52.9 30.8Unemployment rate 19.2 10.5 7.9 16.3 47.1Population 15 to 24 years - Labour force activity 430 0 50 30 30
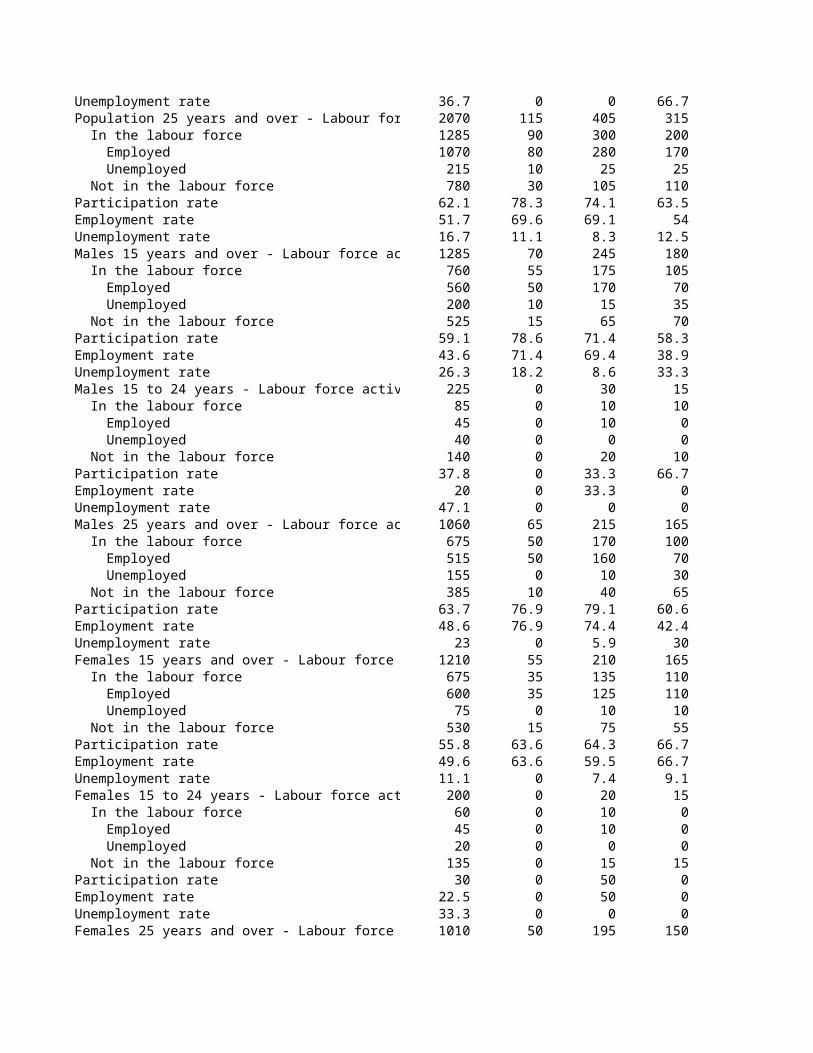
In the labour force 150 0 15 15 30 Employed 90 0 15 10 10 Unemployed 55 0 0 10 20 Not in the labour force 275 10 35 15 0Participation rate 34.9 0 30 50 0Employment rate 20.9 0 30 33.3 0Unemployment rate 36.7 0 0 66.7 0Population 25 years and over - Labour force activit 2070 115 405 315 100 In the labour force 1285 90 300 200 55 Employed 1070 80 280 170 30 Unemployed 215 10 25 25 20 Not in the labour force 780 30 105 110 50Participation rate 62.1 78.3 74.1 63.5 55Employment rate 51.7 69.6 69.1 54 30Unemployment rate 16.7 11.1 8.3 12.5 36.4Males 15 years and over - Labour force activity 1285 70 245 180 70 In the labour force 760 55 175 105 55 Employed 560 50 170 70 10 Unemployed 200 10 15 35 45 Not in the labour force 525 15 65 70 20Participation rate 59.1 78.6 71.4 58.3 78.6Employment rate 43.6 71.4 69.4 38.9 14.3Unemployment rate 26.3 18.2 8.6 33.3 81.8Males 15 to 24 years - Labour force activity 225 0 30 15 30 In the labour force 85 0 10 10 30 Employed 45 0 10 0 10 Unemployed 40 0 0 0 20 Not in the labour force 140 0 20 10 0Participation rate 37.8 0 33.3 66.7 0Employment rate 20 0 33.3 0 0Unemployment rate 47.1 0 0 0 0Males 25 years and over - Labour force activity 1060 65 215 165 40 In the labour force 675 50 170 100 25 Employed 515 50 160 70 0 Unemployed 155 0 10 30 20 Not in the labour force 385 10 40 65 20Participation rate 63.7 76.9 79.1 60.6 62.5Employment rate 48.6 76.9 74.4 42.4 0Unemployment rate 23 0 5.9 30 80Females 15 years and over - Labour force activity 1210 55 210 165 60 In the labour force 675 35 135 110 30 Employed 600 35 125 110 30 Unemployed 75 0 10 10 0 Not in the labour force 530 15 75 55 25Participation rate 55.8 63.6 64.3 66.7 50Employment rate 49.6 63.6 59.5 66.7 50Unemployment rate 11.1 0 7.4 9.1 0Females 15 to 24 years - Labour force activity 200 0 20 15 0 In the labour force 60 0 10 0 0 Employed 45 0 10 0 0 Unemployed 20 0 0 0 0 Not in the labour force 135 0 15 15 0Participation rate 30 0 50 0 0Employment rate 22.5 0 50 0 0

Unemployment rate 33.3 0 0 0 0Females 25 years and over - Labour force activity 1010 50 195 150 55 In the labour force 610 35 130 100 30 Employed 555 35 115 100 30 Unemployed 55 10 10 0 0 Not in the labour force 395 15 65 45 25Participation rate 60.4 70 66.7 66.7 54.5Employment rate 55 70 59 66.7 54.5Unemployment rate 9 28.6 7.7 0 0Total population 15 years and over by presence of c 2465 110 445 330 130 In the labour force 1410 80 305 205 80 Employed 1140 75 285 170 45 Unemployed 270 0 20 35 40 Not in the labour force 1055 30 140 125 45Participation rate 57.2 72.7 68.5 62.1 61.5Employment rate 46.2 68.2 64 51.5 34.6Unemployment rate 19.1 0 6.6 17.1 50Population 15 years and over in private households 1520 90 310 230 120 In the labour force 810 60 195 125 75 Employed 640 55 175 110 30 Unemployed 170 10 15 15 40 Not in the labour force 705 25 115 105 45Participation rate 53.3 66.7 62.9 54.3 62.5Employment rate 42.1 61.1 56.5 47.8 25Unemployment rate 21 16.7 7.7 12 53.3Population 15 years and over in private households 940 25 140 95 10 In the labour force 595 20 115 80 10 Employed 495 20 105 65 10 Unemployed 100 0 0 15 0 Not in the labour force 350 0 25 20 0Participation rate 63.3 80 82.1 84.2 0Employment rate 52.7 80 75 68.4 0Unemployment rate 16.8 0 0 18.8 0Population 15 years and over in private households 195 10 45 15 0 In the labour force 115 0 40 15 0 Employed 90 10 40 10 0 Unemployed 25 0 0 10 0 Not in the labour force 75 0 0 0 0Participation rate 59 0 88.9 0 0Employment rate 46.2 100 88.9 0 0Unemployment rate 21.7 0 0 0 0Population 15 years and over in private households 145 0 25 0 0 In the labour force 80 0 15 0 0 Employed 70 10 10 0 0 Unemployed 15 0 0 0 0 Not in the labour force 65 0 0 0 0Participation rate 55.2 0 60 0 0Employment rate 48.3 0 40 0 0Unemployment rate 18.8 0 0 0 0Population 15 years and over in private households 605 15 65 80 0 In the labour force 395 15 55 65 0 Employed 340 15 55 55 10 Unemployed 55 0 0 10 0 Not in the labour force 205 0 15 20 0

Participation rate 65.3 100 84.6 81.2 0Employment rate 56.2 100 84.6 68.8 0Unemployment rate 13.9 0 0 15.4 0Males 15 years and over in private households - Pre 1270 60 240 170 70 In the labour force 750 50 175 100 55 Employed 545 40 165 70 10 Unemployed 195 10 15 35 40 Not in the labour force 520 15 65 70 20Participation rate 59.1 83.3 72.9 58.8 78.6Employment rate 42.9 66.7 68.8 41.2 14.3Unemployment rate 26 20 8.6 35 72.7Males 15 years and over in private households with 845 50 175 125 75 In the labour force 450 35 115 55 50 Employed 320 30 100 40 10 Unemployed 130 0 10 15 40 Not in the labour force 390 15 65 70 20Participation rate 53.3 70 65.7 44 66.7Employment rate 37.9 60 57.1 32 13.3Unemployment rate 28.9 0 8.7 27.3 80Males 15 years and over in private households with 425 10 65 45 0 In the labour force 295 15 65 45 0 Employed 230 10 60 30 0 Unemployed 65 0 0 15 0 Not in the labour force 125 0 10 0 0Participation rate 69.4 100 100 100 0Employment rate 54.1 100 92.3 66.7 0Unemployment rate 22 0 0 33.3 0Males 15 years and over in private households with 90 10 20 10 0 In the labour force 65 0 20 10 0 Employed 45 0 20 0 0 Unemployed 20 0 0 10 0 Not in the labour force 20 0 0 0 0Participation rate 72.2 0 0 0 0Employment rate 50 0 0 0 0Unemployment rate 30.8 0 0 0 0Males 15 years and over in private households with 70 10 15 0 0 In the labour force 45 0 10 0 0 Employed 40 0 15 0 0 Unemployed 10 0 0 0 0 Not in the labour force 25 0 0 0 0Participation rate 64.3 0 66.7 0 0Employment rate 57.1 0 100 0 0Unemployment rate 22.2 0 0 0 0Males 15 years and over in private households with 265 10 35 35 0 In the labour force 185 10 30 35 0 Employed 145 10 25 25 0 Unemployed 40 0 0 10 0 Not in the labour force 80 0 0 0 0Participation rate 69.8 100 85.7 100 0Employment rate 54.7 100 71.4 71.4 0Unemployment rate 21.6 0 0 28.6 0Females 15 years and over in private households - P 1195 50 205 155 60 In the labour force 660 35 130 100 30 Employed 590 35 120 105 30

Unemployed 70 0 10 0 0 Not in the labour force 530 15 75 55 25Participation rate 55.2 70 63.4 64.5 50Employment rate 49.4 70 58.5 67.7 50Unemployment rate 10.6 0 7.7 0 0Females 15 years and over in private households w 675 40 130 105 50 In the labour force 360 25 80 70 20 Employed 320 25 75 70 25 Unemployed 40 0 10 0 0 Not in the labour force 310 10 50 35 25Participation rate 53.3 62.5 61.5 66.7 40Employment rate 47.4 62.5 57.7 66.7 50Unemployment rate 11.1 0 12.5 0 0Females 15 years and over in private households w 520 15 70 55 0 In the labour force 300 10 50 30 0 Employed 270 10 45 35 10 Unemployed 35 0 0 0 0 Not in the labour force 220 10 25 20 0Participation rate 57.7 66.7 71.4 54.5 0Employment rate 51.9 66.7 64.3 63.6 0Unemployment rate 11.7 0 0 0 0Females 15 years and over in private households wi 110 0 25 0 0 In the labour force 50 0 20 10 0 Employed 40 0 20 0 0 Unemployed 0 0 0 0 0 Not in the labour force 55 0 0 0 0Participation rate 45.5 0 0 0 0Employment rate 36.4 0 0 0 0Unemployment rate 0 0 0 0 0Females 15 years and over in private households wi 75 0 10 0 0 In the labour force 35 0 10 0 0 Employed 30 0 0 0 0 Unemployed 10 0 0 0 0 Not in the labour force 40 0 10 0 0Participation rate 46.7 0 100 0 0Employment rate 40 0 0 0 0Unemployment rate 28.6 0 0 0 0Females 15 years and over in private households wi 335 10 35 50 10 In the labour force 215 0 20 25 10 Employed 195 10 25 30 10 Unemployed 15 0 0 0 0 Not in the labour force 125 0 10 20 0Participation rate 64.2 0 57.1 50 0Employment rate 58.2 100 71.4 60 0Unemployment rate 7 0 0 0 0Total labour force 15 years and over by class of w 1435 90 315 215 85 Class of worker - Not applicable 45 0 0 0 0 All classes of worker 1390 90 310 210 80 Paid workers 1245 70 270 155 85 Employees 1220 70 255 155 85 Self-employed (incorporated) 20 0 15 0 0 Without paid help 10 0 0 0 10 With paid help 15 0 10 0 0 Self-employed (unincorporated) 145 15 40 60 0

Without paid help 75 10 25 25 0 With paid help 70 0 20 30 0 Unpaid family workers 0 0 0 0 0Male labour force 15 years and over - class of work 760 50 180 105 50 Class of worker - Not applicable 35 0 0 0 0 All classes of worker 725 55 175 105 50 Paid workers 640 45 150 70 55 Employees 620 45 135 70 50 Self-employed (incorporated) 20 10 15 0 0 Without paid help 10 0 0 0 0 With paid help 15 0 10 0 0 Self-employed (unincorporated) 80 10 25 30 0 Without paid help 35 10 10 10 0 With paid help 50 0 15 20 0 Unpaid family workers 0 0 0 0 0Female labour force 15 years and over - class of w 675 35 135 110 30 Class of worker - Not applicable 10 0 0 0 0 All classes of worker 665 35 135 105 30 Paid workers 605 30 120 80 30 Employees 600 25 120 85 30 Self-employed (incorporated) 10 0 0 0 0 Without paid help 10 0 0 0 0 With paid help 0 0 0 0 0 Self-employed (unincorporated) 60 10 15 25 0 Without paid help 35 10 10 15 0 With paid help 20 0 0 10 0 Unpaid family workers 0 0 0 0 0Total labour force 15 years and over by occupation 1435 90 310 215 85 Occupation - Not applicable 45 0 0 10 0 All occupations 1390 95 310 210 80 A Management occupations 110 15 25 10 10 A0 Senior management occupations 20 0 0 0 0 A1 Specialist managers 10 10 0 0 0 A2 Managers in retail trade, food and accommo 45 15 10 10 10 A3 Other managers, n.e.c. 40 10 15 0 0 B Business, finance and administration occupati 190 10 30 35 20 B0 Professional occupations in business and f 10 0 0 0 0 B1 Finance and insurance administration occup 20 0 10 0 0 B2 Secretaries 30 0 0 15 0 B3 Administrative and regulatory occupations 35 0 10 0 20 B4 Clerical supervisors 0 0 10 10 0 B5 Clerical occupations 85 10 10 10 0 C Natural and applied sciences and related occu 70 10 40 10 0 C0 Professional occupations in natural and app 35 0 25 10 0 C1 Technical occupations related to natural an 35 0 10 10 0 D Health occupations 65 0 15 20 0 D0 Professional occupations in health 10 0 0 10 0 D1 Nurse supervisors and registered nurses 10 0 10 0 0 D2 Technical and related occupations in health 20 0 0 15 0 D3 Assisting occupations in support of health s 25 0 10 0 0 E Occupations in social science, education, gov 185 0 35 25 0 E0 Judges, lawyers, psychologists, social worke 55 0 0 15 0 E1 Teachers and professors 85 0 25 10 0 E2 Paralegals, social services workers and occ 50 0 10 0 0

F Occupations in art, culture, recreation and spor 10 0 10 0 0 F0 Professional occupations in art and culture 0 0 0 0 0 F1 Technical occupations in art, culture, recrea 10 0 0 0 0 G Sales and service occupations 355 25 65 50 55 G0 Sales and service supervisors 10 0 0 0 0 G1 Wholesale, technical, insurance, real estate 0 0 10 0 0 G2 Retail salespersons and sales clerks 35 0 10 15 10 G3 Cashiers 45 0 0 10 20 G4 Chefs and cooks 45 0 0 10 20 G5 Occupations in food and beverage service 20 10 10 0 0 G6 Occupations in protective services 10 0 0 0 0 G7 Occupations in travel and accommodation, i 25 0 15 0 0 G8 Child care and home support workers 40 10 0 0 0 G9 Sales and service occupations, n.e.c. 120 10 20 15 0 H Trades, transport and equipment operators an 175 15 55 35 0 H0 Contractors and supervisors in trades and t 10 0 0 0 0 H1 Construction trades 35 0 15 0 0 H2 Stationary engineers, power station operat 30 0 25 0 0 H3 Machinists, metal forming, shaping and ere 0 0 0 0 0 H4 Mechanics 15 0 0 10 0 H5 Other trades, n.e.c. 10 0 0 0 0 H6 Heavy equipment and crane operators, includ 0 0 0 0 0 H7 Transportation equipment operators and rel 40 0 0 15 0 H8 Trades helpers, construction and transport 45 0 15 0 0 I Occupations unique to primary industry 180 10 40 20 0 I0 Occupations unique to agriculture, excluding 30 0 10 15 0 I1 Occupations unique to forestry operations, m 105 0 15 0 0 I2 Primary production labourers 45 10 10 0 0 J Occupations unique to processing, manufacturin 35 10 0 0 0 J0 Supervisors in manufacturing 0 0 0 0 0 J1 Machine operators in manufacturing 25 10 0 0 0 J2 Assemblers in manufacturing 0 0 0 0 0 J3 Labourers in processing, manufacturing and u 15 0 0 0 0Male labour force 15 years and over by occupation - 760 55 175 105 55 Occupation - Not applicable 35 0 0 0 0 All occupations 725 55 175 100 55 A Management occupations 50 10 10 10 0 A0 Senior management occupations 10 0 0 0 0 A1 Specialist managers 10 0 0 0 0 A2 Managers in retail trade, food and accommo 10 10 0 10 0 A3 Other managers, n.e.c. 20 0 0 0 0 B Business, finance and administration occupati 40 0 10 10 20 B0 Professional occupations in business and f 0 0 0 0 0 B1 Finance and insurance administration occup 0 0 0 0 0 B2 Secretaries 0 0 0 0 0 B3 Administrative and regulatory occupations 25 0 0 0 20 B4 Clerical supervisors 0 0 0 0 0 B5 Clerical occupations 10 0 0 0 0 C Natural and applied sciences and related occu 45 0 20 10 0 C0 Professional occupations in natural and app 20 0 15 10 0 C1 Technical occupations related to natural an 25 10 10 0 0 D Health occupations 25 0 10 10 0 D0 Professional occupations in health 10 0 0 10 0 D1 Nurse supervisors and registered nurses 0 0 0 0 0

D2 Technical and related occupations in health 0 0 0 10 0 D3 Assisting occupations in support of health s 10 0 10 0 0 E Occupations in social science, education, gov 65 0 15 10 0 E0 Judges, lawyers, psychologists, social worke 15 0 0 10 0 E1 Teachers and professors 35 0 20 0 0 E2 Paralegals, social services workers and occ 20 0 0 0 0 F Occupations in art, culture, recreation and spor 10 0 0 0 0 F0 Professional occupations in art and culture 0 0 0 0 0 F1 Technical occupations in art, culture, recrea 10 0 0 0 0 G Sales and service occupations 145 15 25 25 35 G0 Sales and service supervisors 0 0 0 0 0 G1 Wholesale, technical, insurance, real estate 10 0 0 0 0 G2 Retail salespersons and sales clerks 10 0 0 0 0 G3 Cashiers 0 0 0 0 0 G4 Chefs and cooks 35 0 0 10 20 G5 Occupations in food and beverage service 0 0 0 0 0 G6 Occupations in protective services 15 0 0 10 0 G7 Occupations in travel and accommodation, i 0 0 0 0 0 G8 Child care and home support workers 0 0 0 0 0 G9 Sales and service occupations, n.e.c. 65 10 15 10 0 H Trades, transport and equipment operators an 170 15 55 35 0 H0 Contractors and supervisors in trades and t 10 0 0 0 0 H1 Construction trades 35 0 15 0 0 H2 Stationary engineers, power station operat 30 0 25 0 0 H3 Machinists, metal forming, shaping and ere 10 0 0 0 0 H4 Mechanics 15 10 0 10 0 H5 Other trades, n.e.c. 0 0 0 0 0 H6 Heavy equipment and crane operators, includ 0 0 0 0 0 H7 Transportation equipment operators and rel 35 0 0 15 0 H8 Trades helpers, construction and transport 45 0 10 0 0 I Occupations unique to primary industry 150 10 25 10 0 I0 Occupations unique to agriculture, excluding 10 0 10 10 0 I1 Occupations unique to forestry operations, m 95 10 15 0 0 I2 Primary production labourers 40 0 10 0 0 J Occupations unique to processing, manufacturin 25 0 0 0 0 J0 Supervisors in manufacturing 0 0 0 0 0 J1 Machine operators in manufacturing 20 10 10 0 0 J2 Assemblers in manufacturing 0 0 0 0 0 J3 Labourers in processing, manufacturing and u 10 0 0 0 0Female labour force 15 years and over by occupation 675 40 135 110 30 Occupation - Not applicable 10 0 0 0 0 All occupations 670 35 135 110 30 A Management occupations 60 10 15 0 10 A0 Senior management occupations 10 0 0 0 0 A1 Specialist managers 0 0 0 0 0 A2 Managers in retail trade, food and accommo 30 10 0 0 10 A3 Other managers, n.e.c. 15 0 10 0 0 B Business, finance and administration occupati 150 0 30 30 0 B0 Professional occupations in business and f 0 0 0 10 0 B1 Finance and insurance administration occup 20 0 10 0 0 B2 Secretaries 35 0 10 20 0 B3 Administrative and regulatory occupations 10 0 0 0 0 B4 Clerical supervisors 0 0 0 0 0 B5 Clerical occupations 70 0 10 0 0

C Natural and applied sciences and related occu 25 0 20 0 0 C0 Professional occupations in natural and app 15 0 15 0 0 C1 Technical occupations related to natural an 10 10 0 0 0 D Health occupations 45 0 10 15 0 D0 Professional occupations in health 0 0 0 0 0 D1 Nurse supervisors and registered nurses 10 0 10 0 0 D2 Technical and related occupations in health 15 0 0 10 0 D3 Assisting occupations in support of health s 15 0 0 0 0 E Occupations in social science, education, gov 125 0 10 20 0 E0 Judges, lawyers, psychologists, social worke 35 0 10 10 0 E1 Teachers and professors 50 0 10 10 0 E2 Paralegals, social services workers and occ 35 0 0 10 0 F Occupations in art, culture, recreation and spor 10 0 0 0 0 F0 Professional occupations in art and culture 0 0 0 0 0 F1 Technical occupations in art, culture, recrea 0 0 0 0 0 G Sales and service occupations 210 15 40 30 20 G0 Sales and service supervisors 10 0 10 0 0 G1 Wholesale, technical, insurance, real estate 0 0 0 0 0 G2 Retail salespersons and sales clerks 25 0 10 10 0 G3 Cashiers 45 0 0 10 20 G4 Chefs and cooks 0 0 0 0 0 G5 Occupations in food and beverage service 20 10 10 0 0 G6 Occupations in protective services 0 0 10 0 0 G7 Occupations in travel and accommodation, i 15 0 10 0 0 G8 Child care and home support workers 35 0 10 0 0 G9 Sales and service occupations, n.e.c. 60 10 0 0 0 H Trades, transport and equipment operators an 10 0 0 0 0 H0 Contractors and supervisors in trades and t 0 0 0 0 0 H1 Construction trades 0 0 0 0 0 H2 Stationary engineers, power station operat 0 0 0 0 0 H3 Machinists, metal forming, shaping and ere 0 0 0 0 0 H4 Mechanics 0 0 0 0 0 H5 Other trades, n.e.c. 0 0 0 0 0 H6 Heavy equipment and crane operators, includ 0 0 0 0 0 H7 Transportation equipment operators and rel 0 0 0 0 0 H8 Trades helpers, construction and transport 0 0 0 0 0 I Occupations unique to primary industry 30 0 10 10 0 I0 Occupations unique to agriculture, excluding 20 0 10 0 0 I1 Occupations unique to forestry operations, m 10 0 0 0 0 I2 Primary production labourers 10 0 0 0 0 J Occupations unique to processing, manufacturin 10 0 0 0 0 J0 Supervisors in manufacturing 0 0 0 0 0 J1 Machine operators in manufacturing 10 0 0 0 0 J2 Assemblers in manufacturing 0 0 0 0 0 J3 Labourers in processing, manufacturing and u 0 0 0 0 0Total labour force 15 years and over by industry - 1435 90 310 215 85 Industry - Not applicable 45 0 0 0 0 All industries 1390 95 310 210 85 11 Agriculture, forestry, fishing and hunting 195 10 35 30 0 21 Mining and oil and gas extraction 0 0 0 0 0 22 Utilities 0 0 0 0 0 23 Construction 70 0 25 15 0 31-33 Manufacturing 45 10 0 0 0 41 Wholesale trade 10 0 0 10 0

44-45 Retail trade 140 0 20 30 35 48-49 Transportation and warehousing 30 0 15 10 0 51 Information and cultural industries 25 0 25 0 0 52 Finance and insurance 10 0 0 10 0 53 Real estate and rental and leasing 0 0 0 0 0 54 Professional, scientific and technical services 20 0 10 10 0 55 Management of companies and enterprises 0 0 0 0 0 56 Administrative and support, waste manageme 60 0 25 0 0 61 Educational services 195 10 60 25 0 62 Health care and social assistance 155 0 20 40 0 71 Arts, entertainment and recreation 10 0 0 0 10 72 Accommodation and food services 120 30 15 15 20 81 Other services (except public administration) 35 0 0 20 0 91 Public administration 240 10 45 0 20Male labour force 15 years and over - Industry - N 760 55 175 105 50 Industry - Not applicable 40 0 0 0 0 All industries 725 50 175 105 50 11 Agriculture, forestry, fishing and hunting 155 10 30 20 0 21 Mining and oil and gas extraction 0 0 0 0 0 22 Utilities 10 0 0 0 0 23 Construction 60 10 20 10 0 31-33 Manufacturing 35 0 10 0 0 41 Wholesale trade 10 0 0 0 0 44-45 Retail trade 30 0 10 0 10 48-49 Transportation and warehousing 15 10 10 0 0 51 Information and cultural industries 25 0 20 0 0 52 Finance and insurance 0 0 0 0 0 53 Real estate and rental and leasing 10 0 0 0 0 54 Professional, scientific and technical services 10 0 10 10 0 55 Management of companies and enterprises 0 0 0 0 0 56 Administrative and support, waste manageme 40 0 15 10 0 61 Educational services 65 0 30 10 0 62 Health care and social assistance 30 0 0 10 0 71 Arts, entertainment and recreation 10 0 0 0 0 72 Accommodation and food services 65 15 0 10 20 81 Other services (except public administration) 30 0 0 20 0 91 Public administration 140 0 20 0 20Female labour force 15 years and over - Industry - 675 40 135 110 35 Industry - Not applicable 10 0 0 0 0 All industries 670 35 135 105 35 11 Agriculture, forestry, fishing and hunting 40 0 10 10 0 21 Mining and oil and gas extraction 0 0 0 0 0 22 Utilities 0 0 0 0 0 23 Construction 10 0 0 0 0 31-33 Manufacturing 15 10 0 0 0 41 Wholesale trade 10 0 0 0 0 44-45 Retail trade 105 0 10 25 30 48-49 Transportation and warehousing 15 0 0 0 0 51 Information and cultural industries 0 0 0 0 0 52 Finance and insurance 10 0 0 0 0 53 Real estate and rental and leasing 0 0 0 0 0 54 Professional, scientific and technical services 10 0 0 0 0 55 Management of companies and enterprises 0 0 0 0 0 56 Administrative and support, waste manageme 20 0 10 0 0

61 Educational services 135 0 25 20 0 62 Health care and social assistance 125 0 20 30 0 71 Arts, entertainment and recreation 0 0 0 0 0 72 Accommodation and food services 60 20 10 10 0 81 Other services (except public administration) 0 0 0 0 0 91 Public administration 100 0 25 0 0Total employed labour force 15 years and over by 1160 80 290 180 45 Usual place of work 845 45 230 115 40 In census subdivision of residence 525 25 0 105 20 In different census subdivision 320 20 220 10 20 In same census division 270 15 200 0 20 At home 115 15 20 55 0 Outside Canada 0 0 0 0 0 No fixed workplace address 200 25 40 0 0Males 565 50 165 70 10 Usual place of work 355 25 125 30 10 In census subdivision of residence 190 15 0 25 10 In different census subdivision 165 10 120 0 0 In same census division 140 0 120 0 0 At home 55 10 10 30 0 Outside Canada 0 0 0 0 0 No fixed workplace address 150 20 30 0 0Females 600 35 125 105 30 Usual place of work 490 20 105 80 30 In census subdivision of residence 330 10 10 80 10 In different census subdivision 160 10 95 0 20 In same census division 130 10 80 0 20 At home 60 10 15 20 0 Outside Canada 0 0 0 0 0 No fixed workplace address 50 10 0 0 0Total employed labour force 15 years and over with 1045 65 270 120 40 Car, truck, van, as driver 580 15 240 100 20 Car, truck, van, as passenger 85 0 10 10 0 Public transit 10 0 0 0 0 Walked 270 35 10 10 20 Bicycle 10 0 0 0 0 Motorcycle 0 0 0 0 0 Taxicab 0 0 0 0 0 Other method 85 20 0 0 0Males with usual place of work or no fixed workpla 500 45 160 35 10 Car, truck, van, as driver 295 10 140 25 10 Car, truck, van, as passenger 30 0 0 10 0 Public transit 0 0 0 0 0 Walked 95 20 0 10 0 Bicycle 10 0 0 0 0 Motorcycle 0 0 0 0 0 Taxicab 10 0 0 0 0 Other method 80 15 10 0 0Females with usual place of work or no fixed work 540 30 110 85 30 Car, truck, van, as driver 285 0 100 70 10 Car, truck, van, as passenger 55 0 10 10 0 Public transit 10 0 0 0 0 Walked 175 15 10 10 20 Bicycle 0 0 0 0 0

Motorcycle 0 0 0 0 0 Taxicab 10 0 0 0 0 Other method 10 0 0 0 0Total population 15 years and over who worked si 1690 105 355 265 85 Single responses 1685 105 355 265 85 English 1680 100 355 265 85 French 0 0 0 0 0 Non-official languages 0 0 0 0 0 Chinese, n.o.s. 0 0 0 0 0 Cantonese 0 0 0 0 0 Panjabi (Punjabi) 0 0 0 0 0 German 0 0 0 0 0 Mandarin 0 0 0 0 0 Portuguese 0 0 0 0 0 Spanish 0 0 0 0 0 Vietnamese 0 0 0 0 0 Korean 0 0 0 0 0 Italian 0 0 0 0 0 Other languages 0 0 0 0 0 Multiple responses 10 0 0 0 0 English and French 0 0 0 0 0 English and non-official language 0 0 0 0 0 French and non-official language 0 0 0 0 0 English, French and non-official language 0 0 0 0 0Total population 15 years and over by hours spen 2495 120 455 340 130 No hours of unpaid housework 210 10 20 40 20 Less than 5 hours of unpaid housework 320 25 45 30 15 5 to 14 hours of unpaid housework 735 25 160 120 10 15 to 29 hours of unpaid housework 635 40 105 60 65 30 to 59 hours of unpaid housework 415 10 100 85 10 60 hours or more of unpaid housework 170 15 35 10 10Males 15 years and over - Hours spent doing unpa 1285 70 245 180 70 No hours of unpaid housework 130 10 15 15 0 Less than 5 hours of unpaid housework 205 20 40 15 15 5 to 14 hours of unpaid housework 360 20 75 55 10 15 to 29 hours of unpaid housework 320 15 65 35 45 30 to 59 hours of unpaid housework 195 0 50 40 0 60 hours or more of unpaid housework 70 0 10 10 0Females 15 years and over - Hours spent doing u 1210 55 210 160 55 No hours of unpaid housework 85 10 0 20 15 Less than 5 hours of unpaid housework 115 10 10 10 0 5 to 14 hours of unpaid housework 370 0 85 65 10 15 to 29 hours of unpaid housework 315 25 40 20 20 30 to 59 hours of unpaid housework 220 0 45 40 10 60 hours or more of unpaid housework 100 10 25 0 15Total population 15 years and over by hours spent l 2500 120 460 340 130 No hours of unpaid child care 1360 95 320 245 130 Less than 5 hours of unpaid child care 195 10 15 30 0 5 to 14 hours of unpaid child care 205 0 50 15 0 15 to 29 hours of unpaid child care 160 10 15 0 0 30 to 59 hours of unpaid child care 160 0 20 15 0 60 hours or more of unpaid child care 410 0 40 35 0Males 15 years and over - Hours spent looking after 1290 65 245 180 70 No hours of unpaid child care 770 55 175 130 70

Less than 5 hours of unpaid child care 110 0 15 20 0 5 to 14 hours of unpaid child care 115 0 30 10 0 15 to 29 hours of unpaid child care 80 10 15 0 0 30 to 59 hours of unpaid child care 65 0 10 0 0 60 hours or more of unpaid child care 150 10 10 15 0Females 15 years and over - Hours spent looking aft 1210 55 210 165 60 No hours of unpaid child care 590 45 140 110 55 Less than 5 hours of unpaid child care 85 10 0 0 0 5 to 14 hours of unpaid child care 90 0 20 0 0 15 to 29 hours of unpaid child care 85 0 0 10 0 30 to 59 hours of unpaid child care 95 0 15 15 0 60 hours or more of unpaid child care 260 10 30 15 0Total population 15 years and over by hours spent 2495 125 455 340 130 No hours of unpaid care or assistance to seniors 1980 105 380 305 120 Less than 5 hours of unpaid care or assistance to 230 10 25 10 0 5 to 9 hours of unpaid care or assistance to senio 135 0 35 10 10 10 to 19 hours of unpaid care or assistance to sen 40 0 10 0 0 20 hours or more of unpaid care or assistance to 110 0 10 20 0Males 15 years and over - Hours spent providing un 1285 70 245 175 70 No hours of unpaid care or assistance to seniors 1040 60 200 150 70 Less than 5 hours of unpaid care or assistance to 90 10 10 0 0 5 to 9 hours of unpaid care or assistance to senio 70 0 30 10 0 10 to 19 hours of unpaid care or assistance to sen 20 0 0 0 0 20 hours or more of unpaid care or assistance to 70 0 10 20 0Females 15 years and over - Hours spent providing 1210 55 210 160 55 No hours of unpaid care or assistance to seniors 940 45 180 155 45 Less than 5 hours of unpaid care or assistance to 145 10 20 10 0 5 to 9 hours of unpaid care or assistance to senio 60 0 10 0 10 10 to 19 hours of unpaid care or assistance to sen 20 0 0 0 0 20 hours or more of unpaid care or assistance to 45 0 0 0 0Total male population 25 to 64 years with postsecon 355 25 110 65 20 Education 55 0 20 10 0 Visual and performing arts, and communications 40 10 30 10 0 Humanities 15 0 0 10 0 Social and behavioural sciences and law 10 0 0 0 0 Business, management and public administration 50 0 0 10 20 Physical and life sciences and technologies 10 0 15 0 0 Mathematics, computer and information sciences 0 0 10 0 0 Architecture, engineering, and related technologie 80 15 15 15 0 Agriculture, natural resources and conservation 30 10 0 10 0 Health, parks, recreation and fitness 15 0 0 0 0 Personal, protective and transportation services 40 10 0 15 0 Other fields of study 0 0 0 0 0Total female population 25 to 64 years with postsec 320 20 90 45 0 Education 60 0 10 10 0 Visual and performing arts, and communications 0 0 0 0 0 Humanities 15 0 10 0 0 Social and behavioural sciences and law 35 0 10 0 0 Business, management and public administration 80 10 10 15 0 Physical and life sciences and technologies 0 0 0 0 0 Mathematics, computer and information sciences 0 0 0 0 0 Architecture, engineering, and related technologie 15 0 15 0 0 Agriculture, natural resources and conservation 0 0 0 0 0 Health, parks, recreation and fitness 70 0 20 20 0

Personal, protective and transportation services 15 0 0 0 0 Other fields of study 0 0 0 0 0Total population 15 to 24 years by highest certific 425 10 50 30 30 No certificate, diploma or degree 230 0 20 10 10 Certificate, diploma or degree 195 0 30 20 20 High school certificate or equivalent 165 0 15 20 20 Apprenticeship or trades certificate or diploma 20 0 0 0 0 College, CEGEP or other non-university certifica 10 0 0 0 0 University certificate, diploma or degree 10 0 0 0 0 University certificate or diploma below bachelor 10 0 0 0 0 University certificate or degree 0 0 0 0 0 Bachelor's degree 0 0 0 0 0 University certificate or diploma above bachelo 0 0 0 0 0 Degree in medicine, dentistry, veterinary med 0 0 0 0 0 Master's degree 0 0 0 0 0 Earned doctorate 0 0 0 0 0Total population 25 to 64 years by highest certific 1745 100 345 225 65 No certificate, diploma or degree 585 20 30 20 25 Certificate, diploma or degree 1165 75 320 205 40 High school certificate or equivalent 485 30 115 90 20 Apprenticeship or trades certificate or diploma 180 20 20 25 20 College, CEGEP or other non-university certifica 230 20 65 45 0 University certificate, diploma or degree 260 0 115 45 10 University certificate or diploma below bachelor 55 0 25 0 0 University certificate or degree 205 0 90 45 0 Bachelor's degree 130 10 60 25 0 University certificate or diploma above bachelo 40 0 10 10 0 Degree in medicine, dentistry, veterinary med 10 0 0 0 0 Master's degree 30 0 20 10 0 Earned doctorate 0 0 0 0 0Total population 65 years and over by highest cert 320 20 60 85 35 No certificate, diploma or degree 190 0 15 70 10 Certificate, diploma or degree 130 15 45 10 25 High school certificate or equivalent 30 0 10 10 0 Apprenticeship or trades certificate or diploma 30 0 15 0 0 College, CEGEP or other non-university certifica 35 0 10 0 10 University certificate, diploma or degree 35 0 15 0 10 University certificate or diploma below bachelor 10 0 10 0 0 University certificate or degree 30 0 10 0 10 Bachelor's degree 20 0 0 0 10 University certificate or diploma above bachelo 0 0 0 0 0 Degree in medicine, dentistry, veterinary med 0 0 0 0 0 Master's degree 10 0 0 0 0 Earned doctorate 0 0 0 0 0Total population 25 to 64 years with postsecondary 675 50 200 115 25 Inside Canada 630 40 185 100 25 Newfoundland and Labrador 0 0 0 0 0 Prince Edward Island 0 0 0 0 0 Nova Scotia 0 0 0 0 0 New Brunswick 0 0 0 0 0 Quebec 0 0 0 0 0 Ontario 70 0 45 10 0 Manitoba 0 0 0 0 0 Saskatchewan 20 0 0 10 0

Alberta 10 0 10 0 0 British Columbia 520 35 130 80 20 Yukon Territory 0 0 0 0 0 Northwest Territories 0 0 0 0 0 Nunavut 0 0 0 0 0 Outside Canada 45 10 15 10 0Total population by Aboriginal and non-Aboriginal 3175 135 555 420 130 Total Aboriginal ancestry population 2025 20 85 15 60 North American Indian single ancestry 1835 10 20 10 65 North American Indian and non-Aboriginal ancest 175 0 50 10 0 Métis single ancestry 0 0 0 0 0 Métis and non-Aboriginal ancestries 10 0 10 0 0 Inuit single ancestry 0 0 0 0 0 Inuit and non-Aboriginal ancestries 0 0 0 0 0 Other Aboriginal multiple ancestries 0 0 0 0 0 Non-Aboriginal ancestry population 1150 120 475 405 65Total population by visible minority groups - 20% s 3180 140 555 420 130 Total visible minority population 35 0 10 15 0 Chinese 15 0 0 15 0 South Asian 0 0 0 0 0 Black 0 0 0 0 0 Filipino 0 0 0 0 0 Latin American 0 0 0 0 0 Southeast Asian 0 0 0 0 0 Arab 0 0 0 0 0 West Asian 0 0 0 0 0 Korean 0 0 0 0 0 Japanese 10 10 0 0 0 Visible minority, n.i.e. 10 0 0 0 0 Multiple visible minority 0 0 0 0 0 Not a visible minority 3145 135 550 405 130Total population by ethnic origin - 20% sample data 3180 135 555 420 130 British Isles origins 755 90 330 185 45 Cornish 0 0 0 0 0 English 465 45 215 105 30 Irish 285 30 130 80 20 Manx 0 0 0 0 0 Scottish 330 35 145 100 0 Welsh 25 10 0 15 0 British Isles, n.i.e. 10 10 0 0 0 French origins 150 20 105 10 0 Acadian 0 0 0 0 0 French 150 20 105 15 0 Aboriginal origins 2025 15 80 20 65 Inuit 0 0 0 0 0 Métis 15 0 10 0 0 North American Indian 2015 15 70 20 65 Other North American origins 255 35 60 100 40 American 20 10 0 10 0 Canadian 230 25 60 85 40 Newfoundlander 0 0 0 0 0 Nova Scotian 0 0 0 0 0 Ontarian 0 0 0 0 0 Québécois 0 0 0 0 0

Other provincial or regional groups 0 0 0 0 0 Caribbean origins 0 0 0 0 0 Antiguan 0 0 0 0 0 Bahamian 0 0 0 0 0 Barbadian 0 0 0 0 0 Bermudan 0 0 0 0 0 Carib 0 0 0 0 0 Cuban 0 0 0 0 0 Dominican, n.o.s. 0 0 0 0 0 Grenadian 0 0 0 0 0 Guyanese 0 0 0 0 0 Haitian 0 0 0 0 0 Jamaican 0 0 0 0 0 Kittitian/Nevisian 0 0 0 0 0 Martinican 0 0 0 0 0 Montserratan 0 0 0 0 0 Puerto Rican 0 0 0 0 0 St. Lucian 0 0 0 0 0 Trinidadian/Tobagonian 0 0 0 0 0 Vincentian/Grenadinian 0 0 0 0 0 West Indian 0 0 0 0 0 Caribbean, n.i.e. 0 0 0 0 0 Latin, Central and South American origins 15 0 10 0 0 Aboriginal from Central/South America 0 0 0 0 0 Argentinian 0 0 0 0 0 Belizean 0 0 0 0 0 Bolivian 0 0 0 0 0 Brazilian 0 0 0 0 0 Chilean 0 0 0 0 0 Colombian 0 0 0 0 0 Costa Rican 0 0 0 0 0 Ecuadorian 0 0 0 0 0 Guatemalan 0 0 0 0 0 Hispanic 0 0 0 0 0 Honduran 0 0 0 0 0 Maya 0 0 0 0 0 Mexican 0 0 0 0 0 Nicaraguan 0 0 0 0 0 Panamanian 0 0 0 0 0 Paraguayan 0 0 0 0 0 Peruvian 0 0 0 0 0 Salvadorean 0 0 0 0 0 Uruguayan 0 0 0 0 0 Venezuelan 0 0 0 0 0 Latin, Central or South American, n.i.e. 0 0 0 0 0 European origins 720 70 310 235 25 Western European origins 300 40 155 65 0 Austrian 0 0 0 0 0 Belgian 55 0 55 0 0 Dutch (Netherlands) 110 10 85 0 0 Flemish 0 0 0 0 0 Frisian 0 0 0 0 0 German 155 30 55 45 0 Luxembourger 0 0 0 0 0

Swiss 30 0 10 20 0 Northern European origins 345 20 125 155 10 Finnish 10 0 10 0 0 Scandinavian origins 335 20 120 160 10 Danish 60 0 10 50 0 Icelandic 10 0 0 0 0 Norwegian 230 10 60 130 10 Swedish 70 0 55 0 0 Scandinavian, n.i.e. 0 0 0 0 0 Eastern European origins 110 15 50 20 15 Baltic origins 10 0 0 0 0 Estonian 0 0 0 0 0 Latvian 0 0 0 0 0 Lithuanian 0 0 0 0 0 Byelorussian 0 0 0 0 0 Czech and Slovak origins 0 0 0 0 0 Czech 0 0 0 0 0 Czechoslovakian 0 0 0 0 0 Slovak 0 0 0 0 0 Hungarian (Magyar) 15 0 0 0 0 Polish 40 10 35 0 0 Romanian 30 0 30 0 0 Russian 15 10 0 0 0 Ukrainian 70 10 35 15 10 Southern European origins 50 0 45 0 0 Albanian 0 0 0 0 0 Bosnian 0 0 0 0 0 Bulgarian 0 0 0 0 0 Croatian 0 0 0 0 0 Cypriot 0 0 0 0 0 Greek 0 0 0 0 0 Italian 45 0 40 0 0 Kosovar 0 0 0 0 0 Macedonian 0 0 0 0 0 Maltese 0 0 0 0 0 Montenegrin 0 0 0 0 0 Portuguese 0 0 0 0 0 Serbian 0 0 0 0 0 Sicilian 0 0 0 0 0 Slovenian 0 0 0 0 0 Spanish 0 10 0 0 0 Yugoslav, n.i.e. 0 0 0 0 0 Other European origins 15 0 0 0 0 Basque 0 0 0 0 0 Gypsy (Roma) 0 0 0 0 0 Jewish 0 10 0 0 0 Slav (European) 0 0 0 0 0 European, n.i.e. 0 0 0 0 0 African origins 10 0 0 0 0 Afrikaner 0 0 0 0 0 Akan 0 0 0 0 0 Amhara 0 0 0 0 0 Angolan 0 0 0 0 0 Ashanti 0 0 0 0 0

Bantu 0 0 0 0 0 Black 0 0 0 0 0 Burundian 0 0 0 0 0 Cameroonian 0 0 0 0 0 Chadian 0 0 0 0 0 Congolese (Zairian) 0 0 0 0 0 Congolese, n.o.s. 0 0 0 0 0 Dinka 0 0 0 0 0 East African 0 0 0 0 0 Eritrean 0 0 0 0 0 Ethiopian 0 0 0 0 0 Gabonese 0 0 0 0 0 Gambian 0 0 0 0 0 Ghanaian 0 0 0 0 0 Guinean, n.o.s. 0 0 0 0 0 Harari 0 0 0 0 0 Ibo 0 0 0 0 0 Ivorian 0 0 0 0 0 Kenyan 0 0 0 0 0 Malagasy 0 0 0 0 0 Malian 0 0 0 0 0 Mauritian 0 0 0 0 0 Nigerian 0 0 0 0 0 Oromo 0 0 0 0 0 Peulh 0 0 0 0 0 Rwandan 0 0 0 0 0 Senegalese 0 0 0 0 0 Seychellois 0 0 0 0 0 Sierra Leonean 0 0 0 0 0 Somali 0 0 0 0 0 South African 0 0 0 0 0 Sudanese 0 0 0 0 0 Tanzanian 0 0 0 0 0 Tigrian 0 0 0 0 0 Togolese 0 0 0 0 0 Ugandan 0 0 0 0 0 Yoruba 0 0 0 0 0 Zambian 0 0 0 0 0 Zimbabwean 0 0 0 0 0 Zulu 0 0 0 0 0 African, n.i.e. 0 0 0 0 0 Arab origins 0 0 0 0 0 Egyptian 0 0 0 0 0 Iraqi 0 0 0 0 0 Jordanian 0 0 0 0 0 Kuwaiti 0 0 0 0 0 Lebanese 0 0 0 0 0 Libyan 0 0 0 0 0 Maghrebi origins 0 0 0 0 0 Algerian 0 0 0 0 0 Berber 0 0 0 0 0 Moroccan 0 0 0 0 0 Tunisian 0 0 0 0 0 Maghrebi, n.i.e. 0 0 0 0 0

Palestinian 0 0 0 0 0 Saudi Arabian 0 0 0 0 0 Syrian 0 0 0 0 0 Yemeni 0 0 0 0 0 Arab, n.i.e. 0 0 0 0 0 West Asian origins 0 0 0 0 0 Afghan 0 0 0 0 0 Armenian 0 0 0 0 0 Assyrian 0 0 0 0 0 Azerbaijani 0 0 0 0 0 Georgian 0 0 0 0 0 Iranian 0 0 0 0 0 Israeli 0 0 0 0 0 Kurd 0 0 0 0 0 Pashtun 0 0 0 0 0 Tatar 0 0 0 0 0 Turk 0 0 0 0 0 West Asian, n.i.e. 0 0 0 0 0 South Asian origins 0 0 0 0 0 Bangladeshi 0 0 0 0 0 Bengali 0 0 0 0 0 East Indian 0 0 0 0 0 Goan 0 0 0 0 0 Gujarati 0 0 0 0 0 Kashmiri 0 0 0 0 0 Nepali 0 0 0 0 0 Pakistani 0 0 0 0 0 Punjabi 0 0 0 0 0 Sinhalese 0 0 0 0 0 Sri Lankan 0 0 0 0 0 Tamil 0 0 0 0 0 South Asian, n.i.e. 0 0 0 0 0 East and Southeast Asian origins 40 0 10 15 0 Burmese 0 0 0 0 0 Cambodian 0 0 0 0 0 Chinese 15 10 0 15 0 Filipino 0 0 0 0 0 Hmong 0 0 0 0 0 Indonesian 0 0 0 0 0 Japanese 20 0 0 0 0 Khmer 0 0 0 0 0 Korean 0 0 0 0 0 Laotian 0 0 0 0 0 Malaysian 0 0 0 0 0 Mongolian 0 0 0 0 0 Singaporean 0 0 0 0 0 Taiwanese 0 0 0 0 0 Thai 0 0 0 0 0 Tibetan 0 0 0 0 0 Vietnamese 0 10 0 0 0 East or Southeast Asian, n.i.e. 0 0 0 0 0 Asian, n.o.s. 10 0 0 0 0 Oceania origins 10 0 0 0 0 Australian 0 0 0 0 0

New Zealander 0 0 0 0 0 Pacific Islands origins 10 0 0 0 0 Fijian 0 0 0 0 0 Hawaiian 0 0 0 0 0 Maori 0 0 0 0 0 Polynesian 0 0 0 0 0 Samoan 10 0 0 0 0 Pacific Islander, n.i.e. 0 0 0 0 0Total income in 2005 of population 15 years and o 2495 0 460 340 0 Without income 175 0 30 20 0 With income 2320 0 425 325 0 Under $1,000 245 0 25 20 0 $1,000 to $2,999 110 0 0 10 0 $3,000 to $4,999 185 0 30 0 0 $5,000 to $6,999 115 0 10 10 0 $7,000 to $9,999 210 0 25 20 0 $10,000 to $11,999 110 0 25 0 0 $12,000 to $14,999 225 0 35 40 0 $15,000 to $19,999 230 0 40 40 0 $20,000 to $24,999 135 0 25 15 0 $25,000 to $29,999 140 0 35 10 0 $30,000 to $34,999 160 0 40 35 0 $35,000 to $39,999 70 0 10 0 0 $40,000 to $44,999 105 0 30 35 0 $45,000 to $49,999 40 0 0 10 0 $50,000 to $59,999 85 0 20 35 0 $60,000 and over 150 0 70 35 0 Median income $ 14445 0 22577 26712 0 Average income $ 21281 0 29463 32652 0 Standard error of average income $ 273 0 1281 3016 0Total income in 2005 of males 15 years and over 1290 0 245 180 0 Without income 85 0 25 0 0 With income 1200 0 215 170 0 Under $1,000 170 0 25 0 0 $1,000 to $2,999 70 0 0 0 0 $3,000 to $4,999 80 0 10 0 0 $5,000 to $6,999 60 0 0 0 0 $7,000 to $9,999 100 0 10 25 0 $10,000 to $11,999 50 0 10 0 0 $12,000 to $14,999 95 0 10 0 0 $15,000 to $19,999 110 0 15 30 0 $20,000 to $24,999 60 0 10 10 0 $25,000 to $29,999 70 0 15 10 0 $30,000 to $34,999 70 0 20 0 0 $35,000 to $39,999 25 0 0 0 0 $40,000 to $44,999 70 0 25 25 0 $45,000 to $49,999 20 0 0 0 0 $50,000 to $59,999 40 0 15 15 0 $60,000 and over 105 0 50 30 0 Median income $ 13921 0 30511 26707 0 Average income $ 22363 0 34785 36559 0 Standard error of average income $ 445 0 1979 5033 0Total income in 2005 of females 15 years and over 1210 0 210 165 0 Without income 85 0 0 10 0

With income 1120 0 205 155 0 Under $1,000 75 0 10 10 0 $1,000 to $2,999 45 0 0 0 0 $3,000 to $4,999 100 0 20 0 0 $5,000 to $6,999 55 0 10 0 0 $7,000 to $9,999 110 0 15 0 0 $10,000 to $11,999 55 0 15 0 0 $12,000 to $14,999 130 0 20 40 0 $15,000 to $19,999 120 0 25 0 0 $20,000 to $24,999 75 0 20 10 0 $25,000 to $29,999 70 0 15 0 0 $30,000 to $34,999 90 0 20 30 0 $35,000 to $39,999 45 0 10 0 0 $40,000 to $44,999 35 0 10 15 0 $45,000 to $49,999 15 0 0 0 0 $50,000 to $59,999 40 0 10 20 0 $60,000 and over 45 0 20 10 0 Median income $ 14759 0 17205 26722 0 Average income $ 20122 0 23883 28280 0 Standard error of average income $ 311 0 1522 2785 0Total after-tax income in 2005 of population 15 ye 2495 0 455 340 0 Without after-tax income 175 0 30 20 0 With after-tax income 2320 0 425 325 0 Under $1,000 245 0 25 20 0 $1,000 to $2,999 115 0 10 10 0 $3,000 to $4,999 180 0 30 0 0 $5,000 to $6,999 115 0 10 10 0 $7,000 to $9,999 215 0 30 25 0 $10,000 to $11,999 110 0 25 0 0 $12,000 to $14,999 225 0 40 30 0 $15,000 to $19,999 235 0 35 40 0 $20,000 to $24,999 180 0 30 30 0 $25,000 to $29,999 165 0 45 25 0 $30,000 to $34,999 135 0 20 25 0 $35,000 to $39,999 100 0 25 20 0 $40,000 to $44,999 70 0 15 20 0 $45,000 to $49,999 75 0 20 20 0 $50,000 and over 160 0 65 40 0 Median after-tax income $ 14233 0 20291 23507 0 Average after-tax income $ 19308 0 25525 28019 0 Standard error of average after-tax income $ 219 0 1009 2197 0After-tax income in 2005 of males 15 years and ove 1290 0 245 180 0 Without after-tax income 85 0 30 10 0 With after-tax income 1200 0 220 175 0 Under $1,000 170 0 20 0 0 $1,000 to $2,999 70 0 10 0 0 $3,000 to $4,999 80 0 10 0 0 $5,000 to $6,999 60 0 0 10 0 $7,000 to $9,999 100 0 10 25 0 $10,000 to $11,999 50 0 10 10 0 $12,000 to $14,999 90 0 10 0 0 $15,000 to $19,999 110 0 15 30 0 $20,000 to $24,999 75 0 10 20 0 $25,000 to $29,999 80 0 30 0 0

$30,000 to $34,999 60 0 10 10 0 $35,000 to $39,999 65 0 20 15 0 $40,000 to $44,999 45 0 10 20 0 $45,000 to $49,999 30 0 15 0 0 $50,000 and over 105 0 45 25 0 Median after-tax income $ 13905 0 28365 23518 0 Average after-tax income $ 19865 0 29439 30759 0 Standard error of average after-tax income $ 344 0 1520 3528 0After-tax income in 2005 of females 15 years and o 1210 0 215 165 0 Without after-tax income 90 0 0 10 0 With after-tax income 1125 0 210 155 0 Under $1,000 75 0 10 15 0 $1,000 to $2,999 45 0 10 10 0 $3,000 to $4,999 105 0 20 0 0 $5,000 to $6,999 55 0 10 0 0 $7,000 to $9,999 115 0 15 0 0 $10,000 to $11,999 60 0 15 10 0 $12,000 to $14,999 130 0 25 35 0 $15,000 to $19,999 125 0 20 10 0 $20,000 to $24,999 100 0 25 10 0 $25,000 to $29,999 85 0 10 25 0 $30,000 to $34,999 75 0 15 15 0 $35,000 to $39,999 30 0 0 10 0 $40,000 to $44,999 25 0 0 0 0 $45,000 to $49,999 40 0 0 20 0 $50,000 and over 55 0 20 10 0 Median after-tax income $ 14557 0 16693 23394 0 Average after-tax income $ 18711 0 21440 24952 0 Standard error of average after-tax income $ 270 0 1259 2339 0Total population 15 years and over with employme 1545 0 325 225 0 Median employment income in 2005 $ 15069 0 22144 26229 0 Average employment income in 2005 $ 21986 0 28206 31588 0 Standard error of average employment income 375 0 1599 3779 0 Worked full year, full time 480 0 135 75 0 Median employment income in 2005 $ 32864 0 45610 30167 0 Average employment income in 2005 $ 37862 0 49381 34678 0 Standard error of average employment income 974 0 3078 9355 0 Worked part year or part time 900 0 170 135 0 Median employment income in 2005 $ 11192 0 10004 26152 0 Average employment income in 2005 $ 15818 0 14266 29421 0 Standard error of average employment income 328 0 1004 2657 0 Males 15 years and over with employment income 815 0 175 115 0 Median employment income in 2005 $ 14866 0 28090 25008 0 Average employment income in 2005 $ 22925 0 33286 34310 0 Standard error of average employment income 630 0 2434 6986 0 Worked full year, full time 245 0 85 35 0 Median employment income in 2005 $ 33103 0 62536 8547 0 Average employment income in 2005 $ 39336 0 51323 29313 0 Standard error of average employment income 1996 0 4875 19047 0 Worked part year or part time 480 0 80 65 0 Median employment income in 2005 $ 11199 0 11157 26223 0 Average employment income in 2005 $ 16438 0 17208 33706 0 Standard error of average employment income 505 0 1587 4561 0 Females 15 years and over with employment inc 730 0 145 110 0

Median employment income in 2005 $ 15418 0 15361 28466 0 Average employment income in 2005 $ 20943 0 22206 28848 0 Standard error of average employment income 410 0 1917 2803 0 Worked full year, full time 230 0 50 35 0 Median employment income in 2005 $ 32487 0 42421 54810 0 Average employment income in 2005 $ 36306 0 45919 40061 0 Standard error of average employment income 805 0 3498 5164 0 Worked part year or part time 420 0 90 70 0 Median employment income in 2005 $ 11115 0 8628 25015 0 Average employment income in 2005 $ 15112 0 11684 25262 0 Standard error of average employment income 390 0 931 2339 0Family income in 2005 of economic families - 20% 875 0 160 140 0 Under $10,000 75 0 0 0 0 $10,000 to $19,999 110 0 15 0 0 $20,000 to $29,999 125 0 10 30 0 $30,000 to $39,999 100 0 20 0 0 $40,000 to $49,999 145 0 30 15 0 $50,000 to $59,999 95 0 15 35 0 $60,000 to $69,999 50 0 15 0 0 $70,000 to $79,999 55 0 10 20 0 $80,000 to $89,999 35 0 10 20 0 $90,000 to $99,999 35 0 0 10 0 $100,000 and over 50 0 30 10 0Median family income $ 41628 0 49547 58535 0Average family income $ 46838 0 58734 65402 0Standard error of average family income $ 763 0 3425 7595 0Family income in 2005 of couple economic families 665 0 150 105 0 Under $10,000 45 0 10 0 0 $10,000 to $19,999 70 0 10 0 0 $20,000 to $29,999 75 0 10 0 0 $30,000 to $39,999 80 0 20 0 0 $40,000 to $49,999 105 0 30 0 0 $50,000 to $59,999 90 0 15 35 0 $60,000 to $69,999 45 0 15 0 0 $70,000 to $79,999 45 0 10 20 0 $80,000 to $89,999 30 0 0 15 0 $90,000 to $99,999 35 0 10 10 0 $100,000 and over 45 0 30 0 0Median family income $ 46531 0 50713 71636 0Average family income $ 52076 0 61469 75856 0Standard error of average family income $ 967 0 3460 8266 0Composition of family income in 2005 for all econo 100 100 100 100 100 Employment income % 67.5 0 70.3 66.9 0 Government transfer payments % 20.9 0 15.7 12.2 0 Other % 11.6 0 13.9 20.9 0Composition of family income in 2005 for all coupl 100 100 100 100 100 Employment income % 69.1 0 71.1 70.1 0 Government transfer payments % 17.8 0 15 8.3 0 Other % 13.1 0 14 21.6 0Composition of family income in 2005 for all male 100 100 100 100 100 Employment income % 62.9 0 0 0 0 Government transfer payments % 24.8 0 0 0 0 Other % 12.3 0 0 0 0Composition of family income in 2005 for all femal 100 100 100 100 100

Employment income % 52.7 0 0 0 0 Government transfer payments % 46.8 0 0 0 0 Other % 0.5 0 0 0 0After-tax income in 2005 of economic families - 2 870 0 160 140 0 Under $10,000 75 0 10 0 0 $10,000 to $19,999 110 0 15 0 0 $20,000 to $29,999 125 0 10 30 0 $30,000 to $39,999 125 0 25 10 0 $40,000 to $49,999 140 0 30 25 0 $50,000 to $59,999 90 0 20 20 0 $60,000 to $69,999 65 0 0 30 0 $70,000 to $79,999 60 0 10 20 0 $80,000 and over 70 0 30 10 0Median after-tax family income $ 39776 0 44924 51766 0Average after-tax family income $ 42709 0 51084 55843 0Standard error of average after-tax family income $ 606 0 2680 5404 0After-tax income in 2005 of couple economic famili 670 0 150 110 0 Under $10,000 45 0 0 0 0 $10,000 to $19,999 70 0 10 0 0 $20,000 to $29,999 80 0 10 10 0 $30,000 to $39,999 95 0 25 0 0 $40,000 to $49,999 120 0 30 20 0 $50,000 to $59,999 80 0 20 20 0 $60,000 to $69,999 60 0 0 30 0 $70,000 to $79,999 55 0 10 15 0 $80,000 and over 65 0 30 0 0Median after-tax family income $ 43257 0 45186 60650 0Average after-tax family income $ 46908 0 53371 63780 0Standard error of average after-tax family income $ 750 0 2685 5763 0Family income in 2005 of all economic families - 875 0 155 140 0 Median family income $ 41628 0 49547 58535 0 Average family income $ 46838 0 58734 65402 0 Standard error of average family income $ 763 0 3425 7595 0 Median after-tax family income $ 39776 0 44924 51766 0 Average after-tax family income $ 42709 0 51084 55843 0 Standard error of average after-tax family income 606 0 2680 5404 0Family income in 2005 of couple economic families 670 0 150 110 0 Median family income $ 46531 0 50713 71636 0 Average family income $ 52076 0 61469 75856 0 Standard error of average family income $ 967 0 3460 8266 0 Median after-tax family income $ 43257 0 45186 60650 0 Average after-tax family income $ 46908 0 53371 63780 0 Standard error of average after-tax family income 750 0 2685 5763 0Family income in 2005 of male lone-parent economi 40 0 0 0 0 Median family income $ 36472 0 0 0 0 Average family income $ 32668 0 0 0 0 Standard error of average family income $ 1637 0 0 0 0 Median after-tax family income $ 35623 0 0 0 0 Average after-tax family income $ 31703 0 0 0 0 Standard error of average after-tax family income 1599 0 0 0 0Family income in 2005 of female lone-parent econo 120 0 0 0 0 Median family income $ 20908 0 0 0 0 Average family income $ 25527 0 0 0 0 Standard error of average family income $ 1023 0 0 0 0

Median after-tax family income $ 20908 0 0 0 0 Average after-tax family income $ 25175 0 0 0 0 Standard error of average after-tax family income 996 0 0 0 0Total income in 2005 of persons 15 years and over 345 0 95 35 0 Under $1,000 40 0 0 0 0 $1,000 to $2,999 15 0 0 0 0 $3,000 to $4,999 25 0 10 0 0 $5,000 to $6,999 10 0 0 0 0 $7,000 to $9,999 40 0 10 0 0 $10,000 to $11,999 10 0 10 0 0 $12,000 to $14,999 35 0 0 10 0 $15,000 to $19,999 40 0 15 15 0 $20,000 to $24,999 15 0 0 0 0 $25,000 to $29,999 20 0 10 0 0 $30,000 to $34,999 10 0 0 0 0 $35,000 to $39,999 10 0 0 0 0 $40,000 to $44,999 10 0 10 0 0 $45,000 to $49,999 0 0 0 0 0 $50,000 to $59,999 20 0 0 10 0 $60,000 and over 40 0 30 0 0Median income $ 14974 0 23230 16022 0Average income $ 22996 0 32380 29383 0Standard error of average income $ 792 0 3178 5597 0Total income in 2005 of males 15 years and over no 200 0 60 15 0 Under $1,000 30 0 10 0 0 $1,000 to $2,999 10 0 0 0 0 $3,000 to $4,999 15 0 0 0 0 $5,000 to $6,999 10 0 0 0 0 $7,000 to $9,999 10 0 0 0 0 $10,000 to $11,999 10 0 10 0 0 $12,000 to $14,999 15 0 0 0 0 $15,000 to $19,999 25 0 0 15 0 $20,000 to $24,999 10 0 0 0 0 $25,000 to $29,999 15 0 0 0 0 $30,000 to $34,999 0 0 0 0 0 $35,000 to $39,999 0 0 0 0 0 $40,000 to $44,999 10 0 0 0 0 $45,000 to $49,999 10 0 0 0 0 $50,000 to $59,999 0 0 0 0 0 $60,000 and over 30 0 25 0 0Median income $ 15224 0 43244 0 0Average income $ 24132 0 40139 0 0Standard error of average income $ 1081 0 4242 0 0Total income in 2005 of females 15 years and over 145 0 30 20 0 Under $1,000 10 0 0 0 0 $1,000 to $2,999 10 0 0 0 0 $3,000 to $4,999 15 0 10 0 0 $5,000 to $6,999 0 0 0 0 0 $7,000 to $9,999 25 0 0 0 0 $10,000 to $11,999 0 0 0 0 0 $12,000 to $14,999 20 0 10 0 0 $15,000 to $19,999 15 0 10 0 0 $20,000 to $24,999 10 0 0 0 0 $25,000 to $29,999 0 0 0 0 0

$30,000 to $34,999 0 0 0 0 0 $35,000 to $39,999 10 0 0 0 0 $40,000 to $44,999 10 0 0 0 0 $45,000 to $49,999 10 0 0 0 0 $50,000 to $59,999 20 0 0 10 0 $60,000 and over 10 0 0 0 0Median income $ 13848 0 13750 56584 0Average income $ 21478 0 18561 39628 0Standard error of average income $ 1147 0 3344 7157 0Composition of income in 2005 for persons 15 year 100 100 100 100 100 Employment income % 75.6 0 80 72.1 0 Government transfer payments % 20.7 0 14.5 27.5 0 Other % 3.7 0 5.5 0 0Composition of income in 2005 for males 15 years 100 100 100 100 100 Employment income % 77.1 0 86.4 0 0 Government transfer payments % 19.6 0 10.4 0 0 Other % 3.3 0 3.2 0 0Composition of income in 2005 for females 15 year 100 100 100 100 100 Employment income % 73.5 0 55.6 89.5 0 Government transfer payments % 22.3 0 30.1 0 0 Other % 4.3 0 14.4 0 0After-tax income in 2005 of persons 15 years and o 345 0 90 35 0 Under $1,000 40 0 10 0 0 $1,000 to $2,999 15 0 0 0 0 $3,000 to $4,999 25 0 0 0 0 $5,000 to $6,999 10 0 0 0 0 $7,000 to $9,999 35 0 10 0 0 $10,000 to $11,999 10 0 10 0 0 $12,000 to $14,999 30 0 0 10 0 $15,000 to $19,999 40 0 10 15 0 $20,000 to $24,999 35 0 10 10 0 $25,000 to $29,999 10 0 0 0 0 $30,000 to $34,999 10 0 0 0 0 $35,000 to $39,999 15 0 0 0 0 $40,000 to $44,999 0 0 0 0 0 $45,000 to $49,999 25 0 0 10 0 $50,000 and over 35 0 25 0 0Median after-tax income $ 14974 0 20286 16022 0Average after-tax income $ 20302 0 27333 26140 0Standard error of average after-tax income $ 638 0 2485 4476 0After-tax income in 2005 of males 15 years and ove 195 0 60 15 0 Under $1,000 30 0 10 0 0 $1,000 to $2,999 10 0 0 0 0 $3,000 to $4,999 10 0 0 0 0 $5,000 to $6,999 0 0 0 0 0 $7,000 to $9,999 10 0 0 0 0 $10,000 to $11,999 10 0 10 0 0 $12,000 to $14,999 15 0 0 0 0 $15,000 to $19,999 30 0 0 15 0 $20,000 to $24,999 20 0 10 0 0 $25,000 to $29,999 10 0 0 0 0 $30,000 to $34,999 10 0 0 0 0 $35,000 to $39,999 10 0 0 0 0 $40,000 to $44,999 10 0 0 0 0

$45,000 to $49,999 0 0 0 0 0 $50,000 and over 30 0 25 0 0Median after-tax income $ 15224 0 35820 0 0Average after-tax income $ 21020 0 32969 0 0Standard error of average after-tax income $ 853 0 3251 0 0After-tax income in 2005 of females 15 years and o 145 0 35 20 0 Under $1,000 10 0 0 0 0 $1,000 to $2,999 0 0 0 0 0 $3,000 to $4,999 15 0 10 0 0 $5,000 to $6,999 10 0 0 0 0 $7,000 to $9,999 25 0 0 0 0 $10,000 to $11,999 0 0 0 0 0 $12,000 to $14,999 20 0 0 0 0 $15,000 to $19,999 15 0 10 0 0 $20,000 to $24,999 10 0 0 0 0 $25,000 to $29,999 0 0 0 0 0 $30,000 to $34,999 0 0 0 0 0 $35,000 to $39,999 0 0 0 0 0 $40,000 to $44,999 0 0 0 0 0 $45,000 to $49,999 20 0 0 10 0 $50,000 and over 0 0 0 0 0Median after-tax income $ 13848 0 13750 48136 0Average after-tax income $ 19342 0 17296 34104 0Standard error of average after-tax income $ 958 0 2969 5855 0Total economic families - 20% sample data 380 0 160 145 0 Prevalence of low income before tax in 2005 % 6.6 0 12.5 0 0 Prevalence of low income after tax in 2005 % 5.2 0 12.5 0 0Couple economic families 330 0 150 110 0 Prevalence of low income before tax in 2005 % 4.5 0 10 0 0 Prevalence of low income after tax in 2005 % 3 0 6.7 0 0Male lone-parent economic families 15 0 0 15 0 Prevalence of low income before tax in 2005 % 0 0 0 0 0 Prevalence of low income after tax in 2005 % 0 0 0 0 0Female lone-parent economic families 40 0 10 20 0 Prevalence of low income before tax in 2005 % 0 0 0 0 0 Prevalence of low income after tax in 2005 % 25 0 0 0 0Total persons 15 years and over not in economic f 180 0 95 40 0 Prevalence of low income before tax in 2005 % 36.1 0 36.8 0 0 Prevalence of low income after tax in 2005 % 25 0 27.8 0 0Males 15 years and over not in economic families 105 0 60 15 0 Prevalence of low income before tax in 2005 % 28.6 0 25 0 0 Prevalence of low income after tax in 2005 % 19 0 25 0 0Females 15 years and over not in economic familie 75 0 35 20 0 Prevalence of low income before tax in 2005 % 46.7 0 57.1 0 0 Prevalence of low income after tax in 2005 % 40 0 33.3 0 0Total persons in private households - 20% sample 1205 0 540 405 0 Prevalence of low income before tax in 2005 % 11.6 0 17.6 0 0 Prevalence of low income after tax in 2005 % 8.7 0 15.7 0 0Total persons less than 6 years of age 75 0 60 10 0 Prevalence of low income before tax in 2005 % 0 0 0 0 0 Prevalence of low income after tax in 2005 % 0 0 0 0 0Total persons 65 years of age and over 195 0 60 85 0 Prevalence of low income before tax in 2005 % 7.7 0 0 0 0 Prevalence of low income after tax in 2005 % 0 0 0 0 0

Household income in 2005 of private households - 1185 0 250 180 0 Under $10,000 175 0 25 0 0 $10,000 to $19,999 195 0 40 20 0 $20,000 to $29,999 155 0 20 30 0 $30,000 to $39,999 115 0 20 0 0 $40,000 to $49,999 160 0 35 15 0 $50,000 to $59,999 115 0 20 45 0 $60,000 to $69,999 85 0 40 0 0 $70,000 to $79,999 55 0 10 20 0 $80,000 to $89,999 35 0 10 15 0 $90,000 to $99,999 35 0 0 10 0 $100,000 and over 55 0 30 0 0Median household income $ 34746 0 45886 55634 0Average household income $ 41189 0 49372 57784 0Standard error of average household income $ 651 0 2695 6465 0Household income in 2005 of one-person private h 300 0 90 40 0 Under $10,000 100 0 15 0 0 $10,000 to $19,999 80 0 25 20 0 $20,000 to $29,999 30 0 10 0 0 $30,000 to $39,999 15 0 0 0 0 $40,000 to $49,999 10 0 10 0 0 $50,000 to $59,999 15 0 10 10 0 $60,000 to $69,999 35 0 30 0 0 $70,000 to $79,999 0 0 0 0 0 $80,000 to $89,999 0 0 0 0 0 $90,000 to $99,999 0 0 0 0 0 $100,000 and over 0 0 0 0 0Median household income $ 15196 0 23248 16022 0Average household income $ 24298 0 32678 29383 0Standard error of average household income $ 963 0 3376 5597 0After-tax income in 2005 of private households - 1185 0 250 175 0 Under $10,000 180 0 25 0 0 $10,000 to $19,999 200 0 40 20 0 $20,000 to $29,999 165 0 25 35 0 $30,000 to $39,999 145 0 30 10 0 $40,000 to $49,999 175 0 35 35 0 $50,000 to $59,999 120 0 45 20 0 $60,000 to $69,999 70 0 10 30 0 $70,000 to $79,999 65 0 10 15 0 $80,000 to $89,999 30 0 15 0 0 $90,000 to $99,999 10 0 0 0 0 $100,000 and over 35 0 15 10 0Median after-tax household income $ 33793 0 41307 48233 0Average after-tax household income $ 37364 0 42632 49561 0Standard error of average after-tax household inc 527 0 2151 4704 0After-tax income in 2005 of one-person private hou 300 0 90 35 0 Under $10,000 100 0 15 0 0 $10,000 to $19,999 80 0 25 20 0 $20,000 to $29,999 35 0 10 10 0 $30,000 to $39,999 20 0 0 0 0 $40,000 to $49,999 25 0 10 10 0 $50,000 to $59,999 30 0 25 0 0 $60,000 to $69,999 0 0 0 0 0 $70,000 to $79,999 0 0 0 0 0

$80,000 to $89,999 0 0 0 0 0 $90,000 to $99,999 0 0 0 0 0 $100,000 and over 0 0 0 0 0Median after-tax household income $ 15196 0 20304 16022 0Average after-tax household income $ 21387 0 27576 26140 0Standard error of average after-tax household inc 772 0 2640 4476 0Total number of non-farm, non-reserve private dwe 535 60 240 170 65 Tenant-occupied private non-farm, non-reserve dw 155 15 45 55 35 Average gross rent $ 510 384 467 585 517 Tenant-occupied households spending 30% or mor 20 0 15 0 0 Tenant-occupied households spending from 30% 15 0 15 0 0 Owner-occupied private non-farm, non-reserve dw 385 45 190 115 30 Average value of dwelling $ 142400 150674 171620 105044 86992 Average owner major payments $ 548 329 690 418 449 Owner households spending 30% or more of hous 45 0 35 0 0 Owner households spending 30% to 99% of hou 35 0 25 0 0 Tenant one-family households without additional 80 0 35 40 0 Average gross rent $ 506 0 473 550 0 Tenant one-family households without additional 10 0 10 0 0 Owner one-family households without additional p 255 25 115 85 25 Average owner major payments $ 635 346 818 504 0 Owner one-family households without additional 20 0 15 0 0

Profile for Canada, Provinces, Territories, Census Divisions and Census Subdivisions, 2006 Census
12531066-14.96.28
1070545
404040355040403050404030201510
500
52040304040503040305540452525151010
50
840390295
Bella Bella 1 (5945801) IRI 01010

603555
835670170310140
756030
305230145
509535402585355025201080503515
02525
010
38090
135456545
1.21060
140602065
9153
802515
01050

3405.73.1
340135135
75345
4085
220345
00
20607080553015
345275
201510
050
15345
6090609530
10603.1
340235
3570
10601060
9850
750000000

000000000000000000000000000000000000000000000000000000

0000000000000000000000000000000
6000000
10651050
010
010601060
00000
106010551045
010

000000000000000000000000000000000000000000000000000000

00000000000000000000000000000000000000
1010
010
000000000000

000000000000
100000000000
10000000000000000000000000000000

0000000000000000000000000000
851045
930110
75353030
00
980695285205
75756515
00000000

000000000000000000000000000000000000000000000000000000

000000000000000000000000000000
8301020
800106010101000
1000
1050
1060995
65830405330
75425
48.839.818.5170

503510
12529.420.6
20660360290
70305
54.543.919.4420205155
50210
48.836.924.4
8525201060
29.423.5
40335180140
45150
53.741.8
25415200170
25215
48.241
12.5852520
065
29.423.5

0325175150
20150
53.846.211.4830410330
75425
49.439.818.3460200155
45265
43.533.722.5370210175
35160
56.847.316.7
6035251025
58.341.728.6
5535301020
63.654.528.6255140120
25110

54.947.117.9420210155
50210
5036.923.8245105
8025
14042.932.723.8170100
802070
58.847.1
2025201510
0806050301515
0155050
0115
65501550
56.543.523.1415195170

25215
4741
12.8215
907510
12541.934.911.1200105
951090
52.547.5
9.53515101020
42.928.666.7
301515
0155050
0140
75701060
53.650
13.3410
0400390390
0000

010
0210
10200200200
0000000
1950
195195190
000
10000
40510
40035
00
102055
010
000
40000
15000
1065153015

000
7500
101010
000
152535
00
100000
102080
0552520
015
010
20510
20020
000
10000000000
10000

00
200
100000
3500
100
1000
100
1535
0000000
101565
0502015
010
00
2000
1952010
00
1050
00000
35

000
150
100
1050102510
000
4500
1010
0000
1510
0000000000
150
1010
00000
40510
39575
0101025
0

2510
00
1010
0106555
020
095
2100
20065
00
1015
010
0000
100
102010
010
050
19510
19515
000
100
2010
000000

4540
010
045
330245230
101010
075
155105100
0000
50175140135
010
00
25320
8035
0155
1000
45150
4510
05510
00
40165
3525
0105
0

010
0525525520
1000000000000
1000
1000
83085
115255215110
50415
6070
130904520
4102545
125125
6030
830365
70807565
170420210

3040303070
410155
45404535
100835620
95451550
420325
45151020
410300
553010256515
000000
1510
010
0100
2010
01530
0000
25

00
175 2490105 1005
65 149055 4985 680
0 2300 2750 305
10 1490 750 2350 310 1500 400 100 400 0
580 240290290130
605060154525
010
010806015
00
100
1010
000
100
170155
00000
1000

10140
000
1010601015
96050
00000
451065
000
1010
00000000
10601060
550
2520
030
01010
010
101500
10150000000

000000000000000000000000000000000000000000000
4515
00000
150

020
015
00
1510
010
00000000000000000000000000000000000000000000

000000000000000000000000000000000000000000000000000000

0000000000000000000000000000000000000000000000000000
100

00000000
83065
765100
507035754565905045303020252025
1262417565
0415
30385
65353520352030402025101015101015
1056016029
0415
40

38035204010402535502515201510101015
1388219147
0830
65765100
5570308045658550503530152035
1262416734
0420
30385
65353520302030403025

101510
015
1052815102
0415
40375
301535104520355030252515101020
1386918414
0530
1202119005
0135
3264035580
0310
905614336
0265
1091218089
060
3507235308
0165
937614078
0265

1408019923
080
3244835788
0145
841614630
0275
3040353535302020101010
3724842778
0200
2025253025202015
01010
4074746262
0100
74.823.9
1.4100
78.220.2
1.5100
39.956.4
3.7100

67.232.5
0.4275
304040403530202020
3656541184
0200
152525252525201520
4000044197
0275
3724842778
03656541184
0195
4074746262
04000044197
015
2560026212
02560026212
040
2752033192
0

2752032996
080201010
010
01010
00000
100
109840
196060
451010
010
00000
1000
1000
107872
174320
400000
1000
1000

1000000
1360022191
0100
79.818.5
1.7100
85.314.6
0100
74.722.1
3.28015
010
010
010
0000000
109840
172050
4510
010
0000000000

00
787215388
040
00
101010
01010
00
1000
1010
1360019365
0000000000000000000000000000000

3406050454040353020101010
3392039291
065301010
01010
00000
1376022391
0340
605050404035202010
010
3302437431
060301010
00
1010
0

000
1376019423
00000000000000000

Source: Statistics Canada 1996 Census, prepared by BC Stats June 10, 2008Profile of Census Divisions and Subdivisions
File Name: pcan1.ivtValues: Values
Population, 1991 (100% data) 3482 1673 1104 705Population, 1996 (100% data) 3921 1771 1211 873Population percentage change, 1991-1996 12.6 5.9 9.7 23.8Land area in square kilometres, 1996 25122.26 25096 6.06 12.95Total population by sex and age groups (100% data) 3925 1770 1215 875 Male, total 2055 930 640 445 0-4 170 65 55 50 5-9 170 60 55 50 10-14 175 60 60 50
15 40 20 10 1016 30 20 10 517 45 20 15 1518 25 10 5 519 20 5 10 5
15-19 165 70 55 40 20-24 135 45 50 35 25-29 140 60 50 30 30-34 180 80 65 35 35-39 175 80 50 35 40-44 195 105 50 40 45-49 175 105 40 25 50-54 95 50 20 25 55-59 90 50 20 10 60-64 70 35 30 10 65-69 55 35 10 5 70-74 35 25 10 5 75-79 10 10 5 0 80-84 10 5 5 5 85+ 10 5 0 0 Female, total 1870 840 575 425 0-4 150 60 55 40 5-9 170 70 50 45 10-14 190 65 60 60
15 25 5 10 1016 25 5 5 1017 30 15 10 018 15 5 5 519 20 5 5 5
15-19 110 40 35 35 20-24 130 50 45 30 25-29 150 70 40 40 30-34 175 65 70 30 35-39 175 80 50 45 40-44 130 70 40 20 45-49 130 75 25 25 50-54 110 60 30 15
Central Coast Regional District
Central Coast, Subd. A (5945008)
Bella Bella 1 (5945801) R 01010
Bella Coola 1 (5945802) R 01010

55-59 65 30 20 10 60-64 60 30 20 15 65-69 50 25 20 10 70-74 30 15 5 5 75-79 25 15 5 5 80-84 15 10 0 0 85+ 5 0 5 5Total population 15 years and over by legal marital stat 2890 1380 875 590 Never married (single) 1080 405 375 275 Legally married (and not separated) 1330 735 355 220 Separated, but still legally married 130 50 40 35 Divorced 225 145 35 40 Widowed 130 40 65 25Total number of census families in private households b 1035 510 315 200 Size of census family, 2 persons 425 255 110 55 Size of census family, 3 persons 240 100 85 45 Size of census family, 4 persons 225 100 65 60 Size of census family, 5 or more persons 150 50 55 45Total husband-wife families by family structure (20% sa 885 465 250 155 Total families of now-married couples 650 360 175 110 Total without sons and/or daughters at home 255 180 50 20 Total with sons and/or daughters at home 400 175 120 90 1 son or daughter 130 60 45 25 2 sons and/or daughters 150 75 40 35 3 or more sons and/or daughters 115 45 40 30 Total families of common-law couples 235 105 75 45 Total without sons and/or daughters at home 85 50 25 10 Total with sons and/or daughters at home 145 55 55 30 1 son or daughter 60 25 25 10 2 sons and/or daughters 55 20 25 10 3 or more sons and/or daughters 30 10 0 10Total lone-parent families by sex of parent (20% sample 150 40 60 50 Male parent 35 15 10 10 1 son or daughter 20 0 10 10 2 sons and/or daughters 10 0 0 0 3 or more sons and/or daughters 0 0 0 10 Female parent 120 30 50 40 1 son or daughter 65 15 30 20 2 sons and/or daughters 35 10 15 10 3 or more sons and/or daughters 20 0 10 10Total number of never-married sons and/or daughters a 1350 510 445 370 Under 6 years of age 350 140 115 90 6 - 14 years 595 240 185 165 15 - 17 years 155 75 45 40 18 - 24 years 155 45 55 50 25 years and over 90 15 50 25Average number of never-married sons and/or daughters 1.3 1 1.4 1.8Total number of persons in private households (20% sa 3880 1730 1205 875 Number of non-family persons 610 245 195 155 Living with relatives 230 30 110 85 Living with non-relatives only 110 60 25 25 Living alone 270 155 60 45 Number of family persons 3270 1485 1010 720Average number of persons per census family 3.2 2.9 3.3 3.6

Total number of persons 65 years and over (20% sample 240 135 65 40 Number of non-family persons 65 years and over 100 50 25 25 Living with relatives 40 0 15 20 Living with non-relatives only 0 0 10 0 Living alone 50 35 10 10 Number of family persons 65 years and over 145 85 35 15Total number of occupied private dwellings by structural 1325 690 360 255 Single-detached house 1115 560 300 235 Semi-detached house 10 10 0 0 Row house 35 0 15 10 Apartment, detached duplex 10 0 10 0 Apartment building, five or more storeys 0 0 0 0 Apartment building, less than five storeys 60 25 25 10 Other single attached house 0 0 0 0 Movable dwelling 95 85 0 0Total number of private households by household size 1330 690 360 255 1 person 265 155 60 40 2 persons 380 260 70 45 3 persons 225 110 70 45 4 - 5 persons 350 140 115 90 6 or more persons 95 15 45 35Total population by citizenship (20% sample data) 3915 1765 - - Canadian citizenship 3855 1725 - - Citizenship other than Canadian 60 45 - -Total population by place of birth (20% sample data) 3915 1765 - - Non-immigrant population 3645 1520 - - Born in province of residence 3165 1115 - - Total immigrants by selected countries of birth 265 240 - - United Kingdom 60 50 - - Italy 0 0 - - United States 120 105 - - Hong Kong 0 0 - - India 0 0 - - China, People's Republic of 0 0 - - Poland 0 0 - - Philippines 10 10 - - Germany 25 25 - - Portugal 0 0 - - Viet Nam 0 0 - - Netherlands 10 10 - - Jamaica 0 0 - - Greece 0 0 - - Guyana 0 0 - - Sri Lanka 0 0 - - Lebanon 0 0 - - France 0 0 - - Trinidad and Tobago 0 0 - - Yugoslavia 0 0 - - Hungary 0 0 - - Haiti 0 0 - - Taiwan 0 0 - - Iran 0 0 - - Romania 0 0 - - Korea, South 0 0 - -

Ukraine 0 0 - - Pakistan 0 0 - - El Salvador 0 0 - - Egypt 0 0 - - Croatia 0 0 - - Russian Federation 0 0 - - Ireland, Republic of (Eire) 0 0 - - South Africa, Republic of 0 0 - - Mexico 0 0 - - Austria 0 10 - - Chile 0 0 - - Belgium 0 0 - - Fiji 0 0 - - Morocco 0 0 - - Denmark 0 10 - - Czechoslovakia, n.i.e. 0 0 - - Malaysia 0 0 - - Cambodia 0 0 - - Switzerland 0 0 - - Tanzania, United Republic of 0 0 - - Kenya 0 0 - - Iraq 0 0 - - Somalia 0 0 - - Israel 0 0 - - All other places of birth 30 30 - - Non-permanent residents 0 0 - -Total recent immigrants by selected countries of birth ( 20 15 - - Hong Kong 0 0 - - China, People's Republic of 0 0 - - India 0 0 - - Philippines 0 0 - - Sri Lanka 0 0 - - Poland 0 0 - - Taiwan 0 0 - - Viet Nam 0 0 - - United States 10 0 - - United Kingdom 10 0 - - Yugoslavia 0 0 - - Iran 0 0 - - Jamaica 0 0 - - Lebanon 0 0 - - Romania 0 0 - - Pakistan 0 0 - - Korea, South 0 0 - - Guyana 0 0 - - Trinidad and Tobago 0 0 - - El Salvador 0 0 - - Somalia 0 0 - - France 0 0 - - Haiti 0 0 - - Russian Federation 0 0 - - Iraq 0 0 - - Portugal 0 0 - - Bosnia and Herzegovina 0 0 - -

Mexico 0 0 - - Germany 0 0 - - Egypt 0 0 - - Ukraine 0 0 - - Ghana 0 0 - - Ethiopia 0 0 - - South Africa, Republic of 0 0 - - Bangladesh 0 0 - - Afghanistan 0 0 - - Peru 0 0 - - Guatemala 0 0 - - Fiji 0 0 - - Morocco 0 0 - - All other places of birth 10 10 - -Total immigrant population by period of immigration (2 265 240 - - Before 1961, period of immigration 80 70 - - 1961-1970, period of immigration 75 70 - - 1971-1980, period of immigration 60 55 - - 1981-1990, period of immigration 35 35 - - 1991-1996, period of immigration 20 10 - -Total immigrant population by age at immigration (20% 265 240 - - 0-4 years, age at immigration 55 45 - - 5-19 years, age at immigration 85 65 - - 20 years and over, age at immigration 130 125 - -Total population by mother tongue (20% sample data) 3915 1765 1210 875 Single responses 3830 1750 1165 850 English 3490 1650 1030 760 French 30 30 0 0 Non-official languages 310 70 130 90 Italian 0 10 0 0 Chinese 10 0 0 0 German 25 25 0 0 Portuguese 0 0 0 0 Polish 0 0 0 0 Ukrainian 0 0 0 0 Spanish 0 0 0 0 Dutch 0 10 0 0 Punjabi 0 0 0 0 Greek 0 0 0 0 Arabic 0 0 0 0 Tagalog (Pilipino) 0 0 0 0 Hungarian 0 0 0 0 Vietnamese 0 0 0 0 Cree 0 10 0 0 Persian (Farsi) 0 0 0 0 Croatian 0 0 0 0 Gujarati 0 0 0 0 Korean 0 0 0 0 Russian 10 0 0 0 Hindi 0 0 0 0 Tamil 0 0 0 0 Japanese 10 10 0 0 Creoles 0 0 0 0 Finnish 0 0 0 0

Czech 0 0 0 0 Armenian 0 0 0 0 Yiddish 0 0 0 0 Urdu 0 0 0 0 Inuktitut (Eskimo) 0 0 0 0 Romanian 0 0 0 0 Ojibway 0 0 0 0 Danish 0 0 0 0 Slovak 0 0 0 0 Macedonian 0 0 0 0 Khmer (Cambodian) 0 0 0 0 Norwegian 10 10 0 0 Hebrew 0 0 0 0 Estonian 0 0 0 0 Swedish 0 0 0 0 Lao 0 0 0 0 Lithuanian 0 0 0 0 Serbian 0 0 0 0 Latvian (Lettish) 0 0 0 0 Slovenian 0 0 0 0 Turkish 0 0 0 0 Bengali 0 0 0 0 Maltese 0 0 0 0 Flemish 0 0 0 0 Montagnais-Naskapi 0 0 0 0 Bulgarian 0 0 0 0 Micmac 0 0 0 0 Gaelic languages 0 0 0 0 South Slave 0 0 0 0 Chipewyan 0 0 0 0 Dogrib 0 0 0 0 Kutchin-Gwich'in (Loucheux) 0 0 0 0 Tlingit 0 0 0 0 Serbo-Croatian 0 0 0 0 Dakota/Sioux 0 0 0 0 Malay-Bahasa 0 0 0 0 Blackfoot 0 0 0 0 Malayalam 0 0 0 0 Thai 0 0 0 0 Kurdish 0 0 0 0 Pashto 0 0 0 0 Other languages 240 0 125 90 Multiple responses 85 15 45 25 English and French 0 0 0 10 English and non-official language 80 10 45 20 French and non-official language 0 0 0 0 English, French and non-official language 0 0 0 0Total population by knowledge of official languages (20 3915 1770 1210 870 English only 3790 1665 1185 870 French only 0 0 0 0 English and French 125 100 20 0 Neither English nor French 0 0 0 0Total population by first official language spoken (20% 3915 1770 1205 870 English 3880 1740 1205 875

French 30 25 0 0 English and French 0 0 0 0 Neither English nor French 0 0 0 0Official language minority - (number) 30 25 0 0Official language minority - (percentage) 0.8 1.4 0 0Total population by home language (20% sample data) 3915 1770 1210 870 Single responses 3870 1755 1190 855 English 3805 1735 1180 825 French 10 10 0 0 Non-official languages 55 15 15 30 Chinese 0 0 0 0 Italian 0 0 0 0 Portuguese 0 0 0 0 Spanish 0 10 0 0 German 10 0 0 0 Polish 0 0 0 0 Punjabi 0 0 0 0 Greek 0 0 0 0 Vietnamese 0 0 0 0 Arabic 0 0 0 0 Cree 0 0 0 0 Tagalog (Pilipino) 0 0 0 0 Ukrainian 0 0 0 0 Persian (Farsi) 0 0 0 0 Korean 10 0 0 0 Hungarian 0 0 0 0 Tamil 0 0 0 0 Gujarati 0 0 0 0 Croatian 0 0 0 0 Armenian 0 0 0 0 Inuktitut (Eskimo) 0 0 0 0 Hindi 0 0 0 0 Urdu 0 0 0 0 Japanese 0 0 0 0 Russian 0 0 0 0 Creoles 0 0 0 0 Dutch 0 0 0 0 Khmer (Cambodian) 0 0 0 0 Ojibway 0 0 0 0 Romanian 0 0 0 0 Czech 0 0 0 0 Lao 0 0 0 0 Macedonian 0 0 0 0 Finnish 0 0 0 0 Montagnais-Naskapi 0 0 0 0 Hebrew 0 0 0 0 Yiddish 0 0 0 0 Serbian 0 0 0 0 Bengali 0 0 0 0 Slovak 0 0 0 0 Estonian 0 0 0 0 Turkish 0 0 0 0 Lithuanian 0 0 0 0 Latvian (Lettish) 0 0 0 0

Micmac 0 0 0 0 Slovenian 0 0 0 0 Bulgarian 0 0 0 0 Serbo-Croatian 0 0 0 0 Dakota/Sioux 10 0 0 0 South Slave 0 0 0 0 Malay-Bahasa 0 0 0 0 Maltese 0 0 0 0 Blackfoot 0 0 0 0 Dogrib 0 0 0 0 Danish 0 0 0 0 Swedish 0 0 0 0 Malayalam 0 0 0 0 Thai 0 0 0 0 Kurdish 0 0 0 0 Pashto 0 0 0 0 Flemish 0 0 0 0 Chipewyan 0 0 0 0 Kutchin-Gwich'in (Loucheux) 0 0 0 0 Norwegian 0 0 0 0 Gaelic languages 0 0 0 0 Tlingit 0 0 0 0 Other languages 40 0 10 30 Multiple responses 45 10 20 20 English and French 10 10 0 0 English and non-official language 40 0 20 20 French and non-official language 0 0 0 0 English, French and non-official language 0 0 0 0Knowledge of non-official languages (20% sample data): 10 10 0 0German 50 45 0 0Chinese 10 10 10 0Spanish 35 35 0 0Portuguese 0 0 0 0Ukrainian 10 10 0 0Polish 0 0 0 0Dutch 10 10 0 0Punjabi 0 0 0 0Arabic 0 0 0 0Greek 0 0 0 0Tagalog (Pilipino) 10 10 0 0Vietnamese 0 0 0 0Hindi 0 0 0 0Hungarian 10 10 0 0Cree 10 0 0 0Russian 0 10 0 0Gujarati 0 0 0 0Yiddish 0 0 0 0Hebrew 0 0 0 0Urdu 0 0 0 0Creoles 0 0 0 0Persian (Farsi) 0 0 0 0Croatian 0 0 0 0Japanese 10 0 0 0Korean 0 0 0 0

Tamil 0 0 0 0Finnish 10 0 0 0Armenian 0 0 0 0Romanian 0 0 0 0Ojibway 0 0 0 0Czech 0 0 0 0Danish 0 0 0 0Non-verbal languages 0 10 0 0Inuktitut (Eskimo) 0 0 0 0Turkish 0 0 0 0Macedonian 0 0 0 0Slovak 0 0 0 0Khmer (Cambodian) 0 0 0 0Swedish 10 0 0 0Swahili 0 0 0 0Norwegian 25 25 0 0Lao 0 0 0 0Malay-Bahasa 0 0 0 0Serbian 0 0 0 0Lithuanian 0 0 0 0Estonian 10 0 0 0Latvian (Lettish) 0 0 0 0Bengali 0 0 0 0Maltese 0 0 0 0Flemish 0 0 0 0Slovenian 0 0 0 0Gaelic languages 0 0 0 0Sinhalese 0 0 0 0Montagnais-Naskapi 0 0 0 0Serbo-Croatian 0 0 0 0Thai 0 0 0 0Micmac 0 0 0 0Blackfoot 0 0 0 0Bulgarian 0 0 0 0Malayalam 0 0 0 0Dakota/Sioux 0 0 0 0South Slave 0 0 0 0Icelandic 0 0 0 0Nishga 0 0 0 0Frisian 0 0 0 0Chipewyan 0 0 0 0Kutchin-Gwich'in (Loucheux) 0 0 0 0Tlingit 0 0 0 0Dogrib 0 0 0 0Kurdish 0 0 0 0Pashto 0 0 0 0Other languages 355 15 185 135Total population by Aboriginal groups and non-Aborigin 3915 1770 1210 875 Total Aboriginal population 2175 145 1120 840 North American Indian single response 2095 115 1080 835 Métis single response 30 20 10 0 Inuit single response 0 0 0 0 Multiple Aboriginal responses 0 0 0 0 Other Aboriginal response 50 10 35 10

Total non-Aboriginal population 1735 1615 90 30Total population by ethnic origin (single and multiple r 3915 1765 1210 870Total population - Single responses 3000 975 1125 840Total population - Multiple responses 915 795 85 35Canadian - Total responses 605 505 80 15Canadian - Single responses 415 355 45 15Canadian - Multiple responses 190 155 30 0French - Total responses 150 145 0 0French - Single responses 25 25 0 0French - Multiple responses 130 125 0 0English - Total responses 610 570 30 10English - Single responses 160 160 0 0English - Multiple responses 450 410 30 10Chinese - Total responses 15 15 0 0Chinese - Single responses 15 10 0 0Chinese - Multiple responses 0 0 0 0Italian - Total responses 25 20 0 0Italian - Single responses 10 10 0 0Italian - Multiple responses 15 15 0 0German - Total responses 280 250 15 15German - Single responses 85 70 10 0German - Multiple responses 195 175 15 10Scottish - Total responses 330 300 25 0Scottish - Single responses 45 40 0 0Scottish - Multiple responses 290 260 20 10Irish - Total responses 285 260 20 10Irish - Single responses 25 25 0 0Irish - Multiple responses 260 240 15 10East Indian - Total responses 0 0 0 0East Indian - Single responses 0 0 0 0East Indian - Multiple responses 0 0 0 0North American Indian - Total responses 2160 175 1085 835North American Indian - Single responses 1970 50 1040 815North American Indian - Multiple responses 190 120 45 15Ukrainian - Total responses 60 45 10 0Ukrainian - Single responses 10 10 0 0Ukrainian - Multiple responses 55 40 15 0Dutch (Netherlands) - Total responses 65 60 0 0Dutch (Netherlands) - Single responses 15 15 0 0Dutch (Netherlands) - Multiple responses 55 50 10 0Polish - Total responses 35 35 0 10Polish - Single responses 0 10 0 0Polish - Multiple responses 35 30 0 0Portuguese - Total responses 0 0 0 0Portuguese - Single responses 0 0 0 0Portuguese - Multiple responses 0 10 10 0Filipino - Total responses 0 10 0 0Filipino - Single responses 10 10 0 0Filipino - Multiple responses 0 0 0 0Jewish - Total responses 0 0 0 0Jewish - Single responses 0 0 0 0Jewish - Multiple responses 0 0 0 0Greek - Total responses 0 0 0 0Greek - Single responses 0 0 0 0

Greek - Multiple responses 0 0 0 0Jamaican - Total responses 0 0 0 0Jamaican - Single responses 0 0 0 0Jamaican - Multiple responses 0 0 0 0Vietnamese - Total responses 0 0 0 0Vietnamese - Single responses 0 0 0 0Vietnamese - Multiple responses 0 0 0 0Hungarian (Magyar) - Total responses 20 25 0 0Hungarian (Magyar) - Single responses 10 0 0 0Hungarian (Magyar) - Multiple responses 20 20 0 0Lebanese - Total responses 0 10 0 0Lebanese - Single responses 0 0 0 0Lebanese - Multiple responses 0 0 0 0Spanish - Total responses 10 10 0 0Spanish - Single responses 0 0 0 0Spanish - Multiple responses 10 0 0 0Haitian - Total responses 0 0 0 0Haitian - Single responses 0 0 0 0Haitian - Multiple responses 0 0 0 0Korean - Total responses 10 0 0 0Korean - Single responses 0 0 0 0Korean - Multiple responses 0 0 0 0Québécois - Total responses 0 10 0 0Québécois - Single responses 0 0 0 0Québécois - Multiple responses 0 0 0 0Croatian - Total responses 0 0 0 0Croatian - Single responses 0 0 0 0Croatian - Multiple responses 0 0 0 0Iranian - Total responses 0 0 0 0Iranian - Single responses 0 0 0 0Iranian - Multiple responses 0 0 0 0Japanese - Total responses 10 10 0 0Japanese - Single responses 0 0 0 0Japanese - Multiple responses 10 10 0 0Métis - Total responses 15 10 0 0Métis - Single responses 0 0 0 0Métis - Multiple responses 10 10 0 0Norwegian - Total responses 245 235 0 10Norwegian - Single responses 95 95 0 0Norwegian - Multiple responses 150 140 10 0Russian - Total responses 20 20 0 0Russian - Single responses 0 0 0 0Russian - Multiple responses 15 15 0 0British, n.i.e. - Total responses 45 35 10 0British, n.i.e. - Single responses 30 25 10 0British, n.i.e. - Multiple responses 15 10 10 0Romanian - Total responses 0 0 0 0Romanian - Single responses 0 0 0 0Romanian - Multiple responses 0 0 0 0Danish - Total responses 25 25 0 0Danish - Single responses 10 10 0 0Danish - Multiple responses 20 25 0 10Finnish - Total responses 20 20 0 0Finnish - Single responses 10 0 0 0

Finnish - Multiple responses 15 15 0 0Inuit - Total responses 0 0 0 0Inuit - Single responses 0 0 0 0Inuit - Multiple responses 0 0 0 0Arab, n.i.e. - Total responses 0 0 0 0Arab, n.i.e. - Single responses 0 0 0 0Arab, n.i.e. - Multiple responses 0 0 0 0Sri Lankan - Total responses 10 0 0 0Sri Lankan - Single responses 0 0 0 0Sri Lankan - Multiple responses 10 10 0 0Belgian - Total responses 15 15 10 0Belgian - Single responses 0 0 0 0Belgian - Multiple responses 15 15 0 0West Indian - Total responses 0 0 0 0West Indian - Single responses 0 0 0 0West Indian - Multiple responses 0 0 0 0Swedish - Total responses 55 50 0 0Swedish - Single responses 0 0 0 0Swedish - Multiple responses 50 40 0 0Punjabi - Total responses 0 0 0 0Punjabi - Single responses 0 0 0 0Punjabi - Multiple responses 0 0 0 0African (Black), n.i.e. - Total responses 0 0 0 0African (Black), n.i.e. - Single responses 0 0 0 0African (Black), n.i.e. - Multiple responses 0 0 0 0Serbian - Total responses 0 0 0 0Serbian - Single responses 0 0 0 0Serbian - Multiple responses 0 0 0 0Somali - Total responses 0 0 0 0Somali - Single responses 0 0 0 0Somali - Multiple responses 0 0 0 0Austrian - Total responses 10 10 0 0Austrian - Single responses 0 0 0 0Austrian - Multiple responses 10 10 0 0Yugoslav, n.i.e. - Total responses 0 0 0 0Yugoslav, n.i.e. - Single responses 0 0 0 0Yugoslav, n.i.e. - Multiple responses 10 0 0 0Black - Total responses 10 0 0 0Black - Single responses 0 0 0 0Black - Multiple responses 0 0 0 0Welsh - Total responses 50 45 10 0Welsh - Single responses 0 10 0 0Welsh - Multiple responses 45 40 10 0Pakistani - Total responses 0 0 0 0Pakistani - Single responses 0 0 0 0Pakistani - Multiple responses 0 0 0 0South Asian, n.i.e. - Total responses 0 0 0 0South Asian, n.i.e. - Single responses 0 0 0 0South Asian, n.i.e. - Multiple responses 0 0 0 0Armenian - Total responses 0 0 0 0Armenian - Single responses 0 0 0 0Armenian - Multiple responses 0 0 0 0Czech - Total responses 10 0 0 0Czech - Single responses 0 0 0 0

Czech - Multiple responses 10 0 0 0Egyptian - Total responses 0 0 0 0Egyptian - Single responses 0 0 0 0Egyptian - Multiple responses 0 0 0 0Chilean - Total responses 0 0 0 0Chilean - Single responses 0 0 0 0Chilean - Multiple responses 0 0 0 0Swiss - Total responses 10 10 0 0Swiss - Single responses 10 0 0 0Swiss - Multiple responses 10 0 0 0Trinidadian/Tobagonian - Total responses 0 0 0 0Trinidadian/Tobagonian - Single responses 0 0 0 0Trinidadian/Tobagonian - Multiple responses 0 0 0 0Guyanese - Total responses 0 0 0 0Guyanese - Single responses 0 0 0 0Guyanese - Multiple responses 0 0 0 0American - Total responses 70 65 10 0American - Single responses 25 20 10 0American - Multiple responses 45 45 0 0Latin/Central/South American, n.i.e. - Total responses 0 10 0 0Latin/Central/South American, n.i.e. - Single responses 0 0 0 0Latin/Central/South American, n.i.e. - Multiple response 0 0 0 0Slovak - Total responses 0 0 0 0Slovak - Single responses 0 0 0 0Slovak - Multiple responses 0 0 0 0Salvadorean - Total responses 0 0 0 0Salvadorean - Single responses 0 0 0 0Salvadorean - Multiple responses 0 0 0 0Macedonian - Total responses 0 0 0 0Macedonian - Single responses 0 0 0 0Macedonian - Multiple responses 0 0 0 0Acadian - Total responses 0 0 0 0Acadian - Single responses 0 10 0 0Acadian - Multiple responses 0 0 0 0Tamil - Total responses 0 0 0 0Tamil - Single responses 0 0 0 0Tamil - Multiple responses 0 0 0 0Cambodian - Total responses 0 0 0 0Cambodian - Single responses 0 0 0 0Cambodian - Multiple responses 0 0 0 0Slovenian - Total responses 0 0 0 0Slovenian - Single responses 0 0 0 0Slovenian - Multiple responses 0 0 0 0Maltese - Total responses 0 0 0 0Maltese - Single responses 0 0 0 0Maltese - Multiple responses 0 0 0 0Laotian - Total responses 0 0 0 0Laotian - Single responses 0 0 0 0Laotian - Multiple responses 0 0 0 0Ethiopian - Total responses 0 0 0 0Ethiopian - Single responses 0 0 0 0Ethiopian - Multiple responses 0 0 0 0Ghanaian - Total responses 0 0 0 0Ghanaian - Single responses 0 0 0 0

Ghanaian - Multiple responses 0 0 0 0Lithuanian - Total responses 0 0 0 0Lithuanian - Single responses 0 0 0 0Lithuanian - Multiple responses 0 10 0 0Afghan - Total responses 0 0 0 0Afghan - Single responses 0 0 0 0Afghan - Multiple responses 0 0 0 0Icelandic - Total responses 10 0 0 0Icelandic - Single responses 0 0 0 0Icelandic - Multiple responses 0 10 0 0Estonian - Total responses 0 10 0 0Estonian - Single responses 0 10 0 0Estonian - Multiple responses 10 0 0 0Turk - Total responses 0 0 0 0Turk - Single responses 0 0 0 0Turk - Multiple responses 0 0 0 0Latvian - Total responses 0 0 0 0Latvian - Single responses 0 0 0 0Latvian - Multiple responses 0 0 0 0Barbadian - Total responses 0 0 0 0Barbadian - Single responses 0 0 0 0Barbadian - Multiple responses 0 0 0 0Syrian - Total responses 10 0 0 0Syrian - Single responses 0 0 0 0Syrian - Multiple responses 0 0 0 0Czechoslovakian - Total responses 10 0 0 0Czechoslovakian - Single responses 0 0 0 0Czechoslovakian - Multiple responses 0 0 0 0Mexican - Total responses 10 0 0 0Mexican - Single responses 0 0 0 0Mexican - Multiple responses 0 0 0 0Peruvian - Total responses 0 0 0 0Peruvian - Single responses 0 0 0 0Peruvian - Multiple responses 0 0 0 0Moroccan - Total responses 0 0 0 0Moroccan - Single responses 0 0 0 0Moroccan - Multiple responses 0 0 0 0Iraqi - Total responses 0 0 0 0Iraqi - Single responses 0 0 0 0Iraqi - Multiple responses 0 0 0 0Bosnian - Total responses 0 0 0 0Bosnian - Single responses 0 0 0 0Bosnian - Multiple responses 0 0 0 0Palestinian - Total responses 0 0 0 0Palestinian - Single responses 0 0 0 0Palestinian - Multiple responses 0 0 0 0Scandinavian, n.i.e. - Total responses 15 10 0 0Scandinavian, n.i.e. - Single responses 10 10 0 0Scandinavian, n.i.e. - Multiple responses 0 10 0 0Caribbean, n.i.e. - Total responses 10 0 0 0Caribbean, n.i.e. - Single responses 0 0 0 0Caribbean, n.i.e. - Multiple responses 0 0 0 0European, n.i.e. - Total responses 20 20 0 0European, n.i.e. - Single responses 10 10 0 0

European, n.i.e. - Multiple responses 10 0 0 0Bulgarian - Total responses 0 0 0 0Bulgarian - Single responses 0 0 0 0Bulgarian - Multiple responses 0 0 0 0Guatemalan - Total responses 0 0 0 0Guatemalan - Single responses 0 0 0 0Guatemalan - Multiple responses 0 0 0 0Bangladeshi - Total responses 0 0 0 0Bangladeshi - Single responses 0 0 0 0Bangladeshi - Multiple responses 0 0 0 0Taiwanese - Total responses 0 0 0 0Taiwanese - Single responses 0 0 0 0Taiwanese - Multiple responses 0 0 0 0Colombian - Total responses 0 0 0 0Colombian - Single responses 0 0 0 0Colombian - Multiple responses 0 0 0 0Eritrean - Total responses 0 0 0 0Eritrean - Single responses 0 0 0 0Eritrean - Multiple responses 0 0 0 0Fijian - Total responses 0 0 0 0Fijian - Single responses 0 0 0 0Fijian - Multiple responses 10 0 0 0Ecuadorian - Total responses 0 0 0 0Ecuadorian - Single responses 0 0 0 0Ecuadorian - Multiple responses 0 0 0 0Algerian - Total responses 0 0 0 0Algerian - Single responses 0 0 0 0Algerian - Multiple responses 0 0 0 0Nigerian - Total responses 0 0 0 0Nigerian - Single responses 0 0 0 0Nigerian - Multiple responses 0 0 0 0Hispanic - Total responses 0 0 0 0Hispanic - Single responses 0 0 0 0Hispanic - Multiple responses 0 0 0 0Total - Total population by visible minority population 3910 1770 1205 870 Total visible minority population 45 40 0 0 Black 0 0 0 0 South Asian 0 0 0 0 Chinese 15 10 0 0 Korean 0 0 0 0 Japanese 10 10 0 0 Southeast Asian 10 0 0 0 Filipino 10 0 0 0 Arab/West Asian 0 0 0 0 Latin American 0 10 0 0 Visible minority, n.i.e. 0 10 0 0 Multiple visible minority 0 0 0 0 All others 3865 1725 1205 875Total population 15 years and over by labour force activ 2885 1380 870 590 In the labour force 2070 1030 590 405 Employed 1720 950 430 320 Unemployed 345 85 160 90 Not in the labour force 815 350 285 180 Participation rate 71.8 74.6 67.8 68.6

Employment-population ratio 59.6 68.8 49.4 54.2 Unemployment rate 16.7 8.3 27.1 22.2Total population 15-24 years by labour force activity (2 535 205 185 135 In the labour force 315 130 95 75 Employed 225 115 60 50 Unemployed 90 20 40 30 Not in the labour force 225 75 85 60 Participation rate 58.9 63.4 51.4 55.6 Employment-population ratio 42.1 56.1 32.4 37 Unemployment rate 28.6 15.4 42.1 40Total population 25 years and over by labour force activ 2350 1175 690 450 In the labour force 1750 900 490 330 Employed 1495 840 365 270 Unemployed 255 60 125 60 Not in the labour force 595 275 195 120 Participation rate 74.5 76.6 71 73.3 Employment-population ratio 63.6 71.5 52.9 60 Unemployment rate 14.6 6.7 25.5 18.2Males 15 years and over by labour force activity (20% s 1530 735 455 300 In the labour force 1180 585 335 220 Employed 940 540 225 150 Unemployed 235 40 110 65 Not in the labour force 350 150 120 80 Participation rate 77.1 79.6 73.6 73.3 Employment-population ratio 61.4 73.5 49.5 50 Unemployment rate 19.9 6.8 32.8 29.5Males 15-24 years by labour force activity (20% sample 300 115 105 75 In the labour force 185 75 60 45 Employed 130 65 40 25 Unemployed 55 10 25 20 Not in the labour force 115 35 45 30 Participation rate 61.7 65.2 57.1 60 Employment-population ratio 43.3 56.5 38.1 33.3 Unemployment rate 29.7 13.3 41.7 44.4Males 25 years and over by labour force activity (20% s 1230 620 355 225 In the labour force 995 515 275 180 Employed 815 480 190 130 Unemployed 180 30 90 45 Not in the labour force 235 110 75 45 Participation rate 80.9 83.1 77.5 80 Employment-population ratio 66.3 77.4 53.5 57.8 Unemployment rate 18.1 5.8 32.7 25Females 15 years and over by labour force activity (20 1360 640 410 290 In the labour force 890 440 250 185 Employed 775 405 200 165 Unemployed 110 35 50 20 Not in the labour force 470 200 160 105 Participation rate 65.4 68.8 61 63.8 Employment-population ratio 57 63.3 48.8 56.9 Unemployment rate 12.4 8 20 10.8Females 15-24 years by labour force activity (20% samp 240 90 80 65 In the labour force 125 55 35 35 Employed 95 45 20 30 Unemployed 35 15 15 0

Not in the labour force 110 35 40 30 Participation rate 52.1 61.1 43.8 53.8 Employment-population ratio 39.6 50 25 46.2 Unemployment rate 28 27.3 42.9 0Females 25 years and over by labour force activity (20 1120 550 330 225 In the labour force 760 385 215 150 Employed 680 355 180 135 Unemployed 80 30 35 20 Not in the labour force 360 165 120 70 Participation rate 67.9 70 65.2 66.7 Employment-population ratio 60.7 64.5 54.5 60 Unemployment rate 10.5 7.8 16.3 13.3Population 15 years and over in private households by p 2850 1345 870 590 In the labour force 2035 995 590 405 Employed 1690 915 425 320 Unemployed 345 80 160 90 Not in the labour force 820 350 285 185 Participation rate 71.4 74 67.8 68.6 Employment-population ratio 59.3 68 48.9 54.2 Unemployment rate 17 8 27.1 22.2Population 15 years and over in private households with 1610 840 450 290 In the labour force 1040 565 275 170 Employed 845 515 185 125 Unemployed 195 50 90 45 Not in the labour force 570 270 175 125 Participation rate 64.6 67.3 61.1 58.6 Employment-population ratio 52.5 61.3 41.1 43.1 Unemployment rate 18.8 8.8 32.7 26.5Population 15 years and over in private households with 1245 510 420 295 In the labour force 995 430 310 235 Employed 845 400 240 190 Unemployed 155 30 70 45 Not in the labour force 250 80 105 60 Participation rate 79.9 84.3 73.8 79.7 Employment-population ratio 67.9 78.4 57.1 64.4 Unemployment rate 15.6 7 22.6 19.1Population 15 years and over in private households with 250 115 85 45 In the labour force 190 90 65 30 Employed 145 75 40 25 Unemployed 40 15 20 10 Not in the labour force 60 25 25 10 Participation rate 76 78.3 76.5 66.7 Employment-population ratio 58 65.2 47.1 55.6 Unemployment rate 21.1 16.7 30.8 33.3Population 15 years and over in private households with 230 75 75 65 In the labour force 185 65 60 55 Employed 160 60 50 50 Unemployed 25 0 10 0 Not in the labour force 40 10 15 10 Participation rate 80.4 86.7 80 84.6 Employment-population ratio 69.6 80 66.7 76.9 Unemployment rate 13.5 0 16.7 0Population 15 years and over in private households with 770 315 260 190 In the labour force 625 275 190 150

Employed 535 265 150 120 Unemployed 85 15 40 30 Not in the labour force 150 40 70 40 Participation rate 81.2 87.3 73.1 78.9 Employment-population ratio 69.5 84.1 57.7 63.2 Unemployment rate 13.6 5.5 21.1 20Males 15 years and over in private households by presen 1505 710 455 300 In the labour force 1150 565 340 220 Employed 920 515 225 150 Unemployed 235 40 110 65 Not in the labour force 350 150 120 80 Participation rate 76.4 79.6 74.7 73.3 Employment-population ratio 61.1 72.5 49.5 50 Unemployment rate 20.4 7.1 32.4 29.5Males 15 years and over in private households with no c 925 465 265 165 In the labour force 625 330 175 100 Employed 485 300 105 65 Unemployed 140 30 70 35 Not in the labour force 300 140 95 65 Participation rate 67.6 71 66 60.6 Employment-population ratio 52.4 64.5 39.6 39.4 Unemployment rate 22.4 9.1 40 35Males 15 years and over in private households with chil 580 250 195 135 In the labour force 530 235 165 120 Employed 435 220 125 85 Unemployed 95 15 45 30 Not in the labour force 50 15 25 15 Participation rate 91.4 94 84.6 88.9 Employment-population ratio 75 88 64.1 63 Unemployment rate 17.9 6.4 27.3 25Males 15 years and over in private households with chil 115 55 40 20 In the labour force 110 50 35 20 Employed 90 50 30 15 Unemployed 20 10 10 0 Not in the labour force 10 0 10 0 Participation rate 95.7 90.9 87.5 100 Employment-population ratio 78.3 90.9 75 75 Unemployment rate 18.2 20 28.6 0Males 15 years and over in private households with chil 105 35 35 35 In the labour force 105 40 35 30 Employed 85 35 25 25 Unemployed 20 0 10 0 Not in the labour force 0 0 0 0 Participation rate 100 100 100 85.7 Employment-population ratio 81 100 71.4 71.4 Unemployment rate 19 0 28.6 0Males 15 years and over in private households with chil 355 155 115 85 In the labour force 315 145 100 75 Employed 255 135 70 50 Unemployed 60 10 25 25 Not in the labour force 40 15 20 10 Participation rate 88.7 93.5 87 88.2 Employment-population ratio 71.8 87.1 60.9 58.8 Unemployment rate 19 6.9 25 33.3

Females 15 years and over in private households by pres 1350 635 410 285 In the labour force 880 430 250 185 Employed 770 395 200 160 Unemployed 110 35 50 25 Not in the labour force 470 200 160 105 Participation rate 65.2 67.7 61 64.9 Employment-population ratio 57 62.2 48.8 56.1 Unemployment rate 12.5 8.1 20 13.5Females 15 years and over in private households with n 685 375 185 125 In the labour force 415 240 105 70 Employed 355 220 80 55 Unemployed 55 20 25 10 Not in the labour force 270 135 80 60 Participation rate 60.6 64 56.8 56 Employment-population ratio 51.8 58.7 43.2 44 Unemployment rate 13.3 8.3 23.8 14.3Females 15 years and over in private households with c 665 260 225 165 In the labour force 465 195 150 120 Employed 415 175 120 105 Unemployed 55 15 25 15 Not in the labour force 195 65 80 45 Participation rate 69.9 75 66.7 72.7 Employment-population ratio 62.4 67.3 53.3 63.6 Unemployment rate 11.8 7.7 16.7 12.5Females 15 years and over in private households with ch 135 60 45 25 In the labour force 80 35 30 10 Employed 55 25 20 10 Unemployed 20 10 10 0 Not in the labour force 55 25 20 10 Participation rate 59.3 58.3 66.7 40 Employment-population ratio 40.7 41.7 44.4 40 Unemployment rate 25 28.6 33.3 0Females 15 years and over in private households with ch 120 40 40 35 In the labour force 85 25 30 30 Employed 75 25 25 25 Unemployed 10 10 10 0 Not in the labour force 35 10 10 10 Participation rate 70.8 62.5 75 85.7 Employment-population ratio 62.5 62.5 62.5 71.4 Unemployment rate 11.8 40 33.3 0Females 15 years and over in private households with ch 410 160 145 105 In the labour force 305 130 95 75 Employed 280 125 75 65 Unemployed 25 0 15 10 Not in the labour force 110 30 55 25 Participation rate 74.4 81.2 65.5 71.4 Employment-population ratio 68.3 78.1 51.7 61.9 Unemployment rate 8.2 0 15.8 13.3Total labour force 15 years and over by industry divisi 2065 1030 585 405 Industry - Not applicable 55 10 30 10 All industries 2015 1015 560 395 Division A - Agricultural and related service industries 30 30 0 0 Division B - Fishing and trapping industries 175 35 75 65 Division C - Logging and forestry industries 275 200 20 45

Division D - Mining (including milling), quarrying and oi 0 0 0 0 Division E - Manufacturing industries 125 40 55 25 Division F - Construction industries 105 75 20 10 Division G - Transportation and storage industries 75 50 15 0 Division H - Communication and other utility industrie 45 30 10 0 Division I - Wholesale trade industries 10 0 10 10 Division J - Retail trade industries 180 105 45 25 Division K - Finance and insurance industries 20 10 0 0 Division L - Real estate operator and insurance agent 0 10 0 0 Division M - Business service industries 25 15 10 10 Division N - Government service industries 315 80 135 75 Division O - Educational service industries 225 100 85 40 Division P - Health and social service industries 160 70 65 25 Division Q - Accommodation, food and beverage servi 155 95 20 30 Division R - Other service industries 100 65 10 25Total labour force 15 years and over by occupational b 2065 1030 590 405Occupation - Not applicable 55 10 30 10 All occupations 2015 1015 555 395 A Management occupations 145 105 35 0 A0 Senior management occupations 25 10 10 0 A1 Specialist managers 0 0 10 0 A2 Managers in retail trade, food and accommodatio 65 55 10 0 A3 Other managers n.e.c. 55 40 15 0 B Business, finance and administrative occupations 225 130 55 20 B0 Professional occupations in business and finance 15 0 10 0 B1 Finance and insurance administrative occupation 20 15 0 0 B2 Secretaries 40 15 10 0 B3 Administrative and regulatory occupations 20 15 0 10 B4 Clerical supervisors 15 0 10 0 B5 Clerical occupations 125 75 35 15 C Natural and applied sciences and related occupation 110 95 10 10 C0 Professional occupations in natural and applied 30 25 0 0 C1 Technical occupations related to natural and appl 85 65 0 10 D Health occupations 80 35 30 15 D0 Professional occupations in health 15 10 10 0 D1 Nurse supervisors and registered nurses 25 15 10 0 D2 Technical and related occupations in health 20 10 10 0 D3 Assisting occupations in support of health service 25 10 10 0 E Occupations in social science, education, government 165 75 60 30 E0 Judges, lawyers, psychologists, social workers, mi 45 15 25 10 E1 Teachers and professors 110 55 35 20 E2 Paralegals, social services workers and occupatio 15 10 10 10 F Occupations in art, culture, recreation and sport 35 20 15 10 F0 Professional occupations in art and culture 10 0 10 0 F1 Technical occupations in art, culture, recreation a 25 15 0 0 G Sales and service occupations 460 195 135 130 G0 Sales and service supervisors 0 10 0 0 G1 Wholesale, technical, insurance, real estate sales 10 0 0 10 G2 Retail salespersons and sales clerks 40 15 15 0 G3 Cashiers 25 15 0 10 G4 Chefs and cooks 40 25 0 10 G5 Occupations in food and beverage service 45 25 10 15 G6 Occupations in protective services 20 10 10 0 G7 Occupations in travel and accommodation includin 15 0 0 0

G8 Childcare and home support workers 105 30 30 45 G9 Sales and service occupations n.e.c. 165 65 55 40 H Trades, transport and equipment operators and rela 280 165 80 35 H0 Contractors and supervisors in trades and transpo 20 10 10 10 H1 Construction trades 60 30 15 10 H2 Stationary engineers, power station operators an 15 10 0 0 H3 Machinists, metal forming, shaping and erecting 0 0 0 0 H4 Mechanics 35 30 10 0 H5 Other trades n.e.c. 0 0 0 0 H6 Heavy equipment and crane operators including dr 30 20 0 10 H7 Transportation equipment operators and related 65 45 15 0 H8 Trades helpers, construction, and transportation 60 20 30 10 I Occupations unique to primary industry 395 170 110 105 I0 Occupations unique to agriculture excluding labou 40 35 10 0 I1 Occupations unique to forestry operations, mining, 230 85 65 80 I2 Primary production labourers 125 50 40 25 J Occupations unique to processing, manufacturing and 105 35 30 35 J0 Supervisors in manufacturing 10 10 0 0 J1 Machine operators in manufacturing 75 25 25 25 J2 Assemblers in manufacturing 10 10 0 0 J3 Labourers in processing, manufacturing and utiliti 20 10 10 10Male labour force 15 years and over by occupational br 1180 585 340 220Occupation - Not applicable 30 0 15 10All occupations 1150 585 320 215 A Management occupations 100 70 30 10 A0 Senior management occupations 15 0 10 0 A1 Specialist managers 10 10 10 0 A2 Managers in retail trade, food and accommodatio 35 30 10 0 A3 Other managers n.e.c. 45 30 10 0 B Business, finance and administrative occupations 40 20 10 10 B0 Professional occupations in business and finance 0 0 0 0 B1 Finance and insurance administrative occupation 0 0 0 0 B2 Secretaries 0 0 0 0 B3 Administrative and regulatory occupations 10 10 0 0 B4 Clerical supervisors 0 0 0 10 B5 Clerical occupations 15 0 10 0 C Natural and applied sciences and related occupation 90 75 10 0 C0 Professional occupations in natural and applied 25 20 0 0 C1 Technical occupations related to natural and appl 60 55 10 0 D Health occupations 20 10 0 0 D0 Professional occupations in health 10 10 0 0 D1 Nurse supervisors and registered nurses 10 0 0 0 D2 Technical and related occupations in health 0 0 0 0 D3 Assisting occupations in support of health service 0 0 0 0 E Occupations in social science, education, government 60 25 25 10 E0 Judges, lawyers, psychologists, social workers, mi 20 10 10 10 E1 Teachers and professors 35 20 10 0 E2 Paralegals, social services workers and occupatio 0 0 0 0 F Occupations in art, culture, recreation and sport 20 0 10 10 F0 Professional occupations in art and culture 10 0 0 0 F1 Technical occupations in art, culture, recreation a 10 10 0 10 G Sales and service occupations 150 55 55 35 G0 Sales and service supervisors 0 0 0 0 G1 Wholesale, technical, insurance, real estate sales 10 0 0 0

G2 Retail salespersons and sales clerks 10 10 10 0 G3 Cashiers 0 0 0 0 G4 Chefs and cooks 20 10 0 10 G5 Occupations in food and beverage service 10 10 0 0 G6 Occupations in protective services 15 10 10 0 G7 Occupations in travel and accommodation includin 10 10 0 0 G8 Childcare and home support workers 0 0 0 0 G9 Sales and service occupations n.e.c. 85 25 40 25 H Trades, transport and equipment operators and rela 265 155 75 35 H0 Contractors and supervisors in trades and transpo 15 15 10 0 H1 Construction trades 60 30 15 15 H2 Stationary engineers, power station operators an 10 10 0 0 H3 Machinists, metal forming, shaping and erecting 0 0 0 0 H4 Mechanics 35 30 10 0 H5 Other trades n.e.c. 10 0 0 0 H6 Heavy equipment and crane operators including dr 30 20 0 10 H7 Transportation equipment operators and related 55 40 15 0 H8 Trades helpers, construction, and transportation 55 15 30 10 I Occupations unique to primary industry 335 140 95 85 I0 Occupations unique to agriculture excluding labou 25 20 0 0 I1 Occupations unique to forestry operations, mining, 200 75 55 60 I2 Primary production labourers 110 40 35 20 J Occupations unique to processing, manufacturing and 70 25 20 25 J0 Supervisors in manufacturing 0 10 0 0 J1 Machine operators in manufacturing 50 15 15 20 J2 Assemblers in manufacturing 10 10 0 0 J3 Labourers in processing, manufacturing and utiliti 15 0 0 10Female labour force 15 years and over by occupational 890 440 250 185Occupation - Not applicable 20 10 10 10All occupations 865 435 235 180 A Management occupations 40 30 10 0 A0 Senior management occupations 10 0 10 0 A1 Specialist managers 0 0 0 0 A2 Managers in retail trade, food and accommodatio 25 20 0 0 A3 Other managers n.e.c. 10 0 0 0 B Business, finance and administrative occupations 190 110 50 20 B0 Professional occupations in business and finance 0 0 0 0 B1 Finance and insurance administrative occupation 20 15 0 10 B2 Secretaries 35 15 15 0 B3 Administrative and regulatory occupations 10 10 0 0 B4 Clerical supervisors 10 10 0 0 B5 Clerical occupations 110 65 30 15 C Natural and applied sciences and related occupation 30 15 0 10 C0 Professional occupations in natural and applied 10 10 0 0 C1 Technical occupations related to natural and appl 20 15 10 10 D Health occupations 60 25 20 15 D0 Professional occupations in health 10 10 10 0 D1 Nurse supervisors and registered nurses 20 10 10 0 D2 Technical and related occupations in health 10 0 0 0 D3 Assisting occupations in support of health service 25 10 10 10 E Occupations in social science, education, government 110 45 40 20 E0 Judges, lawyers, psychologists, social workers, mi 20 10 10 10 E1 Teachers and professors 75 30 25 20 E2 Paralegals, social services workers and occupatio 10 0 0 0

F Occupations in art, culture, recreation and sport 20 15 10 0 F0 Professional occupations in art and culture 10 0 0 0 F1 Technical occupations in art, culture, recreation a 15 10 0 0 G Sales and service occupations 305 140 80 90 G0 Sales and service supervisors 0 0 0 0 G1 Wholesale, technical, insurance, real estate sales 0 0 0 0 G2 Retail salespersons and sales clerks 30 10 10 10 G3 Cashiers 25 15 10 10 G4 Chefs and cooks 25 15 10 10 G5 Occupations in food and beverage service 40 20 10 15 G6 Occupations in protective services 0 0 0 0 G7 Occupations in travel and accommodation includin 10 10 0 0 G8 Childcare and home support workers 95 30 25 45 G9 Sales and service occupations n.e.c. 80 40 20 20 H Trades, transport and equipment operators and rela 15 10 10 0 H0 Contractors and supervisors in trades and transpo 0 0 0 0 H1 Construction trades 0 0 0 0 H2 Stationary engineers, power station operators an 0 0 0 0 H3 Machinists, metal forming, shaping and erecting 0 0 0 0 H4 Mechanics 0 0 0 0 H5 Other trades n.e.c. 0 0 0 0 H6 Heavy equipment and crane operators including dr 0 0 0 0 H7 Transportation equipment operators and related 10 0 0 0 H8 Trades helpers, construction, and transportation 10 0 0 0 I Occupations unique to primary industry 65 25 15 20 I0 Occupations unique to agriculture excluding labou 15 10 0 0 I1 Occupations unique to forestry operations, mining, 30 10 10 15 I2 Primary production labourers 15 10 10 10 J Occupations unique to processing, manufacturing and 40 10 15 10 J0 Supervisors in manufacturing 10 0 0 0 J1 Machine operators in manufacturing 20 0 10 10 J2 Assemblers in manufacturing 10 10 0 10 J3 Labourers in processing, manufacturing and utiliti 10 0 0 0Total labour force 15 years and over by class of worker 2065 1030 590 410 Class of worker - Not applicable 55 15 30 10 All classes of worker 2015 1015 560 395 Paid workers 1740 850 520 335 Employees 1680 795 515 325 Self-employed (incorporated) 65 55 10 10 Without paid help 30 20 10 10 With paid help 35 30 10 0 Self-employed (unincorporated) 260 165 35 65 Without paid help 195 125 20 50 With paid help 65 35 15 15 Unpaid family workers 10 10 0 0Male labour force 15 years and over by class of worker 1180 590 340 220 Class of worker - Not applicable 30 0 20 10 All classes of worker 1150 580 320 210 Paid workers 965 475 295 170 Employees 910 430 290 165 Self-employed (incorporated) 50 45 10 0 Without paid help 20 15 0 0 With paid help 30 30 10 0 Self-employed (unincorporated) 185 105 30 45

Without paid help 135 80 15 35 With paid help 40 25 10 10 Unpaid family workers 0 0 0 0Female labour force 15 years and over by class of work 885 440 250 185 Class of worker - Not applicable 25 0 10 0 All classes of worker 865 430 240 180 Paid workers 785 375 230 165 Employees 770 365 230 165 Self-employed (incorporated) 15 10 0 0 Without paid help 10 10 0 0 With paid help 0 0 0 0 Self-employed (unincorporated) 80 55 10 15 Without paid help 60 40 10 15 With paid help 20 15 10 10 Unpaid family workers 0 0 10 0Population 15 years and over by hours of unpaid house 2885 1380 870 585 No hours of housework 270 105 100 60 Less than 5 hours of housework 405 175 130 90 5 to 14 hours of housework 800 330 305 150 15 to 29 hours of housework 660 350 170 125 30 to 59 hours of housework 475 270 105 90 60 or more hours of housework 280 145 60 75Males 15 years and over by hours of unpaid housework 1525 735 460 300 No hours of housework 200 75 75 45 Less than 5 hours of housework 280 125 85 55 5 to 14 hours of housework 465 210 175 75 15 to 29 hours of housework 320 170 70 65 30 to 59 hours of housework 185 105 45 40 60 or more hours of housework 80 40 10 30Females 15 years and over by hours of unpaid housewo 1360 645 410 285 No hours of housework 70 25 25 15 Less than 5 hours of housework 130 45 45 30 5 to 14 hours of housework 335 120 130 80 15 to 29 hours of housework 340 175 95 60 30 to 59 hours of housework 290 165 60 55 60 or more hours of housework 195 105 50 45Population 15 years and over by hours of unpaid childc 2885 1380 870 585 No hours of childcare 1380 815 340 200 Less than 5 hours of childcare 260 95 90 70 5 to 14 hours of childcare 385 150 140 90 15 to 29 hours of childcare 215 70 75 60 30 to 59 hours of childcare 240 100 80 55 60 or more hours of childcare 415 150 145 115Males 15 years and over by hours of unpaid childcare ( 1525 735 460 300 No hours of childcare 830 485 210 125 Less than 5 hours of childcare 155 60 55 40 5 to 14 hours of childcare 215 90 80 45 15 to 29 hours of childcare 105 40 40 30 30 to 59 hours of childcare 90 35 35 25 60 or more hours of childcare 125 30 50 40Females 15 years and over by hours of unpaid childcar 1360 640 415 285 No hours of childcare 550 335 130 75 Less than 5 hours of childcare 100 35 40 30 5 to 14 hours of childcare 170 65 60 45

15 to 29 hours of childcare 105 35 40 35 30 to 59 hours of childcare 145 65 45 30 60 or more hours of childcare 290 115 100 70Population 15 years and over by hours of unpaid care t 2885 1375 870 590 No hours of care to seniors 2210 1195 625 350 Less than 5 hours of care to seniors 350 115 130 100 5 to 9 hours of care to seniors 130 30 55 40 10 or more hours of care to seniors 195 40 60 95Males 15 years and over by hours of unpaid care to sen 1530 735 460 300 No hours of care to seniors 1220 660 345 190 Less than 5 hours of care to seniors 155 50 60 45 5 to 9 hours of care to seniors 60 15 25 15 10 or more hours of care to seniors 95 15 25 45Females 15 years and over by hours of unpaid care to s 1355 640 410 290 No hours of care to seniors 985 535 285 155 Less than 5 hours of care to seniors 190 70 65 60 5 to 9 hours of care to seniors 75 15 30 25 10 or more hours of care to seniors 105 20 30 50Total employed labour force 15 years and over by place 1720 945 430 315Males 945 545 230 155 Usual place of work 510 300 150 50 In CSD of residence 410 260 115 25 In different CSD 105 40 35 30 In same CD 85 20 30 25 At home 100 65 10 25 Outside Canada 0 0 0 0 No fixed workplace 330 175 65 85Females 775 405 200 160 Usual place of work 610 310 165 125 In CSD of residence 475 270 135 55 In different CSD 140 35 35 65 In same CD 125 25 30 70 At home 90 70 15 10 Outside Canada 10 10 0 0 No fixed workplace 70 25 15 30Total employed labour force 15 years and over by mode 1525 810 395 290Males with usual place of work or no fixed workplace 845 475 215 130 Car, truck, van as driver 445 320 50 75 Car, truck, van as passenger 80 30 20 30 Public transit 10 0 0 0 Walked to work 155 45 95 15 Bicycle 25 10 10 0 Motorcycle 0 0 0 0 Taxicab 10 0 0 0 Other method 130 70 40 15Females with usual place of work or no fixed workplace 685 335 180 155 Car, truck, van as driver 350 245 20 80 Car, truck, van as passenger 75 15 30 20 Public transit 10 0 10 0 Walked to work 230 55 115 50 Bicycle 10 0 0 0 Motorcycle 0 0 0 0 Taxicab 10 0 10 0 Other method 10 0 0 0

Total population, 15 to 24 years by school attendance 540 205 180 135 Not attending school 265 95 100 60 Attending school full-time 240 95 75 70 Attending school part-time 30 15 15 10Total population 15 years and over by highest level of 2885 1380 870 590 Less than grade 9 370 75 175 110 Grades 9 to 13 1075 515 305 240 Without secondary school graduation certificate 735 280 250 190 With secondary school graduation certificate 340 240 55 50 Trades certificate or diploma 135 50 40 40 Other non-university education only 870 425 260 160 Without certificate or diploma 300 105 130 55 With certificate or diploma 575 320 125 105 University 445 305 90 40 Without degree 195 135 40 25 Without certificate or diploma 85 60 15 10 With certificate or diploma 110 75 25 10 With bachelor's degree or higher 245 175 50 15Males with postsecondary qualifications by major field 565 340 120 80 Educational, recreational and counselling services 40 30 10 10 Fine and applied arts 15 10 0 0 Humanities and related fields 20 15 10 10 Social sciences and related fields 35 15 10 10 Commerce, management and business administration 50 25 20 0 Agricultural and biological sciences/technologies 65 30 20 15 Engineering and applied sciences 50 45 0 10 Engineering and applied science technologies and tra 245 160 45 30 Health professions, sciences and technologies 30 10 10 10 Mathematics and physical sciences 10 10 0 0 No specialization and all other, n.e.c. 0 0 0 0Females with postsecondary qualifications by major fiel 500 280 120 95 Educational, recreational and counselling services 105 65 20 25 Fine and applied arts 20 15 0 0 Humanities and related fields 20 0 10 10 Social sciences and related fields 30 15 10 0 Commerce, management and business administration 115 65 35 15 Agricultural and biological sciences/technologies 25 20 10 0 Engineering and applied sciences 15 10 0 0 Engineering and applied science technologies and tra 40 15 15 10 Health professions, sciences and technologies 125 60 25 35 Mathematics and physical sciences 10 10 0 0 No specialization and all other, n.e.c. 0 0 0 0Total by mobility status 1 year ago (20% sample data) 3850 1740 1185 860 Non-movers 3150 1395 940 775 Movers 695 350 245 85 Non-migrants 325 140 150 40 Migrants 375 210 100 50 Internal migrants 355 195 90 45 Intraprovincial migrants 300 165 80 40 Interprovincial migrants 60 35 15 10 External migrants 15 15 0 0Total by mobility status 5 years ago (20% sample data) 3590 1640 1095 790 Non-movers 2055 880 655 490 Movers 1535 755 445 305

Non-migrants 705 240 255 210 Migrants 830 515 190 90 Internal migrants 810 500 185 90 Intraprovincial migrants 645 390 150 80 Interprovincial migrants 165 110 35 10 External migrants 20 15 0 0All persons with employment income by work activity (2 2140 1090 595 410 Average employment income $ 19677 24875 15449 12416 Standard error of average employment income $ 0 0 0 0 Worked full year, full time 635 385 160 75 Average employment income $ 32684 35442 30109 24787 Standard error of average employment income $ 0 0 0 0 Worked part year or part time 1475 685 430 330 Average employment income $ 14293 19121 10219 9718 Standard error of average employment income $ 0 0 0 0Males with employment income by work activity (20% sa 1190 605 335 215 Average employment income $ 22402 30108 16199 11146 Standard error of average employment income $ 0 0 0 0 Worked full year, full time 355 235 90 20 Average employment income $ 36177 39566 31549 19631 Standard error of average employment income $ 0 0 0 0 Worked part year or part time 825 360 240 195 Average employment income $ 16490 23917 10632 10133 Standard error of average employment income $ 0 0 0 0Females with employment income by work activity (20% 950 480 265 195 Average employment income $ 16263 18233 14511 13857 Standard error of average employment income $ 0 0 0 0 Worked full year, full time 275 150 70 50 Average employment income $ 28190 28765 28259 26928 Standard error of average employment income $ 0 0 0 0 Worked part year or part time 650 320 190 130 Average employment income $ 11527 13712 9704 9109 Standard error of average employment income $ 0 0 0 0Total - Composition of total income % (20% sample data 100 100 100 100 Employment income % 77.6 82.6 71.5 66.2 Government transfer payments % 17.8 11.5 25.5 31.7 Other % 4.6 5.9 3 2.1Total income of population 15 years and over (20% samp 2885 1380 870 590 Without income 155 70 60 30 With income 2725 1310 805 560 Under $1,000 150 55 60 40 $ 1,000 - $ 2,999 255 80 80 95 $ 3,000 - $ 4,999 190 65 85 40 $ 5,000 - $ 6,999 185 65 60 60 $ 7,000 - $ 9,999 230 95 75 50 $10,000 - $11,999 190 75 70 45 $12,000 - $14,999 185 90 60 35 $15,000 - $19,999 260 125 80 55 $20,000 - $24,999 220 105 65 45 $25,000 - $29,999 180 90 50 35 $30,000 - $34,999 160 100 30 25 $35,000 - $39,999 110 60 35 15 $40,000 - $44,999 125 95 20 10 $45,000 - $49,999 65 45 15 0

$50,000 - $59,999 90 65 15 0 $60,000 and over 130 100 15 15 Average income $ 19906 25000 16021 13709 Median income $ 14453 20096 11136 9696 Standard error of average income $ 0 0 0 0Total income of males 15 years and over (20% sample d 1530 735 460 300 Without income 70 20 35 15 With income 1460 715 425 285 Under $1,000 80 30 25 25 $ 1,000 - $ 2,999 125 30 40 55 $ 3,000 - $ 4,999 100 20 50 25 $ 5,000 - $ 6,999 90 30 30 25 $ 7,000 - $ 9,999 100 45 30 20 $10,000 - $11,999 80 35 25 20 $12,000 - $14,999 80 30 30 15 $15,000 - $19,999 125 55 40 25 $20,000 - $24,999 110 45 35 25 $25,000 - $29,999 105 55 25 25 $30,000 - $34,999 100 65 20 15 $35,000 - $39,999 70 45 20 10 $40,000 - $44,999 70 60 10 0 $45,000 - $49,999 45 30 15 0 $50,000 - $59,999 65 50 15 0 $60,000 and over 105 95 10 10 Average income $ 22944 30412 17108 13289 Median income $ 17688 28736 11840 9008 Standard error of average income $ 0 0 0 0Total income of females 15 years and over (20% sample 1355 645 410 285 Without income 90 45 30 10 With income 1265 595 380 280 Under $1,000 75 25 30 15 $ 1,000 - $ 2,999 130 50 35 45 $ 3,000 - $ 4,999 90 40 35 15 $ 5,000 - $ 6,999 95 35 25 30 $ 7,000 - $ 9,999 130 50 45 30 $10,000 - $11,999 115 35 40 25 $12,000 - $14,999 110 55 30 20 $15,000 - $19,999 130 70 35 25 $20,000 - $24,999 110 60 30 20 $25,000 - $29,999 75 40 25 10 $30,000 - $34,999 60 35 15 15 $35,000 - $39,999 40 15 15 10 $40,000 - $44,999 55 35 10 10 $45,000 - $49,999 20 15 0 10 $50,000 - $59,999 25 20 0 0 $60,000 and over 20 10 0 10 Average income $ 16400 18457 14807 14143 Median income $ 12096 14608 10880 10080 Standard error of average income $ 0 0 0 0Census family income of all families (20% sample data) 1035 510 310 200 Under $10,000 85 20 40 25 $ 10,000 - $19,999 170 50 65 55 $ 20,000 - $29,999 155 55 65 35 $ 30,000 - $39,999 155 70 50 30

$ 40,000 - $49,999 130 80 25 25 $ 50,000 - $59,999 100 65 25 10 $ 60,000 - $69,999 75 45 15 10 $ 70,000 - $79,999 60 35 15 0 $ 80,000 - $89,999 50 40 0 0 $ 90,000 - $99,999 25 20 0 0 $100,000 and over 40 30 0 0 Average family income $ 41861 51333 34133 30545 Median family income $ 37120 47915 27680 26176 Standard error of average family income $ 0 0 0 0Census family income of husband-wife families (20% sa 885 465 250 155 Under $10,000 60 15 30 15 $ 10,000 - $19,999 120 40 40 35 $ 20,000 - $29,999 125 45 45 30 $ 30,000 - $39,999 135 70 40 25 $ 40,000 - $49,999 115 65 20 20 $ 50,000 - $59,999 95 65 20 10 $ 60,000 - $69,999 75 45 15 15 $ 70,000 - $79,999 55 30 15 0 $ 80,000 - $89,999 45 35 10 10 $ 90,000 - $99,999 20 20 0 0 $100,000 and over 40 30 10 0 Average family income $ 44815 53164 37143 33203 Median family income $ 40352 49728 32000 30016 Standard error of average family income $ 0 0 0 0All census families (20% sample data) 1035 510 315 200 Average family income $ 41861 51333 34133 30545 Standard error of average family income $ 0 0 0 0 Husband-wife families 880 465 250 150 Average family income $ 44815 53164 37143 33203 Standard error of average family income $ 0 0 0 0 Male lone-parent families 30 10 15 10 Average family income $ 26971 39008 21750 0 Standard error of average family income $ 0 0 0 0 Female lone-parent families 115 30 50 40 Average family income $ 24020 28709 21168 23396 Standard error of average family income $ 0 0 0 0Total income of non-family persons 15 years and over 535 240 155 125 Under $1,000 30 10 15 10 $ 1,000 - $ 2,999 30 10 0 20 $ 3,000 - $ 4,999 45 10 30 10 $ 5,000 - $ 6,999 40 10 10 15 $ 7,000 - $ 9,999 40 25 0 0 $10,000 - $11,999 50 15 15 20 $12,000 - $14,999 50 25 20 10 $15,000 - $19,999 60 30 15 10 $20,000 - $24,999 35 20 10 10 $25,000 - $29,999 35 20 10 10 $30,000 - $34,999 30 15 10 0 $35,000 - $39,999 15 10 0 0 $40,000 - $44,999 15 10 10 0 $45,000 - $49,999 10 0 10 0 $50,000 - $59,999 20 15 0 0 $60,000 and over 15 15 0 0

Average income $ 18494 23281 14837 12966 Median income $ 13195 15976 11664 10795 Standard error of average income $ 0 0 0 0Total income of male non-family persons 15 years and 325 150 95 70 Under $1,000 25 0 15 0 $ 1,000 - $ 2,999 25 10 10 20 $ 3,000 - $ 4,999 30 0 15 10 $ 5,000 - $ 6,999 30 10 10 15 $ 7,000 - $ 9,999 30 20 0 10 $10,000 - $11,999 25 10 10 0 $12,000 - $14,999 20 10 10 0 $15,000 - $19,999 25 10 10 0 $20,000 - $24,999 20 10 0 0 $25,000 - $29,999 25 10 10 0 $30,000 - $34,999 20 10 10 0 $35,000 - $39,999 10 10 0 10 $40,000 - $44,999 10 0 10 10 $45,000 - $49,999 0 10 0 0 $50,000 - $59,999 10 10 10 0 $60,000 and over 15 15 0 0 Average income $ 19136 25777 14204 10175 Median income $ 12160 19392 10800 5312 Standard error of average income $ 0 0 0 0Total income of female non-family persons 15 years an 205 90 60 55 Under $1,000 10 0 0 0 $ 1,000 - $ 2,999 10 0 0 0 $ 3,000 - $ 4,999 15 10 10 0 $ 5,000 - $ 6,999 10 10 0 0 $ 7,000 - $ 9,999 10 10 10 0 $10,000 - $11,999 25 10 10 10 $12,000 - $14,999 30 15 10 0 $15,000 - $19,999 35 20 10 10 $20,000 - $24,999 10 10 0 10 $25,000 - $29,999 10 10 0 0 $30,000 - $34,999 10 10 0 0 $35,000 - $39,999 10 10 0 0 $40,000 - $44,999 10 0 0 10 $45,000 - $49,999 10 0 0 0 $50,000 - $59,999 0 10 0 0 $60,000 and over 0 0 0 0 Average income $ 17484 19221 15807 16480 Median income $ 14091 15376 12224 12352 Standard error of average income $ 0 0 0 0Total - Economic families (20% sample data) 510 510 0 0 Low income 50 55 0 0 Other 455 455 0 0 Incidence of low income % 10.4 10.4 0 0Total - Unattached individuals (20% sample data) 210 215 0 0 Low income 65 65 0 0 Other 150 150 0 0 Incidence of low income % 29.9 29.9 0 0Total - Population in private households (20% sample da 1730 1730 0 0 Low income 210 210 0 0 Other 1520 1520 0 0

Incidence of low income % 12.1 12.1 0 0Household income of all private households (20% sampl 1330 685 360 255 Under $10,000 130 60 35 35 $ 10,000 - $19,999 235 95 80 60 $ 20,000 - $29,999 200 80 60 50 $ 30,000 - $39,999 195 90 55 40 $ 40,000 - $49,999 160 90 35 30 $ 50,000 - $59,999 130 75 35 15 $ 60,000 - $69,999 90 55 15 15 $ 70,000 - $79,999 60 35 20 10 $ 80,000 - $89,999 50 40 10 0 $ 90,000 - $99,999 25 25 10 0 $100,000 and over 55 40 10 0 Average household income $ 40140 46132 35957 30399 Median household income $ 35157 41856 29739 26560 Standard error of average household income $ 0 0 0 0Household income of one person households (20% samp 270 160 60 40 Under $10,000 65 40 15 15 $ 10,000 - $19,999 80 45 25 15 $ 20,000 - $29,999 40 25 10 10 $ 30,000 - $39,999 30 20 10 0 $ 40,000 - $49,999 25 15 10 0 $ 50,000 - $59,999 20 10 10 0 $ 60,000 - $69,999 0 0 0 0 $ 70,000 - $79,999 0 0 0 0 $ 80,000 - $89,999 0 0 0 0 $ 90,000 - $99,999 0 0 0 0 $100,000 and over 0 0 0 0 Average household income $ 23295 24845 20679 19096 Median household income $ 16832 18336 14240 15504 Standard error of average household income $ 0 0 0 0Household income of two or more person households ( 1055 530 300 210 Under $10,000 65 20 20 20 $ 10,000 - $19,999 160 50 60 45 $ 20,000 - $29,999 160 60 60 40 $ 30,000 - $39,999 165 70 45 40 $ 40,000 - $49,999 140 75 30 30 $ 50,000 - $59,999 110 70 35 15 $ 60,000 - $69,999 75 50 15 10 $ 70,000 - $79,999 55 35 15 10 $ 80,000 - $89,999 50 35 10 0 $ 90,000 - $99,999 25 20 0 0 $100,000 and over 55 40 10 0 Average household income $ 44427 52437 39074 32584 Median household income $ 39024 48299 32704 29760 Standard error of average household income $ 0 0 0 0Total number of economic families in private household 1030 510 300 210 Size of economic family, 2 persons 375 245 75 45 Size of economic family, 3 persons 225 105 70 45 Size of economic family, 4 persons 230 100 65 60 Size of economic family, 5 or more persons 205 55 90 60Total number of persons in economic families 3500 1515 1120 805Average number of persons per economic family 3.4 3 3.8 3.9Total number of unattached individuals 380 215 85 70

Total number of census families in private households 1035 510 310 200 Number of now-married and common-law couple famili 880 465 250 150 No member in the labour force 75 50 20 0 Some members in the labour force 810 415 235 145 One member only 210 100 65 35 Two or more members 600 315 165 110 Both spouses/partners in the labour force 570 305 155 100 Number of lone-parent families 150 45 60 50 No member in the labour force 30 0 15 10 Some members in the labour force 125 35 45 40 Parent in labour force 105 35 30 30Total number of occupied private dwellings (20% sample 1325 685 360 255Average number of rooms per dwelling 5.6 5.6 5.7 5.9Average number of bedrooms per dwelling 2.7 2.5 2.9 3.1Average value of dwelling $ 164730 164730 0 0Owned 775 450 135 180Rented 460 240 170 35Band housing 100 0 55 40Regular maintenance only 530 355 90 80Minor repairs 445 205 155 70Major repairs 350 125 115 100Period of construction, before 1946 100 90 0 10Period of construction, 1946-1960 115 100 10 0Period of construction, 1961-1970 165 105 35 25Period of construction, 1971-1980 335 185 80 65Period of construction, 1981-1990 400 130 170 85Period of construction, 1991-1996 215 80 70 70Total number of private households by household type 1325 685 360 255 One-family households 955 495 260 185 Multiple-family households 35 0 25 10 Non-family households 335 185 75 60Number of persons in private households (20% sample d 3880 1735 1205 870Average number of persons in private households 2.9 2.5 3.4 3.5Tenant one-family households without additional person 145 140 0 0Average gross rent $ 461 461 0 0Gross rent spending 30% or more of household income 50 45 0 0Owner one-family households without additional person 310 305 0 0Average owner’s major payments $ 445 445 0 0Owner’s major payments spending 30% or more of house 50 50 0 0

205518703925