ccelerat document distribution - nrc.gov · the response spectra curves indicate that the spectral...
TRANSCRIPT

'CCELERAT DOCUMENT DISTRI+U'I'ION SYSTEMREGULARLY INFORMATION DISTRIBUTIONYSTEM ( RIDS )
ACCESSIW NBR:9309210215 DOC.DATE: 93/09/10 NOTARIZED: NO DOCKETFACIL":STN-50-528 Palo Verde Nuclear Station, Unit 1, Arizona Publi 05000528
STN-50-529 Palo Verde Nuclear Station, Unit 2, Arizona Publi 05000529STN-50-530 Palo Verde Nuclear Station, Unit 3, Arizona Publi 05000530
AUTH.NAME AUTHOR AFFILIATIONCONWAYPW.F. Arizona Public Service Co. (formerly Arizona Nuclear Power R
RECIP.NAME RECIPIENT AFFILIATIONDocument Control Branch (Document Control Desk) I
SUBJECT: Provides responses to NRC questions re seismic qualificationof station batteries a supporting rack assemblies.
DISTRIBUTION CODE: A02SD COPIES RECEIVED:LTR ] ENCL j SIZE:TITLE: Seismic Qualification of Equipment in Operating Plants — A-46
D
NOTES:STANDARDIZED PLANTStandardized plant.Standardized plant.
/0500052805000529A05000530
RECIPIENTID CODE/NAME
OGC/HDS1PDV PDTRAN,L
INTERNAL: ACRSNRR/DE/ECGBNRR/DE/EMEBNRR/DRPE/PD1-3NRR/DSSA/SRXB
EXTERNAL: NRC PDR
COPIESLTTR ENCL
1 11 11 1
6 62 24 41 11 1
1 1
RECIPIENTID CODE/NAME
NRR/PD11-2TRAMMELL,CTRAN,T
NRR/DENRR/DE/EELBNRR/DRCH/HICBNRQQJ3SS SPLB—M 01
COPIESLTTR ENCL
1 11 11 1
1 11 11 11 11 1
D
NOTE TO ALL"RIDS" RECIPIEN'I'S:
I'LEASE IIELP US TO REDUCE DIVAS'I'II!CONTACT Tl IE I)OCIjMITN'I'ON'I'ROI.DI'%,ROOM Pl-37 (EXT. 504-20()S) TO ELIMIVATEYOUR NAME FROM 13!S'I'RI!3!"l'ION
LISTS FOR DOCUMENTS YOU DON'T NEED!
S,
TOTAL NUMBER OF COPIES REQUIRED: LTTR 26 ENCL 26

'1

WILLIAMF. CONWAYEXECUTIVEVICEPRESIOENT
NUCLEAR
Arizona Public Service CompanyP,O. BOX 53999 ~ PHOENIX, ARIZONA85072-3999
102-02640-WFC/TRB/SABSeptember 10, „1 993
U. S. Nuclear Regulatory CommissionATlN: Document Control DeskMail Station P1-37Washington, D.C. 20555
Dear Sirs:
Subject: Palo Verde Nuclear Generating Station (PVNGS)Units 1, 2, and 3Docket Nos. STN 50-528/529/530Responses to NRC Questions on SeismicQualification of Station BatteriesFile: 93-005-419.8
During a visit to PVNGS on May 12, 1993, Mr. Pei Y. Chen of the Nuclear RegulatoryCommission (NRC) raised some questions regarding seismic qualification of the stationbatteries and supporting rack assemblies. These questions were further discussedduring a telephone conference call on July15, 1993. Following the telephone call,Arizona Public Service Company (APS) determined that submitting written answers to thequestions would be the most expedient method for addressing the issues. As such, theenclosure to this letter provides the responses to the NRC's questions.
Should you have any questions, please contact Thomas R. Bradish at (602) 393-5421 ~
Sincerely,
WFC/TRB/SAB/bcfEnclosure
cc: B. H. FaulkenberryJ. A. SloanC. M. Trammell
9309210215 930910PDR ADOCN 05000528P..., PDR .I

S C
1

~ U. S. Nuclear Regulatory CommissionATIN: Document Control DeskResponse to NRC QuestionsPage 2
bcc: J. M. LevineE. C. SimpsonJ. A. BaileyR. J. StevensT. R. BradishS. J. GrierR. A. BernierW. E. IdeR. K. FloodR. J. AdneyR. W. PageE. G. FirthK. W. HamlinA. H. GuttermanSource Document
Library
(7602)(7616)(7605)(7603)(7636)(6933)(7636)(7194)(7294)(7394)(1 678)(6156)(151 0)
(7747)


ENCLOSURE
RESPONSE TO NRC QUESTIONS ON
AT&TROUND CELL BATTERIES
AND SUPPORTING RACK (STAND) ASSEMBLIES


'ntroduction
Qualification tests and analyses of the AT8T Lineage 2000 Round Cell Batteries andbattery stand were conducted to determine their ability to function under conditionssimulating those expected in a nuclear power generating station during operation, and-,during and following postulated earthquakes. The testing is documented in NationalTechnical Systems (NTS) Test Report Number 27218-91N, dated December 28, 1990.The qualification program included thermal aging and material testing of batteryspecimens and battery stand specimens, evaluation of vendor materials data as well asmaterials data available in public domain literature, and seismic qualification testing of thebatteries and battery stand assembly.
Responses to NRC Questions
1. Question:I
What constitutes the design basis. of the building response spectra at Palo Verde?
Response:
As delineated in PVNGS Updated Final Safety Analysis Report (UFSAR) Section3.7 "Seismic Design," the licensing basis of the safe shutdown earthquake (SSE)and operating basis earthquake (OBE) are 0.20 g=and 0.10 g, respectively. Foradditional conservatism, the design basis seismic analysis for seismic Category I
structures was performed utilizing a 0.25 g SSE and 0.13 g OBE.
2. Question:
Were test accelerometers installed on the battery?
Response:
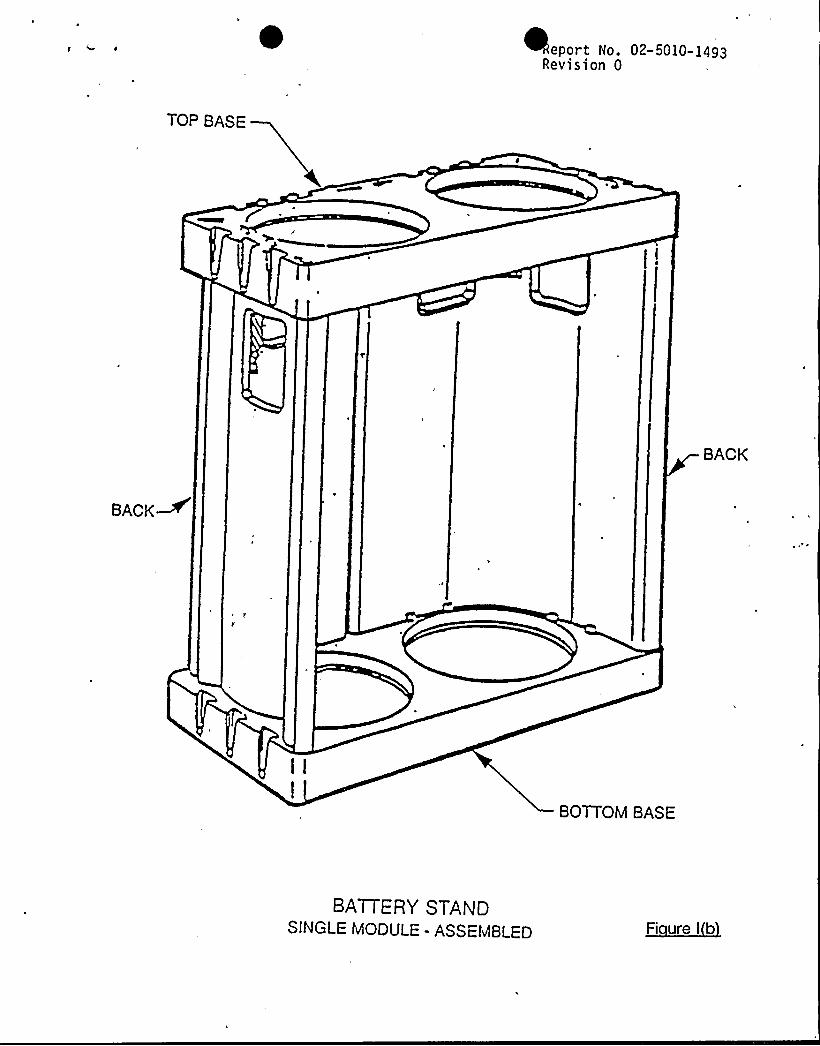
As stated in NTS Report Number 27218-91N, 'twenty-four (24) accelerometerswere used to monitor the battery stand. acceleration responses at differentlocations on the stand." These accelerometers were used to quantify theamplification factors at the resonance frequencies of the battery stand assembly.Accelerometers were not mounted on the battery cells themselves. Figures l(a)through l(f) illustrate the basic battery stand module and.battery stand assembly(ABB Impell Corp. Report No. 92-50150-1493 Rev 0).
Page 1 of 7

14
4

'. Question:I
The Test Response Spectra (TRS) does not envelop the Required ResponseSpectra (RRS) in all frequency ranges in the vertical direction. Why is thisacceptable, particularly in light of the repeated loosening and breaking of the(locking) wedges?
Response:
It is acceptable for the TRS to not envelop the RRS for the following reasons:
~ The battery qualiTication program contains conservative bases whichcompensate for the differences. As discussed in question number one (1),the SSE building response spectra is based on a conservative design basispeak ground acceleration of 0.25 g. The PVNGS committed licensing basisis 0.20 g as described in Section 2.5 of the UFSAR. This Section states:''Through use of attenuation curves, extrapolation of response spectra, andanalysis of intensity data, 0.20 g is considered to be a conservativerepresentation of the severity of vibratory ground motion for SSE." In
addition, design basis evaluations are traditionally performed with thelumped-mass method. The conservatism inherent in this method, asopposed to the finite element method, is briefly discussed below.
Study No. 13-CS-102 (by Bechtel Power Corporation) dated April 4, 1977,demonstrates the conservatism inherent in the original lumped-massanalysis as compared with a finite element soil-structure interaction seismicanalysis.
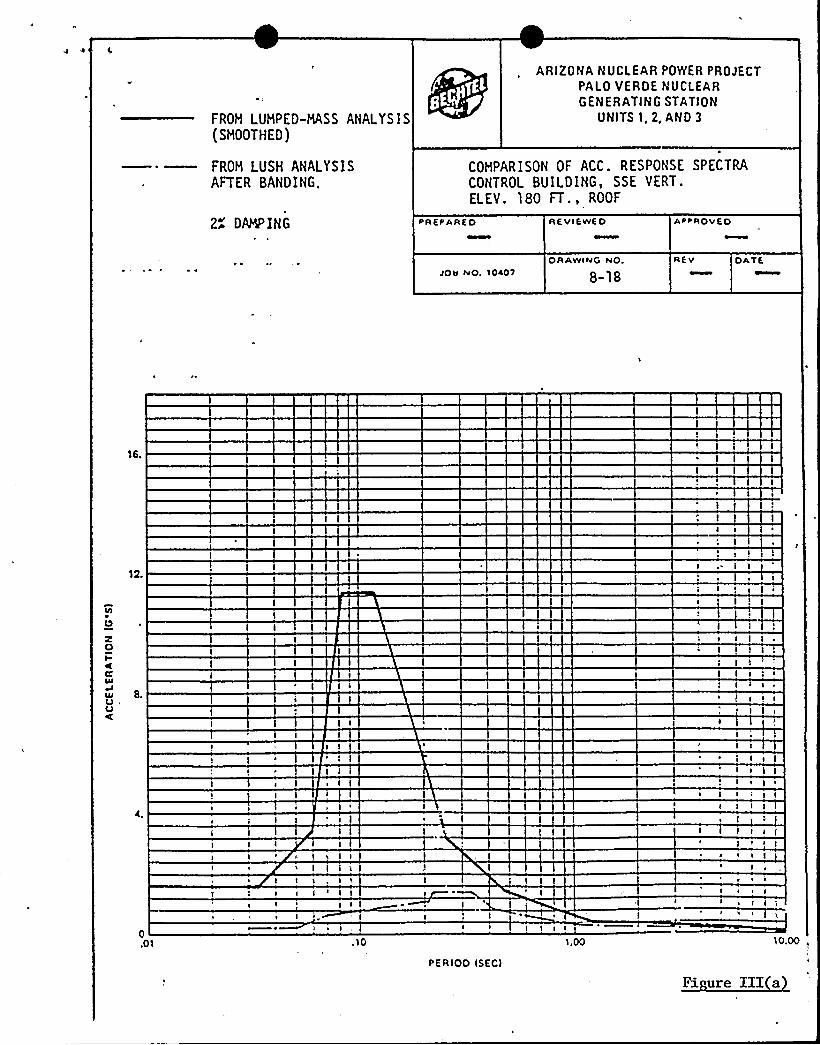
The objective of this study was to perform a finite element soil-structureinteraction seismic analysis in accordance with the commitment made inSection 3.7.2.5 of. the PVNGS Preliminary Safety Analysis Report (PSAR).The results of the finite element analysis were compared with the lumped-mass method. This comparison indicated that the results of the lumped-mass method were more conservative, and therefore, the lumped-massmethod was used for design as indicated in Section 3.7.1.6 of the PSAR.Figures lll(a) and (b) illustrate graphically the large margin in the existingdesign bases for the base mat (Elev. 74') and roof (Elev. 180') of theControl Building.
Page 2 of 7

7,
1
I'I
t

The response spectra curves indicate that the spectral accelerationsobtained from the lumped-mass analysis are significantly higher than thosefrom the finite element analysis. Structural design based on the lumped-mass analysis, therefore, is conservative since the floor (zero period)accelerations are invariably higher than the floor accelerations from the finiteelement analysis.
As indicated in the test report, the battery cells remained structurally intactduring seismic vibration. As such, the batteries did not come loose orbecome detached from their bases. Test plots were also reviewed toidentify if there were any rapid changes (i.e., sharp spikes) registered dueto shifting of the battery masses in the vertical direction. Such a shift wouldimpact the dynamic behavior of the battery rack during testing (i.e., causinga rapid change in frequency). It was verified that there was no suchindication, specifically within the band around 21 Hz which is the naturalfrequency in the vertical direction.
The tests had no effect on the electrical capability of the batteries. Basedon the number of tests performed (25 tests) and the number of wedgesattached to the batteries (16 wedges per rack), a total population of 400wedges were seismically tested. Table I illustrates the nature of eachwedge anomaly identified during the testing.
A total of 13 wedge anomalies were Identified in the population of 400wedges tested. These anomalies were categorized as loose wedges (4),broken wedges (6), or wedges which fell off (3). Statistically, the successrate for the wedge population is in excess of 96%. In addition, duringseismic tests where the anomalies occurred, there was no indication of thebatteries becoming loose or being thrown from their casing. The batterycurrent and voltage were continuously monitored during the tests and therewas no indication of electrical open circuits.
Page 3 of 7

I

N
TABLE I - SEISMIC TEST LOG
TEST ¹ TYPE/DESCRIPTION
OBE/Front-to-Back andVertical (F-B & V)
OBE/F-B & V
REMARKS
(50% Level) Wedge was loose, cell ¹1
Wedge tab broken; cell ¹12¹21
¹22¹23¹24
¹25
OBE/F-B & V
OBE/F-B & V
OBE/F-B & V
SSE/F-B & V
SSE/F-B & V
Wedge fell off; cell ¹'s 10, 12, 14
Wedge broken; cell ¹'s 16, 11
Wedge cannot be removed*; cell ¹16
Wedge became loose; ceil ¹'s 10, 14Wedge replaced*; cell ¹12Wedge broken (tip sheared off duringtest); cell ¹'s 13, 16
Wedge became loose; cell ¹14
SUMMARYOF WEDGEANOMALIES')
b)
c)
Wedges Loose: cell ¹'s 1, 10, 14 (twice)Wedges Broken (including tips sheared off): cell ¹'s 11, 13, 12(twice), 16 (twice)Wedge fell off: cell ¹'s 10, 12, 14
I
(¹ of seismic tests, 25) (¹ of wedges per test, 16) = 400 wedges seismically tested.
* Not considered an anomaly.**Assumed to be broken.
NOTE: A total of 27 tests were performed. Tests 1 and 2 were resonance searchand Test.3 was at 50% level.
Page 4 of 7

' The horizontal RRS (SSE) used in the test report was more severe than thePVNGS RRS (SSE) for the installed location (see Figure ll(b)). The severehorizontal acceleration could have created excessive displacement in the horizontaldirection of the rack structure which, in combination with vertical directionexcitation, resulted in some of the wedge anomalies. The contact surface area ofthe wedges is approximately at a 30 degree angle from horizontal. The wedge'nthis inclined position will be subjected to. additional vertical force as a result ofhorizontal acceleration. This would have contributed to the wedge anomalies.Since the horizontal dynamic loading at PVNGS is significantly less than the testcondition, the contribution to the vertical force will be smaller. Under theseconditions, the wedge anomalies would be expected to be much fewer, if notnonexistent.
The damping value of the battery rack assembly was assumed to be 2% forgeneric qualification testing as described in the NTS Test Report 2721 8-91 N. Thebattery assembly, however, is comprised of various components (e.g., glass, steelrods, etc.), and therefore, the damping value could conservatively be taken as 5%as recommended by The Institute of Electrical and Electronics Engineers, Inc.(IEEE) Standard 344-1 975 Sections 3.5.1.2 and 6.6.1.2.
~ In the test runs, the TRS enveloped the RRS in the range of the specimen's naturalfrequency, with a large margin (>10%) for all directions. As noted below, thisassures efficient energy absorption/transmission into the battery cells, stand andwedges.-
The test program included 25 (Test 1 and 2 were conducted to search forresonance frequencies) successful test runs of 30 seconds each. PVNGS UFSAR,Appendix 3E Table 3E-1 requires two (2).OBE, and one (1) SSE continuous teststo demonstrate qualification. The test runs included input in the vertical directionwhere the test OBE enveloped the PVNGS OBE requirements at the fundamentalfrequency acceleration. The vertical fundamental frequency of the rack structureoccurs at 21 Hz. This frequency represents the mode with the longest period.The modes with shorter periods (higher frequency) willbe experienced by the rackat higher frequencies. It is common practice to consider that most of the energyof vibration is absorbed by the rack through the first three to six modes ofvibration (reference: Seismic Design for the Civil Professional EngineerExamination, Third Edition, by M. R. Lindeburg, P.E.). As mode shapes of thestructure increase, the periods of the modes decrease rapidly from thefundamental (first mode). These modes will have much less contribution to theoverall system response. The tested acceleration of the rack in the verticaldirection is 1.7 g at the fundamental frequency of 21 Hz. This acceleration is 70%above the PVNGS requirement (see Figure ll(a)). No other resonant frequenciesin the vertical direction were identified during the resonance survey. Furthermore,as mode shapes increase, the structure response will converge to the higher
Page 5 of 7

l'
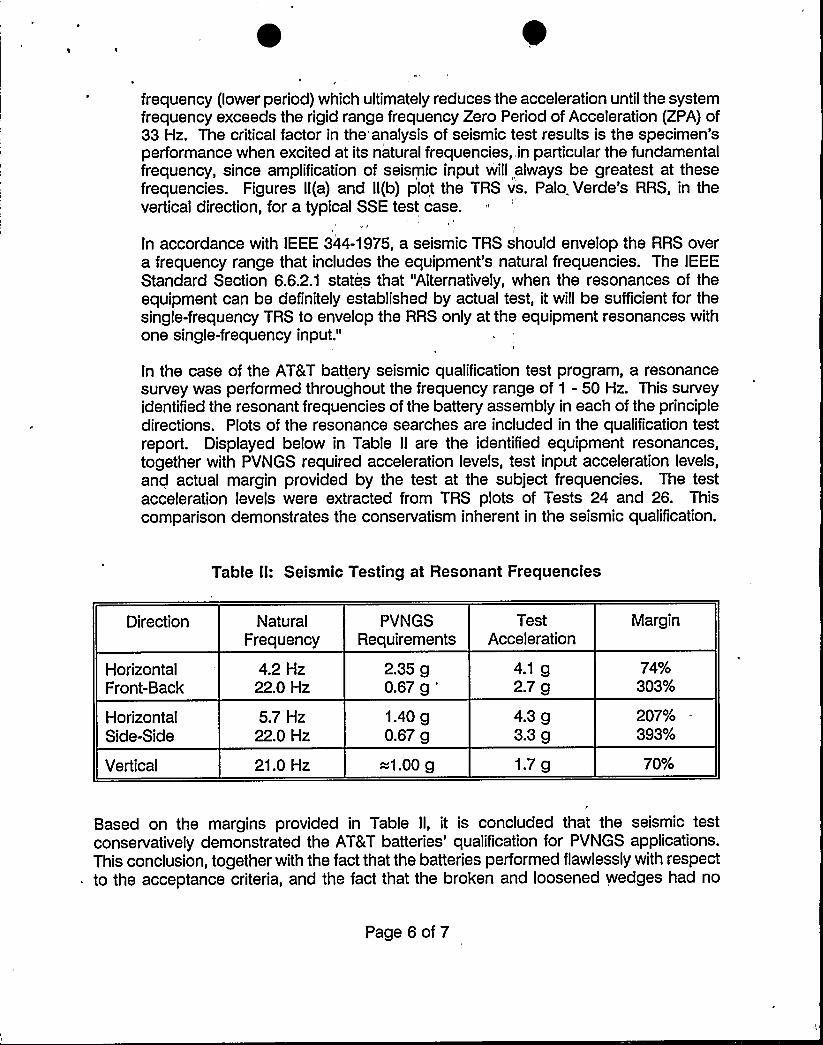
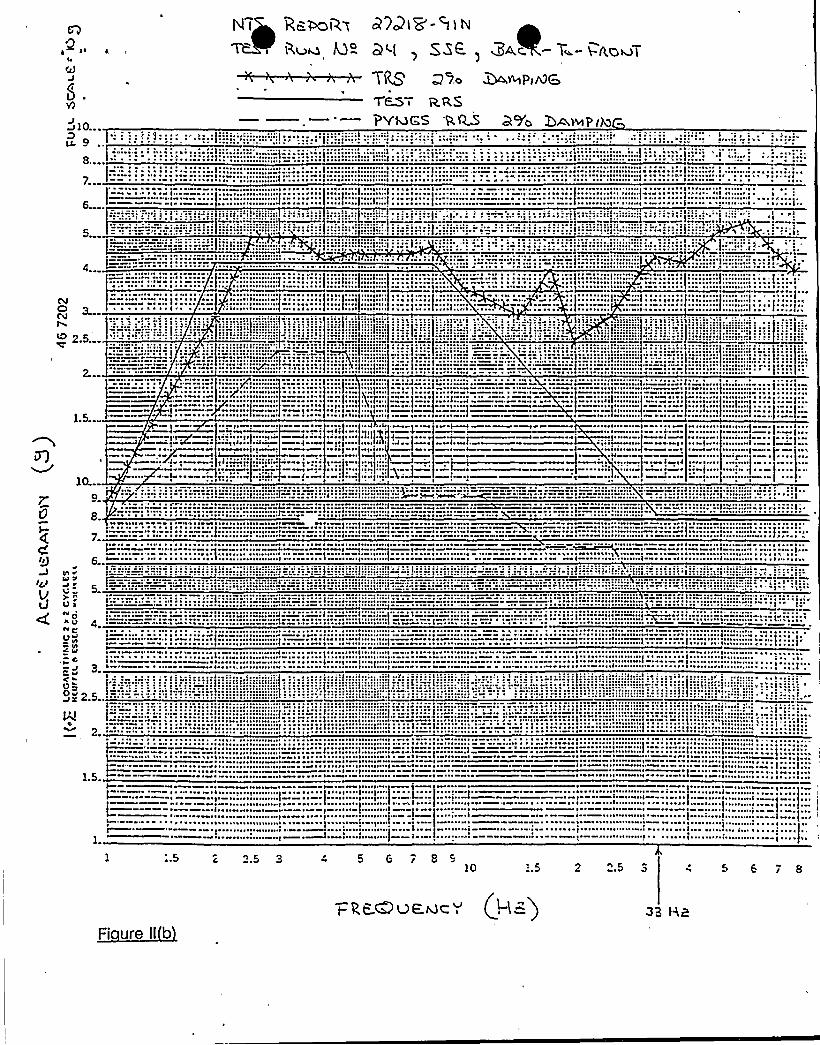
frequency (lower period) which ultimately reduces the acceleration until the systemfrequency exceeds the rigid range frequency Zero Period of Acceleration (ZPA) of33 Hz. The critical factor in the'analysis of seismic test results is the specimen'sperformance when excited at its natural frequencies, in particular the fundamentalfrequency, since amplification of seismic input will always be greatest at thesefrequencies. Figures ll(a) and ll(b) plot the TRS vs. Palo, Verde's RRS, in thevertical direction, for a typical SSE test case.
In accordance with IEEE 344-1975, a seismic TRS should envelop the RRS overa frequency range that includes the equipment's natural frequencies. The IEEEStandard Section 6.6.2.1 states that "Alternatively, when the resonances of theequipment can be definitely established by actual test, it will be sufficient for thesingle-frequency TRS to envelop the RRS only at the equipment resonances withone single-frequency input."
In the case of the AT&T battery seismic qualification test program, a resonancesurvey was performed throughout the frequency range of 1 - 50 Hz. This surveyidentified the resonant frequencies of the battery assembly in each of the principledirections. Plots of the resonance searches are included in the qualification testreport. Displayed below in Table II are the identified equipment resonances,together with PVNGS required acceleration levels, test input acceleration levels,and actual margin provided by the test at the subject frequencies. The testacceleration levels were extracted from TRS plots of Tests 24 and 26. Thiscomparison demonstrates the conservatism inherent in the seismic qualification.
Table II: Seismic Testing at Resonant Frequencies
Direction
HorizontalFront-Back
HorizontalSide-Side
Vertical
NaturalFrequency
4.2 Hz22.0 Hz
5.7 Hz22.0 Hz
21.0 Hz
PVNGSRequirements
2.35 g0.67 g
1.40 g0.67 g
=1.00 g
TestAcceleration
4.1 g2.7 g
4.3 g3.3 9
1.7 g
Margin
74%303
207%393%
70%
Based on the margins provided in Table II, it is concluded that the seismic testconservatively demonstrated the AT&T batteries'ualification for PVNGS applications.This conclusion, together with the fact that the batteries performed flawlessly with respectto the acceptance criteria, and the fact that the broken and loosened wedges had no
Page 6 of 7

0
f

detectable impact on the performance or structural integrity of the tested batteries,provides adequate assurance of the seismic qualification of the batteries.
4. Question:
'Provide justification for the differences between the tested and installedconfigurations.
Response:
In the case of the AT&Tbatteries, there is one significant difference between thetested and installed configurations. The tested battery assembly wasapproximately 5'ong; the installed assembly is approximately 10'ong. Thisdifference is due to the number of battery modules which are included in theassembly. The tested configuration is adequate for the qualification of the installedconfiguration, based on the following observations:
The fundamental frequency of the tested assembly was determined by aresonance search to be 4.2 Hz. This resonance occurs in the front-to-back(horizontal) direction. This is the most significant response mode. Theamplification factor at this frequency was recorded in the test report as 8:1.The second largest amplification factor identified was also in thefront-to-back direction, an amplification factor of 5:1 at 22 Hz. The mostsignificant dimensions for front-to-back motion are the battery assembly'sheight and depth. In these dimensions, the tested and installedconfigurations are identical, indicating similar dynamic behavior in thefront-to-back directions.
2. The-mass distribution of the two assemblies is the same. This alsoindicates a similar dynamic response.
I
3. The longer assembly length at PVNGS is considered to be stiffer inside-to-side direction by comparison to tested configuration (5 feetvs. 10 feet). As a result, the natural frequencies in the rack in this directionare expected to increase. The 8 Hz fundamental frequency estimate wasbased on this consideration and will result in more realistic inputacceleration requirements.
In addition, a large amount of, conservatism was present in the seismic testing, asshown above. This provides additional assurance that the tested configurationadequately qualifies the installed configuration.
Page 7 of 7

l
!'

FIGURES I (a), (b), (c), (d), (e), (f)
BALI'ERYSTAND MODULE ASSEMBLY

~ > g

port No. 02-5010-1493ision 0
~ BACK
I I
t
tt
lI
0Itltttttt
l
t
, ~ BASE
t
I
I~l
BATTERY STANDSINGLE MODULE - UNASSEMBLED
Ficiure I aj

l > I
eport No. 02-5010-1493Revision 0
TOP BASE
BACK
BACK~
Ilt
BOTTOM BASE
BATTERY STANDSINGLE MODULE - ASSEMBLED ~Fi ure i b

r

0 eport No. 02-5010 y493Revision 0
llWj ~
0'OVE-TAlL
KEY
FiciuFre I c

I ~ 1

eport Ho. 02-5010 ~4g3Revision 0
BACK PANELPROTRUSION
il I> ~~
~ll '(I
I I
LOCK
LOCK Fi ure I d

s

O~t No Oz 5010~~>S>On 0

a
I

epos t No. 02-5010-1493Revi's~on 0
BAR
UPPER SHELF
SECONDSHELF
HOLD DOWNRODS
BATTERYLOCK
BASE SHELF
EDGE
RETAINER
CORNER
RETAINER
BATTERY STANDASSEMBLED
~iciur~el

FIGURES II (a) and (b)
TRS (2% DAMPING), TEST RRS AND PVNGS RRS (2% DAMPING)

W
,I

NTs woe.—, zan!z-ace ~IESW Ru~ N ~ B~'j, SSE,, 'VE.AV1~!
Tt» t ttTBsT'R S————PV N G 5 Q.P.S 3.'1o ~~V I W&
I~
g 10I:i.ic".i.I':".'.".I-I ' .::".:I9.
.: ~ .'"~: ~ ~ ''.CC!C .I I'::::»: ~e.I...:..„...............:::::: II::.::.........:.........I........»I.....I....I;...3... II:.I;!
7..
5..
1'' ~ ! 1 1!
:I
I I':'':~
".'----~ -- ~ ~ ~ .MM~ -I
I
~
::::-::ICCCC I:-.I:I::::IM I »
lMCV
'
. IIII! !3
::i::3:::,::,I:',,:::,",,,",
~ ~ ~ ~ ~ ~
i': 3!I:ii"Iiiiliiii[:ii i'l " ''""""'3 II
I I i I I ! I i i J1 i u
::::::::3::::::::,i".:.::I::
:::::::::::::-:::.:3::::::::::::::.::::.:::-3
:Iii:iii.::Iii':~
»
~ .'I
ICCI
"I~ 1
I»
11111
~ ~
0 10..
JI - ~ ' "'I-"
~ 1
~ » ~
~ -"I--1
I
I .
HIcl
~ 1
I
~ 1
~ 1
~ t ~ ~
~ ~
~ '~ I ~ ~
'I'"
~ I ~ ~ 1
~ t
7.
6(JI g. r
J rV 5.
".I: .:l::: -.:C-:...::".:: - ........ ' ......:l:.". ".::::::::: .:.:".::!:::::::::::::CC.::-..;I
~ ' ''' " '' '1
C CC C:I.:.:
r'~"
J tr4
c J
. I..II.I~ I.III.I.I.I....l.
g 2.5..I
p' ', ~ ', ~ ~ ~ » ~ ~ ~ I» :::::::I::::cc:II: I:::::.I
'I 5 ~ ~ I ~ 1 ~ 1 ~ » 3 ' ~ ~ ~ ~ ~
~ ~ 1 ~ t ~ ~ ~ ~ ~ ~ t ~ ~ ~ ~ ~ '~ ~ ~ 1 ~ J
~ »
»
~ 1~ 1
~ »
11
1, 1 1
......j... ~ ..............,......3......... ~
~ »
:..5 '2, 2.5 3 4 5 o S 910 !.5 2 2.5 3 o 7
Fi ure II a33 ijc
~~ I ~
I~
rQ
>10...JD I)
8....
N I Rc.MA.H 87213'- i 'I N
3<I Q5E. Qu ~
TRS 27~ ~mp) ua7&51 Q.Q,Q
PYk)C,S 'Q.~ 39o 5A,mP (Jo
6. I
5
IIIII'll;IIIIIII,:; i:i i .".::::I::::I I
~ ~ ~I
-:.!iiil::i::iiiii::I
~ ~ ~ I ~ ~ ~ ~
2...
~ ~
r~™.=--gg
~ ~
~ ~ ~ I
~
/
~ ~ ~~ ~ ~ ~ ~
~ ~
~ ~ ~
I~ I; ~
, ~I i I r
~ ~t I )
10..
r 9
It
~ ~ ~ ~ ~ ~ ~ ~ ~
I""i~-
V-"6.
Ilt vI~ Itt P~l
5VV 5~t 0
C Id
Vg I
g I
0 ~ ),.':,:"':: ..':. ".'.:,:I: .'.I::::::.''): '::: ",:,',::::,':::::::::."',',,'::,',::
1.5.
I
1
~ t ~ t~ ~
t) ~
I~ I
~ ~ ~ ~
2.5 310 .:.5 2 2.5 5 4 5 6 7 8
y p t= ~ u E.w)= Y H— 33 HB
Fi ure II b

~ ~ ~

FIGURES III (a) and (b)
CONTROL BUILDING
BASE MATAND ROOF ELEVATION
SSE RESPONSE

FROM LUMPED-MASS ANALYSIS(SMOOTHED)
FROH LUSH ANALYSISAFTER BANDING.
ARIZONA NUCLEAR POWER PROJECTPALO VERDE NUCLEARGENERATING STATION
UNITS 1, 2, AND 3
COHPARISON OF ACC. RESPONSE SPECTRA
CONTROL BUILDING, SSE VERT.ELEV. 180 FT., ROOF
2» DAMPING I' E P A R E D REVIEWED A»PROVED
JOII NO. !0407DRAwING ~O
8-18REv DATE
~ I
I . I I
I I II ~
I
I I I
I I ' ! ~ I I
I I I, I 1
I I ' Is I
~ ~ I I
.10
i'E11100 (SEC)
I I I
I I I
I~ I
I I
~ ~
I I s
~ I I I
10.00 !
Fi ure IXI a

~ ~
FROM LUMPED-MASS ANALYSIS(SemHED)
ARIZONA NUCLEAR POWER PROJECTPALO VERDE NUCLEARGENERATING STATION
UNITS 1, 2, AND 3
FROM LUSH ANALYSISAFTER BANDING
2" DAMPING PREPARED! R E V I E WE 0 I APPROVED:
COMPARISON OF ACC. RESPONSE SPECTRACONTROL BUILDING, SSE VERT.ELEV. 74 FT., BASE MAT
JOB NO. 10407DRAWING NO.:
8-16REV, DATE.
2.4
2.2
2.0
1.8
~ ! I I~ }
e c
e I I I
c e
I I I e'.'iI I I i ~
~ I ~
1.6
1.4
?0I
K
IJ1.0
e
j e
I I I
I e
I I
I c
c c e
! I Ic ~ I c I
e
I
I I I
I I I
I c I ~ I I
I I e I e
~ I I e I iI I I I I I I
I I I e I
I I ~ ~
I I I I I II I
c I
II: ". I
I I ~ ~
I I e I I ~
I Ie
I I c
I ! I I I I ~
I e e ee Ie
I
II I I
I I I
I I i I
Ie I e I I
I e I
I I Ie I I I I
I I I I I
~ I
I I I I ! I ~
c e I I i c I
I I iI I ~ I I c
I I c I
I ~ I I g I ~ I
i I ' I I I
I
~ I I I ! I I I
I I 'I ~ „c
0'
I I e: ~ c I
I
~ ~ ~ I I I
e I ! I I I\ !
I ~ I c I I
I ' I I
,10
c I I
~ I ~ I Ii I, I I I, I
I I I~ I I
c ~ c II, ~ I I
PERIOD!SEC!
1.00
c c I ~
c
I
c e
I I
e
10.00
Fi ure IIX b

0 ~ C
il