ccafs regional agricultural forecasting toolbox (craft)
Upload: ccafs-cgiar-program-climate-change-agriculture-and-food-security
Post on 14-Jul-2015
2.147 views
TRANSCRIPT

1
The CCAFS Regional Agricultural Forecasting Toolbox (CRAFT)
James Hansen, Theme 2 Leader
International Research Institute for Climate and Society
Herramientas para la Adaptación y Mitigación del Cambio Climático en la Agricultura en Centroamérica
Panamá, 6-8 de Agosto 2013
Date

2
What is CRAFT?
• Software platform to support within-season forecasting of crop production; secondarily, risk analysis and climate change impacts
• Functions:
• Manage spatial data, crop simulation (currently DSSAT)
• Integrate seasonal forecasts (CPT)
• Spatial aggregation
• Probabilistic analysis
• Post-simulation calibration
• Visualization
• Analyses: risk, forecast, hindcasts, climate change
• Current version preliminary

3
What is CCAFS?
• Strategic partnership of international agriculture (CGIAR) and global change (Future Earth) research communities

4
What is CCAFS?
• Strategic partnership of international agriculture (CGIAR) and global change (Future Earth) research communities
• World’s largest research program addressing the challenge of climate change and food security
Mechanism for organizing, funding climate-related work across CGIAR
Involves all 15 CGIAR Centers
$67M per year

5
What is CCAFS?
• Strategic partnership of international agriculture (CGIAR) and global change (Future Earth) research communities
• World’s largest research program addressing the challenge of climate change and food security
• 5 target regions across the developing world

6
What is CCAFS?
• Strategic partnership of international agriculture (CGIAR) and global change (Future Earth) research communities
• World’s largest research program addressing the challenge of climate change and food security
• 5 target regions across the developing world
• Organized around 4 Themes:
• Adaptation to progressive change
• Adaptation through managing climate risk
• Pro-poor climate change mitigation
• Integration for decision-making
7
Ris
k
an
aly
sis
Inp
ut
su
pp
ly
man
ag
em
en
t
Farm
er
ad
vis
ori
es
Food security early warning,
planning
Trade planning, strategic imports
Insu
ran
ce
evalu
ati
on
, p
ayo
ut
Insu
ran
ce
desig
n Time of year
Un
cert
ain
ty (
e.g
., R
MS
EP
)
se
as
on
al
fore
ca
st
pla
nti
ng
mark
eti
ng
harv
est
an
thesis
growing season
EV
EN
T
AP
PL
IC
AT
IO
N
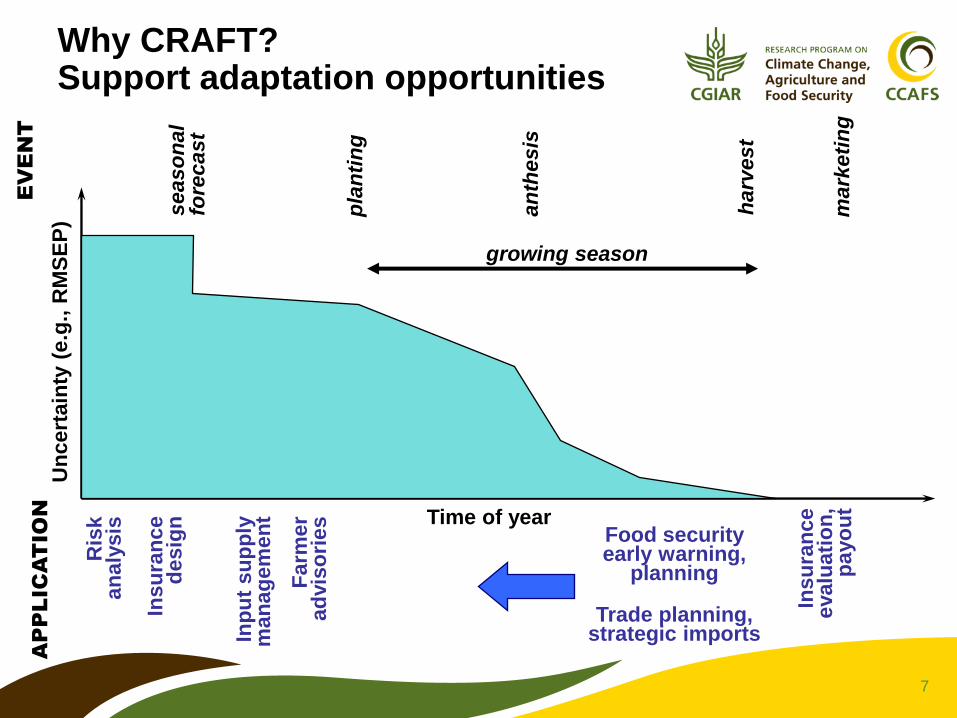
Why CRAFT? Support adaptation opportunities

8
Why CRAFT? Meets an unmet need
• Platform to facilitate research, testing and implementation of crop forecasting methods
• Target researchers and operational institutions in the developing world
• Accessible: free, open-source (eventually)
• Adaptable: support multiple crop model families

9
Basics of yield forecasting: Uncertainty
• Consider yields simulated with monitored weather thru current date, then sampled historic weather
• Uncertainty diminishes as season progresses
• Model error the non-climatic component
• Relative contribution of climate, model uncertainty changes through the season
forecast date harvest
season onset
Time of growing season
1 2
. . .
n
T Weath
er
data
year
monitored weather
historic weather
0.5
1.0
1.5
2.0
Gra
in y
ield
, Mg/
ha
1May 1Jun 1Jul 1Aug Harvest
Forecast Date
90th
75th
50th
25th
10th
1989 climatology-based Qld. Australia wheat forecast. Observed, and forecast percentiles. Hansen et al., 2004. Agric. For. Meteorol. 127:77-92
Un
ce
rta
inty
planting anthesis harvestTime
model uncertainty
climate uncertainty
SIM
UL
AT
ION
◄——— PREDICTION ———
Hansen, J.W., Challinor, A., Ines, A.V.M, Wheeler, T., Moron, V., 2006. Climate Research 33:27-41.

10
Basics of yield forecasting: Reducing uncertainty
Unc
erta
inty
planting anthesis harvestTime
model uncertainty
climate uncertainty
Unc
erta
inty
planting anthesis harvestTime
2b. N-limited
3. Actual
1. Potential
pests, disease,micronutrients,toxicities
H, T, crop charac-teristics
water2a. Water-limited
??????
soil N dynamics,plant N use,stress response
photosynthesis,respiration,phenology
water balance,transpiration,stress response
Level of production Processes
nitrogen
after Rabbinge, 1993
• Reduce model error:
• Improve model
• Improve inputs
• Assimilate monitored state
• Greatest benefit late in season
• Reduce climate uncertainty
• Incorporate seasonal forecasts for remainder of season
• Greatest benefit early in season
Unc
erta
inty
planting anthesis harvestTime
model uncertainty
climate uncertainty
Unc
erta
inty
planting anthesis harvestTime

11
Incorporating seasonal forecasts: Queensland wheat study (2004)
• WSI-type crop model
• PC1 of GCM (ECHAM4.5) rainfall, persisted SSTs
• Yields by cross-validated linear regression with normalizing transformation
• Probabilistic, updated
• Demonstrated yields more predictable than rainfall
• One of several potential methods tested
2 0 0 0 2 0 0 4 0 0 k m
C o r r e l a t i o n < 0 . 3 4 ( n . s . ) 0 . 3 4 - 0 . 4 5 0 . 4 5 - 0 . 5 0
0 . 5 0 - 0 . 5 5 0 . 5 5 - 0 . 6 0
0 . 6 0 - 0 . 6 5
> 0 . 6 5
Rain
Yield
Hansen, Pogieter, Tippett, 2004. Agric. For. Meteorol. 127:77-92
N
200 0 200 400 km
1 July
1 June
1 August
1 MayCorrelation
<0.34 (n.s.)
0.34-0.45
0.45-0.55
0.55-0.65
0.65-0.750.75-0.85
> 0.85
0.5
1.0
1.5
2.0
Gra
in y
ield
, M
g/h
a
1May 1Jun 1Jul 1Aug Harvest
Forecast Date
0.5
1.0
1.5
2.0
1May 1Jun 1Jul 1Aug Harvest
Forecast Date
1982 Queensland, Australia wheat yield forecast.
climatology only + GCM forecast
Forecast date
Gra
in y
ield
(M
g h
a-1
)

12
Linking crop simulation models and seasonal climate forecasts statistically
fore
ca
st
da
te
ha
rve
st
mo
de
l in
itia
liza
tio
n
fitt
ed
sta
tisti
cal
mo
del
yn,1
yn,2
yn,3
.
.
.
yn,n-1
Time of year
1
2
. . .
n
}
Weath
er
data
year
ˆky

13
Versions:
• Windows 95+
• Linux batch
• Windows batch (for CRAFT)
Incorporating seasonal forecasts: CPT
Climate Predictability Tool (CPT) is an easy-to-use software package for making tailored seasonal climate forecasts.

14
Why CPT?
Address problems that arose in RCOFs:
• Slow production made pre-forum workshops expensive and prohibited monthly updates
• Multiplicity, colinearity, artificial skill, lack of rigorous evaluation made forecasts questionable
• Little use of GCM predictions
(http://www.wmo.int/pages/prog/wcp/wcasp/clips/outlooks/climate_forecasts.html)

15
What CPT does
• Statistical forecasting
• Statistical downscaling
coarse resolution
fine resolution
statistical model
dynamical model

16
What CPT does
• Statistical forecasting
• Statistical downscaling
• Designed to use gridded data (GCM output and SSTs) as predictors
• Uses principal components (PCs, or EOFs) as predictors
• Rigorous cross-validation to avoid artificial skill
• Diagnostics and evaluation
• New multi-model support

17
CPT: Principal Components (PCs)
• Explain maximum amounts of variance within data
• Capture important patterns of variability over large areas
• Uncorrelated, which reduces regression parameter errors
• Few PCs need be retained, reducing dangers of “fishing”
• Corrects spatial biases
First PC of Oct-Dec 1950 -1999 sea-surface temperatures

18
CPT: Canonical Correlation Analysis (CCA)
July (top) and December (bottom) tropical Pacific sea-surface temperature anomaly, 1950-1999
December
July

19
CPT: Which method?
Predictor Predictand (simulated yield)
Method
Point-wise Point-wise Multiple regression
Spatial pattern Point-wise Principal component regression
Spatial pattern Spatial pattern Canonical correlation analysis
20
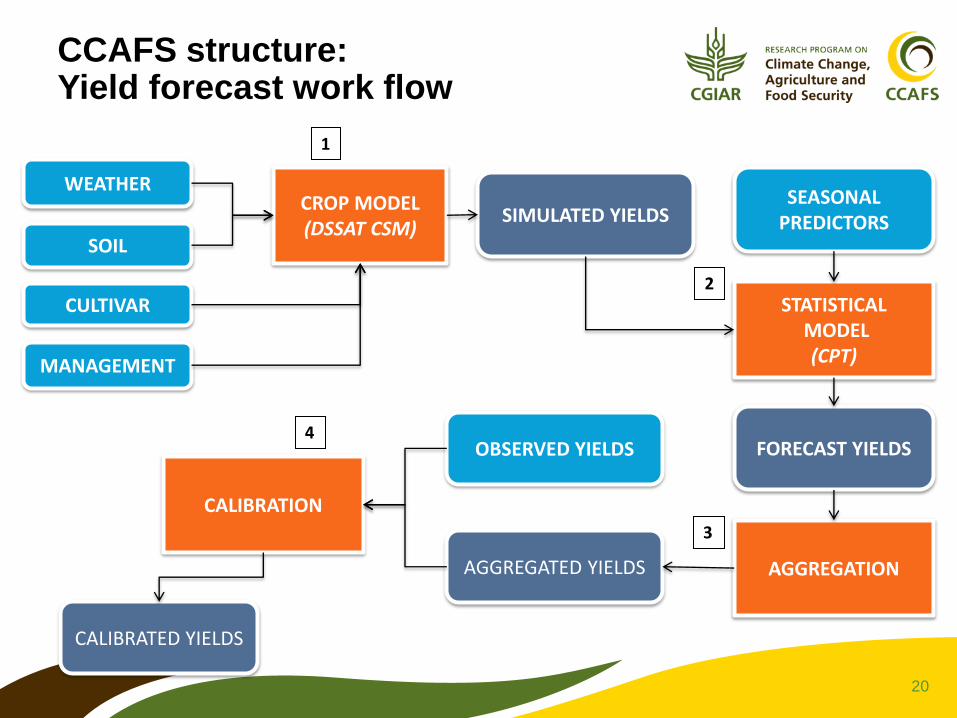
CCAFS structure: Yield forecast work flow
WEATHER
SOIL
CULTIVAR
MANAGEMENT
CROP MODEL (DSSAT CSM)
SIMULATED YIELDS
STATISTICAL MODEL
(CPT)
SEASONAL PREDICTORS
FORECAST YIELDS
AGGREGATION
CALIBRATION
CALIBRATED YIELDS
AGGREGATED YIELDS
OBSERVED YIELDS
3
4
1
2

21
CROP SIMULATOR
IMPORT
PROCESS MANAGER
U
S
E
R
I
N
T
E
R
F
A
C
E
CROP MODEL MANAGER
CCAFS Modules
EXTERNAL ENGINES
INPUT/OUTPUT FILES
CENTRAL RDBMS
EXPORT
AGGREGATOR
CPT TOOL
SEASONAL FORECAST MANAGER
MS Windows MS .NET MySQL DB
CRAFT Architecture

22
Steps: yield forecast run
• Step 1 – Prepare/Review Data Sets
• Step 2 – Create Project & Run
• Step 3 – Link Data Sources
• Step 4 – Enter Crop Management Data
• Step 5 – Setup & Execute Crop Model Run
• Step 6 – View Crop Model Run Results
• Step 7 – Seasonal Forecast Run
• Step 8 – View Forecast Yield Results

23
Home Page
• Main Menu
• Connect
application to
desired database,
and test
• Lists 5 most recent
projects
• Project Name link
will direct the user
to the current state
of the workflow
24
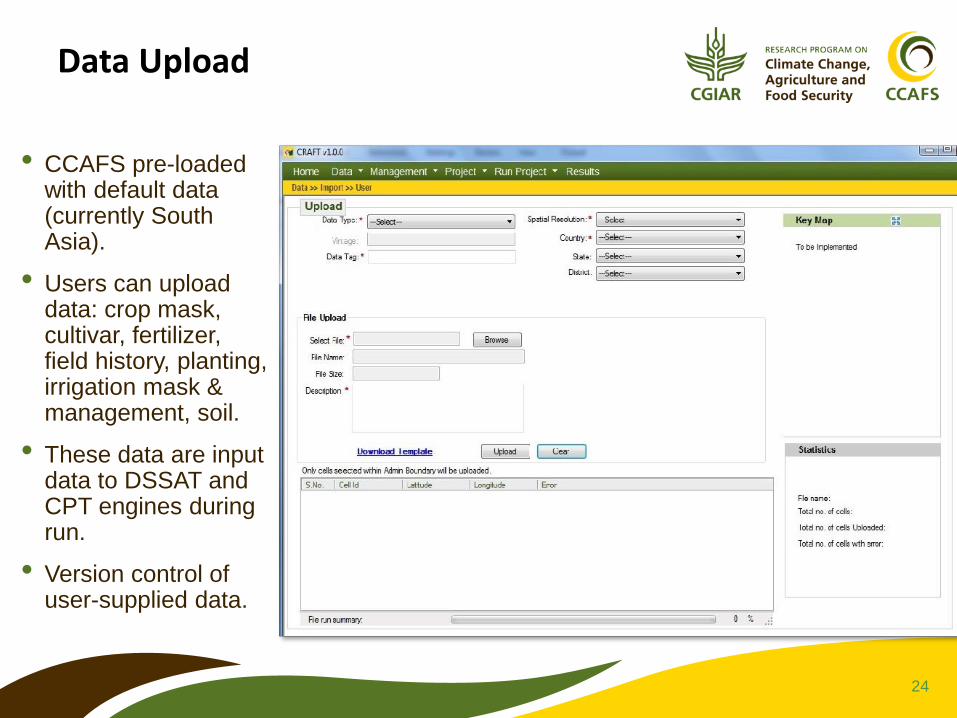
Data Upload
• CCAFS pre-loaded with default data (currently South Asia).
• Users can upload data: crop mask, cultivar, fertilizer, field history, planting, irrigation mask & management, soil.
• These data are input data to DSSAT and CPT engines during run.
• Version control of user-supplied data.
25
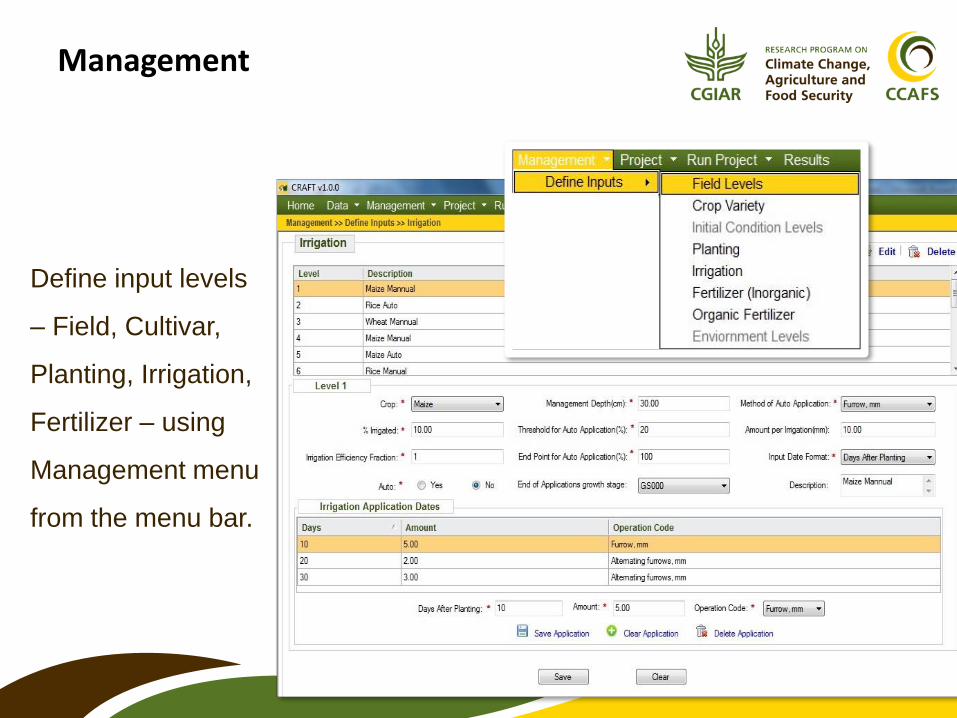
Management
Define input levels
– Field, Cultivar,
Planting, Irrigation,
Fertilizer – using
Management menu
from the menu bar.

26
Project
• Search or select
existing project,
or create new
project
• Navigate to data
source form for
active run of
active project

27
Data Sources
• Customize run
by selecting
uploaded or
default data
sources
• Drop-down lists
of previously
uploaded data
• This screen is
not shown if
Default is
selected when
creating Project
and Run.

28
Apply Inputs
• Tabbed details of available Levels, and a grid to show the applied levels for specified ‘Type of Data’
• Green = input applied,
• Pink = input not applied
• Mandatory fields must be applied

29
Run Project
• Executes current active project with configured data sources and applied inputs
• On successful execution, prompts to save run results, view result maps
• 2 steps:
• Crop simulation
• Seasonal forecast
30
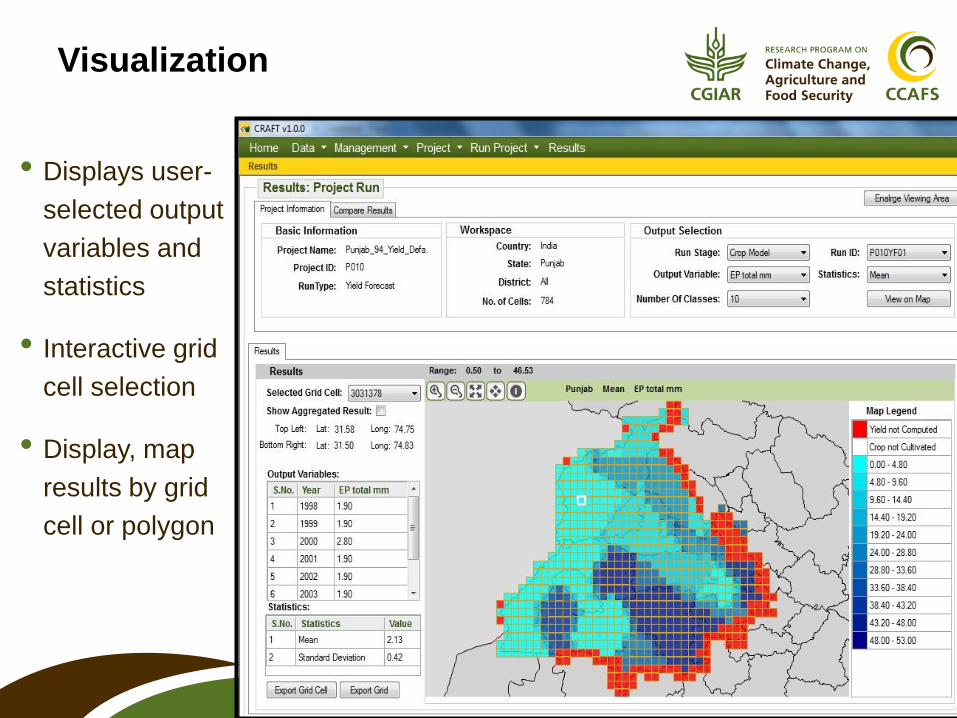
Visualization
• Displays user-
selected output
variables and
statistics
• Interactive grid
cell selection
• Display, map
results by grid
cell or polygon
31
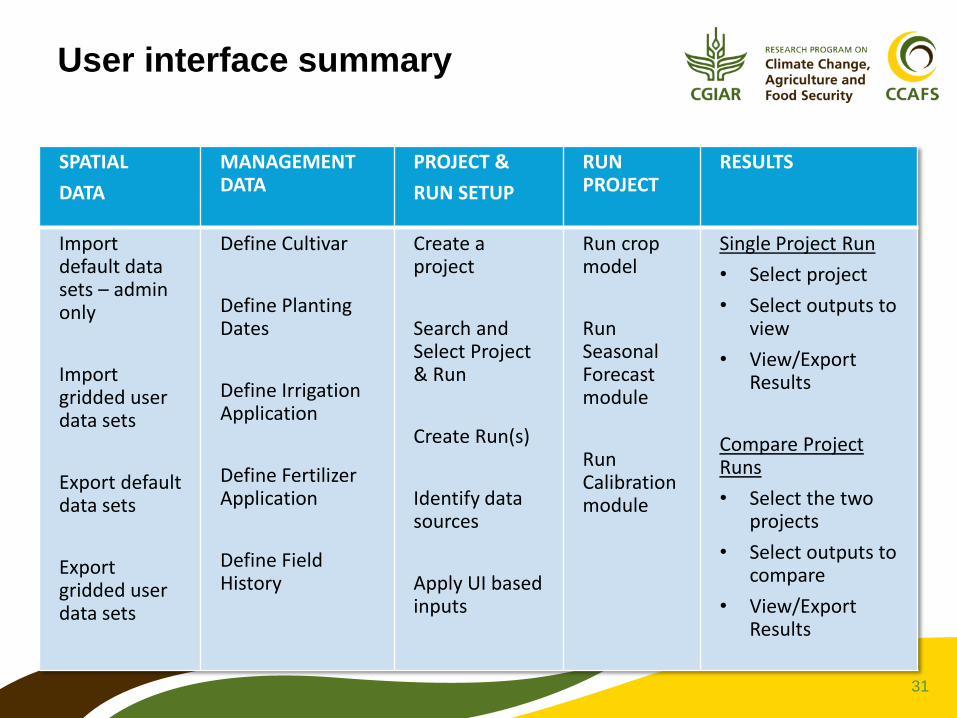
User interface summary
SPATIAL
DATA
MANAGEMENT DATA
PROJECT &
RUN SETUP
RUN PROJECT
RESULTS
Import default data sets – admin only
Import gridded user data sets
Export default data sets
Export gridded user data sets
Define Cultivar
Define Planting Dates
Define Irrigation Application
Define Fertilizer Application
Define Field History
Create a project
Search and Select Project & Run
Create Run(s)
Identify data sources
Apply UI based inputs
Run crop model
Run Seasonal Forecast module
Run Calibration module
Single Project Run
• Select project
• Select outputs to view
• View/Export Results
Compare Project Runs
• Select the two projects
• Select outputs to compare
• View/Export Results

32
Major planned enhancements
• Generalize locations, grid schemes, user inputs
• Crop model interoparability (AgMIP)
• Additional crop models:
• APSIM
• AquaCrop
• ORYZA2000
• SARA-H
• InfoCrop
• …
• Hindcast analysis and validation statistics
• De-trending and post-simulation calibration