cc-124 growth kinetics (light intensity results) bojan tamburic 20/10/2009
Post on 20-Dec-2015
212 views
TRANSCRIPT

CC-124 Growth Kinetics (Light Intensity Results)
Bojan Tamburic
20/10/2009
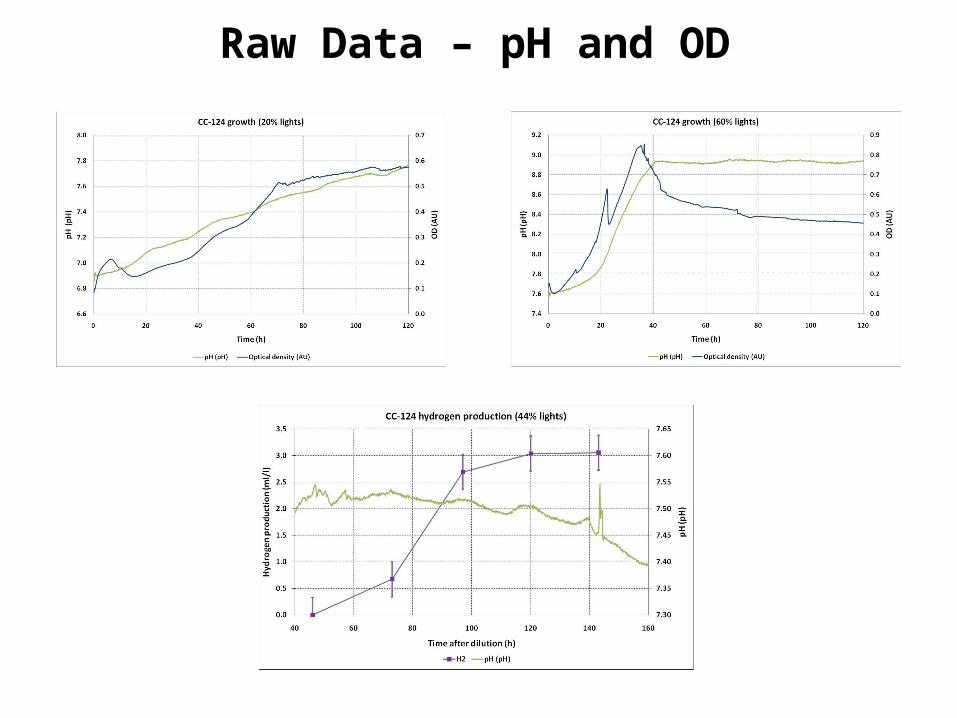
Raw Data – pH and OD
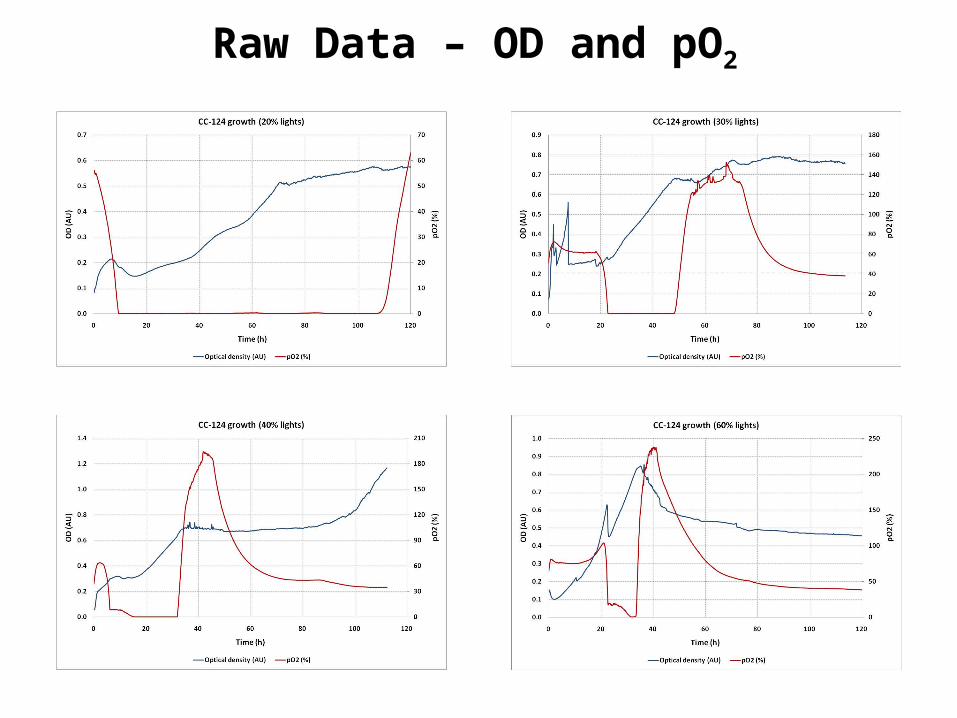
Raw Data – OD and pO2
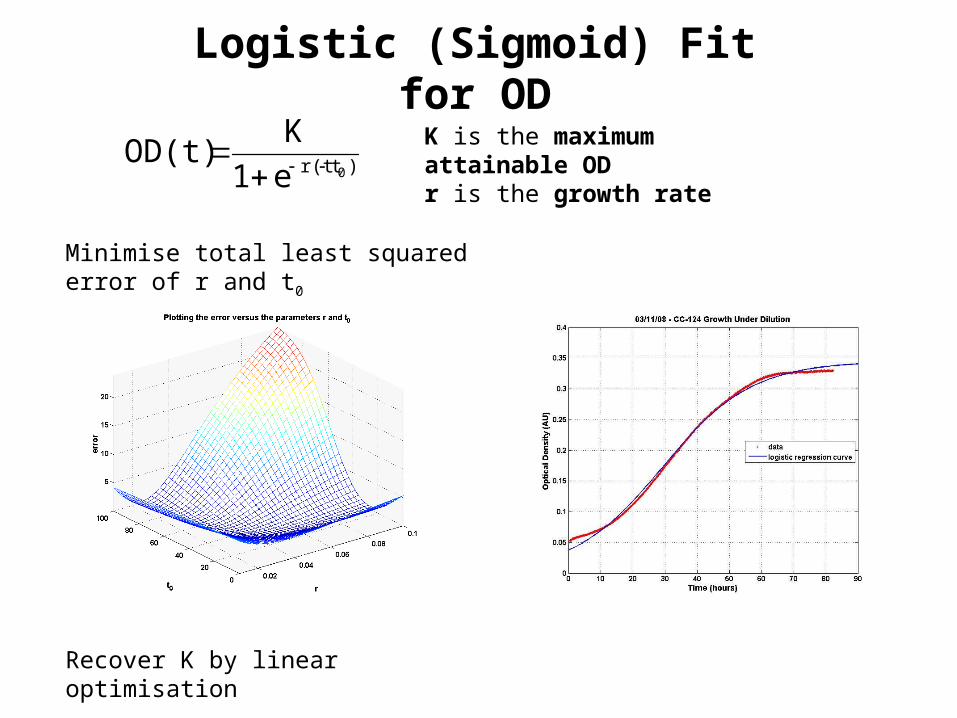
Logistic (Sigmoid) Fit for OD
)tr(t 0e1
KOD(t)
K is the maximum attainable ODr is the growth rate
Minimise total least squared error of r and t0
Recover K by linear optimisation
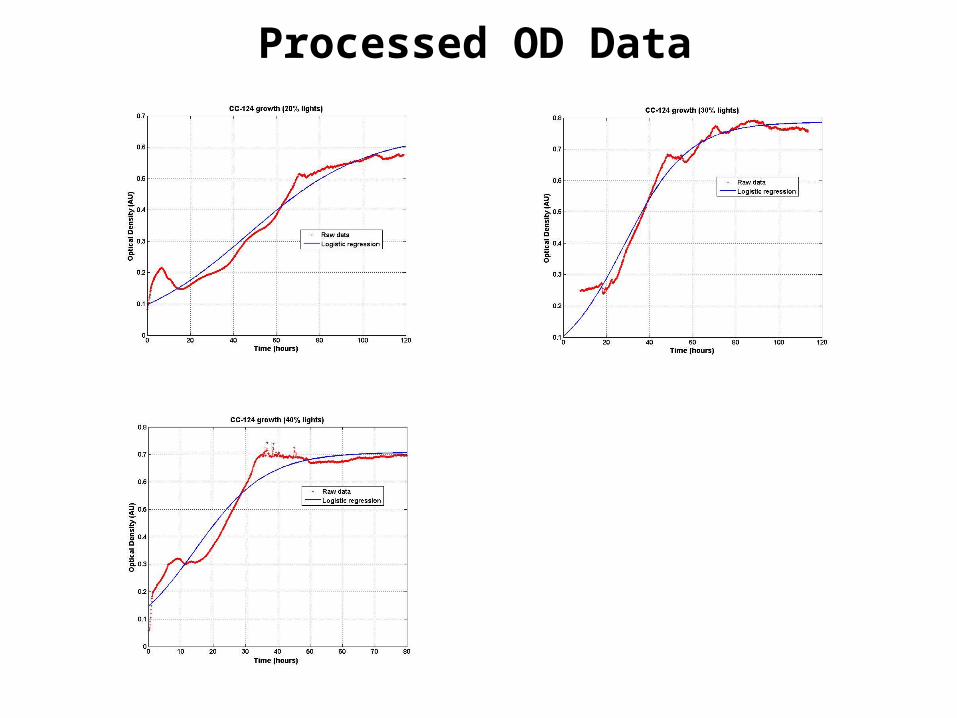
Processed OD Data

Update on Technico-Economic Modelling
Phil Grünewald

Solar Hydrogen
The Value of Saving Sunshine for a Rainy Day
PHIL GRÜNEWALD

Does PEC make economic
sense ?
SUN HYDROGEN ECONOMICS
1. How to model a PEC device?2. Which parameters matter?3. What configuration is best?4. How does PEC compare to alternatives?
OBJECTIVES
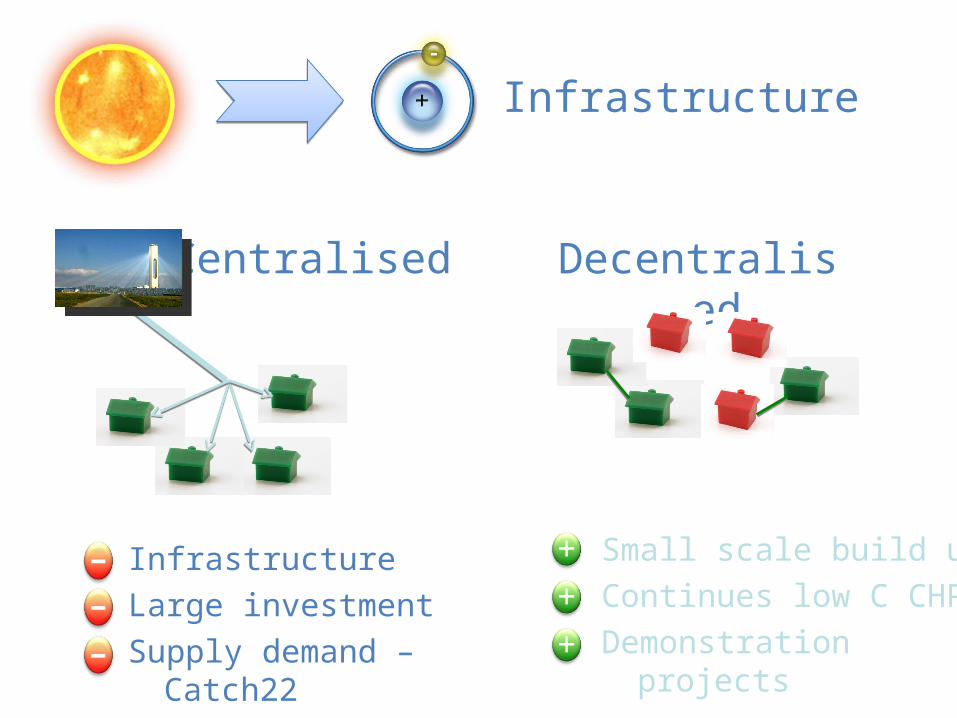
Centralised Decentralised
InfrastructureLarge investmentSupply demand – Catch22
Small scale build upContinues low C CHPDemonstration projects
- +++
--
Infrastructure
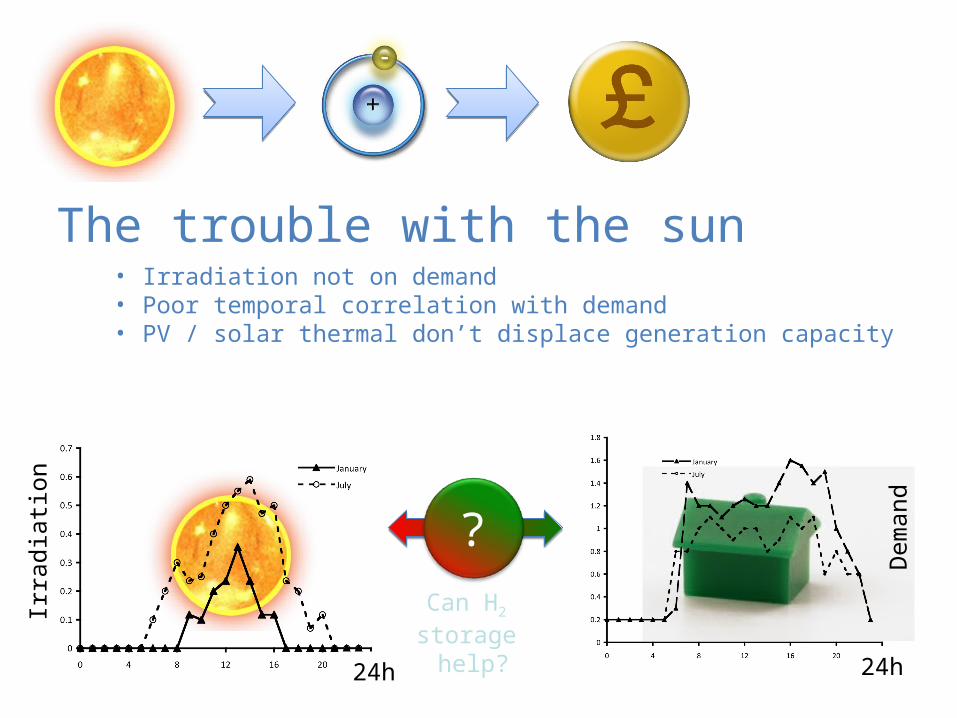
The trouble with the sun• Irradiation not on demand• Poor temporal correlation with demand• PV / solar thermal don’t displace generation capacity
???Can H2 storage
help?
Irrad
iatio
n
Dem
and
24h 24h
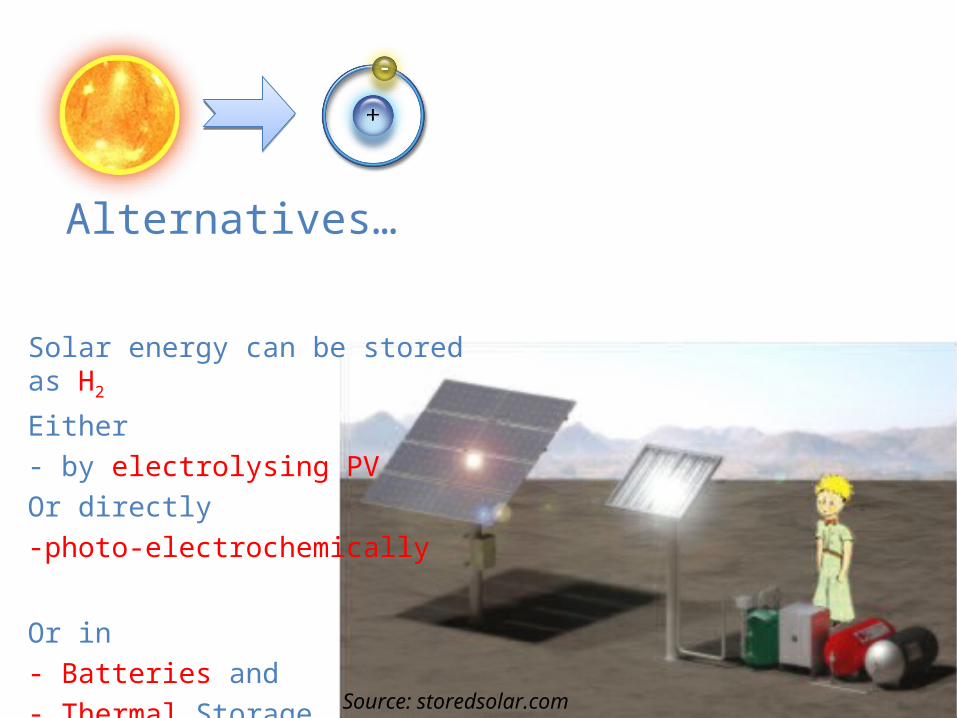
Source: storedsolar.com
Solar energy can be stored as H2
Either - by electrolysing PVOr directly-photo-electrochemically
Or in - Batteries and - Thermal Storage
Alternatives…
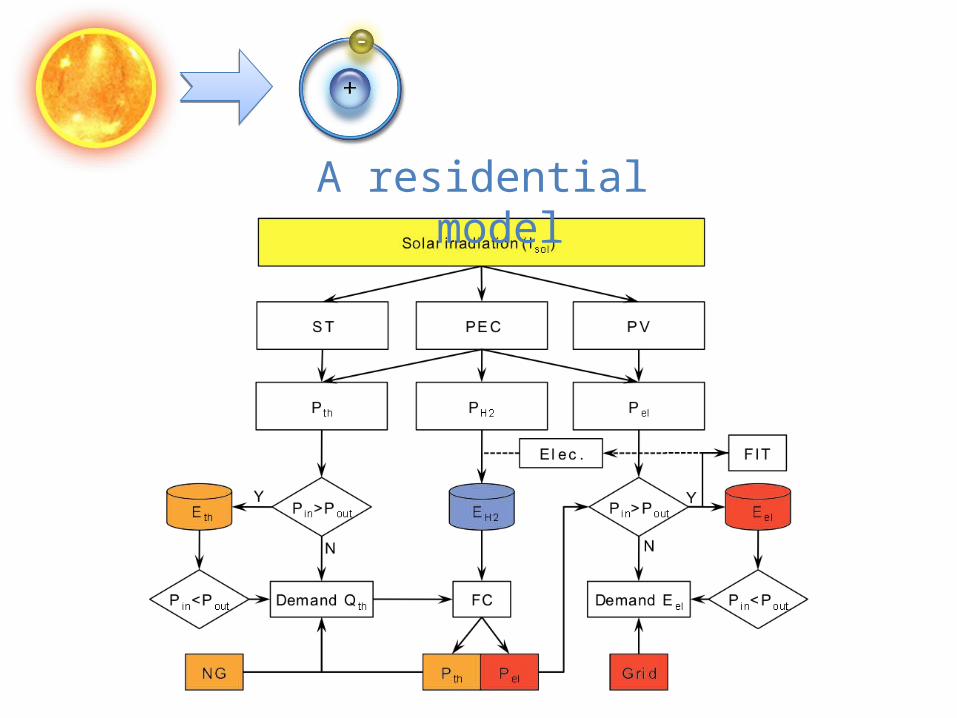
A residential model
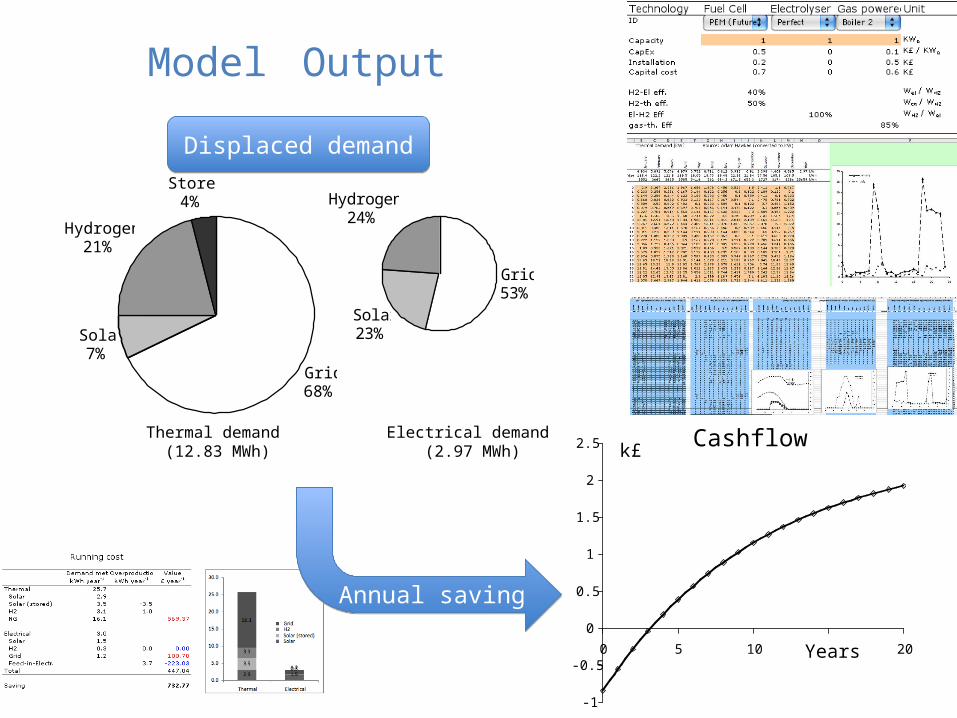
Model Output
Electrical demand (2.97 MWh)
Thermal demand (12.83 MWh)
Grid68%
Solar7%
Hydrogen21%
Stored4%
Grid53%
Solar23%
Hydrogen24%
Cashflow
-1
-0.5
0
0.5
1
1.5
2
2.5
0 5 10 15 20
Annual saving
Cashflow
Years
k£
Displaced demandDisplaced demand

Efficiency matters…
0
200
400
600
800
1000
1200
8% 10% 12% 14% 16% 18% 20%
PVSTPECMix
10 12 14 16 18 . .
1200
1400
800
600
400
200
0 .
20 24 28 32 36
ηPV, PEC
ηST
Conversion efficiency [%]
NP
V [
£]
10% PEC module: ~32 £ m-2
12% PEC module: ~41 £ m-2
(excl. storage cost)
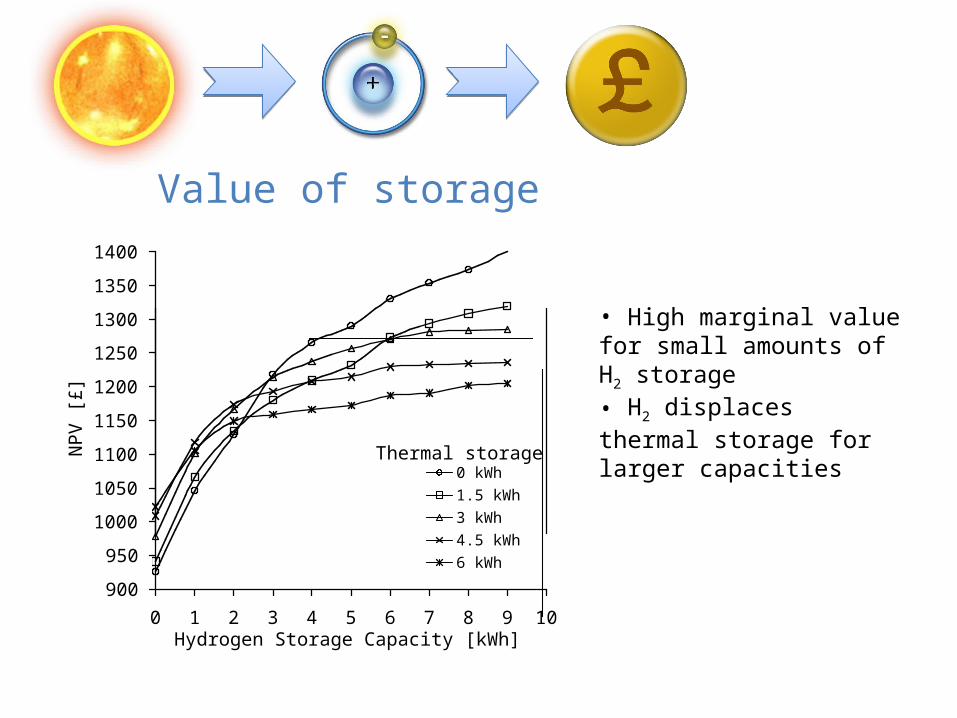
Value of storage
900
950
1000
1050
1100
1150
1200
1250
1300
1350
1400
0 1 2 3 4 5 6 7 8 9 10
0 kWh
1.5 kWh
3 kWh
4.5 kWh
6 kWh
Hydrogen Storage Capacity [kWh]
NP
V [
£]
Thermal storage
900
950
1000
1050
1100
1150
1200
1250
1300
1350
1400
0 1 2 3 4 5 6 7 8 9 10
0 kWh
1.5 kWh
3 kWh
4.5 kWh
6 kWh
• High marginal value for small amounts of H2 storage• H2 displaces thermal storage for larger capacities

1 2 3 4 5 6 7 8 9 10
20m^20
500
1000
1500
2000
250020m^240m^260m^280m^2100m^2
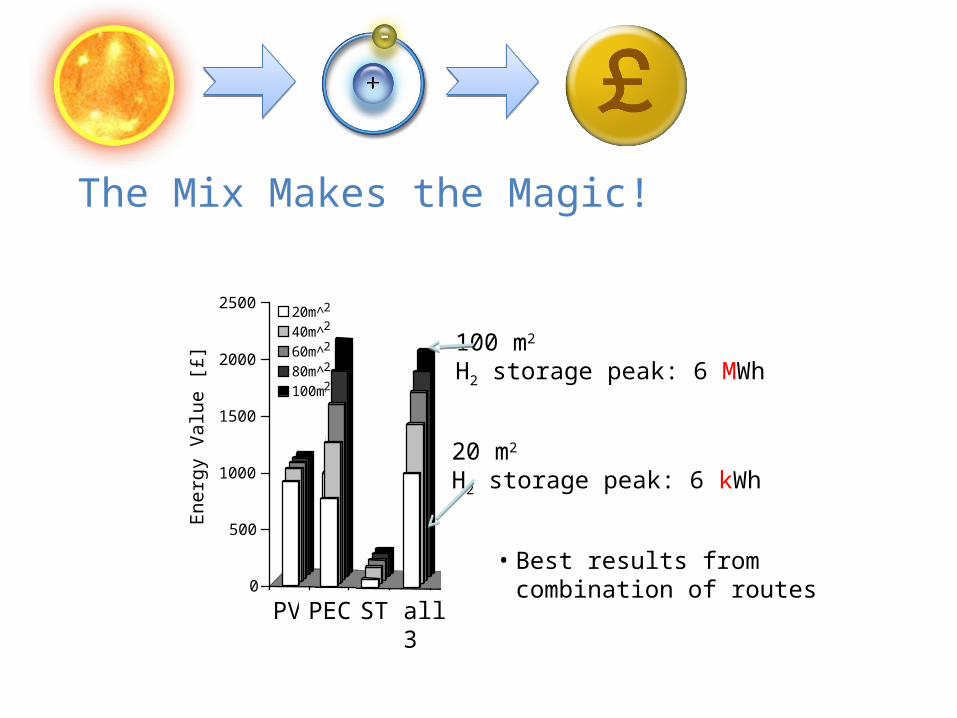
The Mix Makes the Magic!
2
2
2
2
2
1 2 3 4 5 6 7 8 9 10
20m^20
500
1000
1500
2000
2500
1 2 3 4 5 6 7 8 9 10
20m^20
500
1000
1500
2000
2500
1 2 3 4 5 6 7 8 9 10
20m^20
500
1000
1500
2000
2500
2
PV PEC ST
Ener
gy V
alue
[£]
all 3
• No gain form PV and Solar Thermal beyond 20m2
• PV highest “energy value” for small installations(Note: costs are excluded)
Peak Hydrogen Storage [kWh]
0
0.5
1
1.5
2
2.5
3
3.5
Ap
r
Jul
Oct
Jan
Ma
yJu
n
Au
gS
ep
No
vD
ec
Fe
bM
ar
2 -
3 -
4 -
1 -
0 -P
ea
k H
2 S
tora
ge
[kW
h]
1 2 3 4 5 6 7 8 9 10
20m^20
500
1000
1500
2000
250020m^240m^260m^280m^2100m^2
The Mix Makes the Magic!
2
2
2
2
2
1 2 3 4 5 6 7 8 9 10
20m^20
500
1000
1500
2000
2500
1 2 3 4 5 6 7 8 9 10
20m^20
500
1000
1500
2000
2500
1 2 3 4 5 6 7 8 9 10
20m^20
500
1000
1500
2000
2500
2
PV PEC ST
Ener
gy V
alue
[£]
all 3
• Best results from combination of routes
100 m2
H2 storage peak: 6 MWh
20 m2
H2 storage peak: 6 kWh
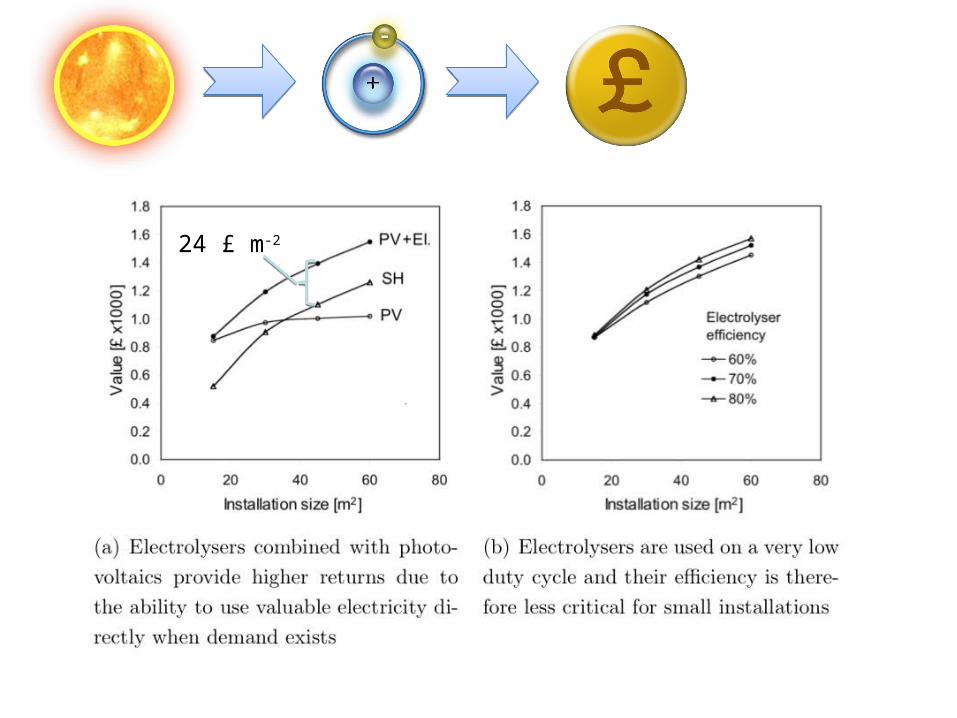
24 £ m-2

Conclusion
• Generating and storing hydrogen can only be economical from excess energy
• Installations need to be big or• Use electrolytic H2 from low-carbon grid electricity
• Best results come from a mix of electricity, heat and hydrogen generation
• Poly-generation configurations should be considered

Summary
• In order to “save”, large installations are required• Best results with a mix of PV ST and PEC• Efficiency is worth ~4 £ %-1 m-2 (*)
• Demand for domestic scale solar storage is small
(*) given a long list of assumptions…

Thank you.Thank you.Thank you.Thank you.

The trouble with (average) humans
24h
kWh
5min
-1
Data: Courtesy of Adam Hawkes24h
30 days of one month 1 day (high and low res.)
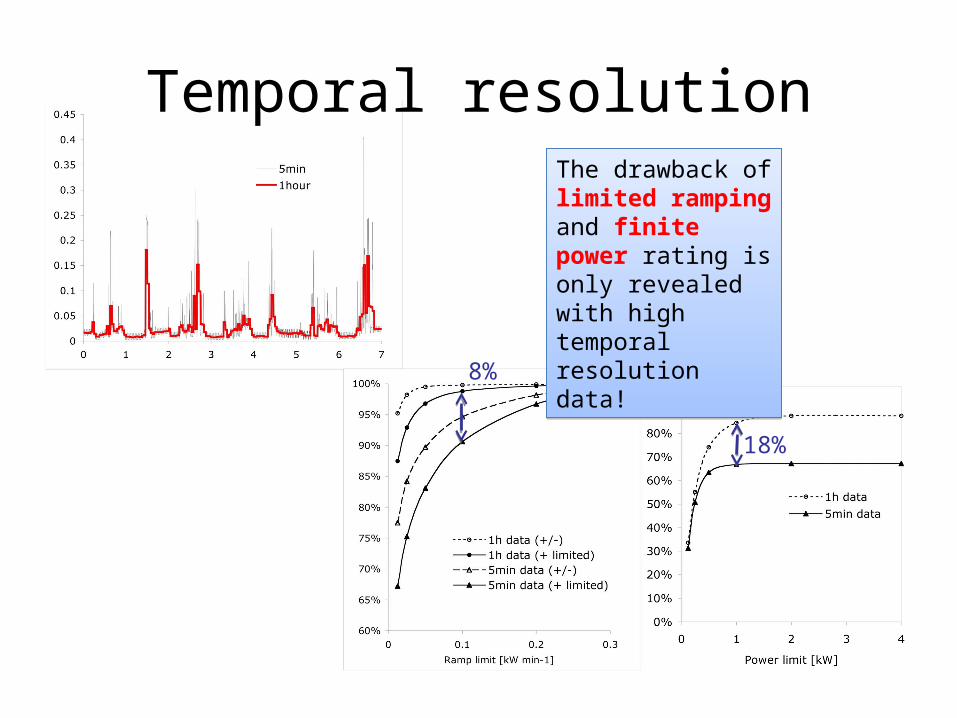
Temporal resolutionThe drawback of limited ramping and finite power rating is only revealed with high temporal resolution data!
The drawback of limited ramping and finite power rating is only revealed with high temporal resolution data!
18%
8%

Lamp calibration
Steve Dennison
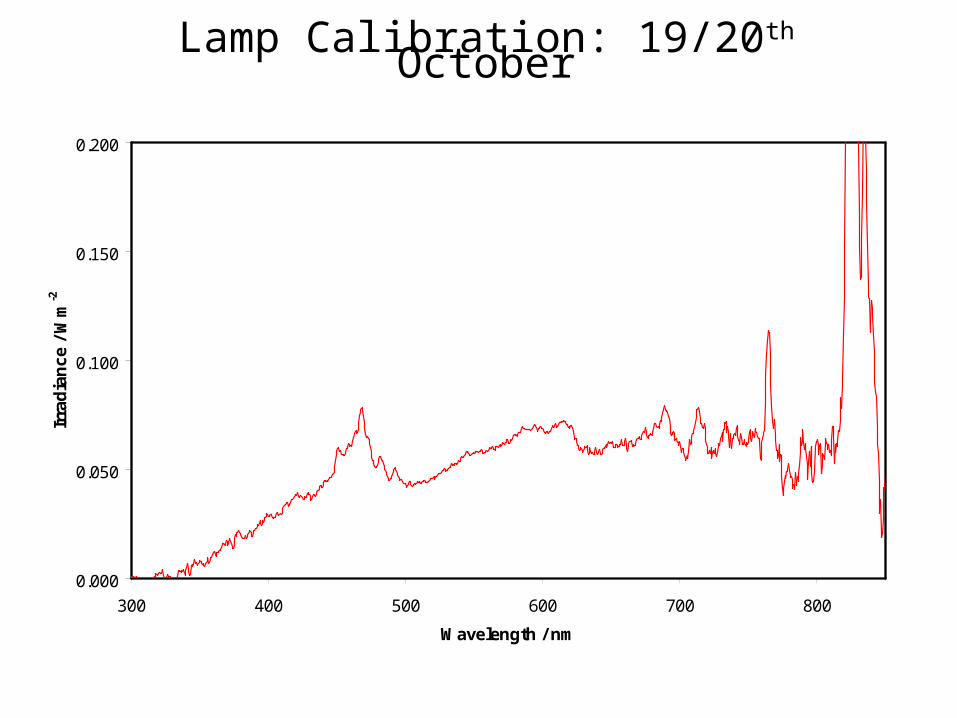
Lamp Calibration: 19/20th October
0.000
0.050
0.100
0.150
0.200
300 400 500 600 700 800
Wavelength / nm
Irra
dia
nce
/ W
m-2
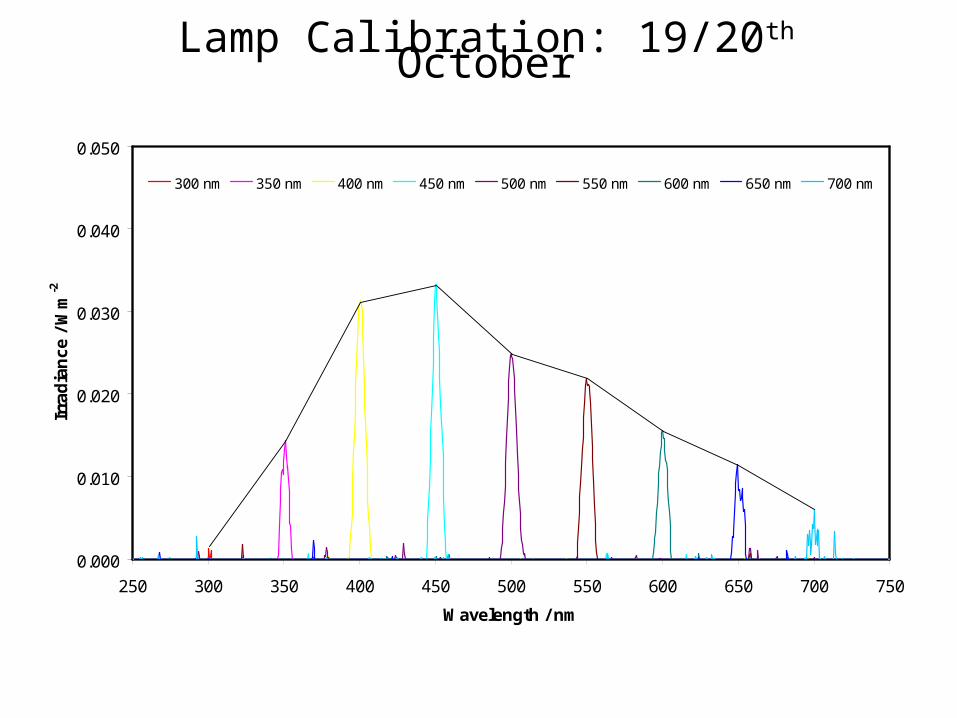
Lamp Calibration: 19/20th October
0.000
0.010
0.020
0.030
0.040
0.050
250 300 350 400 450 500 550 600 650 700 750
Wavelength / nm
Irra
dia
nce
/ W
m-2
300 nm 350 nm 400 nm 450 nm 500 nm 550 nm 600 nm 650 nm 700 nm

FZ
• upgrading the Sartorius system:
• Instrumentation: update on various H2 sensors
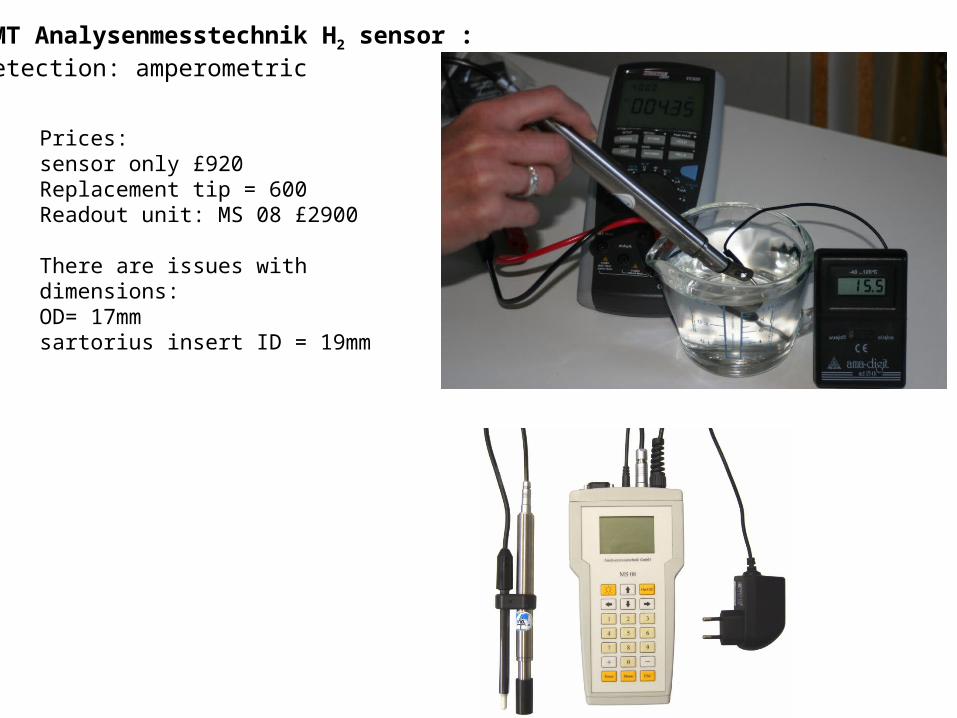
Prices:sensor only £920Replacement tip = 600Readout unit: MS 08 £2900
There are issues with dimensions:OD= 17mmsartorius insert ID = 19mm
AMT Analysenmesstechnik H2 sensor : detection: amperometric
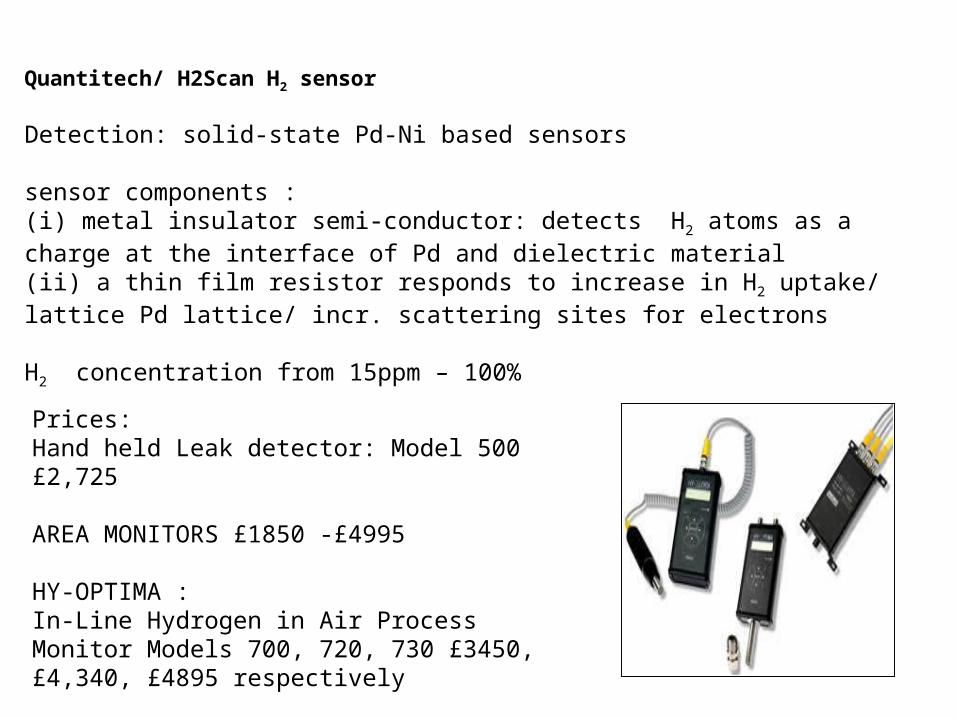
Quantitech/ H2Scan H2 sensor
Detection: solid-state Pd-Ni based sensors
sensor components : (i) metal insulator semi-conductor: detects H2 atoms as a charge at the interface of Pd and dielectric material(ii) a thin film resistor responds to increase in H2 uptake/ lattice Pd lattice/ incr. scattering sites for electrons
H2 concentration from 15ppm – 100%
Prices:Hand held Leak detector: Model 500 £2,725
AREA MONITORS £1850 -£4995
HY-OPTIMA :In-Line Hydrogen in Air Process Monitor Models 700, 720, 730 £3450, £4,340, £4895 respectively