cbd technical series no. 28 convention on bio-logical ... · secretariat of the cbd technical...
TRANSCRIPT

28CBD Technical Series No. 28Secretariat of the
Convention on Bio-logical Diversity
AN EXPLORATION OF TOOLS ANDMETHODOLOGIES FOR VALUATION OFBIODIVERSITY AND BIODIVERSITYRESOURCES AND FUNCTIONS

Technical series No. 28
An exploration of tools and methodologiesfor valuation of biodiversity and biodiversity
resources and functions

Published by the Secretariat of the Convention on Biological Diversity. ISBN: 92-9225-064-7Copyright © 2007, Secretariat of the Convention on Biological Diversity
The designations employed and the presentation of material in this publication do not imply the expres-sion of any opinion whatsoever on the part of the copyright holders concerning the legal status of anycountry, territory, city or area or of its authorities, or concerning the delimitation of its frontiers orboundaries.
This publication may be reproduced for educational or non-profit purposes without special permissionfrom the copyright holders, provided acknowledgement of the source is made.
Photo Credits: African daisies: Stickmen Creative Solutions, istockphoto.comFlamingos over Lake Nakuru: David AinsworthAustralia's Great Barrier Reef: courtesy of KJA and istockphoto.comSilhouette of Mangroves in Thailand: Anthony Brown Photography, istockphoto.com
Citation:Secretariat of the Convention on Biological Diversity, (2007). AN EXPLORATION OF TOOLS ANDMETHODOLOGIES FOR VALUATION OF BIODIVERSITY AND BIODIVERSITY RESOURCES ANDFUNCTIONS, Technical Series no. 28, Montreal, Canada, 71 pages.
For further information please contact:Secretariat of the Convention on Biological DiversityWorld Trade Centre413 St. Jacques, Suite 800Montreal, Quebec, Canada H2Y 1N9Phone: 1 (514) 288 2220Fax: 1 (514) 288 6588E-mail: [email protected]: http://www.biodiv.org
Typesetting: Em Dash Design
3
Foreword . . . . . . . . . . . . . . . . . . . . . . . . . . . . . . . . . . . . . . . . . . . . . . . . . . . . . . . . . . . . . . . . . . . . . . . . . . . . . . 5
I. INTRODUCTION AND ACKNOWLEDGEMENTS 6
II. METHODOLOGICAL ISSUES IN VALUATION 7A. Defining value . . . . . . . . . . . . . . . . . . . . . . . . . . . . . . . . . . . . . . . . . . . . . . . . . . . . . . . . . . . . . . . . . .7B. Valuation . . . . . . . . . . . . . . . . . . . . . . . . . . . . . . . . . . . . . . . . . . . . . . . . . . . . . . . . . . . . . . . . . . . . . .7C. Total Economic Value . . . . . . . . . . . . . . . . . . . . . . . . . . . . . . . . . . . . . . . . . . . . . . . . . . . . . . . . . . .11
III. VALUATION METHODS 131. Changes in productivity . . . . . . . . . . . . . . . . . . . . . . . . . . . . . . . . . . . . . . . . . . . . . . . . . . . . . . . . .152. Cost of illness and human capital . . . . . . . . . . . . . . . . . . . . . . . . . . . . . . . . . . . . . . . . . . . . . . . . .163. Cost-based approaches . . . . . . . . . . . . . . . . . . . . . . . . . . . . . . . . . . . . . . . . . . . . . . . . . . . . . . . . . .164. Hedonic analysis . . . . . . . . . . . . . . . . . . . . . . . . . . . . . . . . . . . . . . . . . . . . . . . . . . . . . . . . . . . . . . .175. Travel cost . . . . . . . . . . . . . . . . . . . . . . . . . . . . . . . . . . . . . . . . . . . . . . . . . . . . . . . . . . . . . . . . . . . .176. Contingent valuation . . . . . . . . . . . . . . . . . . . . . . . . . . . . . . . . . . . . . . . . . . . . . . . . . . . . . . . . . . .177. Choice modelling . . . . . . . . . . . . . . . . . . . . . . . . . . . . . . . . . . . . . . . . . . . . . . . . . . . . . . . . . . . . . .198. Benefits transfer . . . . . . . . . . . . . . . . . . . . . . . . . . . . . . . . . . . . . . . . . . . . . . . . . . . . . . . . . . . . . . . .209. Summary assessment of valuation methods . . . . . . . . . . . . . . . . . . . . . . . . . . . . . . . . . . . . . . . . .21
IV. VALUATION AND DECISION-MAKING 23A. Economic frameworks . . . . . . . . . . . . . . . . . . . . . . . . . . . . . . . . . . . . . . . . . . . . . . . . . . . . . . . . . .23
1. Cost-benefit analysis and cost-effectiveness analysis . . . . . . . . . . . . . . . . . . . . . . . . . . . . . . . 232. National income accounts . . . . . . . . . . . . . . . . . . . . . . . . . . . . . . . . . . . . . . . . . . . . . . . . . . . . 25
B. Non-economic frameworks . . . . . . . . . . . . . . . . . . . . . . . . . . . . . . . . . . . . . . . . . . . . . . . . . . . . . .261. Multi criteria analysis . . . . . . . . . . . . . . . . . . . . . . . . . . . . . . . . . . . . . . . . . . . . . . . . . . . . . . . 262. Deliberative and participatory approaches . . . . . . . . . . . . . . . . . . . . . . . . . . . . . . . . . . . . . . . 273. Satisficing . . . . . . . . . . . . . . . . . . . . . . . . . . . . . . . . . . . . . . . . . . . . . . . . . . . . . . . . . . . . . . . . . 284. Liability and redress . . . . . . . . . . . . . . . . . . . . . . . . . . . . . . . . . . . . . . . . . . . . . . . . . . . . . . . . . 28
C. Conclusions . . . . . . . . . . . . . . . . . . . . . . . . . . . . . . . . . . . . . . . . . . . . . . . . . . . . . . . . . . . . . . . . . .29
V. STRENGTHEN INTERNATIONAL COLLABORATIVE PARTNERSHIPS FOR ASSESSING BIODIVERSITY VALUES 31
A. Institutional capacity . . . . . . . . . . . . . . . . . . . . . . . . . . . . . . . . . . . . . . . . . . . . . . . . . . . . . . . . . . .31B. Capacity building and training . . . . . . . . . . . . . . . . . . . . . . . . . . . . . . . . . . . . . . . . . . . . . . . . . . .32
1. International cooperation in enhancing domestic capacities . . . . . . . . . . . . . . . . . . . . . . . 322. Web-based resources. . . . . . . . . . . . . . . . . . . . . . . . . . . . . . . . . . . . . . . . . . . . . . . . . . . . . . . . 333. Enhancing global capacities: international information systems and databases . . . . . . . 34
C. Fostering research . . . . . . . . . . . . . . . . . . . . . . . . . . . . . . . . . . . . . . . . . . . . . . . . . . . . . . . . . . . . . .34
REFERENCES 36
ANNEX—VALUATION STUDIES 42Case Study I: Rainforest Ecotourism, Costa Rica . . . . . . . . . . . . . . . . . . . . . . . . . . . . . . . . . . .42Case Study II: Montego Bay Coral Reefs, Jamaica . . . . . . . . . . . . . . . . . . . . . . . . . . . . . . . . . . .43
An exploration of tools and methodologies for valuation of biodiversity
TABLE OF CONTENTS

An exploration of tools and methodologies for valuation of biodiversity
Case Study III: Conversion Of Mangroves To Shrimp Farms, Thailand . . . . . . . . . . . . . . . . .45Case Study IV: The Total Economic Value Of Forests In Sekong Province, Lao PDR . . . . . .47Case Study V: Changbaishan Mountain Biosphere Reserve, China . . . . . . . . . . . . . . . . . . . . .49Case Study VI: Dryland Biodiversity: The Fynbos Biome, South Africa . . . . . . . . . . . . . . . . .50Case Study VII: The Flamingos Of Lake Nakuru National Park, Kenya . . . . . . . . . . . . . . . . . .52Case Study VIII: Mantadia National Park, Madagascar . . . . . . . . . . . . . . . . . . . . . . . . . . . . . . . .54Case Study IX: The Conservation Of Wild Geese In Scotland, United Kingdom . . . . . . . . . .56Case Study X: The Donau-Auen National Park, Austria . . . . . . . . . . . . . . . . . . . . . . . . . . . . . .58Case Study XI: Szigetkoez Wetland, Hungary . . . . . . . . . . . . . . . . . . . . . . . . . . . . . . . . . . . . . . .61Case Study XII: Tourism Value Of The Great Barrier Reef, Australia . . . . . . . . . . . . . . . . . . . .62Case Study XIII: The Exxon Valdez Oil Spill, United States of America . . . . . . . . . . . . . . . . . . .64
4

5
An exploration of tools and methodologies for valuation of biodiversity
FOREWORD
Over the last decades, human beings have changed global ecosystems fasterand more extensively than in any comparable period of time in humanhistory, leading to an unprecedented and ongoing loss of biodiversity. The sizeof key natural ecosystems such as tropical forests or wetlands has alreadyshrunk dramatically, or become increasingly fragmented, with disastrousresults for biodiversity. Species are becoming extinct at 1,000 times the typicalbackground rate—leading scientists speak about the sixth wave of extinction
taking place in Earth’s history. This is the main message of the Global Ecosystem Assessment, anassessment of the world’s ecosystems which was prepared by 1395 experts from 95 countries.
According to the Assessment, the loss of biodiversity constitutes a concern for human well-being,especially for the well-being of the poorest. Biodiverse ecosystems provide essential resources and goods,such as food, fibre, and medicines. The ecosystem functions that support these provide other vitalservices, such as the regulation of water flows and levels, protection against extreme weather, thepurification of air and water, the prevention of soil erosion, and opportunities for recreation andspiritual reflection. In its evaluation of these ecosystem services, the Assessment found that 15 out of 24examined are in decline.
Most of these ecosystem services are not traded on markets and thus do not bear a price tag, makingit difficult to make informed choices about their conservation and sustainable use. Absence of a pricedoes not mean the absence of economic value however. Revealing the hidden value of ecosystem servicesthrough valuation techniques, in particular on non-market valuation, is an important mechanism forintegrating biodiversity considerations in economic decision-making. Applications of improvedvaluation techniques can lead to interesting observations. For example, valuation techniques tell us thatalthough many individuals benefit from activities that lead to biodiversity decline and the associated lossin ecosystem services, the costs borne by society of these activities are often higher. The annex of thepresent publication provides a number of compelling examples.
Since its inception, Parties to the Convention on Biological Diversity have expressed considerableinterest in work on valuation, including the review of valuation information and research intoappropriate and cost-effective valuation methodologies. The present document responds to a specificrequest of the eighth meeting of the Conference of the Parties, which took place in Curitiba, Brazil, on20–31 March 2006, to disseminate information on valuation methods including through the CBDTechnical Series, in order to promote a common understanding of valuation techniques amonggovernments and stakeholders.
The Conference of the Parties at its eighth meeting underlined that the application of practicalvaluation methods can contribute to meeting the 2010 biodiversity target. The target commits Parties tothe Convention to achieve, by 2010, a significant reduction of the current rate of biodiversity loss at theglobal, regional and national level. Achieving this target is ambitious, but vital. It is my hope that thepresent publication will provide useful technical background information to Parties, other governments,and stakeholders on the voluntary application of such valuation methods, and will hence beinstrumental in achieving the 2010 biodiversity target, as a contribution to poverty alleviation and forthe greater benefit of all life on earth.
Ahmed DjoghlafExecutive Secretary of the Convention on Biological Diversity

An exploration of tools and methodologies for valuation of biodiversity
The present document was initially prepared as an information document for the eleventh meeting ofthe Convention’s Subsidiary Body on Scientific, Technical and Technological Advice (SBSTTA), whichtook place in November 2005, in Montreal, Canada. It responded to a request to the Executive Secretaryexpressed by the seventh meeting of the Conference of the Parties to the Convention, to explore, incooperation with the Millennium Ecosystem Assessment, the Organisation for Economic Co-operationand Development and relevant international organizations, existing methodologies for valuation of bio-diversity and biodiversity resources and functions, as well as other tools for prioritization in decision-making, by preparing a compilation of existing valuation tools that provides an overview of the discus-sion on their methodological status, if appropriate, as well as an assessment of their applicability interms of effectiveness and capacity preconditions. The document subsequently served SBSTTA as a basisfor the development of concise “Options for the application of tools for valuation of biodiversity andbiodiversity resources and functions”, which are available as a separate publication.
The first drafts of the body of the document were prepared by Dr. Dominic Moran, and the Secretariatgratefully acknowledges this contribution as well as his valuable support in the further development ofthe document. Thanks go also to Mr. Hans Haake, University of Oldenbourg, Germany, for his supportin preparing the final draft as well as the compilation and synthesis of the valuation studies provided inthe annex to the document. On the Secretariat level, the document was drafted and finalized by Dr. Markus Lehmann, economist.
The analysis and discussion of the valuation tools provided in section three of the document is to a con-siderable extent based on the review and assessment of valuation tools provided in chapter 2.3.3.1 ofvolume 1 of the Millennium Ecosystem Assessment, and the Secretariat wishes to extend its thanks tothe Coordinating Lead Authors of this chapter, Dr. Ruth de Fries and Dr. Stefano Pagiola, as well as itsLead and Contributing Authors and reviewers.
Parties to the Convention on Biological Diversity, other Governments, and relevant international organ-izations and experts were invited to participate in a peer review of the document, and the Secretariatwishes to gratefully acknowledge the reviews that were provided by the following Parties: Argentina,Canada (three reviews), Egypt, European Community and its Member States, India, Kenya, Netherlands,Sri Lanka and Ukraine.
Comments were also provided by the United States of America, as well as by the Food and AgricultureOrganization of the United Nations (FAO), the Organisation for Economic Co-operation andDevelopment (OECD), and the United Nations Environment Programme (UNEP). Personal reviewswere provided by Prof. Ronaldo Seroa da Motta, Research Institute for Applied Economics, Rio deJaneiro, Brazil; and by Dr. Renat Perelet, Institute for Systems Analysis, Russian Academy of Sciences,Moscow, Russian Federation.
The Secretariat wishes to gratefully acknowledge the financial support of the Government of theNetherlands for the publication of this document.
6
I. INTRODUCTION AND ACKNOWLEDGEMENTS

7
a. defining value
Biodiversity as well as biodiversity resources and functions are intuitively valuable. Few would contestthe fact that the decline of biodiversity would be costly to humankind, in particular with regard to thosefunctions that cannot be replicated. But this general truth does not shed much light on how to identify,describe and measure the specific values that are held in respect of biodiversity and biological resourcesand functions.
The term value is used in different ways amongst a range of academic disciplines. According to theOxford Dictionary, there are three main types of uses of the term “value”: (i) exchange value, that is, the(relative) price of a good or service in the market; (ii) utility, that is, the use value of a good or service,which can be very different from the market price (e.g. the market price of water is very low, but its usevalue very high; the reverse is the case for, for example, diamonds or other luxury goods); and (iii)importance, that is, the appreciation or emotional value attached to a given good or service (e.g. the emo-tional or spiritual experience some people have when viewing wildlife or natural scenery, or our ethicalconsiderations regarding the existence value of wildlife).
Different disciplines define and use these terms in different ways. In economics, value and utility areunambiguously anthropogenic.1 For instance, in the case of marketed goods and services, it is humanswho reveal value, in terms of their so-called willingness-to-pay, by the process of exchange. Similarlyutility is derived by humans. Even the concept of importance is only meaningful if assigned by, andinferred from, human choices or decisions on behalf of other living organisms. But other disciplinesmay assign different interpretations to value or importance, which may or may not be linked to valuesascribed by human beings. For example, anthropology may infer value from cultural norms and prac-tices that are in some sense non-negotiable (e.g. sacred groves). Theologians and ethicists may baseimportance on moral or spiritual criteria that are neither observed nor measurable (but neverthelessstrong motives), and may also point out that the predominant role of humans in utilitarian thinking dis-places intrinsic value and the right of other species to exist. And last but not least, ecologists will be inter-ested in the importance of attributes or functions of a system to maintain ecosystem resilience. This isan objective criterion, that is, irrespective of its relevance to humans.
In what follows it is important to bear in mind these disciplinary distinctions and the fact that differentperspectives on value lead to differing views on the practicality of measurement and, by extension, usein policy making.
b. valuation
While there is growing awareness of the value and importance of diversity per se, there is a lack ofconsensus on how diversity can be defined and measured. For example, species richness is frequently the
An exploration of tools and methodologies for valuation of biodiversity
II. METHODOLOGICAL ISSUES IN VALUATION
1 A distinction is made in philosophy between anthropocentric and anthropogenic value. Something has anthropocentric valuewhen it is good for a human subject. Foods and other goods used by humankind have anthropocentric (and instrumental)value. Anthropogenic value, on the other hand, is value that is attributed by a human subject, but not necessarily value for ahuman. So, for example, many people take an old growth forest to have value whether or not it is actually used or appreciatedfirsthand by a person. See Hiller 2005, Callicott and Baird 1999. Because of the concept of existence value, explained furtherbelow, the term anthropogenic is used here.

An exploration of tools and methodologies for valuation of biodiversity
only accessible indicator of species diversity, although it is well known that a head count of the numberof apparently different species in an area may not be a good proxy for the portfolio effect of geneticdistance between them. Some context-sensitive index or set of indices of biodiversity change would befundamental to any economic valuation of diversity. Indices could in theory be based on phylogeneticdata. In practice this data is not readily available as a basis for prioritization. However, otherprioritization devices, discussed below, employ non-monetary measures of value that may encompassgenetic distance.
In consequence, valuation does normally not entail measuring the economic value of biodiversity assuch.2 Instead, valuation typically focuses on the economic values of the goods and services generatedby biodiversity resources and/or functions—the so-called ecosystem services.3 A comprehensive assess-ment of the values of ecosystem services4 has recently been undertaken by the Millennium EcosystemAssessment. The Millennium Ecosystem Assessment adopted a wide understanding of ecosystem serv-ices, which includes goods under the concept of “provisioning services”. While this understandingdeparts from the usual economic distinction between “goods” and “services”, it will be adopted in theremainder of the note for the sake of ensuring consistency with the terminology introduced by theMillennium Ecosystem Assessment.5
It is noteworthy that the term “economic” is to be understood in a broad sense. Based on welfare eco-nomics, economic valuation recognizes that individuals may assign value for different reasons ormotives, and not only for the immediate benefits of commercial exploitations of resources (as a narrowinterpretation of the term “economic” may suggest).
In a recent note, leading scientists under the Millennium Ecosystem Assessment clarified that, as usedand defined in the Assessment and as already used in existing international documents, the term andconcept of “ecosystem services” in no way implies an automatic requirement or obligation on the partof the consumer to pay directly for the supply of the service. The term does, however, imply that theservice is of value to people (in terms of economic, health, cultural or other benefits) and that the degra-dation or loss of the service represents a harmful impact on human well-being. The note also highlight-ed the different policy options at hand for reducing the degradation of ecosystem services, and under-lined that it is a matter of societal choice which option or options to use.6
2 Pearce and Moran, 1994; Pearce 2001. There is however some literature that seeks to determine the value of biodiversitycomponents by the genetic composition of species rather than by the species themselves (see, for example, Polasky et al.,1993; Metrick and Weitzman, 1996; 1998; Weitzman, 1998). Empirical applications of these methods have been presented byWeitzman 1993 and Solow et al. 1993.
3 See for instance Daily and Dasgupta for an explanation of this concept. As the same functions often contribute to theproduction of different services, simply adding the values of different services would likely not produce an accurate estimateof the value of the underlying functions. See Pearce and Moran 1994.
4 See Millennium Ecosystem Assessment 2003. See also Christie 2004 as well as Daily and Dasgupta 2001 for furtherdiscussion, and Eftec 2005 for a literature review of the economic, social and ecological value of ecosystem services.
5 See also Daily and Dasgupta 2001 for a similar conceptualisation. The Millennium Ecosystem Assessment was carried outbetween 2001 and 2005 to assess the consequences of ecosystem change for human well-being and to analyze optionsavailable to enhance the conservation and sustainable use of ecosystems and their contributions to human well-being.Responding to requests for information including through the Convention on Biological Diversity, it was carried out by 1,395experts from 95 countries, and has been extensively peer reviewed by governments and experts.
6 See Reid, V. et al. 2005. The note reacted to concerns raised in the context of the discussion on water pricing and theprivatisation of water resources.
8

9
Economics generally assigns value on the basis of direct or indirect tradeoffs, that is, actions that showpeople making sacrifices in favour of specific goods and services, thus revealing their willingness-to-payfor these goods and services by exchanging them on markets. These actions can be explained by a robusttheory of demand that posits specific axioms or rules about the consistency in which these choices aremade. It is the consistency of the predictions of this theory that enables economists to infer what peo-ple value based on what they actually do.
Environmental economics has extended demand theory to goods and services that are not traded onmarkets, including most ecosystem services (which include goods according to the understanding of theMillennium Ecosystem Assessment). As they are not traded on markets, their value is not captured inmarket prices. The reason is that many ecosystem services bear characteristics of what economists call“public goods”. One important characteristic of public goods is that nobody can be excluded from theiruse. For this reason, markets cannot spontaneously develop for public goods, and the value of these pub-lic goods will therefore not be reflected in a market price. This has also the consequence that the pricesof many marketed goods and services will not adequately reflect the essential role of these services intheir production, which, in turn, will lead to distorted decisions by consumers and producers. Publicdecision-making and its allocation of public funds will also be distorted if the repercussions of govern-mental activities on these biodiversity resources and functions, and the associated ecosystem services,are not adequately factored in.7
In consequence, undertaking valuation does not only raise awareness of the hidden benefits of biodiver-sity conservation in terms of maintaining critical ecosystem services. It has also the potential of improv-ing public decision-making as well as, under specific circumstances, of improving legal decision-making.8
The proposals on the design and implementation of incentive measures, endorsed by the sixth meetingof the Conference of the Parties to the CBD, as far as they are consistent with Parties’ national polices aswell as their international obligations, underlined that valuation can also support the design of otherincentive measures for the conservation and sustainable use of biodiversity.9 It was recognized by theConference of the Parties that incentive measures should not negatively affect biodiversity and liveli-hoods of communities in other countries. In that regard, valuation could also contribute. For instance,the valuation of the ecosystem services that are relevant under a given decision-making problem, at allrelevant scales (local, regional and/or global, on-site and/or off-site), could contribute to ensure thatrepercussions on biodiversity at all scales are taken into consideration in decision-making.
An exploration of tools and methodologies for valuation of biodiversity
7 De Groot et al. (2006), at page 11, show a more detailed overview of how “normal markets” fail to specifically reflect thevalue of wetlands.
8 See the discussion under IV B 4 below.9 Decision VI/15, annex I, paragraph 22. It has been noted by the OECD that such calibration is of particular importance for
those instruments that seek to directly correct prices, such as fees or direct payments for environmental services. In caseswhere property rights could be established on the relevant biodiversity assets, a market price would emerge endogenously.Even in the latter case however, valuation would still be useful to determine the magnitude of the policy problem and whichpolicy instruments to choose.
10 Depending on the question that is to be investigated, focus is sometimes given to the so-called “willingness-to accept.” Forinstance, if an area is to be protected and people who have the legal title to use that area would be no longer allowed to do so,they might be asked for how much compensation they are willing to voluntarily give up their right to use the area. Willingness-to-accept generally raises important problems with biases, which is why the concept of willingness-to-pay is generallypreferred. See Hanemann 1991.

An exploration of tools and methodologies for valuation of biodiversity
Since the 1960s, considerable efforts have been made by economists to develop methods that can elicitthe “hidden” value of non-marketed natural resources. These methods use the aforementioned sacrificeor “willingness to pay”,10 based on actual or hypothetical behaviour, to infer the value of the resource.There are many reasons why people are indirectly observed to, or directly state that they are willing to,make tradeoffs between their endowment (in terms of time, labour effort, monetary income or wealth)and safeguarding non-marketed natural resources, including safeguarding specific levels of ecosystemservices. The framework commonly used for describing the different types of economic value ascribedto natural resources is known as the Total Economic Value (TEV) and will be presented below.
Valuation usually attempts to measure the value of ecosystem services in monetary terms, in order toprovide a common metric in which to express the benefits of the variety of services provided by ecosys-tems. This explicitly does not mean that only monetary sacrifices, or only services that generate mone-tary benefits, are taken into consideration. What matters is that people are willing to make tradeoffs. Ifthe relevant people were for instance subsistence farmers, these tradeoffs could be initially measured bythe labour time they are willing to provide for achieving some environmentally-friendly outcome. Inorder to have a common metric, this effort could then be transformed into a monetary figure by apply-ing for instance the local or domestic wage rate.
The economics profession is divided on whether valuation is adequate or sufficient to deal with themore fundamental issues that are also involved in biodiversity management. It is in particular suggest-ed that some biodiversity functions are key to the survival of global ecosystems including humans (theso-called life support function) and should therefore be treated as a fundamental constraint and not asan element of the set of possible economic choices.11 Put another way, all economic choices must bemade within some ecological constraints otherwise the global system may collapse. The standard tool-box of economic valuation is said to be of limited if any use for the identification of these global con-straints. Alternative approaches such as setting a safe minimum standard may be more suitable for thosecases, in particular when changes are irreversible.12
In consequence, valuation usually focuses on the value of comparatively small (incremental or “margin-al”) changes in ecosystem services that result (or would result) from management decisions or fromother human activities.13 Some recent efforts have been made to derive the global (as opposed to incre-mental) value of ecosystems at a given time14 and to simulate the value of ecosystem services in an inte-grated Earth system model.15 However, the methodologies underlying these efforts, and the figures theyproduced, remain controversial;16 moreover, as the Millennium Ecosystem Assessment notes, their use-fulness for policy is limited, as it is rare for all ecosystem services to be completely lost and even then,such a complete loss would usually happen only over time.17 For these reasons, and consistent with the
10
11 There has been considerable debate on how much biodiversity is necessary to keep the basic services of the planet intact. Thereis however a consensus that a more diverse ecosystem can provide services more reliably (Peterson et.al. 1998)
12 See Pagiola et al. 2005.13 Changes in ecosystem services may also result from natural impacts that lead to a different state of the ecosystem. In such cases,
management decisions may, for instance, include whether and how to mitigate these impacts on the ecosystem condition.14 See Costanza et al. 1997.15 See Boumans et al. 2002.16 For instance, Dasgupta states that “the value of an incremental change to the natural environment is meaningful because it assumes
that humanity will survive the change to experience it. The reason (that) estimates of the total value (of the environment) shouldcause us to balk is that if environmental services were to cease, life would not exist.”. See Dasgupta 2000.
17 Millennium Ecosystem Assessment, volume one, chapter 2.3.3. This conclusion only applies to the limitations of valuation.Multi-disciplinary research will still be important to identify causal chains and interaction effects as well as the impacts ofbiodiversity loss.
11
approach chosen by the Millennium Ecosystem Assessment,18 this report focuses on methods for assess-ing the value of changes in ecosystem services.
c. total economic value
The framework commonly used for describing the different types of economic value ascribed to naturalresources is known as Total Economic Value (TEV). The framework comprises use values (direct,indirect and option value19) and non-use values. These types of value are summarized in figure 1.20
Direct use value is the value derived from direct use or interaction with environmental resources andservices (e.g., timber, fuelwood, recreation are direct use values of a forest). They involve commercial,subsistence, leisure, or other activities associated with a resource.
Indirect use value relates to the indirect support and protection provided to economic activity andproperty by the ecosystem’s natural functions. For example, carbon sequestration is a function of forestecosystems whose value can be derived from the avoided costs of having to sequester by other means, orfrom avoiding the actual effects of warming. Similarly, the watershed protection function of a tropicalforest may have indirect use value through controlling water quality and flood drainage that affectdownstream agriculture, fishing, water supplies and other economic activities. While these functionshave in principle long been recognized, precise field experimentation has often been lacking in order toshow more precisely the relationships between ecosystem functions and the services generated.
Option value is a type of use value in that it relates to future use of the environment or biodiversityresources and functions. Option value arises because individuals may value the option to be able to usethe natural resource some time in the future. For example, there may be an additional premium placedon preserving a forest system and its resources and functions for future use, particularly if prospects offuture value are high and if current exploitation or conversion is irreversible.21 The logic of the optionmotive is to maintain a diverse portfolio of resources as a means to reducing the risk of large fluctua-tions in value.22 A more diverse ecosystem also tends to be considerably more resilient. This has beenresearched under the term “insurance value” as well.23
Quantification of option value is often complex. For instance, several attempts have been made to evalu-ate the expected benefits of bioprospecting of genetic resources of naturally occurring wild plants andorganisms for pharmaceutical use. These attempts remain however controversial due to a number of openquestions including: the role and extent of previous knowledge and its impact on probabilities of findinga resource of actual value; and the role and extent of potential replacement by human-made diversity.24
An exploration of tools and methodologies for valuation of biodiversity
18 Ibid.19 Option value is also sometimes classified as a non-use value.20 It is important to not confound this concept with the attempts, explained above, to quantify the global (as opposed to
incremental) value of ecosystem services worldwide.21 See Conrad (1997) for an application to old-growth forest.22 According to some ecological approaches on biodiversity, the value of a species could greatly vary, depending on the time of
its loss. A species lost while others can still provide a given service and fill the gap might have a relatively low value, one lostlater when it is the only one providing the service could cause the collapse of an ecosystem. Biodiversity becomes morevaluable as it becomes scarce.
23 See Baumgaertner 2006.24 See Simpson, Sedjo and Reid 1996, Rausser and Small 2000, Firn 2003.

The lack of knowledge is also reflected in the concept of a quasi-optional value,25 referring to the valueof having more time to learn about the extent26 or possible uses of biodiversity, thereby making it pos-sible for future decisions to be based on better information. Decisions should always take into accountthat the results of an interference with an ecosystem can never be fully predicted, making “ignorance astrong motivation for conservation.”27
Non-use values such as existence value (sometimes also dubbed passive value) are derived neither fromcurrent direct or indirect use of the environment. For example, there are individuals who do not use thetropical forest but nevertheless wish to see it preserved because they simply derive utility from the ongo-ing existence of the ecosystem, or because they wish to conserve it for future generations (bequest value).A similar observation applies to some species, in particular charismatic mega-fauna such as whales ortigers. The concrete reasons why they derive utility may vary and may be based on, for instance, reli-gious, spiritual, or ethical motives. In particular, a non-use motive may coincide with the recognition ofan intrinsic right of existence. In this sense, valuation that is based on the concept of total economicvalue will also capture, at least to some extent, non-utilitarian values.28
Of all the value categories, existence or passive value is most complex in terms of quantification and itsrole in decision-making. Yet, it is a type of economic value that is significant in defining both nationaland global biodiversity management priorities.
12
25 See Weikard 2002.26 According to biological estimates, as little as 10% of species are currently known. 27 Weikard 2002.28 Millennium Ecosystem Assessment (2003), 133.
An exploration of tools and methodologies for valuation of biodiversity

13
In the last decades, valuation methods have reached a considerable degree of sophistication. The lastdecades have also witnessed a gradually emerging consensus on the state-of-the-art of the range ofvaluation methods at hand, which is reflected by the fact that recent handbooks and manuals on thetopic provide very similar overviews and assessments of the individual tools, with differences remainingessentially on the level of terminology and classifications.29
Valuation methods are increasingly applied not only in developed countries, but also in developingcountries and countries with economies with transition. Rietbergen-McCracken and Abaza (2000)explain that:
“[U]p to recently, there was considerable skepticism, particularly among international development
organizations and developing country governments (as end users of the valuation results) about the
possibilities of using valuation methods outside the relatively resource-rich and data-rich environments
of developed countries. It was generally felt that developing countries and countries with economies in
transition presented too many difficulties (including a scarcity of statistical information; the presence
of price distortions or undeveloped markets; and in some cases largely illiterate communities) to allow
valuation methods to produce meaningful results. However, over the last five to ten years a growing
body of evidence has emerged to refute these claims.”30
Rietbergen-McCracken and Abaza (2000) present a number of case studies of valuation studiesundertaken in Africa, Asia, Latin America and Central and Eastern Europe, some of which also deal withbiodiversity resources and functions, and the related ecosystem services. The IUCN guidelines forprotected area managers on economic values of protected areas also provide summaries of a number ofvaluation studies in developing countries,31 A survey on the use of contingent valuation studies indeveloping countries, some of which address biodiversity-related issues, was conducted by FAO in2001.32 Humavindu (2002) presents an analysis of valuation studies addressing nature-based tourism inNamibia.
The remainder of this sub-section is largely based on the review and assessment of valuation tools pro-vided in chapter 2.3.3.1 of volume 1 of the Millennium Ecosystem Assessment. The reason for choosingthis approach is that the report of the Millennium Ecosystem Assessment has already been extensivelypeer-reviewed by governments and experts.
Many methods for measuring the values of ecosystem services are found in the resource and environ-mental economics literature (Mäler and Wyzga 1976; Freeman 1979; Hufschmidt et al. 1983; Mitchelland Carson 1989; Pearce and Markandya 1989; Braden and Kolstad 1991; Hanemann 1992; Freeman1993; Pearce 1993; Dixon et al. 1994; Johansson 1994; Pearce and Moran 1994; Barbier et al. 1995; Willisand Corkindale 1995; Smith 1996; Seroa da Motta 1998; Garrod and Willis 1999; Seroa da Motta 2001;Pearce et al. 2002; Turner et al. 2002; Pagiola et al. 2005).
An exploration of tools and methodologies for valuation of biodiversity
III. VALUATION METHODS
29 For recent handbooks and manuals, see e.g. IUCN (1998), OECD (2002), and Pagiola et al. 2005 (published by the WorldBank). A manual that concentrates specifically on wetlands valuation has recently been published by the Bureau of the RamsarConvention on Wetlands (de Groot et al. 2006).
30 Rietbergen-McCracken and Abaza (2000), 2.31 IUCN (1998).32 By discussing issues of relevance to successful implementation of this technique in these countries, the report can be used by
FAO and its Member countries for guiding the work of practitioners who have a leading or technical contribution role in thedesign of CVM surveys. It is available under http://www.fao.org/es/ESA/en/pubs_wp01.htm .

An exploration of tools and methodologies for valuation of biodiversity
Some techniques are based on actual observed behaviour data, including some methods that deduce val-ues indirectly from behaviour in surrogate markets, which are hypothesized to have a direct relationshipwith the ecosystem service of interest. Other techniques are based on hypothetical rather than actualbehaviour data, where people’s responses to questions describing hypothetical markets or situations areused to infer value. These are generally known as “stated preference” techniques, in contrast to thosebased on behaviour, which are known as “revealed preference” techniques. Some techniques are broad-ly applicable, some are applicable to specific issues, and some are tailored to particular data sources. Asin the case of private-market goods, a common feature of all methods of economic valuation of ecosys-tem services is that they are founded in the theoretical axioms and principles of welfare economics.These measures of change in well-being are reflected in people’s willingness to pay or willingness toaccept compensation for changes in their level of use of a particular service or bundle of services(Hanemann 1991; Shogren and Hayes 1997). These approaches have been used extensively in recentyears, in a wide range of policy-relevant contexts.
Any one valuation method is unlikely to be able to cover all of the different types of value given in theconcept of Total Economic Value.33 Different techniques may also be required for the same biodiversityresource evaluated at different scales. For example, the range of services of a forest, the type of value ofthose services, and their actual value to a local community living at the fringe of the forest, may differsignificantly from the types of value and the value that the national and/or international communitymay assign to different services of the same forest. The selection of the method or methods should there-fore depend on which types of value, and on which levels, are deemed the most important or likely in agiven situation.34
Valuation is a process involving several steps. First, the services being valued have to be identified. Thisincludes understanding the nature of the services (bearing in mind that, under the MillenniumEcosystem Assessment understanding, services may also include goods) and their scale (being local,regional and/or global, on-site or off-site), and how they would change if the ecosystem changed; know-ing who makes use of the services, in what way and for what purpose, and what alternatives they have;and establishing what trade-offs might exist between different kinds of services an ecosystem might pro-vide. The bulk of the work involved in valuation actually concerns quantifying the biophysical relation-ships. In many cases, this requires tracing through and quantifying a chain of causality. Valuation in thenarrow sense only enters in the second step in the process, in which the value of the impacts is estimat-ed in monetary terms.
14
33 See, e.g., Nunes and van den Bergh (2001).34 Accordingly, most of the valuation studies provided in the annex use several valuation methods, even while many of them
deliberately restrict their attention to only one or several components of total economic value.

15
overview of valuation methods35
1. Changes in productivity
One widely used technique, thanks to its broad applicability and its flexibility in using a variety of datasources, is known as the change in productivity technique.36 It consists of tracing through chains ofcausality so that the impact of changes in the condition of an ecosystem can be related to variousmeasures of human well-being. Such impacts are often reflected in goods or services that contributedirectly to human well-being (such as production of crops or of clean water), and as such are oftenrelatively easily valued. The valuation step itself depends on the type of impact but is oftenstraightforward.
The impact of hydrological changes on use of water for human consumption, for example, begins bytracing through chains of causality to estimate the changes in the quantity and quality of water availableto consumers. This is itself often difficult. For instance, the relationship between tree cover and waterproductivity in a watershed is complex and often not well understood. Further scientific research intothis relationship and the chains of causality will in such cases be a key precondition for valuation.
In the case of marketed goods, the actual valuation is relatively straightforward. For instance, the netvalue in reductions in irrigated crop production resulting from reduced water availability is easy to esti-mate, for example, as crops are often sold. (Even so, it is a very common error to use the reduction inthe gross value of crop production rather than the net value. Using gross value omits the costs of pro-duction and so overestimates the impact.).
Where the impact is on a good or service that is not marketed or where observed prices are unreliableindicators of value, the valuation can become more complex. In the example above, it has to be notedthat the prices charged to consumers for water consumption are typically not reliable measures of thevalue of the water to consumers, as they are often set administratively, with no regard for supply anddemand (indeed, in most cases water fees do not even cover the cost of delivering the water to con-sumers, let alone the value of the water itself). The value of an additional unit of water can then be esti-mated in various ways, such as the cost of alternative sources of supply (cost-based measures aredescribed later) or asking consumers directly how much they would be willing to pay for it (contingentvaluation, described later). Note that it is very important to use the value of an additional unit of water,since some amount of water is, of course, vital for survival. Thus an additional unit of water will be veryvaluable when water is scarce, but much less so when water is plentiful. In this case, as in many others,averages can be misleading.
When the impact is on water quality rather than quantity, the impact on well-being might be reflectedin increased morbidity or even mortality. Again, the process begins by tracing through chains of causal-ity, for example by using dose-response functions that tie concentrations of pollutants to human health.Valuing the impact on health itself can then be done in a number of ways (see cost of illness and humancapital, in the next section).
An exploration of tools and methodologies for valuation of biodiversity
35 In accordance with the mandate set out in decision VII/18, this section focuses on the methodological status of the individualmethods, but references to actual studies undertaken with these methods will also be given.
36 See studies III, IV, and X in the annex as specific examples.

An exploration of tools and methodologies for valuation of biodiversity
In some cases, the impact is on relatively intangible aspects of well-being, such as aesthetic benefits orexistence value. Starting in the 1960s, particular efforts have been made to develop techniques to valuesuch impacts, including hedonic price, travel cost, and contingent valuation methods, and considerableprogress has been made since then—see below for further discussion.
2. Cost of illness and human capital
The economic costs of an increase in morbidity due to increased pollution levels can be estimated usinginformation on various costs associated with the increase: any loss of earnings resulting from illness;medical costs such as for doctors, hospital visits or stays, and medication; and other related out-of-pocket expenses. The estimates obtained in this manner are interpreted as lower-bound estimates of thepresumed costs or benefits of actions that result in changes in the level of morbidity, since this methoddisregards the affected individuals’ preference for health versus illness and restrictions on non-workactivities. Also, the method assumes that individuals treat health as exogenous and does not recognizethat individuals may undertake defensive actions (such as using special air or water filtration systems toreduce exposure to pollution) and incur costs to reduce health risks.
When this approach is extended to estimate the costs associated with pollution-related mortality(death), it is referred to as the human-capital approach. It is similar to the change-in-productivityapproach in that it is based on a damage function relating pollution to productivity, except that in thiscase the loss in productivity is that of human beings, measured in terms of expected lifetime earnings.Because it reduces the value of life to the present value of an individual’s future income stream, thehuman-capital approach is extremely controversial when applied to mortality. Many economists prefer,therefore, not to use this approach and to simply measure the changes in the number of deaths or in theprobability of death (without monetary values), or measures such as disability-adjusted life years.
3. Cost-based approaches
The costs of replacing or restoring the services provided by the environmental resource can sometimesbe relevant variables in decision-making.37 For example, if ecosystem change reduces water filtrationservices, the cost of treating water to make it meet the required quality standards could be used. Themajor underlying assumptions of these approaches are that the nature and extent of physical damageexpected is predictable (there is an accurate damage function available) and that the costs to replace orrestore damaged assets can be estimated with a reasonable degree of accuracy. It is further assumed thatthe replacement or restoration costs do not to exceed the economic value of the service, bearing in mindthat potential externalities generated by the replacement options should also be taken intoconsideration. These assumptions may not be valid in all cases. It simply may cost more to replace orrestore a service than it was worth in the first place—for example, because there are few users or becausetheir use of the service was in low-value activities.
Even while there is not necessarily any relationship between the replacement or restoration cost and thevalue of the service, cost-based approaches can provide useful guidance in a number of cases, in partic-ular when the specific decision-making problem calls for a comparison of the costs resulting from all
16
37 See studies II, III, IV, V, and X in the annex.
17
different replacement or restoration options. For instance, in an often-quoted case, the New York Citywater authority avoided spending $6-8 billion on water purification plants by investing $1.5 billion forprotection and restoration of the upstate watershed of the Catskills mountains.38 Here, the decision-making problem was simply to minimize the cost of meeting an objective, by comparing the costs result-ing from replacement and from restoration options. The priority given to the objective itself (a reliablesupply of drinking water meeting certain quality standards) was unquestionable and, hence, not part ofthe decision-making problem.
4. Hedonic analysis
The prices paid for goods or services that have environmental attributes differ depending on thoseattributes. Thus, a house in a clean environment will sell for more than an otherwise identical house ina polluted neighbourhood. Hedonic price analysis compares the prices of similar goods to extract theimplicit value (also dubbed “shadow price”) that buyers place on the environmental attributes. Thismethod assumes that markets are transparent and work reasonably well, and it would not be applicablewhere markets are distorted by policy or market failures. Moreover, this method requires a very largenumber of observations, so its applicability is limited.
5. Travel cost
The travel-cost method is an example of a technique that attempts to deduce value from observedbehaviour in a surrogate market. It uses information on visitors’ total expenditure to visit a site to derivetheir demand curve for the site’s services. From this demand curve, the total benefit visitors obtain canbe calculated. (It is important to note that the value of the site is not given by the total travel cost; thisinformation is only used to derive the demand curve.)39 This method was designed for and has beenused extensively to value the benefits of site-seeing or of recreation at particular sites,40 but it has limitedutility in other settings.
6. Contingent valuation
Contingent valuation is an example of a stated preference technique.41 It is carried out by askingconsumers directly about their willingness-to-pay to obtain an environmental service.42 A detaileddescription of the service involved is provided, along with details about how it will be provided. Theactual valuation can be obtained in a number of ways, such as asking respondents to name a figure(classical CV), asking them whether they would pay a specific amount (dichotomous orpolychotomous choice, paragraph 55) or having them choose from a number of options (choicemodelling, paragraph 56).43
An exploration of tools and methodologies for valuation of biodiversity
38 See Postel and Thompson 2005.39 Technically, the total benefit is expressed as the area under the demand curve minus the costs—this is the sum of the consumer
surplus and the producer surplus. 40 See studies I, VII, VIII, XII.41 See studies II, VI, VII, VIII, IX, X.42 Or, under some circumstances, their willingness-to-accept. See previous discussion.43 Respondents do not necessarily have to provide a monetary figure. See the discussion on page 10 and study IV in the annex
as an example.

An exploration of tools and methodologies for valuation of biodiversity
Contingent valuation can, in principle, be used to value any environmental benefit simply by phrasingthe question appropriately. Moreover, since it is not limited to deducing preferences from available data,it can be targeted quite accurately to ask about the specific changes in benefits that the change in ecosys-tem condition would cause. Because of the need to describe in detail the service being valued, interviewsin contingent valuation surveys are often quite time-consuming. It is also very important to identify therelevant population, to ensure representativeness of the sample of respondents, and to have the ques-tionnaire extensively pre-tested to avoid various sources of bias.
A potentially important limitation in terms of applying these methods to ecosystem services is thatrespondents cannot typically make informed choices if they have a limited understanding of the issue inquestion. Choosing the right approach for, and the adequate intensity of efforts in, improving the under-standing of biological complexity of the sample group is a challenge for stated preference methods.
Contingent valuation methods have been the subject of severe criticism by some analysts, in particularbecause a number of biases can occur that would lead contingent valuation studies to not reflect truepreferences:
� One major issue is that of so-called zero-bids, that is, respondents that state to have nowillingness-to-pay at all. In some cases, such an occurrence can be explained by economictheory—the service in question is not valued by the respondent or his/her budget restrictionsare too tight. However, zero-bids can also reflect protest—respondents who are not agreeingthat they should pay for the service in question and who consider someone else responsible, forinstance the government or the polluter. A zero-response may also be given when no trade-offsfor the service are accepted at all (so-called lexicographic preferences). Finally, protest bids canalso occur when the survey itself is rejected as a methodology, or payment vessels are notaccepted.44
� Exaggerated willingness-to-pay statements are possible as well, for different reasons: (i) Thephenomenon of “yea-saying” has been shown to occur sometimes—respondents will agree to aproposal or bid to please the interviewer or avoid further questions. (ii) The existence of a “warmglow” can also have an influence; respondents tend to feel good about giving, about being “good”or “nice”, and will initially offer higher a willingness-to-pay than after thorough consideration.(iii) Strategic behaviour can also occur: participants will state unrealistic willingness-to-paynumbers in an attempt to influence the outcome of the study. (iv) Willingness-to-pay statementstend to also be elevated due to a lack of awareness of possible substitutes.
� Another source of bias can be through the interviewer giving information that is not fullyneutral, or formulating questions to favour certain answers.
A “blue-ribbon” panel was organized by in the United States following controversy over the use of con-tingent valuation to value damages from the 1989 Exxon Valdez oil spill. The report of this so-calledNOAA panel (Arrow et al. 1993) concluded that contingent valuation can provide useful and reliableinformation when used carefully, and it provided guidance thereon that can help to reduce or avoidmany of the biases described above. This report is generally regarded as authoritative on appropriate useof the technique.
18
44 The payment vessel can be refused because another is considered superior (e.g. taxes vs. fees), or the responsible institutionis not considered trustworthy.
19
The guidance of the panel includes inter alia the following requirements:
� The design of contingent valuation studies should be conservative, always rather allowing foran underestimate than an overestimate of willingness-to-pay.
� Because the concept of willingness-to-accept is a source of potential bias, willingness-to-payshould be preferred over willingness-to-accept.
� The valuation questions are to be asked as a vote on a referendum, not completely open.
� Sufficient information must be provided, however care is necessary in the use of pictures,including the pre-testing their effect on participants, and possibly making another choice.
� Participants should be made aware of substitutes for the good being evaluated.
� Sufficient time should pass after a negative impact on the ecosystem before a contingentvaluation study is conducted in order to avoid answers out of a momentary disposition.Answers averaged over several points in time can avoid catching temporary changes inpreferences.
� Respondents should be able to refuse an answer, with an attempt to be made of finding out thereasoning behind both refusals to answer and yes/no answers.
� A high quality survey would also include questions on socioeconomic data and respondents’general attitudes and perceptions of the issue at stake, with the influence of these variables onthe willingness-to-pay being analyzed.
� Lastly, with all the above guidelines met, the questionnaire must still be easy enough tounderstand and not take an excessive amount of time to complete.
Dichotomous or polychotomous choice is a variant of Contingent Valuation where instead of openquestions the respondents are asked whether they would pay a certain amount. Dichotomous choiceallows only for “yes” and “no” answers, polychotomous choice provides more options such as “probablypay”, “certainly pay” or “not sure”. Questions can be single-bounded, where only one question is asked,or multiple-bounded, where follow-up questions with higher or lower amounts, depending on the ini-tial reply, are asked. There are usually different versions of a questionnaire with different amounts beinginitially offered for choice. This technique makes answering easier for respondents, thereby reducing thechance of unrealistic statements. It does however bear the risk of starting point bias, that is, researchersinfluencing outcomes by choosing certain starting points.
7. Choice Modelling
Choice modelling (also referred to as contingent choice, choice experiments, conjoint analysis, or attrib-ute-based stated choice method) is a newer approach to obtaining stated preferences.45 It consists of ask-ing respondents to choose their preferred option from a set of alternatives where the alternatives aredefined by attributes (including the price or payment). The alternatives are designed so that the respon-dent’s choice reveals the marginal rate of substitution between the attributes and the item that is tradeoff (e.g., money). These approaches are useful in cases in which the investigator is interested in the val-
An exploration of tools and methodologies for valuation of biodiversity
45 See study VI for an example.

An exploration of tools and methodologies for valuation of biodiversity
uation of the attributes of the situation or when the decision lends itself to respondents choosing froma set of alternatives described by attributes.
Choice modelling has several advantages: the control of the stimuli is in the experimenter’s hand, asopposed to the low level of control generated by real market data; the control of the design yields greaterstatistical efficiency; the attribute range can be wider than found in market data; and the introductionor removal of products, services and attributes is easily accomplished (Louviere et al. 2000; Holmes andAdamowicz 2003; Bateman et al. 2004).46 The method also minimizes some of the technical problemsassociated with contingent valuation, such as strategic behaviour of respondents. The disadvantagesassociated with the technique are that the responses are hypothetical and therefore suffer from problemsof hypothetical bias (similar to contingent valuation) and that the choices can be quite complex whenthere are many attributes and alternatives. The econometric analysis of the data generated by choicemodelling is also fairly complex.
8. Benefits transfer
A final category of approach is known as benefits transfer. This is not a methodology per se but ratherrefers to the use of estimates obtained (by whatever method) in one context to estimate values in adifferent context. For example, an estimate of the benefit obtained by tourists viewing wildlife in onepark might be used to estimate the benefit obtained from viewing wildlife in a different park.Alternatively, the relationship used to estimate the benefits in one case might be applied in another, byusing adjusted data from this case in conjunction with some data from the site of interest (“benefitfunction transfer”). For example, a relationship that estimates tourist benefits in one park, based in parton their attributes such as income or national origin, could be used in another park, but with data onincome and national origin of that park’s visitors.47
Benefits transfer has been the subject of considerable controversy in the economics literature, as it hasoften been used inappropriately.48 According to the Millennium Ecosystem Assessment, a consensusseems to be emerging that benefit transfer can provide valid and reliable estimates under certain condi-tions. These conditions include the requirement that the commodity or service being valued be verysimilar at the site where the estimates were made and the site where they are applied and that the pop-ulations affected have similar characteristics.49 Of course, the original estimates being transferred mustthemselves be reliable in order for any attempt at transfer to be meaningful.
As the conditions at the two sites are unlikely to be perfectly identical, some transfer error is to beexpected. This feature, however, does not speak as such against the application of benefits transfer inreal-world decision-making. This is because estimates based on benefits transfer can be generated withconsiderably less time and resources than primary studies. In a world of scarce resources and typicallyvery costly primary studies, decision makers may be willing to trade quick and cheap numbers againsta certain loss in accuracy, provided that minimum quality standards are met. They may even be more
20
46 Conjoint analysis to value ecosystem services in different rural areas has been used in Colombia in a project by the Alexandervon Humboldt Institute in cooperation with the University of Massachusetts. See Colombia 2002.
47 See in particular study XI in the annex.48 See Brouwer 2000; Christie et al. 2004, 40, for further discussion.49 Up to a limit, differences in the population’s characteristics can be addressed by using benefits functions transfer.

21
ready to do so when the relevant alternative, under given resource constraints, is simply to have no esti-mate at all. Moreover, benefits transfer may be attractive when decision makers request, as is frequentlythe case, quick (but not necessarily final) answers from administrators—it may hence play a role with-in rapid assessment methodologies.50
9. Summary assessment of valuation methods
Each of the approaches reviewed above has seen extensive use in recent years, and considerable literatureexists on their application. These techniques can and have been applied to a very wide range of issues(Rietbergen-McCracken and Abaza 2001), including the benefits of ecosystems such as forests (Bishop1999; Kumari 1995; Pearce et al. 2002; Hanley et al. 2002, Merlo and Croitoru 2005), wetlands (Barbier etal. 1997; Heimlich et al. 1998; de Groot et al. 2006), watersheds (Aylward 2004; Kaiser and Roumasset2002). Other studies have focused on the value of particular ecosystems services such as water (Young andHaveman 1985), non-timber forest benefits (Lampietti and Dixon 1995; Bishop 1998), recreation(Bockstael et al. 1991; Mantua at al. 2001; Herriges and Kling 1999; Humavindu 2002), landscape (Garrodand Willis 1992; Powe et al. 1995), biodiversity for medicinal or industrial uses (Simpson et al. 1994;Barbier and Aylward 1996), natural crop pollination and cultural benefits (Pagiola 1996; Navrud andReady 2002). Many valuation studies are catalogued in the Environmental Valuation Reference InventoryWeb site maintained by Environment Canada (EVRI)51 or the ENVALUE environmental valuationdatabase developed by the New South Wales Environmental Protection Agency of Australia.52
It appears that, when applied carefully and according to best practice, valuation tools can generally pro-vide useful and reliable information on the changes in the value of non-marketed ecosystem services thatresult (or would result) from management decisions or from other human activities. Data requirementsmay be quite demanding for a number of tools, as are the preconditions in terms of technical expertise.Moreover, conducting primary valuation studies is typically time-consuming and costly.
According to the Millennium Ecosystem Assessment, measures based on observed behaviour are gener-ally preferred to measures based on hypothetical behaviour, and more direct measures are preferred toindirect measures. However, it is also pointed out that the choice of valuation technique in any giveninstance will be dictated by the characteristics of the case, including its scope, and by data availability.
Several techniques have been specifically developed to cater to the characteristics of particular problems.The travel cost method, for example, was specifically developed to measure the utility derived by visitorsto sites such as protected areas, and could also be applied to similar areas of interest, but is of limitedapplicability outside that particular case. The change in productivity approach, on the other hand, isapplicable to a wide range of issues.
Contingent valuation is potentially applicable to any issue, simply by phrasing the questions appropri-ately and as such has become very widely used—probably excessively so, as it is easy to misapply and,being based on hypothetical behaviour, is inherently less reliable than measures based on observed
An exploration of tools and methodologies for valuation of biodiversity
50 Christie et al (2004) note in this connection that: “Finding acceptable benefits transfer methods is essential to the wider use ofenvironmental valuation in policy. However, the standards of accuracy required in academic work may exceed those viewed astolerable by policy-makers. (…) The key question is: how close is close enough for policy purposes?”
51 http://www.evri.ca .52 http://epa.nsw.gov.au/envalue/ .

An exploration of tools and methodologies for valuation of biodiversity
behaviour. For instance, if the focus is on the quantification of indirect use values, the application ofother valuation tools would often seem to be preferable. For some types of value, however, stated pref-erence methods may be the only alternative. Thus, existence value can only be measured by stated pref-erence techniques. Guidance on the appropriate use of the technique exists and should be followedclosely.
Benefits transfer has often been used inappropriately but can provide valid and reliable estimates undercertain conditions. Given the cost of undertaking primary valuation studies, benefits transfer when usedcautiously is likely to be an increasingly appealing way for extending the use of valuation, including indeveloping countries.
22

23
As said earlier, undertaking valuation has the potential of improving public decision-making on projectsor regulations as well as, under specific circumstances, of improving legal decision-making. In thisconnection, the synthesis report of the Millennium Ecosystem Assessment also notes that:
“[M]ost resource management and investment decisions are strongly influenced by considerations of
the monetary costs and benefits of alternative policy choices. Decisions can be improved if they are
informed by the total economic value of alternative management options and involve deliberative
mechanisms that bring to bear non-economic considerations as well.”
Existing methods to support decision-making use valuation information to a greater or lesser extent.Economic frameworks such as cost-benefit analysis (CBA) and cost-effectiveness analysis (CEA) involveexplicit monetary valuation. An important advantage of the valuation tools reviewed in the last sectionis that they provide numbers in a common (monetary) metric, which can thus easily be incorporatedinto these standard appraisal methods. In contrast, multi criteria analysis (MCA) typically avoid usinga monetary unit of account. Other non-economic approaches to prioritization include deliberativeprocesses, scorecard approaches, expert judgment and satisficing.
All of these approaches are but tools to support decision-making. All of them have specific advantagesand limitations, and it cannot be claimed that one tool is generally superior, or that it should be used asan exclusive tool in decision-making. For instance, with regard to cost-benefit-analysis, it has to beacknowledged that economic efficiency is seldom the sole criterion for public investment decisions. Thedistributional impacts of decisions are often also important.53 While cost-benefit-analysis can be help-ful in clarifying distributional impacts, it does not deliver recommendations with regard to preferabledecisions from a distributional perspective.54 It will be shown in the subsequent paragraphs that the dif-ferent methods may be used in a complementary manner in order to support decision-making.
a. economic frameworks
1. Cost-benefit analysis and cost-effectiveness analysis
Cost-benefit analysis compares monetary costs and benefits in commensurate terms. This comparisonis sometimes expressed as a cost-benefit ratio, with benefits as the numerator and costs as thedenominator. Alternative options can then be ranked in accordance with their cost-benefit-ratio.Depending on the specific activities under investigation, the value associated with ecosystem serviceswill be included as a cost or as a benefit. For instance, if the cost-benefit-ratios of different conservationprojects were compared, the value of improved ecosystem services would be included as benefits of the
An exploration of tools and methodologies for valuation of biodiversity
IV. VALUATION AND DECISION-MAKING
53 For instance, many direct use values in developing countries arise in the context of subsistence activities that are oftencrucially important to rural populations. A range of studies has concentrated on the links between poverty alleviation and thesustainable exploitation of naturally occurring products. See e.g. Cavendish 1999 and 2003.
54 For instance, while the benefits of conservation are often widespread—they may occur at national or even international scales,such as in the case of carbon sequestration or the existence value associated with charismatic mega-fauna, the costs associatedwith conservation, in terms of foregone exploitation of resources or of use of land, are often borne by local populations. Onthe other hand, local ecosystem services—those that benefit local communities—are also severely undervalued in manycases—see studies III and IV for examples. By suitably disaggregating the numbers obtained, valuation studies and cost-benefit-analysis can help to quantify the shares of local vs. national vs. regional or international benefits and costs underdifferent options.

An exploration of tools and methodologies for valuation of biodiversity
individual projects. If, however, different development projects were considered, such as for instancedifferent options to invest into public infrastructure with negative impacts on biodiversity, the value ofthe associated loss of ecosystem services would be included as a cost to the individual option.55 It isnoteworthy that it may not be necessary to explore the full range of services of a given ecosystem inorder to have an influence on the policy outcome. This will be the case whenever the benefits associatedwith the most important ecosystem services are already high enough to tip the balance—within cost-benefit-analysis—against a specific development option.
As costs and benefits typically occur at different points in time, some way must be found to collapse therecognized cost and benefit flows to a commensurate basis. This conventional economic process isknown as time discounting, and the outcome of this process is called the “present value” of costs andbenefits. A crucial variable in the calculation of present values is the choice of a discount rate; i.e. thevalue that is used to collapse future values to their present equivalents. Any positive rate of discount istantamount to saying that the future (costs and benefits) are worth less in relative terms than the pres-ent, that is, costs and benefits that are realized immediately.
For conventional investment purposes, the rate of discount is simply the relevant market interest rate.But when it comes to choosing the appropriate rate for making a judgement on government projects orpolicies with important social and environmental impacts, important ethical and philosophical issuesarise that relate to the status of present versus future (possibly unknown) preferences. Aspects of inter-generational justice play an important rule in that discussion, since the value of future benefits is onlysmaller to the current generation, whereas biodiversity will be of importance for many generations tocome. While most contributors would seem to agree that the rate of discount should be positive, the cor-rect number is the subject of much debate.
Discount rates used in public decision-making tend to vary between 3 and 15 per cent across differentcountries. The choice of discount rate is in the first instance be guided by the rate that is used by thepublic sector for appraising its other investments, which implies that biodiversity-related “investments”would be treated like all other investments. In many cases, however, lower rates are used. One importantreason why not to accept a standard discount rate for biodiversity has been advanced in the shape of theso-called Krutilla-Fisher method.56 Even if future preferences for biodiversity are uncertain, currenttrends mean that the future of many biodiversity components and resources is looking bleak, implyingthat they will be increasingly scarce, or more valuable, in the future. As future generations will place ahigher value on scarcer resources than current generations, this reasoning then gives rise to a positivepremium on the future, which offsets the discounting process described above.
Cost-effectiveness analysis (CEA) leaves the numerator in qualitative terms and simply compares thedifferent costs of attaining some objective stated in the numerator. Different options that deliver thesame objective are then compared and prioritized based on their cost-effectiveness-ratio.57 CEA, there-fore, does not ask nor attempt to answer the question of whether the goal of the policy is justified, in the
24
55 This procedure would allow to capture what economists call the “opportunity cost” of the individual development project, thatis, the cost in terms of the most valuable opportunity foregone and the benefits that could be received from that opportunity.The consideration of opportunity costs is one of the key differences between the concepts of economic cost and accounting cost.
56 See Pearce and Turner 1990, Krutilla and Fisher 1975, Hanley and Craig 1991.57 Alternatively, CEA may assume a fixed budget and seeks the alternative that will result in the maximum effect on a specific
target variable.
25
sense that the social benefits expected from this goal exceed the costs necessary to reach the goal. In factnone of the options may be economically efficient, in the sense of monetary economic costs outweigh-ing economic benefits. Hence, CEA is appropriate whenever there are good reasons to believe that thebenefits of meeting the objective outweigh the costs, and the priority given to meet the objective is there-fore not under doubt.58 In other cases, however, CEA may only be helping to select the least worst optionamong a list of (potentially) inefficient options. Even in those cases, CEA is sometimes used as a second-best option when a full-blown CBA would be desirable, but many benefits cannot easily be monetized.
Both CBA and CEA are common governmental appraisal methods in OECD countries and among inter-national organizations. While the methods were originally developed for appraising basic infrastructure,many government guidance documents now include advice on the inclusion of environmental andsocial costs and benefits.59
2. National income accounts
While CBA and CEA are decision-making tools relevant to projects and regulations, national incomeaccounts are a key indicator framework for setting priorities in domestic macroeconomic policies.National income accounts are a long-standing economic convention by which economic performanceare measured. In essence, the accounts measure national output from all sources (known as grossdomestic product), and then deduct a measure of depreciation, which is the amount of (typically) manmade capital that is used up in production. The result is a figure that depicts, in economic terms, howwell off a country is year on year. While conventional accounts already include many biological products(e.g. production of timber and fish), in the last two decades there have been numerous attempts, atnational and international levels, to include environmental externalities and, more importantly, somemeasure of environmental depreciation to reflect the environmental losses that occur as a result ofeconomic activities. The United Nations Statistics Division, together with other organisations, hasdeveloped the System of Economic and Environment Accounting (SEEA). It was introduced in 1993 andrevised in 2003, and consists of a satellite system to the UN System of National Accounts (SNA), inwhich changes in important natural assets are accounted for in physical terms.60
Due to the problems involved in assessing values in a comprehensive manner, most work in this areafocus on those types of value that can be measured comparatively easily. It mainly includes direct usesvalues that are traded on markets, and opportunity costs for protected areas, sometimes also the impactof pollution. Some methods focus on the use of natural resources, both renewable and non-renewableas an indicator for the use of nature. For instance, recent work of the World Bank on an adjusted GDPand adjusted measurements of national capital stocks adopted the concept of genuine savings or adjust-ed net savings, which measure the true rate of savings in an economy after taking into account invest-ments in human capital, depletion of natural resources and damage caused by pollution.61 The workshows that several countries that perform well on conventional grounds were actually performing lesswell once the new measure of depreciation was included. Under a more comprehensive valuation exer-cise, including most indirect and non-use values, the number of countries with this sobering feature
An exploration of tools and methodologies for valuation of biodiversity
58 The Catskills case, discussed above, provides an example.59 See for example chapter 4 of the United Kingdom Treasury Green Book on public appraisal. http://greenbook.treasury.gov.uk/ 60 See http://unstats.un.org. A United Nations Committee on Environmental-Economic Accounting was established to promote
and implement this work.

An exploration of tools and methodologies for valuation of biodiversity
would arguably be higher. Identification of this environmental drag on economic growth can serve as abasis for prioritizing national environmental policies and a focus on mitigation or reversal of environ-mentally damaging activities.
While valuation is central to the exercise of environmental adjustment of national accounts, many the-oretical and methodological challenges remain with regard to an adequate incorporation of biodiversi-ty values in conventional macro economic indicators of growth.62 For instance, many of the valuationtools at hand are simply too costly and demanding to apply them on a scale that would be needed for acomprehensive valuation of the annual changes in domestic biodiversity resources.63 Nevertheless,national income accounts remain an important vehicle into which more information about biodiversi-ty loss must be directed. Further research directed at the development of a biodiversity adjustment is animportant means to have biodiversity losses more reflected in macroeconomic discourse.
b. non-economic frameworks
The economics approaches mentioned so far are all potentially informed by the tools for the valuationof biodiversity resources presented in the previous section. The following approaches are morequalitative in nature but may occasionally use valuation information in the decision process.
1. Multi criteria analysis
Multi-criteria analysis (MCA) is in fact a family of methods that use different scoring approaches toweigh the different attributes of a decision. They are used to structure a policy problem in terms ofpossible policy alternatives and to assess each alternative under various criteria. Most of the variants ofMCA are structured approaches used to determine overall preferences among alternative policymeasures, where each policy measure may pursue several objectives. Participants in the analysis aretypically given the criteria that define different options and are asked to score or weigh these criteriausing some pre determined points system.
Multi-criteria analysis is mainly applicable to cases where a single-criterion approach is insufficient.Instead, an MCA may accommodate a range of social, environmental, technical, economic, and finan-cial criteria. MCA is therefore applicable especially where significant environmental and social impactsare present, which cannot (easily) be expressed in monetary terms.64 MCA are often integrated withdeliberative and participatory approaches and are said to facilitate such input to a larger degree than themonetary assessment tools CBA and CEA.65
26
61 The work is based on Pearce & Atkinson.62 See for instance Nordhaus and Kekkelenberg (eds) 1999 for further discussion.63 Such problems are not alien even to conventional National Accounting. For instance, many of the issues involved in including
environment values at the macro level are not uncommon to problems involved in measuring the cost of living. See Nordhausand Kekkelenberg (1999).
64 Biodiversity indicator frameworks may play a key role in assessing the impacts of the project or policy under consideration.See, for further information, the guidance, lessons learned and list of indicators provided in the note by the Executive Secretaryon monitoring and indicators prepared for the ninth meeting of SBSTTA (UNEP/CBD/SBSTTA/9/10) (paragraph 8 of decisionVII/8, on national-level monitoring programmes and indicators, refers to this document).
65 See Nichols et al. 2000 for further discussion.

27
There are very few applications of MCA in developing countries. MCA is often difficult to use andunderstand for lay people. Most variants require an expert to explain how the method works, and to helpusers to define options, criteria and weights, as well as to choose the appropriate aggregation procedure.The method also makes no claim to be searching for economically efficient outcomes. Like CEA, alloptions under consideration may be inefficient.
CBA and MCA are not mutually exclusive. CBA can be used to define a set of efficient options, that is,options where net benefits are positive (that is, gross benefits are greater than costs). Options with neteconomic benefits of similar magnitude could be further assessed by MCA so as to identify the variousnon-economic trade-offs associated with the alternative courses of action.
2. Deliberative and participatory approaches
Deliberative processes (sometimes also referred to as “deliberative and inclusionary processes” or“DIPs”) include participatory appraisal, focus groups, Delphi approach, consensus conferences andcitizen’s juries. These methods are aimed at creating better informed decisions that are owned by andhave the broad consent of all relevant actors and stakeholders. They therefore contrast to the more“technocratic” approaches such as cost-benefit or cost-effectiveness analysis or even MCA. DIPs seek tobuild a process of defining and redefining interests that stakeholders introduce as the collectiveexperience of participation evolves. As participants become more empowered, i.e. more respected andmore self-confident, so it is assumed they may become more ready to adjust, to listen, to learn, and toaccommodate to a greater consensus.66
In many countries, the benefits emanating from some ecosystem services are well known to local andindigenous communities—it is captured by their traditional knowledge. As long as these communitiesare adequately included in economic valuation exercises (for instance, by ensuring that they are ade-quately represented in the population sample for a stated preference study), the value they put on theseecosystem services would be captured by economic valuation.
However, traditional knowledge of ecosystem services is often not adequately received by the wider pub-lic. Here, deliberative and participatory approaches may play an important role in promoting the widerrecognition of this knowledge. It may also contribute, with the approval and involvement of these com-munities, to its wider application including within economic valuation studies. For instance, it wasexplained above that a limitation of stated preference techniques is that respondents cannot typicallymake informed choices if they have a limited understanding of the issue in question. Deliberative andparticipatory approaches, by disseminating pertinent knowledge, may play an important role in broad-ening the understanding on the issue of all stakeholders.67
The adoption of such methods varies across countries, with some having formal processes for undertak-ing participation in the formulation of contentious area of public policy. The use of economic informa-tion in these methods is entirely at the group’s discretion. Hence, valuation data may or may not consis-tently inform the outcome of such processes, and they cannot guarantee that outcomes are an efficient
An exploration of tools and methodologies for valuation of biodiversity
66 De Groot et al. 2006, p. 19 describes in detail the process of identifying and involving relevant stakeholders.67 See studies IV and IX as examples of such application of deliberative approaches.

An exploration of tools and methodologies for valuation of biodiversity
use of public resources. Moreover, in many countries, the relative weight that the outcome of theseprocesses is given in final decisions is unclear.
3. Satisficing
A satisficing approach can be described as an assessment procedure to obtain an outcome that is goodenough, rather than seeking the best solution. The approach can thus be contrasted with an optimizingapproach that seeks to identify the “best” solution, as is the case, for example, with cost-benefit analysisor multi-criteria analysis. For the implementation of a satisficing approach, one or more criteria need tobe identified that the measure is expected to fulfil. The subsequent analysis can then either investigateall possible measures to achieve this objective(s), and list the successful options without ranking them.Alternatively, the analysis may also be terminated once the first option has been identified that fulfils therequirement(s).
In decision theory, the term satisficing is also used to refer to an optimization process where all costs,including the cost of the optimisation calculations and the cost of getting information for use in thosecalculations, are considered. This takes account of the fact that, in some cases, the costs of gathering andprocessing information may not be justified by the subsequent improvements in decision-making thatcan be achieved through the improved information. This is likely to be the case in decision situationswith a low level of complexity, where only few well-defined options are available, where the targets areclearly specified and where little or no trade-offs between targets are necessary.
One difficulty associated with such an approach is that the added value of better information for thedecision-making process may only be apparent if this information is available: if it is not available, itmay be hard to assess in what way better information might have changed the results of the decision,and what impact this would have had.
4. Liability and redress
In some countries, the legal framework for liability and redress priorities has been an important driverfor the analysis and refinement of valuation methods. For instance, in the United States, the ability touse valuation information as the basis for legal redress has been a significant impetus for considering thevalue of damaged biological resources. High damage costs, derived including through non-marketvaluation have given plaintiffs a large incentive to demonstrate the monetary value of any damagedresources. As a result, valuation methods, and contingent valuation in particular, has come underconsiderable scrutiny in high profile legal cases such as the Exxon Valdez oil spill, with guidelines havingbeen developed for the appropriate use of stated preference techniques (NOAA 1994)68 Under thenatural resource damage assessment (NRDA) regulations of the National Oceanic and AtmosphericAdministration (NOAA), valuation (the so-called value-to-value approach) is applicable when theinjured and restored resources and services are not of the same type, quality, and value, and is used tocalculate the value of gains from the proposed restoration actions and the value of the interim losses.69
28
68 Theses guidelines, developed by a panel of eminent economists, are now generally accepted as authoritative for a reliablesurvey methodology in contingent valuation. See under III 6 above for further discussion.
69 See Penn 2005 for a brief summary. Interim losses are losses of welfare incurred to persons during the time that it takes foran ecosystem to recover or to be restored. If an ecosystem cannot be fully restored, or takes a long time to do so (e.g. treesgrowing back), interim losses can be large.
29
The European Union also explored the legal basis for using of non market values as evidence. UnderDirective 2004/35/CE on environmental liability with regard to the prevention and remedying of envi-ronmental damage, it is within the discretion of the competent authority to use economic valuation todetermine the extent of the necessary complementary and compensatory remedial measures, if it is notpossible to use the so-called resource-to-resource or service-to-service equivalence approaches.70
Compensatory remediation shall be undertaken to compensate for the interim loss of natural resourcesand services pending recovery. This compensation consists of additional improvements to protectednatural habitats and species or water at either the damaged site or at an alternative site. It does not con-sist of financial compensation to members of the public. If valuation of the lost resources and/or serv-ices is practicable, but valuation of the replacement natural resources and/or services cannot be per-formed within a reasonable time-frame or at a reasonable cost, then the competent authority maychoose remedial measures whose cost is equivalent to the estimated monetary value of the lost naturalresources and/or services.
In many other countries, however, weak legal systems, poorly defined and enforced property rights overdamaged resources, and/or the fact that many damaged resources are governed by customary law orpractices that are not necessarily recognized by legal systems in a national context, mean that (formal)legal drivers for the application of valuation tools are currently weak to non-existent.
c. conclusions
The use of formal appraisal methods and the nature of decision-making processes generally vary acrosscountries. Even when formally documented procedures are in place it is impossible to generalize howand when different methods are most appropriate. In general, methods such as cost-benefit analysisseem to be less controversial, and are commonly applied, when financial costs and benefits are relativelyclear to identify and when for instance social impacts are comparatively small. There seems to be a needto include decision making tools that are more consensual and participation oriented, in particularwhen external costs have significant social consequences, when they are captured by traditionalknowledge that is not widely available, and/or when the local socio cultural systems pose a seriouslimitation to valuation based solely on economic terms. The combined utilization of different decisionmaking tools may be useful.71
Mirroring the research progress made in developing reliable tools and methodologies, valuation studiesin many countries play an increasing role in contemporary environmental policies, as they provide addi-tional knowledge to support better decision-making. However, the integration of valuation informationinto decision-making frameworks still seems to be not satisfactory in many countries.
Conducting primary valuation studies is time-consuming and costly. Given the limited budget andmanpower in many administrations, the need to conduct or manage primary research can pose a strainon the available resources. Capacity, both in conducting valuation studies and in overseeing their prepa-
An exploration of tools and methodologies for valuation of biodiversity
70 Under these approaches, actions that provide natural resources and/or services of the same type, quality and quantity as thosedamaged shall be taken, or alternative natural resources and/or services shall be provided. See Annex II, paragraphs 1.2.2 and1.2.3, of the Directive. See EC (2001) for background information. In Canada, a recent Supreme Court decision confirmed theacceptance of valuation approach to support damage valuation.
71 See studies studies IV and IX as examples.

An exploration of tools and methodologies for valuation of biodiversity
ration and ensuring their quality, is often limited. Problems are exacerbated when the rationale for val-uation is poorly conveyed to higher-level administrators. In many cases, the people that matter can beleft with an impression that new research will not produce added value for the quality of decision-mak-ing. More commonly, poorly conducted studies,72 with limited follow-up, can leave officials with animpression that valuation studies can only tell them what they already know. Resources that flow intothe studies become harder to justify.
Hence, it is important to apply and interpret valuation results in their appropriate context and to beaware of the pitfalls involved. However, this applies to most methods and techniques, whether in eco-nomics or in any other field. Many basic criticisms levelled at valuation can be avoided when best prac-tice is followed while conducting valuation studies; for example, a contingent valuation study can wellbe integrated with and extended into a public participation exercise. The main question is rather—giventheir high costs and the expertise required—how their use can be targeted at those cases where valua-tion studies actually provide an added value in terms of improved decision-making.
Resistance to the use of valuation in OECD countries has in recent years been addressed by attempts toproduce both valuation guides and protocols as well as standard environmental values for use in bene-fits transfer. These efforts have revealed to be fruitful in terms of increasing the credibility and accept-ability of valuation methods. More importantly, these resources have also simplified and reduced thecost of undertaking policy appraisal.
30
72 For instance, a problem frequently identified in the literature is high values derived though contingent valuation studies. Formany observers excessive stated preferences defy intuition and apparently discredit the method. See section II B above forfurther discussion.

31
Valuation is beginning to play a significant role in biodiversity management decisions in OECDcountries. Many Governments espouse its use, with the predominant framework being cost-benefitanalysis, even if they acknowledge the technical difficulties of consistent implementation of valuation indecision-making. While it would be premature to suggest that biodiversity values are always consistentlyconsidered, the important thing to note about the experience is that there is a formally documentedapproach that should be followed in determining resource allocations and in setting priorities.73
International organizations such as the OECD, the European Community, the World Bank and theGlobal Environment Facility (GEF) have all advocated greater use of valuation in policy making andproject design. Other United Nations organizations, such as the United Nations DevelopmentProgramme (UNDP), the United Nations Environment Programme (UNEP) and the Food andAgriculture Organization of the United Nations (FAO) have, at various times, either sponsored meet-ings on the topic or undertaken projects, which have a strong biodiversity valuation component. Severalgovernments have also facilitated greater use through the sponsorship of meetings and informationdatabases sources such as EVRI or ENVALUE, mentioned above.74
Similarly a number of non-governmental organizations, such as IUCN, WWF and ConservationInternational, have continued to sponsor research and wider application and dissemination about bio-diversity valuation, and its role in creating incentives for conservation and sustainable management ofbiodiversity.
A combination of poor institutional capacity and a lack of trained staff can generally be identified as themain barriers to further promotion of valuation as a biodiversity management tool, in particular indeveloping countries and countries with economies in transition. Overall, valuation can normally beadvanced in most countries by the development of high profile studies that help to raise the issue of bio-diversity in national debates.75 Many countries have reached this stage, but many others have not. Thiscritical phase requires international collaboration and enhancement of domestic capacity.
a. institutional capacity
Poor institutional capacity is often an important impediment for consistent policy and regulatoryappraisal. However, even where staff and infrastructure are relatively adequate, institutional weaknessmanifests in poorly defined lines of responsibility and the absence of clearly defined governmentalpractices for appraising basic policy changes such as projects and regulations.
An exploration of tools and methodologies for valuation of biodiversity
V. STRENGTHEN INTERNATIONAL COLLABORATIVE PARTNERSHIPS FORASSESSING BIODIVERSITY VALUES
73 In the United Kingdom for example, there is clear guidance on the importance of considering non-market values in centralgovernment project and regulatory appraisal. This guidance in nominally the responsibility of the Treasury (Ministry ofFinance), which advocates good appraisal practice across a range of government ministries, including environment andtransport. This model of appraisal practice is mirrored in several other countries.
74 Other databases include the Ecosystem Services Database (ESD) developed by the Gund Institute for Ecological Economics,University of Vermont; the Valuation Study Database for Environmental Change in Sweden (VALUEBASE SWE; see http://www.beijer.kva.se/valuebase.htm ), and the Review of Externality Data database developed by the European Commissionunder the Energy, Environment and Sustainable Development Program of DG Research (http://www.red externalities.net/ ).Lantz and Slaney (2005) provide a recent evaluation of different valuation databases.
75 Typically one finds that an exercise such as a national accounts adjustment or one study of an endemic or charismatic speciesis sufficient to kick-start a national debate on the topic.

An exploration of tools and methodologies for valuation of biodiversity
These institutional weaknesses can be summarized as a checklist, which can in turn provide a basis forthe identification of needs:
(a) Does a single ministry or agency hold a clearly defined remit for biodiversity management?
(b) Is there a formally documented procedure for conducting environmental impact assessmentsof new projects and regulations?
(c) Is there a formally documented economics appraisal process for: (i) new projects; and (ii) newregulations?
(d)Do the project or regulatory appraisal procedures include quantitative as opposed to qualitativeassessments of costs and benefits?
(e) What role does cost-benefit analysis play in appraisal?
(f) Do formal guidelines for cost-benefit analysis exist?
(g) Do formal guidelines include guidance on how to deal with non-market costs and benefits andbiodiversity in particular?
(h)What is the legal status of the findings of government appraisals?
(i) Who conducts any appraisal and how is the process audited for quality control?
b. capacity building and training
The answers to many of the preceding questions are likely to be qualified by the issue of adequatecapacity building and training. At the governmental level, capacity needs to be enhanced, byappropriate training, for conducting the actual valuation studies, for improved oversight and auditingfor quality control, as well as for putting valuation results to good use in governmental decision-makingby an effective and credible follow-up. Moreover, training could also include staff of relevant non-governmental organizations. In accordance with national needs and priorities, institutional capacitycould be enhanced, for instance by establishing or strengthening of specialized agencies or agency units.
As regard the conduct of the actual studies, two levels of training seem to be required: first, basic cours-es are needed to provide non-economists with sufficient insights into the logic of valuation and envi-ronment economics. To meet this objective, easily readable manuals could also be developed and dis-seminated. Courses may also be needed to provide economists with basic scientific background on thelinkages between biodiversity resources and functions and ecosystem services, with a view to raise theirawareness of the need for inter-disciplinary cooperation. Second, more specialized training is needed forthose supervising the conduct of valuation studies and steering project implementation, which is likelyto be best undertaken by economists equipped with prior knowledge in microeconomics. Well-plannedmodules can normally be sufficient to impart the basics of environmental valuation to trained econo-mists. This activity could also include the training of trainers.
1. International cooperation in enhancing domestic capacities
Most expertise in valuation is arguably located in several OECD countries that have established researchinstitutions specifically in the area, and it appears to be important to tap into this expertise as a basis for
32

33
sponsoring training arrangements such as regional workshops on biodiversity valuation.
In non-OECD countries, notable centres of expertise are, for instance, the Environment and EconomicsProgram for South East Asia (EEPSEA)76 and the Forum for Economics and the Environment locatedin South Africa.77 EEPSEA offers courses that are predominantly for post-Masters level ability in eco-nomics. The South African initiative coordinates exchange of information and training between thecountries of Southern Africa. In addition, in many developed countries, many university departmentsoffer exchange opportunities that are normally supported by their own national development ministries(e.g., the Swedish International Development Agency (SIDA), Danish Ministry for Foreign Affairs).Short-term courses are offered by other agencies including the World Bank, which offers a course inenvironmental economics and development policy.
Another means of extending training is for bilateral arrangements between agencies for temporary sec-ondment. For instance, the Overseas Development Institute (ODI) in the United Kingdom has been run-ning such a fellowship scheme for several decades. The scheme sends young postgraduate economists towork in the public sectors of developing countries in Africa, the Caribbean and the Pacific on two-yearcontracts. It has worked in over 30 countries concentrating on those most in need of trained staff.Currently, 20 developing country Governments and three regional bodies are partners in the scheme.
The demand-led nature of the scheme means that it is an attractive way for Governments to buildcapacity in their public sectors and improve the execution of economic policy. Its excellent reputationand unique form of technical assistance means that it is held in high regard by the development com-munity. The costs of the scheme are shared between the recipient Government and ODI. ODI financesthe scheme primarily under grants provided by the Department for International Development(DFID) in the United Kingdom, the Commonwealth and AusAID. In recent years, the scheme has beenpicking a number of graduates in environmental economics who have gone to work in environmentrelated agencies.
2. Web-based resources
Possibly the most cost-effective partnership arrangements can de developed using web access. TheWorld Bank offers a range of e-learning resources. Moreover, several sites provide good overviews ofenvironmental valuation. A simple and accessible site is provided by Dennis King, of the University ofMaryland, and Marisa Mazzotta, of the University of Rhode Island.78 This site sets out all the relevantissues in relation to valuation and contains some practical demonstrations of how to collect relevantdata. The site provides an excellent introduction, but those who follow it probably need to be faced withmore complex case studies to gain hands-on experience. In this regard, other web-based learning andtraining resources are also available, with varying levels of theory and applied examples. For instance:
(a) A UNEP sponsored training guide on the valuation of biological diversity for nationalbiodiversity action plans and strategies is available at the IUCN biodiversity economics site;79
An exploration of tools and methodologies for valuation of biodiversity
76 http://www.idrc.ca/en/ev-7890-201-1-DO_TOPIC.html77 http://www.econ4env.co.za/.78 http://www.ecosystemvaluation.org/79 http://www.biodiversityeconomics.org/valuation/topics-612-00.htm .

An exploration of tools and methodologies for valuation of biodiversity
(b) The IUCN site also provides access to online guidelines for protected area managers on theeconomic values of protected areas;80
(c) The site of the Ramsar Convention on Wetlands provides access to the Ramsar guidance thevaluation of wetlands;81
(d)A recent report prepared by the World Bank in cooperation with The Nature Conservancy andIUCN, on assessing the economic value of ecosystem conservation, is also available online.82
3. Enhancing global capacities: international information systems and databases
A number of other web sites contain valuation data for more advanced practitioners. Most noteworthyis a range of sites developed to facilitate benefits transfer, such as the Environment Valuation ReferenceInventory (EVRI) database sponsored by number of countries and hosted by Environment Canada, aswell as some other initiatives discussed in paragraph 99 above. The inventory provides a compilation ofprimary valuation data from studies conducted in different countries around the world. The basic ideais for the user to define a resource to be valued (e.g. a rare species or a water body), and to search thedatabase for studies that have generated similar information. If the studies are suitably similar, then thedatabase provides the basis of a transfer value that fills in an information gap at the site of interest.
Benefits transfer is still under development, with numerous academic research exercises focused on thevalidity of transferring benefit or willingness-to-pay unit values or the statistical functions that predictthese values. Nevertheless, the use of value transfer seems to be an appealing way to advance the use ofvaluation information in particular in resource poor countries where time and resource constraints willtypically prevent extensive primary research in many decision-making situations.
Existing databases contain a variety of studies from different developing countries, but are not specifi-cally tailored to developing country needs, either in terms of the likely valuation studies included, or interms of the required modifications, for instance, exchange rates and currency deflators, needed totranslate values for use. Therefore, a useful collaborative initiative could be to further develop existingtransfer databases and to increase cooperation among database providers with a view to increase com-patibility and inter-operability, such as through the establishment of common criteria for auditing val-uation work, standardized coding procedures, etc.83 Access fees should not represent a substantial hur-dle in order to ensure maximum use of the databases in particular by decision-makers and researchersin developing countries.
c. fostering research
As explained above, considerable progress has been made in the last decades in developing reliablevaluation tools and protocols for their application, in particular on stated-preference techniques andbenefit transfer. However, challenges for further research and development also remain, in particular
34
80 http://biodiversityeconomics.org/valuation/topics-34-00.htm .81 http://www.ramsar.org/lib_valuation_e.htm . See also de Groot 2006.82 http://www-wds.worldbank.org.83 See Lantz and Slaney 2005 for further discussion.
35
with regard to the conditions for validity and robustness of the benefits transfer approach.Furthermore, further research directed at the development of a biodiversity adjustment for nationalaccounting seems to be another important means to have biodiversity losses more reflected inmacroeconomic discourse.
It was also explained earlier that valuation typically addresses ecosystem services, but not biodiversityas such. Inferring the value of biodiversity requires an in-depth understanding of the links betweenbiological diversity, biodiversity functions, and the services that are subsequently generated. Despiterecent progress made in this regard, as summarized in the Millennium Ecosystem Assessment reports,this understanding is still limited and fragmented, with many unresolved questions remaining on thespecific nature of interdependencies between the structure and diversity of biotic communities, thefunctioning of ecosystems, and the generation of ecosystem services under different states of nature orenvironmental conditions. Further national and international research in addressing these importantquestions, including research cooperation at the international level, is therefore crucial. The involve-ment of all relevant stakeholders, including biodiversity-dependent industry, should be ensured, as itwill gear research towards developing practical mechanisms based on plausible, realistic situations.New insights on the relationship between changes in biodiversity, for example through sudden shifts inecosystem equilibria, and the generation of ecosystem services may lead to the further improvement ofexisting tools as well as to the development of new tools and methodologies for the valuation of bio-diversity and ecosystem functions.
An exploration of tools and methodologies for valuation of biodiversity

An exploration of tools and methodologies for valuation of biodiversity
Arrow, K.; R. Solow; P. Portney; E. Leamer; R. Radner; H. Shuman (1993): “Report of the NOAA panelon Contingent Valuation” Resources for the Future, Washington.
Aylward, B. (2004): Land Use, Hydrological function and economic valuation. In: Forests, Water andPeople in the Humid Tropics,
Barbier, E.B., et al. (1995): “The economic value of biodiversity.” In: UNEP: Global BiodiversityAssessment. Cambridge University Press, Cambridge, UK, 823–914.
Barbier, E.B.; B.A. Aylward (1996): “Capturing the Pharmaceutical Value of Biodiversity in a DevelopingCountry” Environmental and Resource Economics, 8, 157–181.
Barbier, E.B.; M. Acreman; D. Knowler (1997): Economic Valuation of Wetlands. Published by the RamsarConvention Bureau, Gland, Switzerland.
Bateman, I. At al. (2003): Economic Valuation With Stated Preference Techniques: A Manual. EdwardElgar.
Bishop, J.T. (1998): The Economics of Non Timber Forest Benefits: An Overview. EnvironmentalEconomics Programme Paper No. GK 98–01, IIED, London.
Bishop, J.T. (1999): Valuing Forests: A Review of Methods and Applications in Developing Countries. IIED,London.
Bockstael, N.E., K.E. McConnell, and I.E. Strand (1991): Recreation. In: Measuring the Demand forEnvironmental Quality, J.B. Braden and C.D. Kolstad (eds.), Contributions to Economic Analysis No.198, Amsterdam, North Holland.
Boumans, R.; R. Costanza et al. (2002): Modeling the dynamics of the integrated earth system and thevalue of global ecosystem services using the GUMBO model. Ecological Economics, 41, 529–560.
Braden, J.B. and C.D. Kolstad (eds.) (1991): Measuring the Demand for Environmental Quality.Contributions to Economic Analysis No. 198, North-Holland, Amsterdam.
Brouwer, R. (2000): “Environmental Value Transfer: State of the Art and Future Prospects”. EcologicalEconomics Vol.32, No.1, pp.137–152.
Camm, J. D. et al (1996): “A note on optimal algorithms for reserves site selection.” BiologicalConservation, 78353–355.
Cavendish, W. (1999): Empirical Regularities in the Poverty-Environment Relationship of African RuralHouseholds. Centre for the Study of African Economies, working paper series 99–21, London.
Cavendish, W. (2003): How Do Forests Support, Insure and Improve the Livelihoods of the Rural Poor: AResearch Note. Center for International Forestry Research, Bogor, Indonesia.
Christie, M. et al. (2004): Developing measures for measuring changes in biodiversity: final report. Reportto the Department for Food, Environment and Rural Affairs (DEFRA), London, United Kingdom.
Callicott, J.; Baird (1999): Beyond the Land Ethic: More Essays in Environmental Philosophy. Albany, NY:SUNY Press.
Colombia (2002): Informacion sobre incentives a la conservacion y use sostenible de la biodiversidad enColombia. Submissions to the Secretariat of the Convention on Biological Diversity. Seehttp://www.biodiv.org/programmes/socio-eco/incentives/case-studies.aspx .
Conrad, J. M. (1997): “On the option value of old-growth forest” Ecological Economics 22, pp. 97–102.
36
REFERENCES
37
Costanza, R. et al. (1997): The value of the world’s ecosystem services and natural capital. Nature, 387,pp. 253–260.
Daily, G.; S. Dasgupta (2001): “Ecosystem Services, Concept of.” Encyclopedia of Biodiversity, volume 2.Academic Press.
Dasgupta, P. (2002): Human Well-being and the Natural Environment. Oxford: Oxford University Press.
Dasgupta, P.; K.-G. Mäler (2000): “National net product, wealth, and social well-being.” Environmentand Development Economics 5, 69–93.
Developing measures for valuing changes in biodiversity, UK department for Environment, Food andRural Affairs http://statistics.defra.gov.uk/esg/reports/biovalue/mainrep.pdf
De Groot et al (2006): Valuing wetlands. Guidance for valuing the benefits derived from wetland ecosystemservices. Ramsar Technical Report Number 3; CBD Technical Series 27.
Dixon, J.A., L.F. Scura, R.A. Carpenter, and P.B. Sherman (1994): Economic Analysis of EnvironmentalImpacts. Earthscan, London.
DTLR. 2001. Multi Criteria Analysis: A Manual. http://www.dtlr.gov.uk/about/multicriteria.
EC (2001): Study of the Valuation and Restoration of Biodiversity Damage for the Purpose of EnvironmentLiability. Final Report, prepared by MacAllister Elliott and Partners Ltd and Economics for theEnvironment Consultancy Ltd (Eftec). European Commission. Directorate-General Environment.May 2001.
Eftec (2005): The Economic, Social and Ecological Value of Ecosystem Services: A Literature Review, Finalreport for the Department for Environment, Food and Rural Affairs. Economic for the EnvironmentConsultancy Ltd.
FAO (2001): Applications of the contingent valuation method in developing countries. A survey. FAOEconomic and Social Development Paper 146, Food and Agriculture Organization of the UnitedNations, Rome.
Farber, S.C., R. Constanza and M.A. Wilson (2002): Economic and Ecological concepts for valuingecosystem services. Ecological Economics, 41, 375–392.
Firn, R. D. (2003): “Bioprospecting: Why is it so unrewarding?” Biodiversity and Conservation 12, 207–16.
Freeman, A.M. (1979): The Benefits of Environmental Improvements, Theory and Proactive. JohnsHopkins University Press, Baltimore, MD.
Freeman, A.M. (1993): The Measurement of Environmental and Resource Values: Theory and Methods.Resources for the Future, Washington, D.C.
Garrod, G. and K. Willis (1992): “The Environmental economic impact of woodland: A two-stagehedonic price model of the amenity value of forestry in Britain.” Applied Economics 24, 715–728.
Garrod, G. and K. Willis (1999): Economic Evaluation of the Environment. Edward Elgar, Cheltenham.
Godoy, R., Lubowski, R. and Markandaya, A. (1993), “A method for the economic valuation of non-timber forest products”, Economic Botany, 47:220–233.
Grimes, A. et al. (1994), “Valuing the Rain Forest: The Economic Value of Non-timber Forest Productsin Ecuador”, Ambio, 23:405–410.
Hanemann, W.M. (1991): Willingness to pay and willingness to accept: How much can they differ?American Economic Review 81(3), 635–647.
An exploration of tools and methodologies for valuation of biodiversity

An exploration of tools and methodologies for valuation of biodiversity
Hanemann, W.M. (1992): Preface. In: Pricing the European Environment, S. Navrud (ed.), ScandinavianUniversity Press, Oslo.
Hanley, N.; S. Craig (1991): “Wilderness development decisions and the Krutilla-Fisher model: the caseof Scotland’s flow country.” Ecological Economics 4, 145–164.
Hanley, N.; K. Willis; N. Powe and M. Anderson (2002): Valuing the Benefits of Biodiversity in Forests.Report to Forestry Commission Edinburgh.
Heimlich, R.E. et al. (1998): Wetlands and Agriculture: Private Interests and Public Benefits. AgriculturalEconomic Report No. 765.10, ERS, USDA, Washington, D.C.
Herriges, J.A. and C.L. Kling (eds.) (1999): Valuing Recreation and the Environment: Revealed PreferenceMethods in Theory and Practice. Edward Elgar, Northampton.
Hiller, A.: A quasi-realist environmental ethic? Paper prepared for the joint meeting of the ISEE/IAEP,June 2, 2005.
Holmes, T. and W. Adamowicz (2003): “Attribute Based Methods.” In: A Primer on Nonmarket Valuation,P.A. Champ, K.J. Boyle, and T.C. Brown (eds.), Kluwer.
Hufschmidt, M.M., D.E. James, A.D. Meister, B.T. Bower, and J.A. Dixon (1983): Environment, NaturalSystems, and Development: An Economic Valuation Guide. Johns Hopkins University Press, Baltimore,MD.
Humavindu, M. N. (2002): Economics without markets: Policy inferences from nature-based tourismstudies in Namibia. Directorate of Environmental Affairs (DEA) research Discussion paper 49,Ministry of Environment and Tourism, Windhoek, Namibia.
IUCN (1998): Economic Values of Protected Areas. Guidelines for Protected Area Managers. WorldCommission on Protected Areas (WCPA), Best Practice Protected Area Guidelines Series No. 2.
James, A. N. , Green, M. J. B. & Paine, J. R. (1999) A Global Review of Protected Area Budgets and Staff(World Conservation Monitoring Centre, Cambridge, U.K.).
Johansson, P.O. (1994): The Economic Theory and Measurement of Environmental Benefits. CambridgeUniversity Press, Cambridge, UK.
Kaiser, B. and J. Roumasset (2002): Valuing indirect ecosystem services: The case of tropical watersheds.Environment and Development Economics 7, 701–714.
Koziell, I.; J. Saunders (eds) (2001): Living off Biodiversity: Exploring Livelihoods and Biodiversity Issuesin Natural Resources Management. IIED, London.
Krutilla, J.V.; A. Fisher (1975): The economics of natural environments: studies in the valuation ofcommodity and amenity resources. Johns Hopkins University Press, Baltimore, Maryland.
Kumari, K. (1995): An Environmental and economic assessment of forest management options: A casestudy of Malaysia. Environment Department Working Paper No.26, World Bank, Washington, DC.
Lampietti, J. and J.A. Dixon (1995): To See the Forest for the Trees: A Guide to Non-Timber Forest Benefits.Environment Department Paper No. 13, World Bank, Washington, D.C.
Lantz, Van; G. Slany (2005): An Evaluation of Environment Valuation Databases around the World. Reportfor Environment Canada and EVRI members. Faculty of Forestry and Environment Management.University of New Brunswick, Fredericton, NB, Canada.
38

39
Louviere, J., D. Henscher, and J. Swait (2000): Stated Choice Methods—Analysis and Application.Cambridge University Press, Cambridge, UK.
Mäler, K.-G.; R.E. Wyzga (1976): Economic Measurement of Environmental Damage. OECD, Paris.
Mantua, U.; M. Merlo; W. Sekot; and B. Welcker (2001): Recreational and Environmental Markets forForest Enterprises: A New Approach Towards Marketability of Public Goods, CABI Publishing,Wallingford.
Markandya, A. and D. Pearce (1991): “Development, the environment, and the social rate of discount.”World Bank Research Observer 6/2.
Menkhaus, S. and Lober, D.J. (1996), “International Ecotourism and the Valuation of TropicalRainforests in Costa Rica”, Journal of Environmental Management, 47:1–10.
Merlo, M. and L. Croitoru (Eds.) (2005): Valuing Mediterranean Forests: Towards Total Economic Value,CABI Publishing, Wallingford.
Metrick, A. and M. L. Weitzman. (1996): “Patterns of behavior in endangered species preservation.” LandEconomics, 72; 1, pp. 1–16.
Metrick, A. and M.L. Weitzman. (1998): “Conflicts and choices in biodiversity preservation.” Journal ofEconomic Perspectives, 12; 3, pp. 21–34.
Millennium Ecosystem Assessment (2003): Ecosystems and human well-being: a framework forassessment. Millennium Ecosystem Assessment. Island Press, Washington.
Mitchell, R.C. and R. Carson (1989): Using Surveys to Value Public Goods: The Contingent ValuationMethod. Resources for the Future, Washington, DC.
Navrud, S. and R.C. Ready (eds.) (2002): Valuing Cultural Heritage: Applying Environmental ValuationTechniques to Historic Buildings, Monuments and Artifacts. Edward Elgar, Cheltenham, UK.
NOAA (1994): Oil Pollution Act of 1990: Proposed Regulations for Natural Resource Damage Assessments,National Oceanic and Atmospheric Administration, US Department of Commerce, Washington,D.C.
Nordhaus, William D.; Edward C, Kokkelenberg (eds) (1999): Nature’s Numbers: Expanding the NationalEconomic Accounts to include the Environment. Report for the National Research Council. Washingtond.C.: National Academy Press.
Nunes, P. and J.C. van den Bergh. (2001): “Economic valuation of biodiversity: sense or nonsense?”Ecological Economics, 39; 2, pp. 203–222.
OECD (2002): Handbook of Biodiversity Valuation: A Guide for Policy Makers. prepared by D. Pearce,; D.Moran; and D. Biller. OECD, Paris.
Pagiola, S. (1996): Economic Analysis of Investments in Cultural Heritage: Insights from EnvironmentalEconomics. World Bank, Washington, DC.
Pagiola, S.; K. v. Ritter; J. Bishop (2005): Assessing the economic value of ecosystem conservation. WorldBank Environment Department Paper No. 101, prepared in collaboration with The NatureConservancy and IUCN—The World Conservation Union.
Pearce, D.W. (1993): Economic Values and the Natural World. Earthscan, London.
Pearce, D. (2001): “Valuing biological diversity: issues and overview”. In: OECD: Valuation of BiodiversityBenefits; Selected Studies. Paris, OECD, pp. 27–44.
An exploration of tools and methodologies for valuation of biodiversity

An exploration of tools and methodologies for valuation of biodiversity
Pearce, D.W.; A. Markandya (1989): The Benefits of Environmental Policy: Monetary Valuation. OECD,Paris.
Pearce, D. W.; R. K. Turner (1990): Economics of Natural Resources and the Environment. Johns HopkinsUniversity Press: Baltimore.
Pearce and Moran (1994): The Economic Value of Biodiversity. In Association with the BiodiversityProgramme of IUCN. Earthscan Publications Ltd, London.
Penn, T. (2005) A Summary of the Natural Resources Damage Assessment Regulations under the UnitedStates Oil Pollution Act. Mimeo prepared by Tony Penn, National Oceanic and AtmosphericAdministration. http://europa.eu.int/comm/environment/liability/tp_enveco.pdf
Peters, C.M., Gentry, A.H. and Mendelsohn R.O. (1989), “Valuation of an Amazonian Rainforest”,Nature, 339 (June):655–656.
Peterson, Gary; Allen, Craig R.; Holling, C.S. (1998): “Ecological Resilience, Biodiversity, and Scale”,Ecosystems, 1, pp. 6–18
Polasky, S., A. Solow and J. Broadus (1993): “Searching for uncertainty benefits and the conservation ofbiological diversity.” Environmental and Resource Economics, 3; 2, pp. 171–181.
Polasky, S.; A. Solow (1995). “On the value of a collection of species.” Journal of Environmental Economicsand Management 29, 298–303.
Postel, S. L.; B. H. Thompson, Jr. (2005): “Watershed protection: Capturing the benefits of nature’s watersupply services.”
Powe, N.A.; G.D. Garrod; and K.G. Willis (1995): “Valuation of urban amenities using an hedonic pricemodel.” Journal of Property Research 12, 137–147.
Rausser, G.C., and A.A. Small (2000): “Valuing research leads: Bioprospecting and the conservation ofgenetic resources.” Journal of Political Economy 108(1): 173–206.
Reid, W. V.; R. T. Watson; H. A. Mooney (2005): Ecosystem Services—Must people pay for these services?Mimeo.
Rietbergen-McCracken, J. and H. Abaza (2000): Environmental Valuation. A Worldwide Compendiumof Case Studies. Earthscan, London.
Seroa da Motta, R. (1998): Manual para Valoração Económica de Recursos Ambientais. MMA, Brasilia.
Seroa da Motta, R. (ed.) (2001): Environmental Issues and Policy Making in Developing Countries. EdgarElgar Publishing, London.
Shogren, J. and J. Hayes (1997): Resolving differences in willingness to pay and willingness to accept: Areply. American Economic Review 87, 241–244.
Shyamsundar, P and R. Kramer (1997): “Biodiversity Conservation—At What Cost? A Study ofHouseholds in the Vicinity of Madagascar’s Mantadia National Park.” in: Ambio 26/3, pp. 180–184.
Simpson, D., Sedjo, R. and Reid, J. (1996): “Valuing Biodiversity for use in Pharmaceutical Research.”Journal of Political Economy 104/1, pp. 163–185.
Solow, A., S. Polasky and J. Broadus (1993): “On the measurement of biological diversity.” Journal ofEnvironmental Economics and Management, 24; 1, pp. 60–68.
Smith, V. K. (1996): Estimating Economic Value for Nature: Methods for Non-market Valuation.Northampton: Edward Elgar.
40

41
Turner, K., J. Paavloa, P. Cooper, S. Farber, V. Jessamy, and S. Georgiou (2002): Valuing Nature: LessonsLearned and Future Research Directions. CSERGE Paper No. EDM-2002–05, CSERGE, London.
Vane-Wright, R. I., Humphries, C. J. & Williams, P. H. (1991): “What to protect?—Systematics and theagony of choice.” Biological Conservation, 55: 235–254.
Weikard, H.-P. (2002), “On the quasi-option value of biodiversity and conservation”, Paper presented atthe Conference ‘Risk and Uncertainty in Environmental Economics’, Wageningen, June 2002.
Weitzman, M. L. (1993): “What to preserve? An application of diversity theory to crane conservation.”Quarterly Journal of Economics.; 108157–183.
Weitzman, M.L. (1998): “The Noah’s ark problem.” Econometrica, 66; 6, pp. 1279–1298.
Willis, K.G. and J.T. Corkindale (eds.) (1995): “Environmental Valuation: New Perspectives”. CABInternational, Wallingford.
World Bank (2006): Where is the Wealth of Nations? Measuring Capital for the 21st Century,Washington DC
Young, R.A.; R.H. Haveman (1985): “Economics of water resources: A survey.” In: Handbook of NaturalResource and Energy Economics Vol. II, A.V. Kneese and J.L. Sweeney (eds.), North Holland,Amsterdam.
An exploration of tools and methodologies for valuation of biodiversity
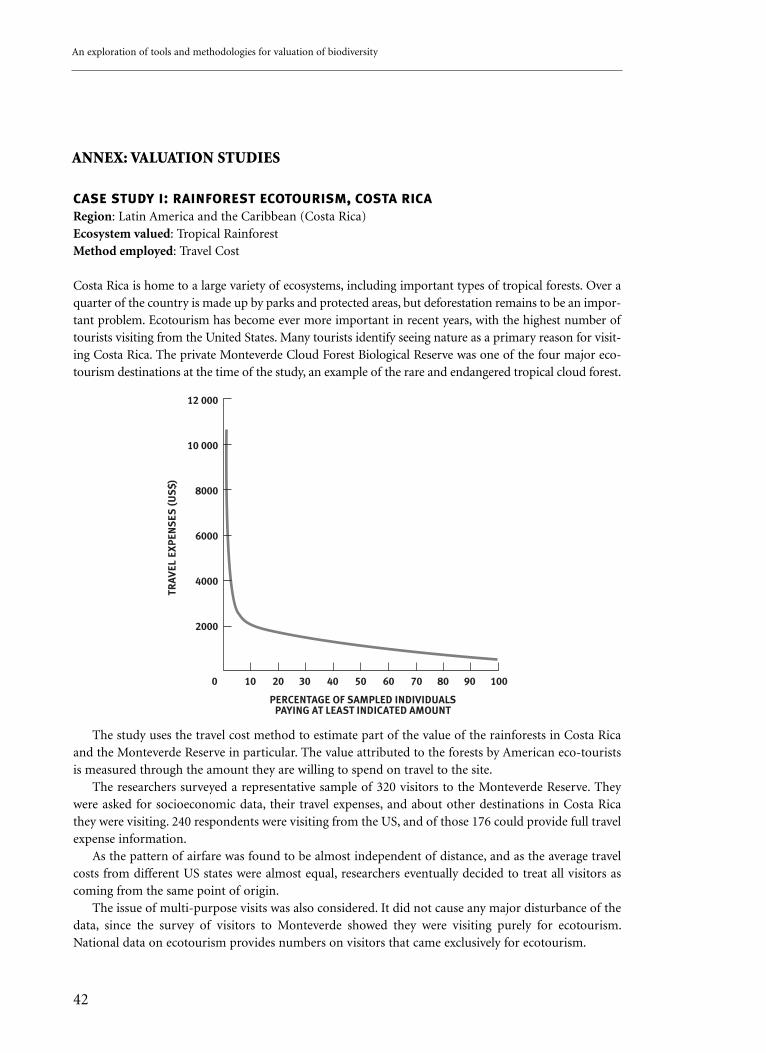
An exploration of tools and methodologies for valuation of biodiversity
42
case study i: rainforest ecotourism, costa rica
Region: Latin America and the Caribbean (Costa Rica)Ecosystem valued: Tropical RainforestMethod employed: Travel Cost
Costa Rica is home to a large variety of ecosystems, including important types of tropical forests. Over aquarter of the country is made up by parks and protected areas, but deforestation remains to be an impor-tant problem. Ecotourism has become ever more important in recent years, with the highest number oftourists visiting from the United States. Many tourists identify seeing nature as a primary reason for visit-ing Costa Rica. The private Monteverde Cloud Forest Biological Reserve was one of the four major eco-tourism destinations at the time of the study, an example of the rare and endangered tropical cloud forest.
The study uses the travel cost method to estimate part of the value of the rainforests in Costa Ricaand the Monteverde Reserve in particular. The value attributed to the forests by American eco-touristsis measured through the amount they are willing to spend on travel to the site.
The researchers surveyed a representative sample of 320 visitors to the Monteverde Reserve. Theywere asked for socioeconomic data, their travel expenses, and about other destinations in Costa Ricathey were visiting. 240 respondents were visiting from the US, and of those 176 could provide full travelexpense information.
As the pattern of airfare was found to be almost independent of distance, and as the average travelcosts from different US states were almost equal, researchers eventually decided to treat all visitors ascoming from the same point of origin.
The issue of multi-purpose visits was also considered. It did not cause any major disturbance of thedata, since the survey of visitors to Monteverde showed they were visiting purely for ecotourism.National data on ecotourism provides numbers on visitors that came exclusively for ecotourism.
ANNEX: VALUATION STUDIES

43
An exploration of tools and methodologies for valuation of biodiversity
The demand curve for ecotourism was derived by evaluating the percentage of visitors that would bewilling to pay at least a given amount in order to visit the park. The sample of visitors to the Monteverdereserve was used as a proxy for US tourists visiting all Costa Rican Parks and reserves. A specific valuefor the Monteverde reserve was estimated by adjusting the average consumer surplus per visitor for thepercentage of time in Costa Rica that was spent in this particular reserve (according to surveyresponses). It was then multiplied by the number of US visitors to Monteverde (17,200).
The average annual valuation per person of protected areas in Costa Rica was calculated to amountto US-$1150. Multiplying this with the annual number of US ecotourists to Costa Rica (59 400), gave anoverall value of US-$68 million.
The yearly US ecosystem value of Monteverde Cloud Forest Reserve amounts to $4.5 million. Aprevious study (Tobias and Mendelsohn 1993) had estimated domestic ecotourism value forMonteverde at around $100,000 per year in 1988. The comparison showed that US ecotourism value ismuch higher, which is likely due to a lack of equivalent substitute sites and higher incomes.
The study also derived a concrete policy conclusion. In order to transfer more of the benefits fromparks and preserves to the less wealthy host countries, the authors recommend to use higher entrancefees. According to the estimates, entrance fees of up to $40 could be charged, which implied a significantincrease of the fees that were applied at the time of the study, which ranged from $5-10.
Menkhaus, Susan; Lober, Douglas J. (1996): “International Ecotourism and the Valuation of TropicalRainforests in Costa Rica” Journal of Environmental Management 47, 1–10

An exploration of tools and methodologies for valuation of biodiversity
44
case study ii: montego bay coral reefs, jamaica
Region: Latin America and the Caribbean (Jamaica)Ecosystem valued: Coral ReefsMethod employed: Contingent valuation, cost-based approaches
Coral reefs are one of the most diverse ecosystems on the planet. They provide a multitude of servicesto local communities and other users, acting as breeding ground for fish and as coastal protection. Inmany cases, they also provide considerable recreational value.
The Montego Bay Marine Park, Jamaica, established in 1991, has been under scrutiny both bybiologists and economists since it has been transferred to private management through a trust in 1996.The Marine Park had been threatened by a multitude of adverse influences. These include pollutionfrom ships and from shore, over fishing, and coral bleaching. At a number of popular diving sites, thehigh number of divers also contributes to the damage to reef vegetation.
The study sought to determine the most important elements of the total economic value of the coralreefs in Montego Bay. It looked at the values generated by fisheries, the tourism sector and the benefitsof coastal protection. Contingent valuation was employed to estimate non-use values and options forbiological prospecting.
A socioeconomic study was conducted as a first step in order to identify the main stakeholder groupsand their concerns. This collection of pertinent data was a helpful contribution to the management ofthe Montego Bay Marina Park, but is also an important prerequisite for the design of the contingentvaluation questionnaire. It is important that the socioeconomic situation of respondents be known inorder to avoid various biases.
A conscious choice was made to exclude some of the smaller and less policy relevant types of use84
This strategy is applied by many valuation studies, since it is often not necessary to explore the full rangeof services of a given ecosystem in order to have an influence on conservation policy. This is the casewhen the benefits associated with the most important ecosystem services are already high enough to tipthe balance towards conservation. Hence, only recreation and tourism, near shore fishery, and coastalprotection were addressed. A number of government, NGO, academic and consultant’s documents anddatabases were used for collecting numbers on tourist visits, fishing activities and coastal real estatevalues. To arrive at net values, all costs incurred to businesses profiting from coral reefs were deductedfrom their gross revenue. The remaining numbers were then transformed to net present values.Different discount rates were experimented with, with a large influence on the results. A discount rateof 10% was used for calculating the cost to the tourism industry and to local fisheries (in terms ofbenefits lost) if the coral reefs of Montego Bay were destroyed.
Coastal protection was analyzed as the only quantifiable indirect-use value. The study used the realestate values of those properties under risk of erosion as a basis for the calculation of the value of coastalprotection. The lack of certainty as regards the time it would take for a coral reef to loose this functionif severely damaged, and as regards the likelihood of extreme weather occurrences in the future, is achallenge for the estimation of this value.
For the contingent valuation study, in-person interviews were conducted with 1058 respondents,including both tourists and local residents. Respondents were given information on the currentsituation of Montego Bay Marine Park and the human pressures it faces, as well as a general introductionto the concept of marine biodiversity. Several checks were built in the questionnaire in order to eliminate
84 The trade in aquarium fish was excluded because of its relatively small revenue, whereas the “value of coral reefs as a recordof natural historical events” was considered not sufficiently policy relevant, and difficult to quantify.

45
An exploration of tools and methodologies for valuation of biodiversity
bias, and the non-use and use values were separated as much as possible in order to avoid doublecounting. An open-ended format was chosen, with explanation of answers and reactions to changedscenarios sought.
For bioprospecting values, a statistical model was adapted from other studies, based primarily on theaverage market value of a new substance, the likelihood of discovery, and the density of species atMontego bay. Specific assumptions were made on the share of the rent from genetic diversity that wouldbe captured by Jamaica.
* Marginal benefits shown at typical current reef conditions.
The researchers also calculated the marginal costs of enhancing the protection of corals reefs, mainlythrough the reduction and better treatment of waste, by transferring the cost function from anotherstudy (Ruitenbeck 1998). They found marginal costs to range between $1 million to $29 million forincreases in reef quality between 1% and 20%. The calculation of marginal costs made thedetermination of an “optimal” conservation strategy possible. The optimal improvement was found at13% with associated expenditures of $27 million.
Ruitenbeek, Jack; Cartier, Cynthia (1999): “Issues in applied coral reef biodiversity valuation: Results forMontego Bay, Jamaica”—World Bank Research Committee Project RPO# 682–22
An exploration of tools and methodologies for valuation of biodiversity
46
case study iii: conversion of mangroves to shrimp farms, thailand
Region: Asia and the Pacific (Thailand)Ecosystem valued: Mangrove ForestsMethod employed: Change-in-Productivity, Replacement Costs, Benefits Transfer
Mangrove forests provide a variety of goods and services both to local communities as well as on anational and global level, ranging from the provision of wood to costal protection. They constitute aunique ecosystem, adapted to brackish water and different levels of flooding, with highly diverse floraand fauna. They also provide an important habitat including serving as breeding ground for fish.
Many mangrove ecosystems have been and are being converted to other uses, in the case of this studyto intensive aquaculture, in form of shrimp farming. At the time of the study, they were legally stateproperty, but were in practice considered open access to any users. In some cases, shrimp farming wasencouraged by the government, since it yielded higher financial profits and export opportunities.
The study sought to evaluate the benefits provided by the mangrove forests around Tha Po Village,where approximately 400 ha of Mangroves, of originally more than 1000 ha, remained intact. Using bothchange-in-productivity and replacement cost approaches, the study covered the extraction of goodsfrom the Mangroves as well as their importance as breeding grounds for offshore fisheries, as costalprotection from erosion and as carbon sinks slowing global warming.
Local direct use values were elicited through two surveys of village households that focused oncollecting data on the harvesting frequency and quantity of different forest products. Short interviewswere also conducted during a village gathering. From the 131 households in Tha Po the first surveyreceived 39 useful replies, but only 10 responses were useful in the second survey. The collectedinformation was confirmed by the short interviews at the gathering. The main products were fish andother marine animals, non timber products such as honey, as well as wood for repairing fishingequipment. Only small quantities of firewood were gathered since the wood from the mangroves is notconsidered suitable to combustion. Market prices were applied to these goods where possible, and pricesfor close substitutes were used when no markets existed. Assuming that the harvesting is undertaken inthe villagers’ leisure time, the opportunity costs of harvesting were calculated as a share of the local wage,and subtracted to arrive at the exact value of goods.
In order to estimate the influence of coastal wetlands on off-shore fishery, the study used the Ellis-Fisher Model, a statistical model, with different functions tested for sensitivity. Historical data on catchrates, fishing techniques and mangrove size served as a basis for calculations.
Coastline Protection and Stabilization services were valued using a replacement cost approach. Atcoastal strips where mangrove forests are lost, breakwater dams need to be constructed in order to avoidsevere erosion. The costs of these dams amount to $ 875 per meter of coastline. The researchers hadinitial concerns of overestimate values, since replacement cost approaches have shown such a tendency,but the end results were clear enough even with this aspect excluded.
The value of Carbon Sequestration was calculated primarily through a benefits transfer. The totalamount of carbon was calculated from the biomass per hectare of mangrove forests. A value of $ 5.67per ton of carbon was applied, based on a World Bank report on Mangroves in Malaysia. This can beconsidered as a lower bound, since other studies find this value to be considerably higher.
All the derived figures were transformed into their net present value (NPV) to facilitate a cost-benefitcomparison with the value created by shrimp farms.

47
An exploration of tools and methodologies for valuation of biodiversity
* All net present value calculations are based on a 20-year time line.
The values in terms of carbon sequestration were not included in the NPV since, as they occur on aglobal level, they could not be captured directly by Thailand.
The net present value of shrimp farms was calculated as being around $ 200 per hectare, becomingnegative when the costs of restoring the forest, after shrimp farming was not profitable any more (yieldstend to decline over time), was included.
Even when only including some of the use values and none of the non-use values85, the NPV ofmangrove forests is far higher than the NPV of shrimp farms, resulting in a negative NPV forconversion. In consequence, the calculations show that the conversion of mangrove forests to shrimpfarms is, from society’s viewpoint, economically not profitable.
Sathrathai, S. and Barbier E.B., (2001): “Valuing Mangrove Conservation in Southern Thailand”,Contemporary Economic Policy 19(2):109-122.
85 E.g values for Tourism, local climate influences and existence values are missing in the analysis.

An exploration of tools and methodologies for valuation of biodiversity
48
case study iv: the total economic value of forests in sekong
province, lao pdr
Region: Asia and the Pacific (Lao PDR)Ecosystem valued: ForestsMethods employed: Change-in-Productivity, Replacement Costs, Benefits TransferSpecial features: participatory approaches
The territory of the Lao People’s Democratic Republic contains high biodiversity—being part of theIndo-Burma geo-region, it is part of one of the twenty-five global “biodiversity hotspots”. Sekongprovince is part of the Central Annamites, one of five priority regions of the WWF’s EcoregionConservation Program in Indochina. Natural forests are an important source of subsistence and incometo local communities, providing a large amount of non-timber forest products. They also provide anumber of other benefits on the national or international level. Forests are however under increasingpressure, in particular from efforts to increase forestry output.
The study by Rosales et.al. seeks to estimate the total economic value (TEV), especially the localvalue, of a natural regeneration forest that is not greatly influenced by human impacts. The study usesa variety of methods, in particular participatory approaches along with changes in productivity andreplacement costs. Benefits transfer is used to estimate some of the indirect use values such as watershedprotection, biodiversity conservation and carbon sequestration.
The study includes an analysis of the social situation of local communities, highlighting significantdifferences in the use of non-timber forest products by different income groups. Poorer households aremuch more dependent on forest products as both monetary and non-monetary income, with 71 percentof their total income resulting from non-timber forest products.
The value of timber extracted in Sekong province was estimated using numbers for timber exportrevenues and tax earnings. Whether this level of timber extraction is sustainable and compatible with anatural regeneration forest that allows for the full use of other benefits was not addressed in the study.
Two different methods were used for the calculation of the value of non-timber forest products.“Focus group discussions” were conducted by asking villagers to estimate the amount of differentproducts harvested per the year, including a ranking of importance. The found amounts were thenaveraged to per-household numbers, and the market price for these goods applied.
Participatory environmental valuation was used for a second valuation of non-timber forestproducts. This modified form of contingent valuation addresses one problem that is frequentlyencountered in subsistence economics, that is, the lack of relevance of money for local communities,which makes it difficult to express willingness-to-pay in monetary units. In order to address thisproblem, a good can be chosen that (i) is of high importance to local communities, (ii) is of relativehomogeneity (so that it can act as a numeraire good), and (iii) has a monetary market value. In this case,rice, the main staple food, was chosen to act as numeraire. Respondents were asked to place counters ondifferent cards representing non-timber forest products as well as on one card representing a sufficientamount of rice for the household. The number of counters signified the importance placed on thatparticular good. The amount of rice needed in a household can be taken from use statistics, and valuedat a market price. Through the placing of markers, all other goods can be put in a relation to rice, and aprice attached to them accordingly.
This technique resulted in considerably higher values than the focus group discussions, leading to atotal value of non-timber forest products at $525 compared to $398. This could be explained byinaccurate answers, but, since harvest is mostly done for consumption and only small portions are

49
An exploration of tools and methodologies for valuation of biodiversity
traded on markets, more likely shows that the utility derived by communities from non-timber forestproducts is actually higher than its market value.
Indirect use values include the protection of watersheds and the reduction of floods, droughts anderosion or sedimentation. Indirect use values were calculated through estimated changes in productivityregarding farming, fisheries and hydropower facilities, as well as the “replacement costs” of having tobuild dams for flood control. Benefits transfer, using figures from various other case studies, was alsoutilized, generating generalized values for bioprospecting and carbon sequestration. The governments’conservation expenditures was taken as a revealed willingness-to-pay for biodiversity, representing alower bound of the actual value of biodiversity.
The results of the study are summarized in the table. While the study provides an overview of themagnitude of the services provided by Sekong forests, it also reflects the difficulties encountered whenseeking to estimate a TEV with limited resources, such as the application of a mixture of instrumentswith potential overlaps and varying accuracy, in particular when estimating indirect use values.However, the figures derived for the direct use values alone indicate the high importance of non-timberforest products to local communities and, consequently, the need to take them fully into account indevelopment decisions.
Rosales, R. et al. (2003): “Balancing the Returns to Catchment Management: The Economic Value ofConserving Natural Forests in Sekong, Lao PDR”, IUCN Water, Nature and Economics Technical PaperNo. 5
An exploration of tools and methodologies for valuation of biodiversity
50
case study v: changbaishan mountain biosphere reserve, china
Region: Asia and the Pacific (China)Ecosystem valued: ForestMethods employed: Change-in-productivity, cost-based approaches
The Changbaishan Mountain Biosphere Reserve includes a forest ecosystem located in Northeast China,close to the border to North Korea. It was accepted into the World Biosphere Network for its outstand-ing ecological value, and is considered a strict reserve (the highest level of protection) under IUCN cat-egories. It encompasses almost 200,000 ha, most of which are forested.
The study analyses the values of some functions provided by the forest ecosystem, that is, waterconservancy, soil protection, CO2 fixation, nutrient cycling, pollutant absorption as well as disease andpest control. The study uses the change-in-productivity approach: drawing on biological research, itestimates the physical quantity of services provided and, in a second step, puts a price tag to thesequantities. This price tag is calculated by mainly using the costs of providing the service by other means.
Forest cover slows water runoff and forest soil shows higher permeability, leading to increased watersupply and an improved water quality. The function of water storage and increased year-round watersupply is taken into account by using data on precipitation and evaporation in the area for calculatingthe runoff amount under a fully effective ecosystem function (623 mm/year), and by subsequentlycalculating the costs of alternatively building water reservoirs. Official figures on reservoir constructioncosts were adjusted by changes in labor and material costs plus maintenance costs. From the resultingnumbers, a value for water conservancy can be derived by converting runoff figures to absolute amountsof water in the entire reserve.
The soil protection function provided by forests is quantified as the prevention of soil erosion.Research in Japan has shown that, depending on soil type, forests reduce erosion by 10 to 50 mm peryear. As a mix of soils is present in the region, the study assumes 30mm per year. The costs of erosionare represented through the opportunity costs of not being able to use the land for timber production.
Carbon retention is calculated by using the photosynthesis equation and other chemical reactionsinside plants. The different forest types that are present in the Reserve were taken into account withdifferent biomass per hectare figures. Two alternative methods were considered to calculate the price(cost) of carbon retention. One relies on the European Carbon Tax systems to extract a value of $150/tcarbon in Norway. The other, which was chosen for calculations, looks at the cost of afforestation toprevent global warming. Numbers from the FAO and several studies on the costs of planting trees aretransferred to the situation in China and then converted from per-hectare figures to costs per ton ofcarbon (250 Yuan/ t C).
Nutrient Cycling is another important service provided. Trees accumulate nutrients from the groundand pass part of them on when shedding leaves or dying off. Natural nutrient cycling could be replacedby synthetic fertilizers, their price providing a market value for the service.
Forests also absorb and decompose other pollutants. The study only takes into account sulfurdioxide, valuing it through the cost of technological ways of controlling SO2 Emissions.
Pest control is provided by the forest through natural enemies and other interconnections of theecosystem. In a natural forest potentially harmful insects are controlled by their natural enemies and adiverse ecosystem makes it harder for plant diseases to spread. This service is again valued through thecosts of alternative measures, namely the use of pesticides.
Other ecosystem services are verbally discussed in the study considered but not included in thenumerical calculations, mainly because of limitations to adequately quantify these services. In

51
An exploration of tools and methodologies for valuation of biodiversity
consequence, the numbers found in the study provide a lower bound of the total economic value of theforest ecosystem.
The study calculated the following annual values for the respective services, provided by the entirereserve (in million Yuan):
Water Conservancy: 156.14
Soil Protection: 2.20
Carbon retention: 292.53
Nutrient Maintenance: 43.39
Pollutant Decomposition and Pest Control: 15.85
Overall Value: 510.11
According to the study, the opportunity costs of the reserve, in form of not being able to producetimber, are in the order of 50 million Yuan. In consequence, the economic value of the reserve is at leastten times higher than the timber production value.
Xue, Dayuan; Tisdell, Clem (2001): “Valuing ecological functions of biodiversity in ChangbaishanMountain Biosphere Reserve in Northeast China” Biodiversity and Conservation 10, 467–481.

An exploration of tools and methodologies for valuation of biodiversity
52
case study vi: dryland biodiversity: the fynbos biome, south africa
Region: Africa (South Africa)Ecosystem valued: All ecosystems, focus on the Fynbos BiomeMethods employed: Contingent Valuation, Choice Experiment
The Fynbos Biome is an important component of the Western Cape Province, which holds the world-wide highest non-tropical concentration of higher plant species. Fynbos is the natural scrublands vege-tation occurring in a small belt of the Western Cape, mainly in winter rainfall coastal and mountainousareas with a Mediterranean climate.
South African biodiversity is generally threatened by a multitude of factors, including invasivespecies, urban development and in particular climate change, the later predicted to cause more than50% shrinkage in the current vegetation cover.
The study focused on directly assessing the willingness-to-pay for biodiversity conservation. It usedcontingent valuation techniques, applying the guidelines set out by the NOAA panel in order to minimizebias (see paragraphs 53–54). The questionnaire was repeatedly tested, and the actual survey wasconducted through 820 personal interviews. Socioeconomic data was collected, including age, incomeand other factors, and analyzed using statistical models. Respondents were found to be largelyrepresentative on a regional and provincial level. Some adjustments had to be made for the national level.
In the section that addressed the willingness-to-pay for biodiversity conservation, respondents werefirst asked about their general interest in nature, and their knowledge of some major protected areas.This led to a question on how much desertification would reduce their likelihood to visit. The generalannual willingness-to-pay towards nature conservation, through higher costs of electricity and petrol,was solicited through an open-ended question. Zero-bids were followed up to explore their cause.Respondents could then choose how they would like to see their money allocated to different biomes inSA. The questions then focused on the Fynbos Biome, inquiring into respondents’ knowledge thereof.
As researchers felt that the threat of climate change would have influenced replies through a sense ofimpending loss, it was introduced only after the first willingness-to-pay question. Respondents wereshown two maps with the predicted losses in biomes (see figure) and asked whether this developmentwere of concern to them. If there were no concerns, an explanation was sought, if there were concernsanother question on willingness-to-pay followed. The researchers used a dichotomous choice format ifrespondents expressed a general acceptance for payment. Respondents were first asked if they werewilling to pay a certain amount for the complete preservation of the different biomes. If this was refused,the willingness to pay a smaller amount for a reduction of losses was inquired (double boundeddichotomous choice). The starting amount was varied across the sample, taking five different levels.Another open ended question was used to elicit the full maximum willingness-to-pay for the 100%conservation option.

53
An exploration of tools and methodologies for valuation of biodiversity
Under the first, open-ended, willingness-to-pay question on nature conservation in South Africa,76% of respondents were willing to make an annual contribution, at a mean of about $10. Projected toa provincial level, this equals a willingness-to-pay of over $8 Million per year for nature conservation.39% of this amount would be allocated to the Fynbos Biome in the Western Cape region. On a nationallevel an aggregate of about $58 Million would be reached. This is of comparable magnitude withgovernment conservation budgets.
A majority of respondents were strongly disturbed by the predictions of the influence of climatechange, leading 76% of respondents to favour a policy which would lead to a rise in costs for electricity,petrol, and other polluting commodities, with an overall average willingness-to-pay of $37 by thedichotomous choice questions, and $21 by the open ended question. This amounts to provincial valuesof $ 21–39 million, and national values between $ 161 and 262 millions.
predicted loss of vegetation in south africa. source: kiker 2000
Besides demonstrating how contingent valuation techniques can be applied in a developing countrycontext, this study also underlines the importance of information and education for receiving accurateWTP numbers, and how questionnaires can be built in a way to reflect the impact of information on thewillingness-to-pay. In the case investigated by the study, the knowledge of the biome had a highinfluence, and the presentation of expected losses in case of inaction raised the willingness-to-payconsiderably.
Turpie, J. K. (2003): “The existence value of biodiversity in South Africa: how interest, experience, 10knowledge, income and perceived level of threat influence local willingness to pay” Ecological Economics46, 199–216.
86 One Rand equaled US-$0.1 at the time of the study.
Current HadCM2 (excluding sulphates)
South African Biomes
desert
forest
fynbos
grassland
nama-karoo
savanna
succulent karoo

An exploration of tools and methodologies for valuation of biodiversity
54
case study vii: the flamingos of lake nakuru national park, kenya
Region: Africa (Kenya)Ecosystem valued: Inland Waters, Wildlife viewingMethods employed: Travel Cost Analysis, Contingent Valuation
Lake Nakuru National Park, the only Ramsar site in Kenya, is known for its spectacular number offlamingos. It also preserves a number of other rare species, such as the black and white rhino. It wasestablished in 1972, and has since been expanded to an overall size of 188 km². A high number of visi-tors, untreated waste water and poaching constitute serious threats to the ecosystem, with the numbersof flamingoes decreasing.
The study sought to estimate the recreational value of the flamingo population, the visit to the park,and wildlife viewing in Kenya in general. It used the travel cost method as well as contingent valuation.This summary will focus on the former.
A survey of 185 visitors to the park was conducted over five months in 1991, with Kenyan residentsand foreign visitors treated separately and weighed according to their share of overall visits. In-personinterviews were conducted, including only adult visitors.
For the travel cost analysis, trip costs, time spent on the trip, visitors’ willingness to extend their trip,and their motives for coming to the park were estimated along with the costs of visiting substitute sites.Socioeconomic data such as age, income and education were also collected and included in the demandfunction as independent variables. The dependent variable was the per capita visitation rate for eachzone when a zonal model was used.87 For a model based on individual observations the probability ofparticipation was used. Different models (linear, semilog, loglinear), varying independent variables aswell as different definitions for zones were used and later compared for statistical quality.
The costs for time spent on the trip were calculated as a product of travel time and the hourly wageof respondents, multiplied with a factor of 0.3. This is to reflect that the value of time while going onvacation is considered lower than the wage rate. Such a deduction is commonly used in travel cost studies.
The willingness to extend the stay was used as a proxy for site quality. In the demand function forresident visitors, a ranking of experiences in the park compared to other parks was substituted.
All different forms of the demand function were used to calculate consumer surplus and a “best”form chosen, based on consistency of the model with actual observations.
For non-residents, demand functions based on zonal observations produced results thatcontradicted economic theory and previous studies, therefore models based on individual observationswere preferred. The model with the most consistent results calculated a benefit for all 127 non-residentvisitors of about $200,000. The value per visitor per day was $75–79. Visitors stayed in Lake NakuruNational Park for 1,5 days on average, the recreational value of the park would thus be about $120. With88,529 international visitors a year, a total non-resident value of about $ 10 million is arrived at.
For resident visitors, models based on individual observations also showed better results than onesbased on zones. The same tests of statistical reliability were employed to pick the function bestdescribing the demand for recreation at the park. It provides results of $4000-5000 for the 58 residentsinterviewed, about $70 per visitor. 53000 residents visited the park in 1991, receiving $3.6 to $4.5 millionin benefits.
87 In the TC method, it is possible to create demand functions from individual observations, travel costs from different zones(usually geographical areas with similar travel costs) or through more complex statistical models.

55
An exploration of tools and methodologies for valuation of biodiversity
The total recreational value of Lake Nakuru National Park is $13.6–$15.1 million by the mostaccurate models found. Visitors reported spending about 40% of their time on viewing andphotographing flamingoes, these are thereby valued at over $5 million.
The contingent valuation undertaken in parallel resulted in values from $5.5million (willingness topay) to $12.2 million (willingness to accept) for the National Park, values from the TC model were muchhigher. A decision between these two values is hard to make, as both could capture different valueaspects.
The study suggests an increase in entrance fees to capture a larger portion of values, especially sincethe models show demand to react only slightly to prices. The results were taken into account by theKenya Wildlife Service in its long term pricing policy.
Navrud, S.; Mungatana, E.D. (1994): “Environmental valuation in developing countries: The recreation-al value of wildlife viewing” Ecological Economics 12, 125–139.

An exploration of tools and methodologies for valuation of biodiversity
56
case study viii: mantadia national park, madagascar
Region: Africa (Madagascar)Ecosystem valued: RainforestMethods employed: Travel Cost Analysis, Contingent Valuation
The island of Madagascar is home to one of the highest numbers of endemic species in the world, withabout 75% of known species not occurring anywhere else. However, with only about 17% of the origi-nal vegetation remaining, much of the ecosystem has already been profoundly altered. Due to inade-quate farming and logging practices, large parts of the island have turned into deserts, and much of theoriginal megafauna was lost to the hunting of early settlers.
Nature tourism has become an important economic factor in Madagascar, with numbers of visitorsconstantly rising. This provides economic opportunities for residents, especially since the governmenthas adopted measures to share proceeds with local communities.
Mantadia National Park was established as part of the Madagascar Forest Management andImprovement Project, supported by the World Bank. The operation of the Park is based on theassumption that increased revenue from nature tourism would soon cover operating costs and provideadditional profits.
The study sought to estimate the benefits to international nature tourists from the creation of thisnew national park, using the travel cost method as well as contingent valuation.
The travel cost analysis is based on the assumption that tourists have the option of visiting variousdestinations that offer similar experiences. They hence have to make a choice based on the quality andthe price of the trip. A “typical trip” model was designed based on the different statistical modelsavailable, which uses data from all recreational sites under consideration to compute one single demandfunction. The dependent variable is the total number of nature tourism visits to all considered countriesover a period of five years; the independent variables are costs, the quality of the experience as well associo-economic variables.
The change in quality of a nature trip to Madagascar caused by the creation of a new national parkwould lead to a shift of the demand curve. The change in the total benefit can then be calculated bymeasuring the area between the old curve, the new curve and the costs.
Data were collected from two surveys. The first one was carried out in Madagascar; as it couldhowever only acquire 87 completed questionnaires (due to a temporary reduction in tourist visits), anumber of international nature travel industry experts were questioned in order to complement thisinformation,.
The on-site survey inquired into the costs of the current trip, past or planned visits to other naturetourism destinations as well as the socioeconomic background and the willingness to pay for a newnational park, to be used in the CVM study. The questionnaires had been extensively tested andreviewed, both with previous nature tourists to Madagascar in the United States and a small sample oflocals.
From the question on visits to other countries, the seven most important substitute destinationswere derived, namely, Kenya, India, Indonesia, Mexico, Thailand, Nepal and Brazil.
For estimating the quality of sites, tourists were first asked to rank the importance of several aspectsfor the overall quality of those sites.

57
An exploration of tools and methodologies for valuation of biodiversity
In a next step, the quality of different countries regarding these aspects was determined by a surveyof 22 representatives of travel agents and tour operators specializing in nature tourism to thosecountries.
Travel costs for substitute sites were calculated using prices for regular airfare, and the in-countryexpenses as estimated by the experts.

An exploration of tools and methodologies for valuation of biodiversity
58
The regression model showed all independent variables to have the expected influence, with theexception of income. This might be due to high average incomes in the sample, to a point where theymight not have a significant influence on travel decisions any more.
The quality impact of the new national park was determined based on field visits. It can be expectedto primarily improve nature interpretation facilities such as trails, a nature education center and trainedguides. The study did not expect the new park to significantly increase the natural beauty of Madagascaror the likelihood to see rare wildlife, since this can already be achieved in existing protected areas.
Different possible improvements in interpretation facilities, ranging from 10% to 50% were enteredinto the model, showing a change in consumer surplus by $46 to $268 per visitor, which implied a netpresent value of $4–26 million.
Mercer, E.; Kramer, R.; Sharma, N. (1995): “Rain Forest Tourism—Estimating the Benefits of TourismDevelopment in a new National Park in Madagascar”, Journal of Forest Economics 1:2, 239–269.

59
An exploration of tools and methodologies for valuation of biodiversity
case study ix: the conservation of wild geese in scotland, united
kingdom
Region: Western Europe and others (United Kingdom)Ecosystem valued: Wild GeeseMethods employed: Contingent Valuation, Choice Experiments, Market Stall (participatory)
The study by Hanley et. al addressed a number of closely related species of wild geese with significantemotional value. With hunting of wild geese playing only a minor role today, most people derive utilityeither through appreciation of their beauty (direct use value), or through mere knowledge of their exis-tence (existence value). Several species of geese in Scotland are endangered. While some protectionmeasures are in place, calls had been made for tighter and more effective policies.
The study uses the techniques of contingent valuation (CV) and choice experiments (CE), as well asthe participatory approach of a “market stall” (MS).
The market stall approach addresses the criticism that contingent valuation is taken out of a socialcontext. It lets a group of participants act as potential buyers, while a researcher takes the part of a seller.The participants are given time to discuss among themselves before expressing their willingness to pay(WTP) and, in addition, they are given a chance to revise their WTP after two weeks. By providing amore realistic framework for decision-making, the market stall approach represents one possible way totest and improve the accuracy of CV studies.
In addition to determining overall WTP values, the study also explored the differences in WTPamong areas and local vs. national populations, thus elucidating the potential distributional impacts ofproposed policy changes.
Over 1200 individuals, including local residents of possible goose protection sites, visitors, andgeneral residents of Scotland, were questioned in one-to-one interviews with the choice experimentmethod, 412 respondents were covered by the CV method. Questions also targeted socioeconomicinformation such as age and income, so as to ensure that the respondents’ sample was representative.
In order to eliminate biases or general flaws, the questionnaires were tested in pilot interviews witha limited number of participants. Extensive feedback was collected from participants after the study.While no major flaws were detected, some participants would have preferred more extensiveinformation on the issues at stake.
For the CV a poly-chotomous choice (see paragraph 55) format was used, with variations in theinitial amount asked in order to avoid potential biases. Respondents could not only express willingnessto pay or not to pay, but stages in between, such as “probably would pay”. They were asked whether theywould be willing to accept increases in taxes from 50 pence to 280 pounds for different protectionscenarios.
The scenarios included: (i) banning all shooting of geese; (ii) preventing a 10% drop in populationof all goose species (iii) insuring a 10% rise in two endangered species; and (iv) aiming at a 10% rise inall the main migratory species.
In the choice experiments participants were presented with sets of two options, each outliningcertain standards of geese protection and certain costs. They could choose either or opt for the statusquo. An example of such a card is included below.

An exploration of tools and methodologies for valuation of biodiversity
60
In order to derive implicit prices from the answers of the Choice Experiment, statistical models wereused that separated the influences on WTP caused by variables such as income from those referring topreferences for certain conservation measures.
The Market Stall Valuation was conducted in two Sessions with 52 participants at different locationsin Scotland. Because of the relatively low number of participants, only the options of a 10% increase inendangered species and a 10% increase in all geese species were covered. The questions asked weresimilar to those in the CV, with a poly-chotomous choice approach and the possible answers “wouldcertainly (not) pay”, “would probably (not) pay”, “not sure”.
The table shows the results of the CV. In the choice experiment, unsurprisingly, respondentsexpressed a general preference for cheaper options. Some of the highest WTP figures were found forpolicies avoiding the shooting of geese, up to £20 from visitors to one protected site. Visitors were
88 Trimmed means are commonly quoted in CV studies as a means to ensure that estimates are conservative. Untrimmed meansare frequently skewed by a limited number of large values.
89 One UK Pound, £1, equaled about USD 1.5 in 2000.

61
An exploration of tools and methodologies for valuation of biodiversity
generally willing to pay for an increase in the endangered species, to an average of £13 in some groups,whereas local residents would only be willing to pay for small increases or a prevention of losses. Localswould even need to be compensated for increases in geese population over a certain limit, having a WTPof zero. The market stall approach seemed to provide higher quality results, with fewer protest answersand a higher statistical reliability. It also came up with results that were considerably lower than thoseobtained under standard CV—by a factor of 3.5.
This factor was used to compute a conservative overall figure for the willingness to pay of the samplegroup for the conservation of wild geese. Attributing this corrected figure to the entire Scottishpopulation results in an aggregate willingness-to-pay of £13 Million annually for a 10% increase in allgeese. With estimated costs of conservation measures, incurred by farmers, of less then £100,000 peryear, this yields a benefit cost ratio of over 130. Overall, the study provided evidence that comparativelysmall increases in the numbers of a species can be unequivocally desirable. However, larger increasesmay have adverse distributional consequences as utility to local residents would start to drop when goingbeyond a certain limit.
Scottish Executive Central Research Unit (2001): “Technical Report B—Willingness to pay for the con-servation and management of wild geese in Scotland”

An exploration of tools and methodologies for valuation of biodiversity
62
case study x: the donau-auen national park, austria
Region: Western Europe and others (Austria)Ecosystem valued: Riverside WetlandsMethods employed: Change in Productivity, Contingent Valuation, Replacement Costs
Plans for hydro electric development on the stretch of the Danube River between Vienna and Bratislavacaused one of the most heated conflicts in the history of the Austrian environmental movement. Thesection of the Danube under discussion was one of the last long free flowing stretches of the river thathosts a unique and diverse wetland ecosystem.
The federal government of Austria launched a research programme with a view to provide athorough assessment of the different options at hand. The present study, which was part of thisprogramme, uses contingent valuation methodology in combination with several other methods. Fouralternative use options are compared, two of which imply the establishment of a national park while theothers favor the construction of hydro-electrical power plants. The study does in cases of doubt choosea conservative approach, hence risking an undervaluation of nature for the sake of higher credibility.
Option I proposed the establishment of a smaller national park, on public land only, without anyfurther changes made to the river management. This option would fail to address one major threat tothe wetlands, that is, the erosion of the riverbed due to upstream flow changes. In past years, the riverhad already dropped one meter, thereby effectively draining parts of the wetlands.
Option II proposed a larger protected area, with additional land to be bought from farmers andother property owners. It also included a hydraulic engineering project, introducing a certain kind ofgravel to the riverbed ion order to reduce erosion.
Option III proposed a lower-impact version of hydroelectric use, with a power station at the borderto Slovakia, which would leave a large part of the wetlands, including the most sensitive part,undisturbed.
Option IV four proposed damming the river in the centre of the most valuable wetlands, not leavingany part large enough to be considered for a national park by international standards.
The first part of the survey focused on a cost-benefit analysis including direct use values, assuminga time span of 72 years and a discount rate which at 2% was chosen rather low in order to reflect thelong-term importance of environmental decisions. At first, costs and benefits of electricity productionwere calculated, including costs for construction, maintenance, and the emission of air pollutants duringconstruction, valued using numbers from other studies, as well as benefits in the form of the costs ofalternative means to address energy needs (a gas-fired plant, including its emissions of various airpollutants, as well as demand-side measures to enhance the efficiency of energy use).
To include enhanced energy efficiency in the analysis has an interesting effect. Since increasedefficiency had then, and still has, a very high return on investment, it was shown that building ahydroelectric plant would be inefficient even without taking other cost components into consideration.This approach was not chosen, since the likelihood of it being realized was considered very low..
Benefits for shipping were taken into account for all options but the first, since it would notguarantee a certain depth for most of the year.
For the two options that proposed the creation of a national park, costs were calculated for the needfor infrastructure and personnel, as well as the loss of productivity in agriculture, fishing, hunting andforestry that would result from the use restriction associated with a national park. The benefits of anational park specifically for visitors (use value), were estimated through a contingent valuation survey,cross checked with the travel cost method that found similar results.

63
An exploration of tools and methodologies for valuation of biodiversity
Since the construction of hydroelectric power stations was expected to negatively influence waterquality, costs of maintaining the current quality were also factored in using replacement costs.
The net present value of all use values was then calculated, to derive absolute values for rentability.The next step, still focusing on the use values only, calculated the internal interest rate, the relativerentability of a project.
To derive non-use values, a contingent valuation study with 962 personal interviews was carried outby an independent market research institute. Project I was not included it this part, since it was quitesimilar to project II regarding its ecological properties. Based on about three pages of information,respondents were asked about their socioeconomic background, their general attitude towards wetlandsand their conservation, their knowledge of the proposed park as well as their willingness to pay anentrance fee. They were then asked what development option they would prefer, what they would bewilling to pay for it, and to give their reasons for valuing the wetlands. From these answers, put into astatistical model, the researchers deduced the influences on the WTP from factors such as income, orhaving been to the area before.
Regarding the net present value of the use values, Project IV took the lead with 37.7 bn ATS, followedby Project III and Project II, with Project I providing a negative value. However, project II had thehighest internal interest rate with 7.76%. Since many investment decisions are made based on thereturn-on-investment in relative terms, this would already make the large national park option theeconomically best choice.
The CV study found the willingness to pay for the national park per respondent to be 329.25 ATS,with all zero-bids included. This is a very low estimate, since some part of the zero-bids can always beexplained by protest bids <cross ref>. Applying this value to all Austrians and over the timeframe of 72years would amount to a net present value of 109.5 bn ATS for Project II. Considering only 20% of this
90 One Austrian Schilling (ATS) was worth about US-$ 0,09 in 1996.

An exploration of tools and methodologies for valuation of biodiversity
64
number would already lead to a net present value of establishing the national park that is higher thanthat of any hydroelectric option.
This study was part of a research process, which, with much support from the public, eventually ledto the establishment of the Donau Auen National Park on 27 October 1996.
Kosz, M. (1996), “Valuing riverside wetlands: the case of the “Donau-Auen” national park”, EcologicalEconomics 16, 109–127.

65
An exploration of tools and methodologies for valuation of biodiversity
case study xi: - szigetkoez wetland, hungary
Region: Central and Eastern Europe (Hungary)Ecosystem valued: Riverside WetlandsMethods employed: Benefits Transfer
The Szigetkoez Wetland case is in many ways similar to case study X above, where valuable Danubeanwetlands were eventually protected by a National Park. However, in the case of the Szigetkoez wetland,the damage to the ecosystem by a hydro-electrical power generation project had already been inflictedwhen the valuation study was prepared. This carried the consequence that the study had to addressrestoration options instead of conservation options.
The Szigetkoez wetland is again located along the Danube River, downstream from Austria where theriver forms the border of Hungary and Slovakia, making management of the river a sharedresponsibility. Before the hydroelectrical development, the wetlands showed a very high level ofbiodiversity which was due to a mix of different terrains under varying influence from the river. A jointpower generation project by Czechoslovakia and Hungary in the 1980s was abandoned by Hungary, butCzechoslovakia went ahead with construction of a dam. A reduction of up to 90 % in water levelsresulted, leading most of Szigetkoez wetland to dry out. In 1995, the construction of an underwater weirimproved water supplies in some parts of the wetland, but could not restore the regular water levels northe patterns in changes of water levels resulting in particular from flooding. As a consequence,vegetation changed drastically, with a reduction in overall biodiversity.
Due to lack of funding and time to conduct primary research, the results from the Donau AuenNational Park study (see case X above) were used for a benefits transfer study. Instead of transferring abenefit function that would include a variety of variables, the researchers decided to transfer unit valueswith an adjustment by income only, the assumption being that the environmental sensitivity and otherfactors were the same in Austria and Hungary. Hence, differences were accounted for by the differencein GDP only. The authors reviewed a number of studies from other regions; their review indicated thatHungarians did have a similar willingness-to-pay for ecosystem conservation.
The two ecosystems provided some important prerequisites for a benefits transfer. Both are located onthe same river, are unique within each country, and shelter a high level of biodiversity. Both were faced withthe same choice of development against protection. The fact that the choice was already made in the case ofSzigetkoez is not relevant here, since it is the status of the wetland before development that is being valued.
The findings of the Austrian study of willingness-to-pay per person and year (329.25ATS) werecompared to the Austrian 1993 GDP per year (265,812), showing a willingness-to-pay of 0.12% of theGDP per person. This number was transferred to the 1999 GDP of Hungary, assuming that thewillingness-to-pay had not changed in the six years in between. The Hungarian GDP was corrected,taking into account an illegal economy of about 15% of GDP. This resulted in the following numbers:
91 One 1999 Hungarian Forint equals about 0.004 1999 USD.

An exploration of tools and methodologies for valuation of biodiversity
66
The figure for the willingness-to-pay per person and year was then multiplied by the population ofHungary over the age of 14, the same age limit as the original study.
The fact that the Hungarian wetland is considerably larger was factored in as well, assuming that thewillingness-to-pay rises proportionally with the size of the area considered. This leads to an overallwillingness-to-pay for (hypothetical) conservation in the original form of HUF 16.83 bn. Anothercritical assumption was made for the remainder of the study, namely, that willingness-to-pay values fordeteriorated conditions of the wetland could be estimated by lowering the initial figure proportional tothe loss in size of the undisturbed part of the wetland.
The authors considered three options as possible future states of the wetland. One is the status quo,called variant “C” in the table below. Restoration to the original state is not considered; instead, two“meandering” alternatives are considered. Under these options, further barriers would be introduced intothe riverbed, which would direct water into side channels. With a resulting degradation of 5–30 % of thewetland, depending on the project, the willingness-to-pay numbers are decreased accordingly. These figuresare then compounded into a net present value, and the resulting losses in net present value compared to theoriginal willingness-to-pay. Depending on the discount rate, the following results are found:
In a next step, these numbers could be used for a cost-benefit analysis, including costs for theconstruction of the structures needed to redirect water flow, or the opportunity costs of letting morewater through the damn.
Szerényi, Marjainé Z.; Kovács, Eszter; Kerekes, Sándor; Kék, Mónika (2001):“Loss of Value of theSzigetköz Wetland due to the Gabcikovo-Nagymaros Barrage System development: Application of thebenefit transfer in Hungary” OECD Environmental Directorate, OECD, Paris.

67
An exploration of tools and methodologies for valuation of biodiversity
case study xii: tourism value of the great barrier reef, australia
Region: Western Europe and OthersEcosystem valued: Coral ReefMethod employed: Travel Cost Analysis
Australia’s Great Barrier Reef is the largest coral reef system in the world, consisting of roughly 3000individual reefs combined with hundreds of islands, covering an area of almost 350 thousand km². Thereef provides a variety of services to humans, including fisheries support and coastal protection, as wellas recreation. The Great Barrier Reef is known as one of the best diving destinations worldwide, attract-ing over two million visitors every year. It is however endangered by threats such as mining, over fish-ing, water pollution, and global climate change.
Because of the high number of visitors, the travel cost method becomes an obvious choice for thevaluation of the reef by the present study.
Two data sources were used. One was a survey of 607 persons visiting the Great Barrier Reef Sept. 1stand Dec. 1st 2000. While this data had the advantage of being representative, it also featured the problemthat many visitors purchase travel packages which include other services and experiences than visiting thereef, which makes a distinction in terms of value difficult. Some visitors also benefited from special lowair fares that were not available to everyone. For these reasons, an alternative set of data was generatedfrom one single travel agent for visitors from all regions of the world. While this enabled researches todefine one “standard” trip, generating comparable data from all countries, the trips taken from differentcountries might vary greatly in reality. Both approaches and their ability to predict actual visitorbehaviour were later tested in different models. As a third approach, a 2-stage least squares estimate wasalso used that drew on both sets of data and travel distances to estimate the predicted travel costs.
For deriving the demand functions, visitors were grouped by origins into 39 regions. Those weremostly entire countries, except Australia, Canada and the United States which were separated intovarious regions. The visitation rate per population of these regions served as the dependent variable forthe demand function. This is usually done where the frequency of visitation can not be used becausemost visitors visit only once per year, which is the case for international Great Barrier Reef visitors.
Two different statistical models were tested by analysing how well they predicted actual visitationrates. The polynomial model was considered to better fit the data, with actual travel costs performingbetter than those given by the travel agent. The 2-stage least square estimate provided very good resultsin one model, but performed badly in the other.
The table below shows the results from the two models with the different data sets used, the annualconsumer surplus estimates in million USD per year. The authors decided against using the result of thepolynomial model with travel agent costs, since it included very high values for Japan and the USA thatwere hard to explain. This is also part of a conservative approach.
The other results range from 710 million to 1.6 billion, rewults which are consistent with the figuresapplied by the Great Barrier Reef Marine Authority’s figures which assumes an annual value of 800million. Discounting these annual benefits at 4%, a rate rather commonly used in envrionmentalvaluation, yields a net present value of between USD 18 and 40 billion. This makes the Great Barrier Reefone of the most valuable ecosystems in the world, in particular when taking into account that thevaluation study only captured one aspect of the total economic value of the Great Barrier Reef, that is,not including other ecosystem services provided such as fishery nursing ground or coastal protection..Benefits per visitor amount to USD 350-800, a value comparable to those found in previous studiesregarding coral reefs, but higher than most valuations of other ecosystems.

An exploration of tools and methodologies for valuation of biodiversity
68
The distribution of benefits is also an important result. While varying among the different modelsand data sets, the study shows that a share of 40% to 80% of benefits go to visitors from abroad. Theauthors take this as an argument for international funds to protect coral reefs, especially for the benefitof poorer countries.
Carr, Liam; Mendelsohn, Robert (2003): “Valuing Coral Reefs: A Travel Cost Analysis of the GreatBarrier Reef”, Ambio 32, No. 5.

69
An exploration of tools and methodologies for valuation of biodiversity
case study xiii: the exxon valdez oil spill, united states of america
Region: Western Europe and OthersEcosystem valued: Marine and Coastal EcosystemsMethod employed: Contingent Valuation
When the Exxon Valdez Oil tanker ran into a submerged reef in Prince William Sound, Alaska, in March1998, this was the largest oil spill in US history, and perceived as one of the worst environmental disas-ters. 11 million gallons of crude oil spread over almost 2000 km of Alaskan Coastline, killing hundreds ofthousands of seabirds and other wildlife. The court case brought against Exxon for natural resource dam-age by the Alaskan and federal government was the first high-profile case were compensation for passive-use values, or existence values, was sought. These values were determined by a contingent valuation study,triggering a major debate on the reliability of this method that also resulted in the report by the NOAApanel (Arrow et al 1993) which first set widely accepted standards for the application of this method.
The original report to the attorney general of Alaska on the passive use value lost through the oil spillwas published in November 1992. Its findings were presented again by the original authors in 2003; thissummary will draw on this more recent paper.
The study already followed many of the guidelines that were later established by the NOAA panel,including for instance a discrete choice referendum elicitation format and a very accurate description ofthe situation and policy options.
The survey was developed over an 18 month period, including field testing, work with focus groupsand a series of four pilot surveys. An extensive description of damages was included to ensure that onlythose damages that were actually caused by the spill would be valued by participants. Such extensivebriefing however also made it harder to create a survey instrument that would be understood byrespondents from all areas of society and varying levels of education. Various diagnostic checks werecarried out towards this end. The wording of the survey was also reviewed to ensure neutrality, and aquestion asking respondents on who they thought was sponsoring the study included to check if thetexts appeared biased. The study tried to be as conservative as possible, in case of doubt choosingmethods and designs that would result in lower willingness to pay statements.
The interviews took about 40 minutes, half of which was used for presenting the damage and apossible program that might prevent such disasters in the future. About 1600 representatively selected
A.VERY HEAVILY OILED SHORE BEFORE CLEANUP B. COLUMBIA GLACIER ON PRINCE WILLIAM SOUND

An exploration of tools and methodologies for valuation of biodiversity
70
households from all of the United States were surveyed. A double-bounded dichotomous choice formatwas utilized, offering a lower amount to those replying “no” to the first question, and a higher sum tothose replying “yes”. Respondents could also change their answers at a later point in the questionnaire ifthey wished. At the beginning of the questionnaire respondents were asked some general questionsabout their attitudes towards different public goods as well as their knowledge of the spill before theobjective of the study was revealed to them.
The description of the area included some pictures and maps of Prince William Sound before andafter the spill, showing the extent of the spill as well as clean-up measures. Scientific estimates on theduration of the injuries were presented, considering it likely that most of the effects would wear off overa few years.
Estimated numbers of killed animals were also given. Pictures of specific animals affected by the oilspill were shown. However no pictures of killed or harmed birds were shown to keep estimatesconservative and reduce impulsive high bids. Respondents were also informed that large bird kills couldoccur naturally and that none of the affected species were endangered by extinction.
The description then turned towards a description of a program that was expected to reduce thelikelihood of such injuries. The plan introduced the concept of escort ships to accompany tankersthrough Prince William Sound. These would be able to prevent spills by pushing or pulling tankers awayfrom obstacles as well as contain possible spills with the suitable equipment.
The valuation was then carried out, with three different sub samples being presented with differentpayment options in the dichotomous choice format.

71
An exploration of tools and methodologies for valuation of biodiversity
Other questions seeked to elicit why respondents had chosen amounts the way they did, and if theyhad accepted the scenario as it was presented. They were finally given the chance to reconsider andchange their choice on the original valuation question.
A statistical model with a valuation function was then constructed using the replies, and sensitivitytests carried out thereon. USD 2.8 Billion (in 1990) were found to be the lower bound of willingness topay estimates, and the lost passive use value. However, even very conservative calculations found somesignificantly higher results.
The State of Alaska and the US Government settled their lawsuits agains Exxon for USD 1 billion, inaddition, Exxon spend approximately 2 billion on clean-up activities A class action lawsuit was decidedin December 2006, awarding USD 2.5 billon of punitive damages, half of the original fine. These figuresare consistent with the estimate of the valuation study. A program similar to that described in the study,using escort ships, has been introduced and in one case prevented a possible spill.
Carson, Richard; Mitchell, Robert; Hanemann, Michael; Kopp, Raymond; Pressers, Stanley; Ruud, Paul(2003). “Contingent Valuation and Lost Passive Use: Damages from the Exxon Valdez Oil Spill”,Environmental and Resource Economics 25(3): 257–286.