cb richard ellis real estate fund of … · cb richard ellis real estate fund of funds public...
TRANSCRIPT

CB RICHARD ELLIS REAL ESTATE FUND OF FUNDS
PUBLIC LIMITED COMPANY
(An umbrella investment company capable of having both limited liquidity and closed-ended Sub-Funds with variable capital and having segregated liability
between its Sub-Funds incorporated with limited liability in Ireland under registration number 433538)
CB RICHARD ELLIS EUROPE (ex-UK) ALPHA FUND
CB RICHARD ELLIS ASIA ALPHA PLUS FUND
CBRE GMM ASIA ALPHA PLUS FUND III
CB RICHARD ELLIS ASIA ALPHA PLUS II FEEDER FUND
Annual Report and Audited Financial Statements for the year ended
31 December 2013

CB RCB RCB RCB RICHARD ELLIS REAL ESTATE FUND OF FUNDS ICHARD ELLIS REAL ESTATE FUND OF FUNDS ICHARD ELLIS REAL ESTATE FUND OF FUNDS ICHARD ELLIS REAL ESTATE FUND OF FUNDS PUBLIC LIMITED COMPANYPUBLIC LIMITED COMPANYPUBLIC LIMITED COMPANYPUBLIC LIMITED COMPANY Annual rAnnual rAnnual rAnnual reporteporteporteport for the yearfor the yearfor the yearfor the year ended 31ended 31ended 31ended 31 DecemberDecemberDecemberDecember 2012012012013333
TABLE OF CONTENTSTABLE OF CONTENTSTABLE OF CONTENTSTABLE OF CONTENTS 1. Directors’ Report 3 2. Report of the Custodian to the Shareholders 7 3. Independent Auditor’s Report 8 4. Report of the Investment Manager 10 • Structure
• Investment Objectives
• Global Economic Conditions and Property Market Outlook
• CB Richard Ellis Europe (ex-UK) Alpha Fund
• CB Richard Ellis Asia Alpha Plus Fund
• CBRE GMM Asia Alpha Plus Fund III
• CB Richard Ellis Asia Alpha Plus II Feeder Fund
5. Statement of Investments 18 6. Statement of Changes in the Portfolio (Unaudited) 22 7. Financial Statements 36 • Balance Sheet • Profit and Loss Account • Statement of Changes in Net Assets Attributable to Shareholders • Cash Flow Statement • Notes to the Financial Statements 8. Administration 84

Page 3
CB RICHARD ELLIS REAL ESTATE FUND OF FUNDS CB RICHARD ELLIS REAL ESTATE FUND OF FUNDS CB RICHARD ELLIS REAL ESTATE FUND OF FUNDS CB RICHARD ELLIS REAL ESTATE FUND OF FUNDS PUBLIC LIMITED COMPANYPUBLIC LIMITED COMPANYPUBLIC LIMITED COMPANYPUBLIC LIMITED COMPANY Annual report for the year ended 31 December 201Annual report for the year ended 31 December 201Annual report for the year ended 31 December 201Annual report for the year ended 31 December 2013333 Directors’ ReportDirectors’ ReportDirectors’ ReportDirectors’ Report
The Directors submit their Annual Report together with the audited financial statements for CB Richard Ellis Real Estate Fund of Funds Public Limited Company (the “Company”) for the year ended 31 December 2013. The Company is organised in the form of an umbrella fund with four sub-funds, CB Richard Ellis Europe (ex-UK) Alpha Fund (“Alpha Fund”), which launched on 25 January 2007, CB Richard Ellis Asia Alpha Plus Fund (“Asia Alpha Plus Fund”), which launched on 1 July 2009, CB Richard Ellis Asia Alpha Plus II Feeder Fund (“Asia Alpha Plus II Feeder Fund”), which launched on 23 December 2011 and CBRE GMM Asia Alpha Plus Fund III (“Asia Alpha Plus Fund III”), which launched on 6 June 2013 (each a “Sub-Fund”, collectively the “Sub-Funds”). All four of these Sub-Funds were in existence at the year end. Statement of Directors’ Responsibilities Statement of Directors’ Responsibilities Statement of Directors’ Responsibilities Statement of Directors’ Responsibilities The Directors are responsible for preparing the Annual Report and the audited financial statements in accordance with applicable Irish Company Law and generally accepted accounting practice in Ireland including the accounting standards issued by the Financial Reporting Council and promulgated by Chartered Accountants Ireland. Irish Company Law requires the Directors to prepare financial statements for each financial year which give a true and fair view of the state of affairs of the Company and the Group and of the profit or loss of the Company for that year. In preparing the financial statements, the Directors are required to: - select suitable accounting policies for the Company’s financial statements and then apply them
consistently; - make judgements and estimates that are reasonable and prudent; and - prepare the financial statements on the going concern basis unless it is inappropriate to presume
that the Company will continue in business. The Directors are responsible for keeping proper books of account, which disclose with reasonable accuracy at any time the financial position of the Company, and to enable them to ensure that the financial statements are prepared in accordance with accounting standards generally accepted in Ireland and comply with Irish statute comprising the Companies Acts, 1963 to 2013 and the Listing Rules of the Irish Stock Exchange. They are also responsible for safeguarding the assets of the Company and hence for taking reasonable steps for the prevention and detection of fraud and other irregularities. The Directors are also required to include a management report containing a fair review of the business and a description of the principal risks and uncertainties facing the Company. Books of Account Books of Account Books of Account Books of Account The measures taken by the Directors to secure compliance with the Company’s obligation to keep proper books of account in accordance with Section 202 of the Companies Act, 1990, are the use of appropriate systems and procedures, and employment of the services of a fund administrator, RBC Investor Services Ireland Limited, (the “Administrator”). The books of account are kept at the offices of the Administrator located at George’s Quay House, 43 Townsend Street, Dublin 2, Ireland.
Page 4
CB RICHARD ELLIS REAL ESTATE FUND OF FUNDS CB RICHARD ELLIS REAL ESTATE FUND OF FUNDS CB RICHARD ELLIS REAL ESTATE FUND OF FUNDS CB RICHARD ELLIS REAL ESTATE FUND OF FUNDS PUBLIC LIMITED COMPANYPUBLIC LIMITED COMPANYPUBLIC LIMITED COMPANYPUBLIC LIMITED COMPANY Annual report for the year ended 31 December 201Annual report for the year ended 31 December 201Annual report for the year ended 31 December 201Annual report for the year ended 31 December 2013333 Directors’ Directors’ Directors’ Directors’ Report (Continued)Report (Continued)Report (Continued)Report (Continued)
Results, Activities and Future DevelopmentsResults, Activities and Future DevelopmentsResults, Activities and Future DevelopmentsResults, Activities and Future Developments The results of operations of the Company are set out on pages 30 to 32. A detailed review of activities and further developments is contained in the Report of the Investment Manager. Directors Directors Directors Directors The names of persons who served as Directors at any time during the year ended 31 December 2013 are set out below:
James McMahon Independent Director, Ireland Colm Luddy CBRE, Ireland James Cleary Independent Director, Ireland Laurie Romanak (Resigned on 28 May 2013) CBRE Global Investors, United States Paul Mundell (Appointed on 23 August 2013) CBRE Global Investors, United Kingdom Stuart Savidge CBRE Global Investors, United Kingdom The Directors are all non-executive Directors of the Company. Directors’ and Company Secretary Interests in Shares and Contracts Directors’ and Company Secretary Interests in Shares and Contracts Directors’ and Company Secretary Interests in Shares and Contracts Directors’ and Company Secretary Interests in Shares and Contracts Except as noted below, none of the Directors, the Company Secretary, nor their families hold or held any beneficial interest in the Company at 31 December 2013 or during the year (2012: nil).
The following are the Directors’ and their families interest in CB Richard Ellis Asia Alpha Plus Fund and CBRE GMM Asia Alpha Plus Fund III as at 31 December 2013 and as at 31 December 2012:
CB Richard Ellis Asia Alpha Plus FundCB Richard Ellis Asia Alpha Plus FundCB Richard Ellis Asia Alpha Plus FundCB Richard Ellis Asia Alpha Plus Fund
NameNameNameName Class B (USD) sharesClass B (USD) sharesClass B (USD) sharesClass B (USD) shares Class I (USD) sharesClass I (USD) sharesClass I (USD) sharesClass I (USD) shares
31 December 2013 31 December 2012 31 December 2013 31 December 2012
Stuart Savidge 171.28 167.90 80.00 80.00
CBRE GMM Asia Alpha Plus Fund IIICBRE GMM Asia Alpha Plus Fund IIICBRE GMM Asia Alpha Plus Fund IIICBRE GMM Asia Alpha Plus Fund III
NameNameNameName Class Class Class Class MMMM (USD) shares(USD) shares(USD) shares(USD) shares Class Class Class Class IIII (USD) shares(USD) shares(USD) shares(USD) shares
31 December 2013 31 December 2012 31 December 2013 31 December 2012
Stuart Savidge 12,625.67 - 80.00 -
None of the other Directors or the Company Secretary, held at 31 December 2013, any beneficial interest in the shares of the Company. Transactions Involving DirectorsTransactions Involving DirectorsTransactions Involving DirectorsTransactions Involving Directors The Board of Directors are not aware of any contracts, or arrangements of any significance, in relation to the business of the Company in which the Directors had any interest, as defined in the Companies Act, 1990, at any time during the year ended 31 December 2013 (2012: nil). Risk Management Objectives and PoliciesRisk Management Objectives and PoliciesRisk Management Objectives and PoliciesRisk Management Objectives and Policies The risks as determined by FRS 29, arising from the Company’s financial instruments are market risk (including market price risk, currency risk and interest rate risk), credit risk, liquidity risk. Details of those risks together with the risk management policies to address those risks are set out in Note 2, “Financial Risk Management”.

Page 5
CB RICHARD ELLIS REAL ESTATE FUND OF FUNDS CB RICHARD ELLIS REAL ESTATE FUND OF FUNDS CB RICHARD ELLIS REAL ESTATE FUND OF FUNDS CB RICHARD ELLIS REAL ESTATE FUND OF FUNDS PUBLIC LIMITED COMPANYPUBLIC LIMITED COMPANYPUBLIC LIMITED COMPANYPUBLIC LIMITED COMPANY Annual report for the year ended 31 December 201Annual report for the year ended 31 December 201Annual report for the year ended 31 December 201Annual report for the year ended 31 December 2013333 Directors’ Report (Continued)Directors’ Report (Continued)Directors’ Report (Continued)Directors’ Report (Continued)
Significant Events During the YearSignificant Events During the YearSignificant Events During the YearSignificant Events During the Year CBRE GMM Asia Alpha Plus Fund III launched on 6 June 2013. The total commitments by investors to Asia Alpha Plus Fund III amount to USD 120.7 million as of the date of approval of the Financial Statements. CB Richard Ellis Asia Alpha Plus sold its interest in the AMP Capital Fund in Quarter 2 2013 and sales proceeds totalling USD 15.5 million were distributed to investors. The Investment Manager further distributed USD 36.4 million (of which USD 20.5 million return of capital and USD 15.9 million dividends) resulting from partial realisations in the SCJREP IV Loan Fund and the ARA Asia Dragon Fund. During the year, CB Richard Ellis Europe (ex-UK) Alpha Fund paid an extraordinary distribution to its investors of EUR 11 million in June 2013. In addition to this, a return of capital of EUR 11.4million occurred in February 2013 (approved in December 2012) followed by a second return of capital of EUR 10.0 million in December 2013. Corporate Governance StatementCorporate Governance StatementCorporate Governance StatementCorporate Governance Statement The Company is subject to and complies with Irish statute comprising the Companies Acts, 1963 to 2013, the regulatory requirements of the Central Bank of Ireland and the Listing Rules of the Irish Stock Exchange. The Company also complies with the European Communities (Directive 2006/46/EC) Regulations (S.I. 450 of 2009 and S.I. 83 of 2010). The Board of Directors adopted the Corporate Governance Code for Collective Investment Schemes and Management Companies, as published by the Irish Funds Industry Association, with effect from 29 November 2012. The Board of Directors has procedures in place to ensure all relevant books of account are properly maintained and are readily available including the production of the Company's annual financial statements. The books of account and annual financial statements are prepared and maintained by the Administrator, who is regulated by the Central Bank, and the annual financial statements are required to be approved by the Board of Directors of the Company. On a regular basis, the Board of Directors also examines and evaluates the Administrator's financial accounting and reporting and monitors and evaluates the auditors' performance, qualifications and independence. The annual financial statements of the Company are required to be filed with the Central Bank and the Irish Stock Exchange. The annual financial statements are also audited annually by the Company's auditors and their findings are reported annually to the Board of Directors.


Page 10
CB RICHARD ELLIS REAL ESTATE FUND OF FUNDS CB RICHARD ELLIS REAL ESTATE FUND OF FUNDS CB RICHARD ELLIS REAL ESTATE FUND OF FUNDS CB RICHARD ELLIS REAL ESTATE FUND OF FUNDS PUBLIC LIMITED COMPANYPUBLIC LIMITED COMPANYPUBLIC LIMITED COMPANYPUBLIC LIMITED COMPANY Annual Annual Annual Annual rrrreport for the eport for the eport for the eport for the year ended 31 year ended 31 year ended 31 year ended 31 December 201December 201December 201December 2013333 Report of the Investment Manager Report of the Investment Manager Report of the Investment Manager Report of the Investment Manager
1. Structure1. Structure1. Structure1. Structure
CB Richard Ellis Real Estate Fund of Funds Public Limited Company (the “Company”) is an umbrella investment company capable of having both limited liquidity and closed ended sub-funds with variable capital and having segregated liability between its Sub-Funds. The Company was incorporated with limited liability in Ireland on 25 January 2007.
It qualifies and is authorised in Ireland by the Central Bank of Ireland as a designated investment company pursuant to Part XIII of the Companies Act, 1990.
This report which covers the period from 1 January 2013 to 31 December 2013 is in respect of the four Sub-Funds of the Company, CB Richard Ellis Europe (ex-UK) Alpha Fund (“Alpha Fund”) which launched on 25 January 2007, CB Richard Ellis Asia Alpha Plus Fund (“Asia Alpha Plus Fund”) which launched on 1 July 2009, CB Richard Ellis Asia Alpha Plus II Feeder Fund (“Asia Alpha Plus II Feeder Fund”), which launched on 23 December 2011 and CBRE GMM Asia Alpha Plus Fund III (“Asia Alpha Plus Fund III”), which launched on 6 June 2013. All four of these Sub-Funds were in existence at the year end.
The Company had the following share classes in each of the Sub-Funds at 31 December 2013:
SubSubSubSub----FundFundFundFund SSSShare Classhare Classhare Classhare Class
CB Richard Ellis Europe (ex-UK) Alpha Fund Class B (€) shares
CB Richard Ellis Europe (ex-UK) Alpha Fund Class B (GBP Hedged) shares
CB Richard Ellis Europe (ex-UK) Alpha Fund Class B (GBP Unhedged) shares
CB Richard Ellis Asia Alpha Plus Fund Class B (USD) shares
CB Richard Ellis Asia Alpha Plus Fund Class I (USD) shares
CB Richard Ellis Asia Alpha Plus II Feeder Fund Ordinary shares
CBRE GMM Asia Alpha Plus Fund III Class A (USD) shares
CBRE GMM Asia Alpha Plus Fund III Class M (USD) shares
CBRE GMM Asia Alpha Plus Fund III Class I (USD) shares
2.2.2.2. Investment ObjectivesInvestment ObjectivesInvestment ObjectivesInvestment Objectives
CB Richard Ellis Europe (exCB Richard Ellis Europe (exCB Richard Ellis Europe (exCB Richard Ellis Europe (ex----UK) Alpha FundUK) Alpha FundUK) Alpha FundUK) Alpha Fund
The investment objective of CB Richard Ellis Europe (ex----UK) Alpha Fund is to provide investors in the Class B (EUR) shares, Class B (GBP Hedged) shares and Class B (GBP Unhedged) shares with a total return on their invested commitment of between 8% ---- 10% per annum net of all fees and expenses, by obtaining diversified exposure to pan-European real estate (excluding the United Kingdom) through investment in investment funds and/or property related assets.
CB Richard Ellis Europe (ex----UK) Alpha Fund provides a diverse exposure to the pan----European property markets with a broad spread of investments in the office, retail, industrial, residential or other property sectors. Being a fund of funds, CB Richard Ellis Europe (ex----UK) Alpha Fund invests in specialist funds managed by recognised specialists within the local market places of continental Europe.

Page 11
CB RICHARD ELLIS REAL ESTATE FUND OF FUNDS CB RICHARD ELLIS REAL ESTATE FUND OF FUNDS CB RICHARD ELLIS REAL ESTATE FUND OF FUNDS CB RICHARD ELLIS REAL ESTATE FUND OF FUNDS PUBLIC LIMITED COMPANYPUBLIC LIMITED COMPANYPUBLIC LIMITED COMPANYPUBLIC LIMITED COMPANY Annual report for the year ended 31 December 201Annual report for the year ended 31 December 201Annual report for the year ended 31 December 201Annual report for the year ended 31 December 2013333 Report of the Investment Manager (Continued)Report of the Investment Manager (Continued)Report of the Investment Manager (Continued)Report of the Investment Manager (Continued)
2.2.2.2. Investment Objectives (Continued)Investment Objectives (Continued)Investment Objectives (Continued)Investment Objectives (Continued)
CB Richard CB Richard CB Richard CB Richard Ellis Europe (exEllis Europe (exEllis Europe (exEllis Europe (ex----UK) Alpha Fund (Continued)UK) Alpha Fund (Continued)UK) Alpha Fund (Continued)UK) Alpha Fund (Continued) CB Richard Ellis Europe (ex----UK) Alpha Fund does not invest in investment funds or property related assets that provide exposure to the United Kingdom property markets, unless such exposure is immaterial or ancillary to the main investment strategy of CB Richard Ellis Europe (ex----UK) Alpha Fund.
In addition, CB Richard Ellis Europe (ex----UK) Alpha Fund may use property derivatives only (a) to contribute to a reduction of risk on the part of the Company, or, (b) to facilitate the Company’s efficient portfolio management (including the reduction of cost or generation of additional capital or income with an acceptable level of risk) and, in particular, employing only property swaps which are based on the value of an underlying property index.
CB Richard Ellis Asia Alpha Plus FundCB Richard Ellis Asia Alpha Plus FundCB Richard Ellis Asia Alpha Plus FundCB Richard Ellis Asia Alpha Plus Fund
The investment objective of CB Richard Ellis Asia Alpha Plus Fund is to provide investors in the Class B (USD) Shares with a total return on their invested commitment of between 13% ---- 15% per annum net of all fees and expenses by obtaining diversified exposure to Asian real estate through investment in investment funds and/or property related assets.
CB Richard Ellis Asia Alpha Plus Fund provides a diverse exposure to Asian property markets with a broad spread of investments in the office, retail, industrial, residential or other property sectors. Being a fund of funds, the CB Richard Ellis Asia Alpha Plus Fund invests in specialist funds managed by recognised specialists within the local market places of Asia.
In addition, CB Richard Ellis Asia Alpha Plus Fund may use property derivatives primarily to (a) contribute to a reduction of risk on the part of the Company, or (b) to enhance returns, or (c) to facilitate the Company’s efficient portfolio management (including the reduction of cost or generation of additional capital or income with an acceptable level of risk) and, in particular, employing only property swaps which will be based on the value of an underlying property index. CB RiCB RiCB RiCB Richard Ellis Asia Alpha Plus II Feeder Fundchard Ellis Asia Alpha Plus II Feeder Fundchard Ellis Asia Alpha Plus II Feeder Fundchard Ellis Asia Alpha Plus II Feeder Fund The CB Richard Ellis Asia Alpha Plus II Feeder Fund invests in the CBRE Asia Alpha Plus Fund II FCP-SIF which commenced in July 2011 with USD 175.0 million in investor commitments and had a final close in December 2011 with total commitments of USD 259.8 million. The investment objective of The CB Richard Ellis Asia Alpha Plus II Feeder Fund, by investing in the master fund, is to invest in a selection of Asian real estate investments to earn an IRR, net of all management fees, organisational expenses, operating expenses and promote fee, of 15% p.a. over an expected “life span” of five years. CBRE Asia Alpha Plus Fund II is a Luxembourg specialised investment fund. The Fund is managed by CB Richard Ellis Global Alpha S.à r.l. which is ultimately owned by CB Richard Ellis Group, Inc. The master fund provides a diverse exposure to the Asian property markets with a broad spread of investments in the office, retail, industrial, residential or other property sectors. As the master fund is a fund of funds, it invests in specialist funds managed by recognised specialists within the local market places of Asia.
Page 12
CB RICHARD ELLIS REAL ESTATE FUND OF FUNDS CB RICHARD ELLIS REAL ESTATE FUND OF FUNDS CB RICHARD ELLIS REAL ESTATE FUND OF FUNDS CB RICHARD ELLIS REAL ESTATE FUND OF FUNDS PUBLIC LIMITED COMPANYPUBLIC LIMITED COMPANYPUBLIC LIMITED COMPANYPUBLIC LIMITED COMPANY Annual report for the year ended 31 Annual report for the year ended 31 Annual report for the year ended 31 Annual report for the year ended 31 December 201December 201December 201December 2013333 Report of the Investment Manager (Continued)Report of the Investment Manager (Continued)Report of the Investment Manager (Continued)Report of the Investment Manager (Continued)
2.2.2.2. Investment Objectives (Continued)Investment Objectives (Continued)Investment Objectives (Continued)Investment Objectives (Continued)
CBRE GMM Asia Alpha Plus Fund IIICBRE GMM Asia Alpha Plus Fund IIICBRE GMM Asia Alpha Plus Fund IIICBRE GMM Asia Alpha Plus Fund III The investment objective of CBRE GMM Asia Alpha Plus Fund III is to provide an IRR over the life of the Fund of 15% per annum net of all fees and expenses. This is to be achieved through the selection of preferred strategies and markets across the Asia Pacific region whilst executing investments with a mixture of clubs, co-investments and secondary investments. The Fund held a first close of USD 95 million in June 2013 and through a subsequent close had total investor commitments of USD 120.7 million as at 31 December 2013. The Fund is expected to gain further commitments through the first half of 2014 before the final close. From an investment perspective based upon closed investments and pipeline the current investor commitments are forecast to be fully committed by early 2014. These initial investments has a significant weighting towards logistics assets where we continue to see structural demand from both the tenant and investment perspective. 3. 3. 3. 3. Global Economic Conditions and Property Market OutlookGlobal Economic Conditions and Property Market OutlookGlobal Economic Conditions and Property Market OutlookGlobal Economic Conditions and Property Market Outlook Global economic growth saw a modest improvement in 2013 with an estimated expansion over the year of 2.4%. 2014 is expected to see this positive momentum maintained as almost all countries enter growth territory including the weakest in Eurozone. Consensus expectations speak to close to a 3% Global GDP growth in 2014. In the Eurozone, while the central outlook remains for the below trend economic growth, the downside risk of a break-up of the Eurozone or a systemic bank crisis has diminished. Spanish bond yields have fallen to a sustainable level, and Italian bond yields have only ticked up marginally on the inconclusive election result. The Cypriot crisis, while bad for Cyprus, has so far not been contagious, with money market rates and deposits in Spain and Italy unaffected to date. Financing conditions have also improved with more institutions willing to provide lending for real estate. Given this backdrop, investment sentiment for European real estate has significantly improved, which was reflected in increased investment volumes. We expect that rents will also start to pick up and we believe that Europe is becoming much more attractive from investment perspective. The USA recovery is entering into a more mature stage driven by recovering housing market, strong public equities market, strengthening labour markets, and growing retail sales. After more than four years of inconsistent and sub-trend growth of c. 2% per annum, economic activity is expected to settle into a more stable 2.5% growth in 2014. Positive economic developments have set stage for the Fed to commence tapering its quantitative easing program. The region delivered very strong returns over the past couple of years and we expect to see continued good performance driven by improving fundamentals. Although, prime real estate is becoming fully priced, second tier locations as well as buildings that may need some asset management are attractively priced. Japan is enjoying a rebound in confidence as “Abenomics” convinces consumers and businesses that deflation will finally be quashed. And in China, the leadership handover has been safely traversed, and the move to lower but better balanced growth entrenched. That said, there are some concerns with the Chinese banking and shadow banking lending growth and its sustainability. China is still forecast to experience medium-term growth of c. 7% compared to the 1990s and 2000s average of c. 9%, as policymakers try to curb speculation in residential, and rebalance growth toward the consumer sector.

Page 13
CB RICHARD ELLIS REAL ESTATE FUND OF FUNDS CB RICHARD ELLIS REAL ESTATE FUND OF FUNDS CB RICHARD ELLIS REAL ESTATE FUND OF FUNDS CB RICHARD ELLIS REAL ESTATE FUND OF FUNDS PUBLIC LIMITED COMPANYPUBLIC LIMITED COMPANYPUBLIC LIMITED COMPANYPUBLIC LIMITED COMPANY Annual report for the year ended 31 DecAnnual report for the year ended 31 DecAnnual report for the year ended 31 DecAnnual report for the year ended 31 December 201ember 201ember 201ember 2013333 Report of the Investment Manager (Continued)Report of the Investment Manager (Continued)Report of the Investment Manager (Continued)Report of the Investment Manager (Continued)
3. 3. 3. 3. Global Economic Conditions and Property Market Outlook (Continued)Global Economic Conditions and Property Market Outlook (Continued)Global Economic Conditions and Property Market Outlook (Continued)Global Economic Conditions and Property Market Outlook (Continued) The region has become marginally more expensive but still offers value, particularly in the logistics segment that benefits from e-tailing while retail continues to be supported from the growth and increase in disposable income of the middle class. Offices that we perceive as a tactical investment type are attractively priced in Tokyo, Sydney and Perth. Most mature markets are seeing a combination of a recovery in demand for space, increasing investment volumes, and if not further prime yield declines then at least a broadening of yield compression from prime locations. Growth in emerging markets remains robust overall although many are facing greater challenges in the coming years. The CEE is tackling structural imbalances, Brazil is experiencing persistent inflation; while China’s slowing growth impacts its regional neighbours. On balance we remain optimistic about prospects for returns from Global real estate in the near and medium term. The sector continues to look attractively priced as it offers both an attractive yield and a healthy premium to other asset classes. 4.4.4.4. CB Richard Ellis Europe (exCB Richard Ellis Europe (exCB Richard Ellis Europe (exCB Richard Ellis Europe (ex----UK) Alpha FundUK) Alpha FundUK) Alpha FundUK) Alpha Fund Executive summaryExecutive summaryExecutive summaryExecutive summary
As at 31 December 2013 the Alpha Fund had committed EUR 427.1 million to 16 funds providing a diversified exposure to the Continental European real estate markets. EUR 426.2 million had been called by the funds to which the Alpha Fund had made commitments, and EUR 0.9 million of commitments to underlying funds were undrawn. The Alpha Fund had called 97.5% of total commitments from its shareholders as at 31 December 2013. During the year the Europe (ex-UK) Alpha fund paid an extraordinary distribution of EUR 11 million to investors in June 2013. In addition to this a return of capital of EUR 11.4m occurred in February 2013 followed by a second return of capital of EUR 10 million in December 2013. We expect that there will be EUR 108 million return of capital in 2014 resulting from funds naturally approaching their termination dates (Henderson Outlet Mall Fund and STAM REI III) as well as an active decision to exit underperforming investments (Aberdeen Pan Nordic Fund and Archstone German Residential Fund). Negative performance of the portfolio in the last 12 months was driven by funds with exposure to secondary assets continuing to see valuation declines. This was particularly highlighted by the Corestate German Residential Fund which returned minus 64.4% over the year. The Fund maturity date is 3 October 2014. The fund holds secondary quality German residential portfolios. In the previous quarter, the advisory board had requested an independent review of alternative exit strategies. The independent advisors indicated that a number of portfolio sales, over a shorter horizon was the preferred scenario over individual unit sales. The change in exit assumptions resulted in lower expected sales prices that, combined with the high leverage, and lower expected revenues from the student housing business resulted in a significant decrease in NAV. The poor performance of funds with exposure to secondary assets was partially offset by the strong performance of funds with better quality assets. This is highlighted by the Prologis European Properties Fund II which has returned 14.4% over the last 12 months. The performance was driven by strong market fundamentals in the United Kingdom as well as accelerating investor demand in Germany. The net initial yield at the end of Q4 was 7.3%, a contraction of 17 bps from the previous quarter. The existing assets in the fund benefit from high income yields and the fund uses a conservative leverage policy. Net Asset Value as at 31 December 2013 was EUR 67.67 per share (Euro share class), GBP 67.31 (GBP Hedged share class) and GBP 63.38 per share (GBP Unhedged share class).

Page 14
CB RICHARD ELLIS REAL ESTATE FUND OF FUNDS CB RICHARD ELLIS REAL ESTATE FUND OF FUNDS CB RICHARD ELLIS REAL ESTATE FUND OF FUNDS CB RICHARD ELLIS REAL ESTATE FUND OF FUNDS PUBLIC LIMITED COMPANYPUBLIC LIMITED COMPANYPUBLIC LIMITED COMPANYPUBLIC LIMITED COMPANY Annual report for the year ended 31 December 201Annual report for the year ended 31 December 201Annual report for the year ended 31 December 201Annual report for the year ended 31 December 2013333 Report of the Report of the Report of the Report of the Investment Manager (Continued)Investment Manager (Continued)Investment Manager (Continued)Investment Manager (Continued)
4.4.4.4. CB Richard Ellis Europe (exCB Richard Ellis Europe (exCB Richard Ellis Europe (exCB Richard Ellis Europe (ex----UK) Alpha Fund (Continued)UK) Alpha Fund (Continued)UK) Alpha Fund (Continued)UK) Alpha Fund (Continued) European Market OverviewEuropean Market OverviewEuropean Market OverviewEuropean Market Overview After 2013’s GDP stagnation, 2014 is expected to deliver a modest 1.3% growth for the EU28. Major risks have subsided in the region and financial conditions have stabilised due to firm policy actions and political stance. The confidence indicators have substantially improved across the board; on an aggregate level, retail sales volumes and industrial production are on a rising trend; and all countries are expected to enter growth territory in 2014. That said, European credit growth is still negative and unemployment rates remain at record-highs, despite improvements in select countries. European office and industrial prime headline rents were generally flat during 2013. However, there is an important difference between the sectors as the net effective rent is increasing as a result of rapid decline in incentives in the industrial sector, while this is still not the case for the office sector. Prime high street rental growth was reported for several major European shopping destinations like Paris and Milan but only in the best high streets in these cities where space is very scarce. Overall the retail sector saw only a modest rent increase. It is clear that the improvement in the European occupier markets have lagged the rapidly reviving investment sentiment. General underperformance of secondary locations where we still see increasing vacancy rates and falling rents remains a common theme across sectors. Given the muted economic outlook the reversal of this trend is not expected any time soon. The investment activity in the region is accelerating. The first three quarters of 2013 showed a 20% increase relative to the same period last year. Growth was reported in a broad group of countries and cities. Improving sentiment is also reflected by somewhat easing lending conditions and modest prime yield compression in all sectors during second half of the year. Prime yields in core markets are not likely to decline much further in the short term given current economic fundamentals, already low prime yields and rising bond yields. The lower return potential from core property investments in combination with less attractive relative pricing for prime properties is encouraging investors to move up the risk curve. This will reduce the yield differential between prime and good secondary. In key peripheral markets, prime yields are still relatively high but likely to come down thanks to renewed investors interest, thereby offering stronger return potential. Within the prime segment of the European real estate market, we continue to favour the retail sector and well located high yielding logistics assets. We see interesting investment opportunities arising in peripheral Europe which is expected to benefit from re-pricing as prime yields are still relatively high while downside risks have clearly decreased over the last quarters. Driven by strong fundamentals, Central and Eastern Europe also show attractive prospects albeit at an elevated risk level. 5. 5. 5. 5. CB Richard Ellis Asia Alpha Plus Fund CB Richard Ellis Asia Alpha Plus Fund CB Richard Ellis Asia Alpha Plus Fund CB Richard Ellis Asia Alpha Plus Fund
Executive summaryExecutive summaryExecutive summaryExecutive summary The Asia Alpha Plus Fund commenced on 1 July 2009 and had a final close on 30 June 2010 with USD 269.0 million in investor commitments. As at 31 December 2013 the Fund has committed USD 202.91
million to ten underlying funds (two of which have been disposed), and called capital of USD 211.1 million from investors.
1 The committed amounts comprise drawn commitments at cost and undrawn commitments based on FX rates as at 31 December 2013

Page 15
CB RICHARD ELLIS REAL ESTATE FUND OF FUCB RICHARD ELLIS REAL ESTATE FUND OF FUCB RICHARD ELLIS REAL ESTATE FUND OF FUCB RICHARD ELLIS REAL ESTATE FUND OF FUNDS NDS NDS NDS PUBLIC LIMITED COMPANYPUBLIC LIMITED COMPANYPUBLIC LIMITED COMPANYPUBLIC LIMITED COMPANY Annual report for the year ended 31 December 201Annual report for the year ended 31 December 201Annual report for the year ended 31 December 201Annual report for the year ended 31 December 2013333 Report of the Investment Manager (Continued)Report of the Investment Manager (Continued)Report of the Investment Manager (Continued)Report of the Investment Manager (Continued)
5. 5. 5. 5. CB RicCB RicCB RicCB Richard Ellis Asia Alpha Plus Fund (Continued)hard Ellis Asia Alpha Plus Fund (Continued)hard Ellis Asia Alpha Plus Fund (Continued)hard Ellis Asia Alpha Plus Fund (Continued)
Executive summaryExecutive summaryExecutive summaryExecutive summary (Continued)(Continued)(Continued)(Continued) The portfolio consists of a mixture of primary funds, secondaries and club funds across the Asia Pacific region. The portfolio is fully committed following the end of the fund’s investment period that ended on 30 June 2011 with all underlying funds now fully invested. Asia Alpha Plus has also begun to realise profits from the sale of underlying assets within funds or from the sale of total fund exposures through secondary sales or liquidity events. The portfolio generally continues to perform well and is on track to deliver its target return of 13-15%. In Q2 2013 AMP Wholesale Office Fund was disposed and delivered an IRR of 8%. A large proportion of the fund is currently income producing and the underlying funds have begun disposing assets. These income and disposal proceeds were distributed to investors in 2013, amounting to a total of USD 48.0 million for the year. The stand out performing investments in the existing portfolio include the BlackRock Asia Property Fund II with a 25.4% return since inception and the Fortress Japan Opportunity Fund with 18.3%. The other investments in the existing portfolio (besides the Prupim Vietnam Property Fund) have all delivered returns since inception between 13% and 16%. The Prupim Vietnam Property Fund is the only investment in the portfolio that has lost equity. The Vietnamese residential market has been severely impacted by the depreciation of the Vietnamese Dong and credit tightening measures by the government. Fortunately Prupim did not substantially invest the portfolio which minimised the overall impact on Asia Alpha Plus. The fund only has one asset remaining with no debt and Prupim has contracted to sell the asset, at current valuation, by Q2 2014. Finally, as has been discussed and communicated to investors, two funds within Asia Alpha Plus, APL Tokyo Residential I and Altis Real Estate Equity Partnership 1, have breached an investment restriction relating to its maximum percentage holding in a single fund. Having considered the remedies and risks, the Investment Manager has recommended that the restriction be waived for these two investments only. This waiver was subsequently approved by all investors. Our focus in 2014 continues to be the active management of the existing holdings and seeking realisations in mature investments to crystallise returns. We expect a significant amount of capital to be returned in 2014 from the portfolio’s Japanese funds and Pan-Asian secondary investments. Asian Market OverviewAsian Market OverviewAsian Market OverviewAsian Market Overview Asia PacificAsia PacificAsia PacificAsia Pacific Economic performance was mixed among the key markets in the Asia Pacific region in 2013. Improved external conditions benefited exporting economies during the second half of 2013 and this was particularly the case for Korea, Taiwan, Hong Kong and Singapore. Yet, a number of Emerging Asian economies such as Indonesia and India struggled, with greater vulnerability of capital outflows due to the US tapering effects. With strengthening economic outlooks in the advanced economies outside the region, growth prospects should remain favourable for most Asia Pacific economies in 2014. The EIU forecasts a marginal pick up of GDP growth for the Asia Pacific region in both 2014 and 2015, to 4.4% and 4.5%, respectively.

Page 16
CB RICHARD ELLIS REAL ESTATE FUND OF FUNDS CB RICHARD ELLIS REAL ESTATE FUND OF FUNDS CB RICHARD ELLIS REAL ESTATE FUND OF FUNDS CB RICHARD ELLIS REAL ESTATE FUND OF FUNDS PUBLIC LIMITED COMPANYPUBLIC LIMITED COMPANYPUBLIC LIMITED COMPANYPUBLIC LIMITED COMPANY AAAAnnual report for the year ended 31 December 201nnual report for the year ended 31 December 201nnual report for the year ended 31 December 201nnual report for the year ended 31 December 2013333 Report of the Investment Manager (Continued)Report of the Investment Manager (Continued)Report of the Investment Manager (Continued)Report of the Investment Manager (Continued)
5. 5. 5. 5. CB Richard Ellis Asia Alpha Plus Fund (Continued)CB Richard Ellis Asia Alpha Plus Fund (Continued)CB Richard Ellis Asia Alpha Plus Fund (Continued)CB Richard Ellis Asia Alpha Plus Fund (Continued) Asian Market Overview (Continued)Asian Market Overview (Continued)Asian Market Overview (Continued)Asian Market Overview (Continued) Asia Pacific (Continued)Asia Pacific (Continued)Asia Pacific (Continued)Asia Pacific (Continued) While China (once again) aims for 7.5% GDP growth in 2014, policy makers appear comfortable that the pace of growth may in fact decelerate to below this target. More focus is placed on socially and ecologically sustainable growth within an increasingly consumption-driven economy. Successful transition will entail on-going economic reforms and the successful execution of plans set out at the Third Plenum meeting. Through further liberalisation of the financial sector, it is also clear that non-performing loans may be realised across a number of sectors including real estate. This is being viewed as a healthy development and not one to pose systemic threat to the wider financial system in China. The results of “Abenomics” have been broadly encouraging for Japan thus far with business and consumer confidence improved and GDP growth well up in 2013 (+2.6% y/y). While the short term trends continue to be favourable in Japan, risks are likely to stem from disappointing attempts to-date of any full scale structural reforms. These are required to maintain growth in the years ahead. In the office sector, oversupply pressure is expected to increase in the region with risks skewed to emerging Asian markets such as Kuala Lumpur and selected Indian and Chinese cities. Office vacancy rates are trending down in Singapore and Tokyo and remain sub 5% in Hong Kong. Solid space demand from both international and regional retailers, especially in fashion and F&B in 2013 has resulted in a strong gain of rental rates in regional markets such as Tokyo, Hong Kong, Singapore and Shanghai. Such a trend may moderate with a number of retailers increasingly cautious in aggressively competing for prime locations at higher rents. Strong logistics rental growth was witnessed across the region, driven by tight supply and solid demand. While the overall outlook for the logistics sector remains positive, the regional average rate of growth is expected to moderate.
Abundant liquidity has driven higher transaction volumes as well as higher capital values in the past year. Australia, China and Japan saw strong investment volumes in property over the past year. Yet, the upward capital value trend will likely slow, pause, or in some cases – even correct - given that the risk of interest rate hikes is intensifying. This has led to expectations of some yield decompression in parts of the region, especially for markets where yields are already at historically low levels.
6. 6. 6. 6. CBRE GMM Asia Alpha Plus Fund IIICBRE GMM Asia Alpha Plus Fund IIICBRE GMM Asia Alpha Plus Fund IIICBRE GMM Asia Alpha Plus Fund III
EEEExecutive summaryxecutive summaryxecutive summaryxecutive summary The Asia Alpha Plus Fund III commenced on 6 June 2013 and finished the year with total investor commitments of USD 120.7 million. Further capital raising is expected throughout the first half of 2014 as the final close must occur 12 months from the date of first close. Of the USD 120.7 million in investor commitments, USD 111.3 million has been committed across six investments as at year end. In terms of implementation Asia Alpha Plus Fund III has the ability to access opportunities through secondaries, co-investments, clubs and primary funds. Where possible, the investment approach is to target pre-specified opportunities to allow immediate deployment of capital which allows us to undertake more detailed due diligence of both the manager and any assets. This has been a successful strategy on prior funds and one that we believe is important as Asian real estate markets continued to improve.

Page 17
CB RICHARD ELLIS REAL ESTATE FUND OF FUNDS CB RICHARD ELLIS REAL ESTATE FUND OF FUNDS CB RICHARD ELLIS REAL ESTATE FUND OF FUNDS CB RICHARD ELLIS REAL ESTATE FUND OF FUNDS PUBLIC LIMITED COMPANYPUBLIC LIMITED COMPANYPUBLIC LIMITED COMPANYPUBLIC LIMITED COMPANY Annual report for the year Annual report for the year Annual report for the year Annual report for the year ended 31 December 201ended 31 December 201ended 31 December 201ended 31 December 2013333 Report of the Investment Manager (Continued)Report of the Investment Manager (Continued)Report of the Investment Manager (Continued)Report of the Investment Manager (Continued)
6. 6. 6. 6. CBRE GMM Asia Alpha Plus Fund III (Continued)CBRE GMM Asia Alpha Plus Fund III (Continued)CBRE GMM Asia Alpha Plus Fund III (Continued)CBRE GMM Asia Alpha Plus Fund III (Continued)
Executive summary (Continued)Executive summary (Continued)Executive summary (Continued)Executive summary (Continued) The investment strategy continues to have a strong bias towards Australia, Japan and China as well as a focus on logistic/industrial assets in those countries. Until additional capital is raised no further investments will be made as the USD 9.4 million in uncommitted capital acts as a reserve for any unforeseen occurrences across the existing portfolio. Over the past 12 to 18 months, ‘Core’ or assets perceived to have limited risk have seen significant price increase across all major markets in Asia Pacific. It has generally been large domestic capital sources within each respective country that has targeted these ‘Core’ assets whether they be pension funds, insurance companies or REITs. Asia Alpha Plus Fund III strategy is to create or develop ‘Core’ assets and on stabilisation sell assets to these buyers who generally have a large cost of capital advantage over offshore purchasers. Recently, we have also seen several portfolios of secondary opportunities arise and subject to pricing would be a favourable approach as they formed a considerably proportion of the prior fund. Overall, we continue to see a number of attractive investment opportunities for Asia Alpha Plus III. The challenge will be to complete the capital raise and reach a level of investor commitments that provides appropriate scale and diversification whilst being effectively deployed during the course of 2014.
7777. . . . CB Richard Ellis Asia Alpha Plus II Feeder FundCB Richard Ellis Asia Alpha Plus II Feeder FundCB Richard Ellis Asia Alpha Plus II Feeder FundCB Richard Ellis Asia Alpha Plus II Feeder Fund
Executive summaryExecutive summaryExecutive summaryExecutive summary CB Richard Ellis Asia Alpha Plus II Feeder Fund commenced in December 2011 with USD 75.0 million in investor commitments. As at 31 December 2013, USD 64.5 million had been called by the fund and 14.0% of the commitment remains undrawn. CBRE Global Collective Investors UK Limited <DATE>

Page 18
CB RICHARD ELLIS REAL ESTATE FUND OF FUNDS CB RICHARD ELLIS REAL ESTATE FUND OF FUNDS CB RICHARD ELLIS REAL ESTATE FUND OF FUNDS CB RICHARD ELLIS REAL ESTATE FUND OF FUNDS PUBLIC LIMITED COMPANYPUBLIC LIMITED COMPANYPUBLIC LIMITED COMPANYPUBLIC LIMITED COMPANY Annual report for the year ended 31 December 201Annual report for the year ended 31 December 201Annual report for the year ended 31 December 201Annual report for the year ended 31 December 2013333 CB Richard Ellis CB Richard Ellis CB Richard Ellis CB Richard Ellis Europe Europe Europe Europe (ex(ex(ex(ex----UK) Alpha FundUK) Alpha FundUK) Alpha FundUK) Alpha Fund Statement of Investments Statement of Investments Statement of Investments Statement of Investments –––– as at 31 December 201as at 31 December 201as at 31 December 201as at 31 December 2013333
ORIGINAL
CUMULATIVE
INVESTMENTS IN UNDERLYING FUND FUND TOTAL DRAWN UNDRAWN COST OF FAIR % OF UNREALISED
FUNDS MANAGER DOMICILE COMMITMENT COMMITMENT COMMITMENT INVESTMENT * VALUE NET ASSETS GAIN/(LOSS) **
EUR EUR EUR EUR EUR EUR
Aberdeen Pan Nordic Fund Aberdeen Property Investors Luxembourg 25,000,000 25,000,000 - 25,100,000 12,398,809 4.21% (12,701,191)
Alternative Property Income Venture AXA REIM United Kingdom 38,935,566 38,468,930 466,636 30,026,413 33,048,372 11.22% 3,021,959
Archstone German Residential Fund Archstone Management Germany Luxembourg 15,000,000 15,000,000 - 14,925,000 16,361,937 5.56% 1,436,937
Benelux Industrial Partnership Internos Netherlands 32,064,360 32,064,360 - 32,452,854 3,154,230 1.07% (29,298,624)
CBRE Property Central and Eastern Europe FGR
CBRE Global Investors Netherlands 30,000,000 30,000,000 - 31,353,183 18,815,044 6.39% (12,538,139)
Cordea Savills German Retail Fund Cordea Savills Luxembourg 20,000,000 20,000,000 - 20,000,000 14,015,376 4.76% (5,984,624)
Corestate German Residential Fund Corestate Capital Guernsey 25,000,000 25,000,000 - 25,000,000 5,977,373 2.03% (19,022,627)
Genesta Nordic Baltic Real Estate S.à r.l. SICAR
Genesta Property Nordic Luxembourg 12,650,000 12,238,875 411,125 12,238,875 13,450,524 4.57% 1,211,649
German Retail Property Fund Internos Luxembourg 20,000,000 20,000,000 - 20,000,000 10,739,927 3.65% (9,260,073)
IRUS European Retail Property Fund Neinver Luxembourg 10,000,000 10,000,000 - 10,132,488 9,936,228 3.37% (196,260)
Nordic Retail Fund Cornerstone Real Estate Investors Luxembourg 48,057,638 48,057,638 - 48,057,638 24,612,918 8.36% (23,444,720)
Outlet Mall Fund Henderson Global Investors Luxembourg 25,930,171 25,930,171 - 25,930,171 32,898,954 11.17% 6,968,783
Pradera European Retail Fund II Pradera Asset Management Luxembourg 33,000,000 33,000,000 - 33,328,339 8,976,000 3.05% (24,352,339)
Prologis European Properties Fund II Prologis Luxembourg 31,476,236 31,476,236 - 31,476,236 23,813,203 8.08% (7,663,033)
STAM REI III STAM Europe Luxembourg 40,000,000 40,000,000 - 35,239,641 33,924,428 11.52% (1,315,213)
V+ Nordic 2 VALAD United Kingdom 20,000,000 20,000,000 - 20,000,000 12,254,360 4.16% (7,745,640)
TOTAL INVESTMENTS IN UNDERLYING FUNDSTOTAL INVESTMENTS IN UNDERLYING FUNDSTOTAL INVESTMENTS IN UNDERLYING FUNDSTOTAL INVESTMENTS IN UNDERLYING FUNDS
427,113,971 427,113,971 427,113,971 427,113,971 426,236,210 426,236,210 426,236,210 426,236,210 877,761 877,761 877,761 877,761 415,260,838 415,260,838 415,260,838 415,260,838 274,377,683274,377,683274,377,683274,377,683 93.17%93.17%93.17%93.17% ((((140,883,1140,883,1140,883,1140,883,155555555))))
On 31 December 2013, CB Richard Ellis Europe (ex-UK) Alpha Fund has the following forward currency contracts open :
FORWARD CURRENCY CONTRACTSFORWARD CURRENCY CONTRACTSFORWARD CURRENCY CONTRACTSFORWARD CURRENCY CONTRACTS
COUNTERPARTY CURRENCY
BOUGHT AMOUNT BOUGHT
CURRENCY SOLD
AMOUNT SOLD
MATURITY DATE
UNREALISED GAIN
EUR % OF
NET ASSETS
RBC Investor Services Bank S.A. GBP 160,079,288 EUR 190,401,713 27/03/2014 1,885,048 0.64%
TOTAL FORWARD CURRENCY CONTRACTS (IN FUNCTIONAL CURRENCY)TOTAL FORWARD CURRENCY CONTRACTS (IN FUNCTIONAL CURRENCY)TOTAL FORWARD CURRENCY CONTRACTS (IN FUNCTIONAL CURRENCY)TOTAL FORWARD CURRENCY CONTRACTS (IN FUNCTIONAL CURRENCY)
1,8851,8851,8851,885,,,,048048048048 0.0.0.0.66664444%%%%
TOTAL FINANCIAL ASSETS AND FINANCIAL LIABILITIES AT FAIR TOTAL FINANCIAL ASSETS AND FINANCIAL LIABILITIES AT FAIR TOTAL FINANCIAL ASSETS AND FINANCIAL LIABILITIES AT FAIR TOTAL FINANCIAL ASSETS AND FINANCIAL LIABILITIES AT FAIR VALUEVALUEVALUEVALUE
222276767676,,,,262262262262,,,,737373731111 99993333....81818181%%%%
* Original cost is (1) the capital called by the underlying fund and expenses incurred relating to CB Richard Ellis Europe (ex-UK) Alpha Fund entering into the commitment or (2) the acquisition price on the secondary markets. Any subsequent sale or return of capital is based on the weighted average price model. ** The cumulative unrealised gain/(loss) relates to the investments in the underlying funds for the period from acquisition to 31 December 2013.
Page 19
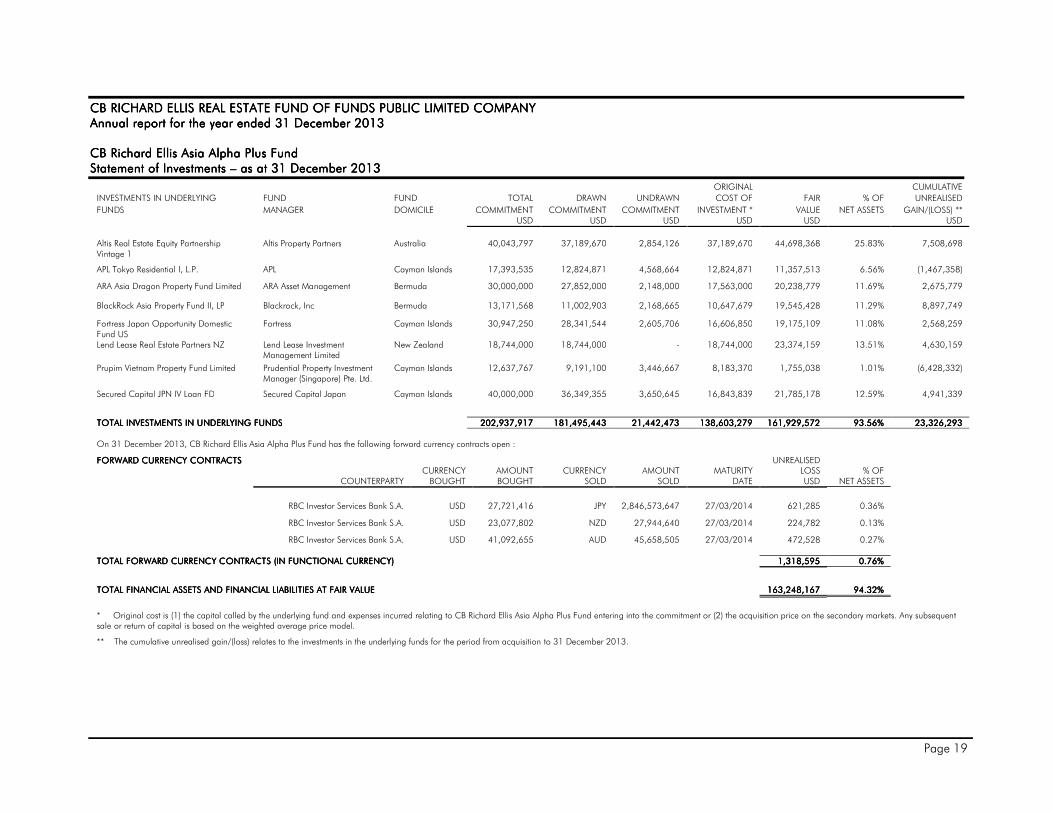
CB RICHARD ELLIS REAL ESTATE FUND OF FUNDS CB RICHARD ELLIS REAL ESTATE FUND OF FUNDS CB RICHARD ELLIS REAL ESTATE FUND OF FUNDS CB RICHARD ELLIS REAL ESTATE FUND OF FUNDS PUBLIC LIMITED COMPANYPUBLIC LIMITED COMPANYPUBLIC LIMITED COMPANYPUBLIC LIMITED COMPANY Annual report for the year ended 31 December 201Annual report for the year ended 31 December 201Annual report for the year ended 31 December 201Annual report for the year ended 31 December 2013333 CB Richard Ellis AsiaCB Richard Ellis AsiaCB Richard Ellis AsiaCB Richard Ellis Asia Alpha Plus FundAlpha Plus FundAlpha Plus FundAlpha Plus Fund Statement of Investments Statement of Investments Statement of Investments Statement of Investments –––– as at 31 December 201as at 31 December 201as at 31 December 201as at 31 December 2013333
ORIGINAL
CUMULATIVE
INVESTMENTS IN UNDERLYING FUND FUND TOTAL DRAWN UNDRAWN COST OF FAIR % OF UNREALISED
FUNDS MANAGER DOMICILE COMMITMENT COMMITMENT COMMITMENT INVESTMENT * VALUE NET ASSETS GAIN/(LOSS) **
USD USD USD USD USD USD
Altis Real Estate Equity Partnership Vintage 1
Altis Property Partners Australia 40,043,797 37,189,670 2,854,126 37,189,670 44,698,368 25.83% 7,508,698
APL Tokyo Residential I, L.P. APL Cayman Islands 17,393,535 12,824,871 4,568,664 12,824,871 11,357,513 6.56% (1,467,358)
ARA Asia Dragon Property Fund Limited ARA Asset Management Bermuda 30,000,000 27,852,000 2,148,000 17,563,000 20,238,779 11.69% 2,675,779
BlackRock Asia Property Fund II, LP Blackrock, Inc Bermuda 13,171,568 11,002,903 2,168,665 10,647,679 19,545,428 11.29% 8,897,749
Fortress Japan Opportunity Domestic Fund US
Fortress Cayman Islands 30,947,250 28,341,544 2,605,706 16,606,850 19,175,109 11.08% 2,568,259
Lend Lease Real Estate Partners NZ Lend Lease Investment Management Limited
New Zealand 18,744,000 18,744,000 - 18,744,000 23,374,159 13.51% 4,630,159
Prupim Vietnam Property Fund Limited Prudential Property Investment Manager (Singapore) Pte. Ltd.
Cayman Islands 12,637,767 9,191,100 3,446,667 8,183,370 1,755,038 1.01% (6,428,332)
Secured Capital JPN IV Loan FD Secured Capital Japan Cayman Islands 40,000,000 36,349,355 3,650,645 16,843,839 21,785,178 12.59% 4,941,339
TOTAL TOTAL TOTAL TOTAL INVESTMENTS IN UNDERLYING FUNDSINVESTMENTS IN UNDERLYING FUNDSINVESTMENTS IN UNDERLYING FUNDSINVESTMENTS IN UNDERLYING FUNDS
202,937,917202,937,917202,937,917202,937,917 181,495,443181,495,443181,495,443181,495,443 21,442,47321,442,47321,442,47321,442,473 138,603,2138,603,2138,603,2138,603,279797979 161,929,572161,929,572161,929,572161,929,572 93.56%93.56%93.56%93.56% 23,326,223,326,223,326,223,326,293939393
On 31 December 2013, CB Richard Ellis Asia Alpha Plus Fund has the following forward currency contracts open :
FORWARD CURRENCY FORWARD CURRENCY FORWARD CURRENCY FORWARD CURRENCY CONTRACTSCONTRACTSCONTRACTSCONTRACTS
COUNTERPARTY CURRENCY
BOUGHT AMOUNT BOUGHT
CURRENCY SOLD
AMOUNT SOLD
MATURITY DATE
UNREALISED LOSS USD
% OF NET ASSETS
RBC Investor Services Bank S.A. USD 27,721,416 JPY 2,846,573,647 27/03/2014 621,285 0.36%
RBC Investor Services Bank S.A. USD 23,077,802 NZD 27,944,640 27/03/2014 224,782 0.13%
RBC Investor Services Bank S.A. USD 41,092,655 AUD 45,658,505 27/03/2014 472,528 0.27%
TOTAL FORWARD CURRENCY CONTRACTS (IN FUNCTIONAL CURRENCY)TOTAL FORWARD CURRENCY CONTRACTS (IN FUNCTIONAL CURRENCY)TOTAL FORWARD CURRENCY CONTRACTS (IN FUNCTIONAL CURRENCY)TOTAL FORWARD CURRENCY CONTRACTS (IN FUNCTIONAL CURRENCY)
1111,,,,318318318318,,,,595595595595 0000....76767676%%%%
TOTAL FINANCIAL ASSETS AND FINANCIAL LIABILITIES AT FAIR VALUETOTAL FINANCIAL ASSETS AND FINANCIAL LIABILITIES AT FAIR VALUETOTAL FINANCIAL ASSETS AND FINANCIAL LIABILITIES AT FAIR VALUETOTAL FINANCIAL ASSETS AND FINANCIAL LIABILITIES AT FAIR VALUE
111163636363,,,,248248248248,,,,167167167167 99994444....33332222%%%%
* Original cost is (1) the capital called by the underlying fund and expenses incurred relating to CB Richard Ellis Asia Alpha Plus Fund entering into the commitment or (2) the acquisition price on the secondary markets. Any subsequent sale or return of capital is based on the weighted average price model.
** The cumulative unrealised gain/(loss) relates to the investments in the underlying funds for the period from acquisition to 31 December 2013.

Page 20
CB RICHARD ELLIS REAL ESTATE FUND OF FUNDS PUBLIC LIMITED COMPANYCB RICHARD ELLIS REAL ESTATE FUND OF FUNDS PUBLIC LIMITED COMPANYCB RICHARD ELLIS REAL ESTATE FUND OF FUNDS PUBLIC LIMITED COMPANYCB RICHARD ELLIS REAL ESTATE FUND OF FUNDS PUBLIC LIMITED COMPANY Annual report for the year ended 31 Annual report for the year ended 31 Annual report for the year ended 31 Annual report for the year ended 31 December 201December 201December 201December 2013333 CBRE CBRE CBRE CBRE GMM Asia Alpha Plus Fund IIIGMM Asia Alpha Plus Fund IIIGMM Asia Alpha Plus Fund IIIGMM Asia Alpha Plus Fund III Statement of Investments Statement of Investments Statement of Investments Statement of Investments –––– as at 31 December 2013as at 31 December 2013as at 31 December 2013as at 31 December 2013
ORIGINAL
CUMULATIVE
INVESTMENTS IN UNDERLYING FUNDS FUND FUND TOTAL DRAWN UNDRAWN COST OF FAIR % OF UNREALISED
MANAGER DOMICILE COMMITMENT COMMITMENT COMMITMENT INVESTMENT * VALUE NET ASSETS GAIN/(LOSS) **
USD USD USD USD USD USD
Altis Real Estate Equity Partnership - Vintage 2
Altis Property Partners Australia 19,975,385 9,479,813 10,495,572 9,479,813 10,285,061 26.84% 805,248
BARAKI 2 PTE LTD Redwood Group Asia Pte. Ltd Japan 25,517,817 18,169,448 7,348,369 18,169,448 21,392,006 55.82% 3,222,558
Beijing Co-Investment PTE LTD *** Lasalle Singapore 18,000,000 - 18,000,000 49 - 0.00% (49)
CBRE GLP China Logistics Feeder LP GLP China 12,000,000 3,498,756 8,501,244 3,498,756 3,450,441 9.00% (48,315)
GZ Co-Investment PTE LTD *** Lasalle Singapore 12,000,000 - 12,000,000 49 - 0.00% (49)
Star Asia Japan Special Situations II LP Star Asia Partners Ltd Japan 23,803,375 17,625 23,785,750 17,625 - 0.00% (17,625)
TOTAL INVESTMENTS IN UNDERLYING FUNDSTOTAL INVESTMENTS IN UNDERLYING FUNDSTOTAL INVESTMENTS IN UNDERLYING FUNDSTOTAL INVESTMENTS IN UNDERLYING FUNDS
111,296,577 111,296,577 111,296,577 111,296,577 31,165,642 31,165,642 31,165,642 31,165,642 80,130,93580,130,93580,130,93580,130,935 31,165,740 31,165,740 31,165,740 31,165,740 35,127,508 35,127,508 35,127,508 35,127,508 91.66%91.66%91.66%91.66% 3,961,768 3,961,768 3,961,768 3,961,768
TOTAL FINANCIAL ASSETS AND FINANCIAL LIABILITIES AT TOTAL FINANCIAL ASSETS AND FINANCIAL LIABILITIES AT TOTAL FINANCIAL ASSETS AND FINANCIAL LIABILITIES AT TOTAL FINANCIAL ASSETS AND FINANCIAL LIABILITIES AT FAIR VALUEFAIR VALUEFAIR VALUEFAIR VALUE
33335555,,,,127127127127,,,,508508508508 91919191....66666666%%%%
* Original cost is (1) the capital called by the underlying fund and expenses incurred relating to CBRE GMM Asia Alpha Plus Fund III entering into the commitment or (2) the acquisition price on the secondary markets. Any subsequent sale or return of capital is based on the weighted average price model.
** The cumulative unrealised gain/(loss) relates to the investments in the underlying funds for the period from acquisition to 31 December 2013.
*** Funds for which the total commitment can be reassigned from one fund to another

Page 21
CB RICHARD ELLIS REAL ESTATE FUND OF FUNDS PUBLIC LIMITED COMPANYCB RICHARD ELLIS REAL ESTATE FUND OF FUNDS PUBLIC LIMITED COMPANYCB RICHARD ELLIS REAL ESTATE FUND OF FUNDS PUBLIC LIMITED COMPANYCB RICHARD ELLIS REAL ESTATE FUND OF FUNDS PUBLIC LIMITED COMPANY Annual report for the year ended 31 December 201Annual report for the year ended 31 December 201Annual report for the year ended 31 December 201Annual report for the year ended 31 December 2013333 CB Richard Ellis Asia Alpha CB Richard Ellis Asia Alpha CB Richard Ellis Asia Alpha CB Richard Ellis Asia Alpha PlusPlusPlusPlus II FeederII FeederII FeederII Feeder FundFundFundFund Statement of InveStatement of InveStatement of InveStatement of Investments stments stments stments –––– as at 31 December 2013as at 31 December 2013as at 31 December 2013as at 31 December 2013
ORIGINAL
CUMULATIVE
INVESTMENTS IN UNDERLYING FUND FUND TOTAL DRAWN UNDRAWN COST OF FAIR % OF UNREALISED
FUNDS MANAGER DOMICILE COMMITMENT COMMITMENT COMMITMENT INVESTMENT * VALUE NET ASSETS GAIN/(LOSS) **
USD USD USD USD USD USD
CBRE Asia Alpha Plus Fund II FCP-SIF CBRE Global Investors Luxembourg 75,000,000 61,366,071 13,633,929 55,525,565 72,930,959 99.57% 17,405,394
TOTAL INVESTMENTS IN UNDERLYING TOTAL INVESTMENTS IN UNDERLYING TOTAL INVESTMENTS IN UNDERLYING TOTAL INVESTMENTS IN UNDERLYING FUNDSFUNDSFUNDSFUNDS
75,000,00075,000,00075,000,00075,000,000 61,366,07161,366,07161,366,07161,366,071 13,633,92913,633,92913,633,92913,633,929 55,525,56555,525,56555,525,56555,525,565 72727272,,,,930930930930,,,,959959959959 99.599.599.599.57777%%%% 11117777,,,,405405405405,,,,394394394394
TOTAL FINANCIAL ASSETS AND FINANCIAL LIABILITIES AT FAIR VALUETOTAL FINANCIAL ASSETS AND FINANCIAL LIABILITIES AT FAIR VALUETOTAL FINANCIAL ASSETS AND FINANCIAL LIABILITIES AT FAIR VALUETOTAL FINANCIAL ASSETS AND FINANCIAL LIABILITIES AT FAIR VALUE
77772222,,,,930930930930,,,,959959959959 99.5799.5799.5799.57%%%%
* Original cost is the capital called by the underlying fund and expenses incurred relating to CB Richard Ellis Asia Alpha Plus II Feeder Fund entering into the commitment. Any subsequent sale or return of capital is based on the weighted average price model.
** The cumulative unrealised gain/(loss) relates to the investment in the underlying fund for the period from initial funding to 31 December 2013.

Page 22
CB RICHARD ELLIS REAL ESTATE FUND OF FUNDS CB RICHARD ELLIS REAL ESTATE FUND OF FUNDS CB RICHARD ELLIS REAL ESTATE FUND OF FUNDS CB RICHARD ELLIS REAL ESTATE FUND OF FUNDS PUBLIC LIMITED COMPANYPUBLIC LIMITED COMPANYPUBLIC LIMITED COMPANYPUBLIC LIMITED COMPANY Annual report for the year ended 31 December 201Annual report for the year ended 31 December 201Annual report for the year ended 31 December 201Annual report for the year ended 31 December 2013333 Statement of Changes in the Portfolio (Unaudited)Statement of Changes in the Portfolio (Unaudited)Statement of Changes in the Portfolio (Unaudited)Statement of Changes in the Portfolio (Unaudited) CB Richard Ellis Europe (exCB Richard Ellis Europe (exCB Richard Ellis Europe (exCB Richard Ellis Europe (ex----UK) Alpha FundUK) Alpha FundUK) Alpha FundUK) Alpha Fund
Purchases / IssuesPurchases / IssuesPurchases / IssuesPurchases / Issues CostCostCostCost
EUREUREUREUR Genesta Nordic Baltic Real Estate S.à r.l. SICAR 664,125
Total purchasesTotal purchasesTotal purchasesTotal purchases/ issues/ issues/ issues/ issues for the yearfor the yearfor the yearfor the year 664,125664,125664,125664,125
Sales / RedemptionsSales / RedemptionsSales / RedemptionsSales / Redemptions ProceedsProceedsProceedsProceeds
EUREUREUREUR
Archstone German Residential Fund* 75,000 Alternative Property Income Venture* 3,915,767 Stam REI III* 3,704,911
Total sales/ redemptions for the yearTotal sales/ redemptions for the yearTotal sales/ redemptions for the yearTotal sales/ redemptions for the year 7,695,6787,695,6787,695,6787,695,678
* Return of capital

Page 23
CB RICHARD ELLIS REAL ESTATE FUND OF FUNDS CB RICHARD ELLIS REAL ESTATE FUND OF FUNDS CB RICHARD ELLIS REAL ESTATE FUND OF FUNDS CB RICHARD ELLIS REAL ESTATE FUND OF FUNDS PUBLIC LIMITED COMPANYPUBLIC LIMITED COMPANYPUBLIC LIMITED COMPANYPUBLIC LIMITED COMPANY AnnualAnnualAnnualAnnual report for the year ended 31 December 201report for the year ended 31 December 201report for the year ended 31 December 201report for the year ended 31 December 2013333 Statement of Changes in the Portfolio (Unaudited)Statement of Changes in the Portfolio (Unaudited)Statement of Changes in the Portfolio (Unaudited)Statement of Changes in the Portfolio (Unaudited) CB Richard EllisCB Richard EllisCB Richard EllisCB Richard Ellis Asia Alpha Plus FundAsia Alpha Plus FundAsia Alpha Plus FundAsia Alpha Plus Fund
Purchases / IssuesPurchases / IssuesPurchases / IssuesPurchases / Issues CostCostCostCost
USDUSDUSDUSD
Fortress Japan Opportunity Domestic Fund US 635,516
Altis Real Estate Equity Partnership Vintage 1 2,981,909
BlackRock Asia Property Fund II, LP 949,766
Total purchasesTotal purchasesTotal purchasesTotal purchases/ issues/ issues/ issues/ issues for the yearfor the yearfor the yearfor the year 4,567,1914,567,1914,567,1914,567,191
Sales / RedemptionsSales / RedemptionsSales / RedemptionsSales / Redemptions ProceedsProceedsProceedsProceeds
USDUSDUSDUSD
Secured Capital JPN IV Loan FD * 11,715,020
ARA Asia Dragon Property Fund Limited * 4,427,000
Prupim Vietnam Property Fund Limited * 1,216,600
AMP Capital Wholesale Office Fund 15,668,831
Fortress Japan Opportunity Domestic Fund US * 1,282,534
Total sales/ redemptions for the yearTotal sales/ redemptions for the yearTotal sales/ redemptions for the yearTotal sales/ redemptions for the year 34,309,98534,309,98534,309,98534,309,985
* Return of capital

Page 24
CB RICHARD ELLIS REAL ESTATE FUND OF FUNDS CB RICHARD ELLIS REAL ESTATE FUND OF FUNDS CB RICHARD ELLIS REAL ESTATE FUND OF FUNDS CB RICHARD ELLIS REAL ESTATE FUND OF FUNDS PUBLIC LIMITED COMPANYPUBLIC LIMITED COMPANYPUBLIC LIMITED COMPANYPUBLIC LIMITED COMPANY Annual report for the year ended 31 December 201Annual report for the year ended 31 December 201Annual report for the year ended 31 December 201Annual report for the year ended 31 December 2013333 Statement of Changes in the Portfolio (Unaudited)Statement of Changes in the Portfolio (Unaudited)Statement of Changes in the Portfolio (Unaudited)Statement of Changes in the Portfolio (Unaudited) CBRECBRECBRECBRE GMMGMMGMMGMM Asia Alpha Asia Alpha Asia Alpha Asia Alpha Plus Plus Plus Plus Fund IIIFund IIIFund IIIFund III
Purchases / IssuesPurchases / IssuesPurchases / IssuesPurchases / Issues CostCostCostCost
USDUSDUSDUSD
Baraki 2 PTE LTD 18,169,448 Altis Real Estate Equity Partnership - Vintage 2 9,479,813 Star Asia Japan Special Situations II LP 249,487 CBRE GLP China Logistics Feeder LP 3,498,756 Beijing Co-Investment PTE LTD 49 GZ Co-Investment PTE LTD 49
Total Total Total Total purchasespurchasespurchasespurchases/ issues/ issues/ issues/ issues for the yearfor the yearfor the yearfor the year 31,397,60231,397,60231,397,60231,397,602
Sales / RedemptionsSales / RedemptionsSales / RedemptionsSales / Redemptions ProceedsProceedsProceedsProceeds
USDUSDUSDUSD
Star Asia Japan Special Situations II LP * 231,863
Total sales/ redemptions for the yearTotal sales/ redemptions for the yearTotal sales/ redemptions for the yearTotal sales/ redemptions for the year 231,863231,863231,863231,863
* Return of capital

Page 25
CB RICHARD ELLIS REAL ESTATE FUND OF FUNDS CB RICHARD ELLIS REAL ESTATE FUND OF FUNDS CB RICHARD ELLIS REAL ESTATE FUND OF FUNDS CB RICHARD ELLIS REAL ESTATE FUND OF FUNDS PUBLIC LIMITED COMPANYPUBLIC LIMITED COMPANYPUBLIC LIMITED COMPANYPUBLIC LIMITED COMPANY Annual report for the year ended 31 December 201Annual report for the year ended 31 December 201Annual report for the year ended 31 December 201Annual report for the year ended 31 December 2013333 Statement of Changes in the Portfolio (Unaudited)Statement of Changes in the Portfolio (Unaudited)Statement of Changes in the Portfolio (Unaudited)Statement of Changes in the Portfolio (Unaudited) CB Richard Ellis Asia Alpha Plus CB Richard Ellis Asia Alpha Plus CB Richard Ellis Asia Alpha Plus CB Richard Ellis Asia Alpha Plus II Feeder II Feeder II Feeder II Feeder FundFundFundFund
Purchases / IssuesPurchases / IssuesPurchases / IssuesPurchases / Issues CostCostCostCost
USDUSDUSDUSD
CBRE Asia Alpha Plus Fund II FCP-SIF 5,662,500
Total purchasesTotal purchasesTotal purchasesTotal purchases/ issues/ issues/ issues/ issues for the yearfor the yearfor the yearfor the year 5,662,5005,662,5005,662,5005,662,500
Sales / RedemptionsSales / RedemptionsSales / RedemptionsSales / Redemptions ProceedsProceedsProceedsProceeds
USDUSDUSDUSD
CBRE Asia Alpha Plus Fund II FCP-SIF * 4,645,147
Total sales/ redemptions for the yearTotal sales/ redemptions for the yearTotal sales/ redemptions for the yearTotal sales/ redemptions for the year 4,645,144,645,144,645,144,645,147777
* Return of capital

Page 26
CB RICHARD ELLIS REAL ESTATE FUND OF FUNDS CB RICHARD ELLIS REAL ESTATE FUND OF FUNDS CB RICHARD ELLIS REAL ESTATE FUND OF FUNDS CB RICHARD ELLIS REAL ESTATE FUND OF FUNDS PUBLIC LIMITED COMPANYPUBLIC LIMITED COMPANYPUBLIC LIMITED COMPANYPUBLIC LIMITED COMPANY Annual report for the year ended 31 December 201Annual report for the year ended 31 December 201Annual report for the year ended 31 December 201Annual report for the year ended 31 December 2013333 Balance SheetBalance SheetBalance SheetBalance Sheet
Alpha FundAlpha FundAlpha FundAlpha Fund Alpha FundAlpha FundAlpha FundAlpha Fund
Asia Alpha PlusAsia Alpha PlusAsia Alpha PlusAsia Alpha Plus FundFundFundFund
Asia Alpha Asia Alpha Asia Alpha Asia Alpha PlusPlusPlusPlus FundFundFundFund
Asia Alpha PlusAsia Alpha PlusAsia Alpha PlusAsia Alpha Plus Fund IIIFund IIIFund IIIFund III
As atAs atAs atAs at As atAs atAs atAs at
As atAs atAs atAs at
As atAs atAs atAs at
As atAs atAs atAs at
NoteNoteNoteNote
31 December 31 December 31 December 31 December 2013201320132013
31 December 31 December 31 December 31 December 2012201220122012
31 December 31 December 31 December 31 December 2013201320132013
31 December 31 December 31 December 31 December 2012201220122012
31 December 31 December 31 December 31 December 2013201320132013 *
EUR EUR EUR EUR EUR EUR EUR EUR
USD USD USD USD
USD USD USD USD
USD USD USD USD
AssetsAssetsAssetsAssets
Financial Assets at Fair Value through Profit or Loss 3
276,262,731 303,034,854
163,248,167
193,006,979
35,127,508
Cash and Bank Balances 4
15,964,743 45,773,082
12,923,020
14,943,228
3,726,558
Debtors - Amounts falling due within one year 12
3,225,355 428,368
444,037
2,171,062
263,281
Total AssetsTotal AssetsTotal AssetsTotal Assets
295,452,829 349,236,304
176,615,224
210,121,269
39,117,347
LiabilitiesLiabilitiesLiabilitiesLiabilities
Financial Liabilities at Fair Value through Profit or Loss 3
- 335,383
-
-
-
Creditors - Amounts falling due within one year 13
908,790 12,405,041
741,779
10,222,816
404,688
Creditors - Amounts falling greater than one year 13
- -
2,815,553
2,072,842
388,231
Total LiabilitiesTotal LiabilitiesTotal LiabilitiesTotal Liabilities
908,790 12,740,424
3,557,332
12,295,658
792,919
Net Assets Attributable to ShareholdersNet Assets Attributable to ShareholdersNet Assets Attributable to ShareholdersNet Assets Attributable to Shareholders
294,544,039 336,495,880
173,057,892
197,825,611
38,324,428
Represented by:
Net Assets Attributable to Shareholders before write-off of establishment expenses 17
294,544,039 336,495,880
173,077,807
197,884,071
38,426,963
Adjustment to fully write-off establishment expenses 17
- -
(19,915)
(58,460)
(102,535)
Net Assets Attributable to ShareholdersNet Assets Attributable to ShareholdersNet Assets Attributable to ShareholdersNet Assets Attributable to Shareholders 17
294,544,039 336,495,880
173,057,892
197,825,611
38,324,428
* The first drawdown occurred on 6 June 2013. Therefore no comparative figures are available. The notes on pages 36 to 83 form an integral part of these financial statements.
Page 27
CB RICHARD ELLIS REAL ESTATE FUND OF FUNDS CB RICHARD ELLIS REAL ESTATE FUND OF FUNDS CB RICHARD ELLIS REAL ESTATE FUND OF FUNDS CB RICHARD ELLIS REAL ESTATE FUND OF FUNDS PUBLIC LIMITED COMPANYPUBLIC LIMITED COMPANYPUBLIC LIMITED COMPANYPUBLIC LIMITED COMPANY Annual report for the year ended 31 December 201Annual report for the year ended 31 December 201Annual report for the year ended 31 December 201Annual report for the year ended 31 December 2013333 Balance Sheet (Continued)Balance Sheet (Continued)Balance Sheet (Continued)Balance Sheet (Continued)
Asia Alpha Plus IIAsia Alpha Plus IIAsia Alpha Plus IIAsia Alpha Plus II Feeder FundFeeder FundFeeder FundFeeder Fund
Asia Alpha Plus IIAsia Alpha Plus IIAsia Alpha Plus IIAsia Alpha Plus II Feeder FundFeeder FundFeeder FundFeeder Fund
TotalTotalTotalTotal TotalTotalTotalTotal
As atAs atAs atAs at As atAs atAs atAs at
As atAs atAs atAs at As As As As atatatat
31 December 31 December 31 December 31 December 2013201320132013
31 December 31 December 31 December 31 December 2012201220122012
31 December 31 December 31 December 31 December 2013201320132013
31 December 31 December 31 December 31 December 2012201220122012
USD USD USD USD USD USD USD USD
EUR EUR EUR EUR EUR EUR EUR EUR
AssetsAssetsAssetsAssets
RestatedRestatedRestatedRestated****
Restated*Restated*Restated*Restated*
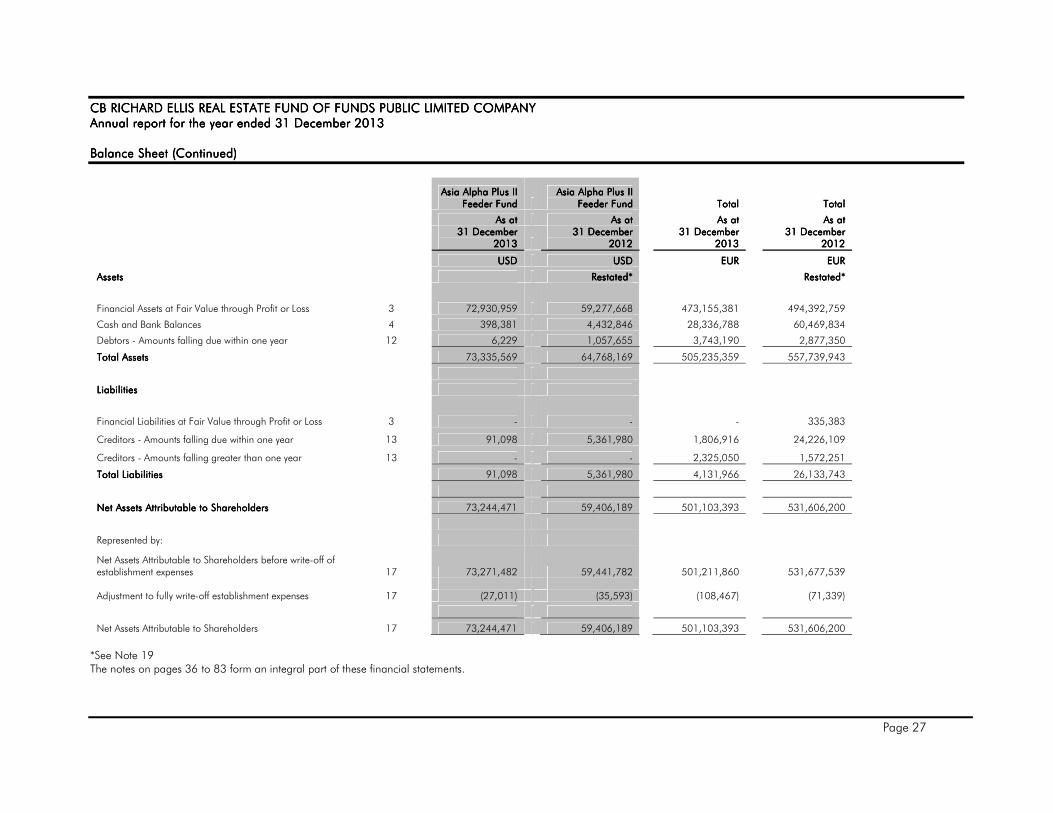
Financial Assets at Fair Value through Profit or Loss 3
72,930,959 59,277,668
473,155,381 494,392,759
Cash and Bank Balances 4
398,381 4,432,846
28,336,788 60,469,834
Debtors - Amounts falling due within one year 12
6,229 1,057,655
3,743,190 2,877,350
Total AssetsTotal AssetsTotal AssetsTotal Assets
73,335,569 64,768,169
505,235,359 557,739,943
LiabilitiesLiabilitiesLiabilitiesLiabilities
Financial Liabilities at Fair Value through Profit or Loss 3
- -
- 335,383
Creditors - Amounts falling due within one year 13
91,098 5,361,980
1,806,916 24,226,109
Creditors - Amounts falling greater than one year 13
- -
2,325,050 1,572,251
Total LiabilitiesTotal LiabilitiesTotal LiabilitiesTotal Liabilities
91,098 5,361,980
4,131,966 26,133,743
Net Assets Attributable to ShareholdersNet Assets Attributable to ShareholdersNet Assets Attributable to ShareholdersNet Assets Attributable to Shareholders
73,244,471 59,406,189
501,103,393 531,606,200
Represented by:
Net Assets Attributable to Shareholders before write-off of establishment expenses 17
73,271,482 59,441,782
501,211,860 531,677,539
Adjustment to fully write-off establishment expenses 17
(27,011) (35,593)
(108,467) (71,339)
Net Assets Attributable to Shareholders 17
73,244,471 59,406,189
501,103,393 531,606,200
*See Note 19 The notes on pages 36 to 83 form an integral part of these financial statements.
Page 28
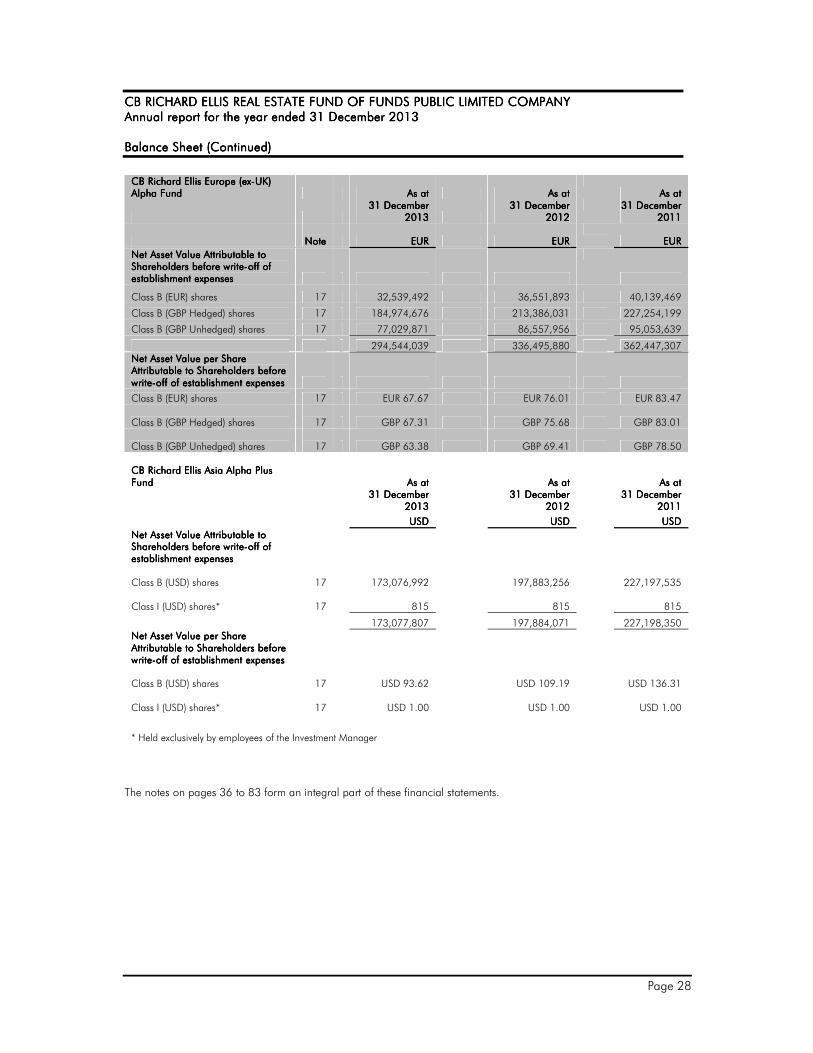
CB RICHARD ELLIS REAL ESTATE FUND OF FUNDS CB RICHARD ELLIS REAL ESTATE FUND OF FUNDS CB RICHARD ELLIS REAL ESTATE FUND OF FUNDS CB RICHARD ELLIS REAL ESTATE FUND OF FUNDS PUBLIC LIMITED COMPANYPUBLIC LIMITED COMPANYPUBLIC LIMITED COMPANYPUBLIC LIMITED COMPANY Annual report for the year ended 31 December 201Annual report for the year ended 31 December 201Annual report for the year ended 31 December 201Annual report for the year ended 31 December 2013333 Balance Sheet (Continued)Balance Sheet (Continued)Balance Sheet (Continued)Balance Sheet (Continued)
CB Richard Ellis Europe (exCB Richard Ellis Europe (exCB Richard Ellis Europe (exCB Richard Ellis Europe (ex----UK) UK) UK) UK) Alpha FundAlpha FundAlpha FundAlpha Fund As atAs atAs atAs at As atAs atAs atAs at
As atAs atAs atAs at
31 December 31 December 31 December 31 December
2012012012013333 31 December 31 December 31 December 31 December
2012012012012222 31 December 31 December 31 December 31 December
2020202011111111
Note Note Note Note EUREUREUREUR EUR EUR EUR EUR
EUR EUR EUR EUR
Net Asset Value Net Asset Value Net Asset Value Net Asset Value Attributable to Attributable to Attributable to Attributable to Shareholders before writeShareholders before writeShareholders before writeShareholders before write----off of off of off of off of establishment expensesestablishment expensesestablishment expensesestablishment expenses
Class B (EUR) shares 17 32,539,492 36,551,893 40,139,469
Class B (GBP Hedged) shares 17 184,974,676 213,386,031 227,254,199
Class B (GBP Unhedged) shares 17 77,029,871 86,557,956 95,053,639
294,544,039 336,495,880 362,447,307
Net Asset Value per Share Net Asset Value per Share Net Asset Value per Share Net Asset Value per Share Attributable to Shareholders before Attributable to Shareholders before Attributable to Shareholders before Attributable to Shareholders before writewritewritewrite----off of establishment expensesoff of establishment expensesoff of establishment expensesoff of establishment expenses
Class B (EUR) shares 17 EUR 67.67 EUR 76.01 EUR 83.47
Class B (GBP Hedged) shares
17 GBP 67.31 GBP 75.68 GBP 83.01
Class B (GBP Unhedged) shares
17 GBP 63.38 GBP 69.41 GBP 78.50 CB Richard Ellis Asia Alpha Plus CB Richard Ellis Asia Alpha Plus CB Richard Ellis Asia Alpha Plus CB Richard Ellis Asia Alpha Plus FundFundFundFund
As As As As atatatat
As atAs atAs atAs at
As atAs atAs atAs at
31 December 31 December 31 December 31 December 2012012012013333
31 December 31 December 31 December 31 December 2012012012012222
31 December 31 December 31 December 31 December 2020202011111111
USDUSDUSDUSD
USDUSDUSDUSD USDUSDUSDUSD
Net Asset Value Attributable to Net Asset Value Attributable to Net Asset Value Attributable to Net Asset Value Attributable to Shareholders before writeShareholders before writeShareholders before writeShareholders before write----off of off of off of off of establishment expensesestablishment expensesestablishment expensesestablishment expenses
Class B (USD) shares
17
173,076,992
197,883,256 227,197,535
Class I (USD) shares*
17
815
815 815
173,077,807
197,884,071 227,198,350
Net Asset Value per Share Net Asset Value per Share Net Asset Value per Share Net Asset Value per Share Attributable to Shareholders before Attributable to Shareholders before Attributable to Shareholders before Attributable to Shareholders before writewritewritewrite----off of establishment expensesoff of establishment expensesoff of establishment expensesoff of establishment expenses
Class B (USD) shares
17
USD 93.62
USD 109.19 USD 136.31
Class I (USD) shares*
17
USD 1.00
USD 1.00 USD 1.00
* Held exclusively by employees of the Investment Manager
The notes on pages 36 to 83 form an integral part of these financial statements.
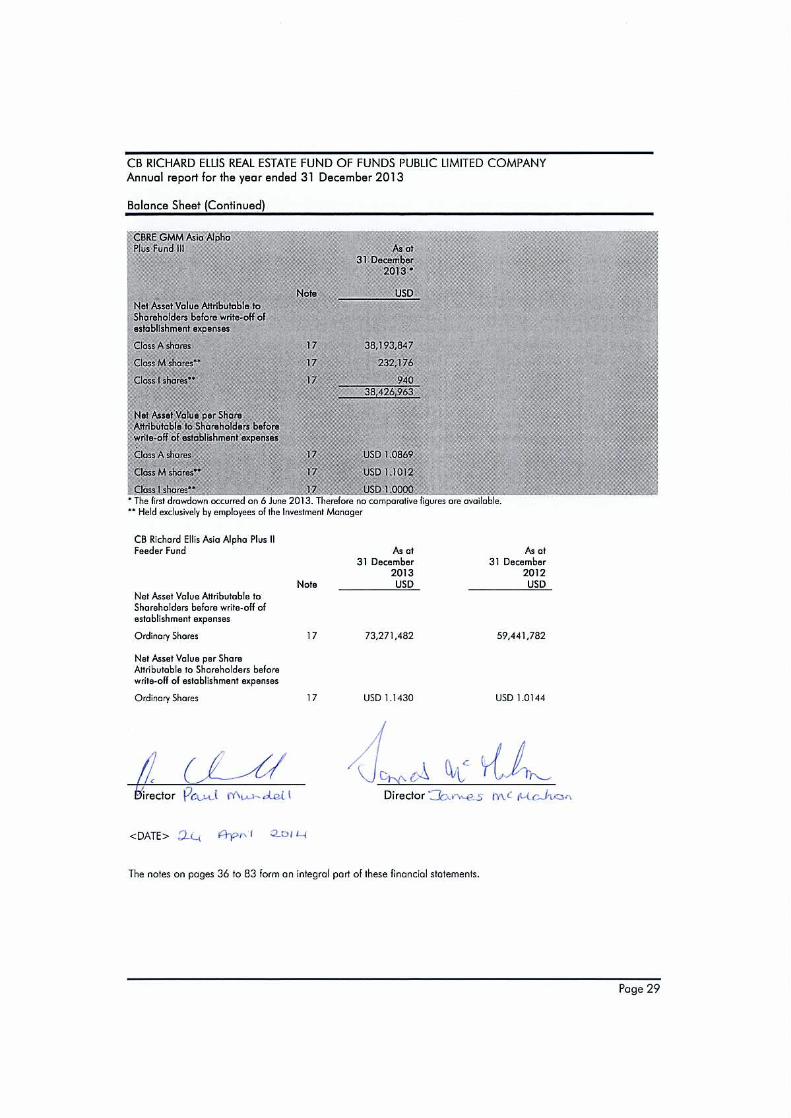
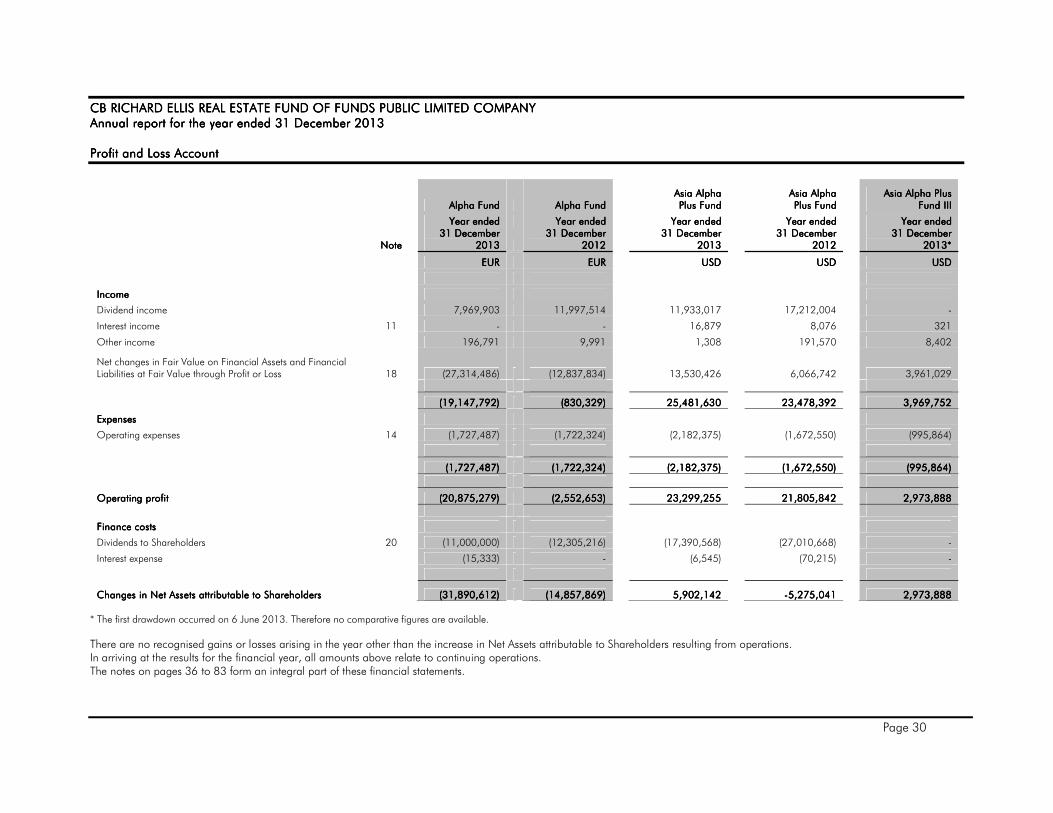
Page 30
CB RICHARD ELLIS REAL ESTATE FUND OF FUNDS CB RICHARD ELLIS REAL ESTATE FUND OF FUNDS CB RICHARD ELLIS REAL ESTATE FUND OF FUNDS CB RICHARD ELLIS REAL ESTATE FUND OF FUNDS PUBLIC LIMITED COMPANYPUBLIC LIMITED COMPANYPUBLIC LIMITED COMPANYPUBLIC LIMITED COMPANY Annual report for the year ended 31 December 201Annual report for the year ended 31 December 201Annual report for the year ended 31 December 201Annual report for the year ended 31 December 2013333 Profit and Loss AccountProfit and Loss AccountProfit and Loss AccountProfit and Loss Account
Alpha FundAlpha FundAlpha FundAlpha Fund Alpha FundAlpha FundAlpha FundAlpha Fund Asia Alpha Asia Alpha Asia Alpha Asia Alpha Plus FundPlus FundPlus FundPlus Fund
Asia Alpha Asia Alpha Asia Alpha Asia Alpha Plus FundPlus FundPlus FundPlus Fund
Asia Alpha PlusAsia Alpha PlusAsia Alpha PlusAsia Alpha Plus Fund IIIFund IIIFund IIIFund III
Year Year Year Year endedendedendedended Year endedYear endedYear endedYear ended Year endedYear endedYear endedYear ended Year endedYear endedYear endedYear ended Year endedYear endedYear endedYear ended
NoteNoteNoteNote 31 December 31 December 31 December 31 December
2013201320132013 31 December 31 December 31 December 31 December
2012201220122012 31 December 31 December 31 December 31 December
2013201320132013 31 December 31 December 31 December 31 December
2012201220122012 31 December 31 December 31 December 31 December
2013201320132013****
EUR EUR EUR EUR EUR EUR EUR EUR USD USD USD USD USD USD USD USD USDUSDUSDUSD
IncomeIncomeIncomeIncome
Dividend income 7,969,903 11,997,514 11,933,017 17,212,004 -
Interest income 11 - - 16,879 8,076 321
Other income 196,791 9,991 1,308
191,570 8,402
Net changes in Fair Value on Financial Assets and Financial Liabilities at Fair Value through Profit or Loss 18 (27,314,486) (12,837,834) 13,530,426 6,066,742 3,961,029
((((19,147,719,147,719,147,719,147,792929292)))) ((((830,329830,329830,329830,329)))) 25,481,63025,481,63025,481,63025,481,630 23,478,39223,478,39223,478,39223,478,392 3,969,7523,969,7523,969,7523,969,752
ExpensesExpensesExpensesExpenses
Operating expenses 14 (1,727,487) (1,722,324) (2,182,375) (1,672,550) (995,864)
((((1,727,481,727,481,727,481,727,487777)))) ((((1,722,3241,722,3241,722,3241,722,324)))) ((((2,182,3752,182,3752,182,3752,182,375)))) ((((1,672,5501,672,5501,672,5501,672,550)))) ((((995,864995,864995,864995,864))))
Operating profitOperating profitOperating profitOperating profit ((((20,875,2720,875,2720,875,2720,875,279999)))) ((((2,552,6532,552,6532,552,6532,552,653)))) 23,299,25523,299,25523,299,25523,299,255 21,805,84221,805,84221,805,84221,805,842 2,973,8882,973,8882,973,8882,973,888
Finance costsFinance costsFinance costsFinance costs
Dividends to Shareholders 20 (11,000,000) (12,305,216) (17,390,568) (27,010,668) -
Interest expense (15,333) - (6,545) (70,215) -
Changes in Net Assets attributable to ShareholdersChanges in Net Assets attributable to ShareholdersChanges in Net Assets attributable to ShareholdersChanges in Net Assets attributable to Shareholders ((((31,890,631,890,631,890,631,890,612121212)))) ((((14,857,86914,857,86914,857,86914,857,869)))) 5,902,1425,902,1425,902,1425,902,142 ----5,275,0415,275,0415,275,0415,275,041 2,973,8882,973,8882,973,8882,973,888
* The first drawdown occurred on 6 June 2013. Therefore no comparative figures are available.
There are no recognised gains or losses arising in the year other than the increase in Net Assets attributable to Shareholders resulting from operations. In arriving at the results for the financial year, all amounts above relate to continuing operations. The notes on pages 36 to 83 form an integral part of these financial statements.
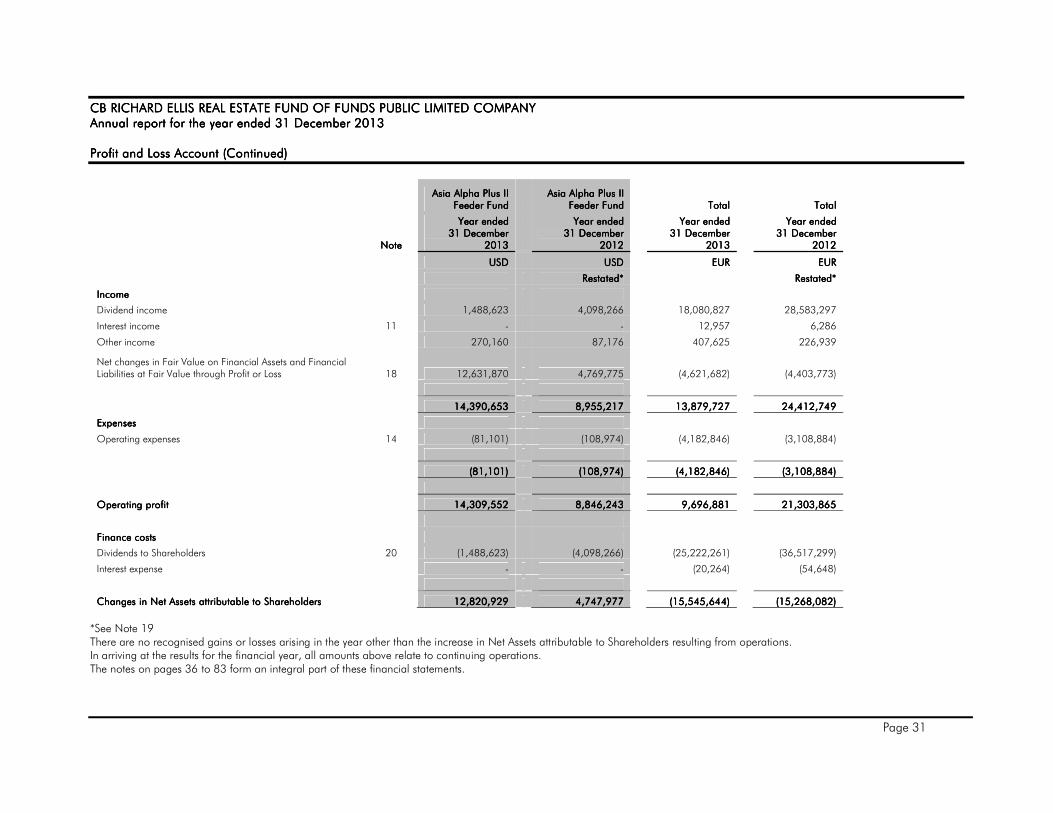
Page 31
CB RICHARD ELLIS REAL ESTATE FUND OF FUNDS CB RICHARD ELLIS REAL ESTATE FUND OF FUNDS CB RICHARD ELLIS REAL ESTATE FUND OF FUNDS CB RICHARD ELLIS REAL ESTATE FUND OF FUNDS PUBLIC LIMITED COMPANYPUBLIC LIMITED COMPANYPUBLIC LIMITED COMPANYPUBLIC LIMITED COMPANY Annual report for the year ended 31 December Annual report for the year ended 31 December Annual report for the year ended 31 December Annual report for the year ended 31 December 2012012012013333 Profit and Loss Account (Continued)Profit and Loss Account (Continued)Profit and Loss Account (Continued)Profit and Loss Account (Continued)
Asia Alpha Plus IIAsia Alpha Plus IIAsia Alpha Plus IIAsia Alpha Plus II
Feeder FundFeeder FundFeeder FundFeeder Fund Asia Alpha Plus IIAsia Alpha Plus IIAsia Alpha Plus IIAsia Alpha Plus II
Feeder FundFeeder FundFeeder FundFeeder Fund TotalTotalTotalTotal TotalTotalTotalTotal
Year endedYear endedYear endedYear ended Year endedYear endedYear endedYear ended Year endedYear endedYear endedYear ended Year endedYear endedYear endedYear ended
NoteNoteNoteNote 31 December 31 December 31 December 31 December
2013201320132013 31 December 31 December 31 December 31 December
2012201220122012 31 December 31 December 31 December 31 December
2013201320132013 31 December 31 December 31 December 31 December
2012201220122012
USD USD USD USD USD USD USD USD EUR EUR EUR EUR EUR EUR EUR EUR
RestatedRestatedRestatedRestated**** RestatedRestatedRestatedRestated****
IncomeIncomeIncomeIncome
Dividend income 1,488,623 4,098,266 18,080,827 28,583,297
Interest income 11 - - 12,957 6,286
Other income 270,160 87,176 407,625 226,939
Net changes in Fair Value on Financial Assets and Financial Liabilities at Fair Value through Profit or Loss 18 12,631,870 4,769,775 (4,621,682) (4,403,773)
11114444,,,,390390390390,,,,653653653653 8,955,2178,955,2178,955,2178,955,217 11113333,,,,879879879879,,,,727727727727 24,412,74924,412,74924,412,74924,412,749
ExpensesExpensesExpensesExpenses
Operating expenses 14 (81,101) (108,974) (4,182,846) (3,108,884)
((((81818181,,,,101101101101)))) ((((108,974108,974108,974108,974)))) ((((4,14,14,14,182828282,,,,846846846846)))) ((((3,108,8843,108,8843,108,8843,108,884))))
Operating profitOperating profitOperating profitOperating profit 11114444,,,,309309309309,,,,552552552552 8,846,2438,846,2438,846,2438,846,243 9999,,,,696696696696,,,,881881881881 21,303,86521,303,86521,303,86521,303,865
Finance costsFinance costsFinance costsFinance costs
Dividends to Shareholders 20 (1,488,623) (4,098,266) (25,222,261) (36,517,299)
Interest expense
- - (20,264) (54,648)
Changes in Net Assets attributable to ShareholdersChanges in Net Assets attributable to ShareholdersChanges in Net Assets attributable to ShareholdersChanges in Net Assets attributable to Shareholders
11112222,,,,820820820820,,,,929929929929 4,747,9774,747,9774,747,9774,747,977 ((((11115555,,,,545545545545,,,,644644644644)))) ((((15,268,08215,268,08215,268,08215,268,082))))
*See Note 19 There are no recognised gains or losses arising in the year other than the increase in Net Assets attributable to Shareholders resulting from operations. In arriving at the results for the financial year, all amounts above relate to continuing operations. The notes on pages 36 to 83 form an integral part of these financial statements.


Page 33
CB RICHARD ELLIS REAL ESTATE FUND OF FUNDS CB RICHARD ELLIS REAL ESTATE FUND OF FUNDS CB RICHARD ELLIS REAL ESTATE FUND OF FUNDS CB RICHARD ELLIS REAL ESTATE FUND OF FUNDS PUBLIC LIMITED COMPANYPUBLIC LIMITED COMPANYPUBLIC LIMITED COMPANYPUBLIC LIMITED COMPANY Annual report for the year ended 31 December 201Annual report for the year ended 31 December 201Annual report for the year ended 31 December 201Annual report for the year ended 31 December 2013333 Statement of Changes in Net Assets Attributable to ShareholdersStatement of Changes in Net Assets Attributable to ShareholdersStatement of Changes in Net Assets Attributable to ShareholdersStatement of Changes in Net Assets Attributable to Shareholders
Alpha FundAlpha FundAlpha FundAlpha Fund Alpha FundAlpha FundAlpha FundAlpha Fund
Asia Alpha PlusAsia Alpha PlusAsia Alpha PlusAsia Alpha Plus FundFundFundFund
Asia Alpha PlusAsia Alpha PlusAsia Alpha PlusAsia Alpha Plus FundFundFundFund
Asia Alpha Plus Asia Alpha Plus Asia Alpha Plus Asia Alpha Plus Fund IIIFund IIIFund IIIFund III
Year endedYear endedYear endedYear ended Year endedYear endedYear endedYear ended Year endedYear endedYear endedYear ended Year endedYear endedYear endedYear ended Year endedYear endedYear endedYear ended
NoteNoteNoteNote
31 December 31 December 31 December 31 December 2013201320132013
31 December 31 December 31 December 31 December 2012201220122012
31 December 31 December 31 December 31 December 2013201320132013
31 December 31 December 31 December 31 December 2012201220122012
31 December 31 December 31 December 31 December 2013201320132013********
EUREUREUREUR EUREUREUREUR
USDUSDUSDUSD
USDUSDUSDUSD
USDUSDUSDUSD
Net Assets Attributable to Shareholders at the start of the year
336,495,880 362,423,578
197,825,611
227,101,345
- Foreign exchange translation adjustment - -
-
-
-
Capital issued 16 - -
3,950,966
20,252,500
41,301,859
Capital redeemed 16 (10,061,229) (11,069,829)
(34,620,827)
(44,253,193)
(5,951,319)
Net increase/ (decrease) from capital transactions
(10,061,229) (11,069,829)
(30,669,861)
(24,000,693)
35,350,540
Changes in Net Assets attributable to Shareholders
(31,890,612) (14,857,869)
5,902,142
(5,275,041)
2,973,888
Net Assets Attributable to Shareholders at the end of the year
294,544,039 336,495,880
173,057,892
197,825,611
38,324,428
Asia Alpha Plus IIAsia Alpha Plus IIAsia Alpha Plus IIAsia Alpha Plus II Feeder FundFeeder FundFeeder FundFeeder Fund
Asia Alpha Plus IIAsia Alpha Plus IIAsia Alpha Plus IIAsia Alpha Plus II Feeder FundFeeder FundFeeder FundFeeder Fund
TotalTotalTotalTotal TotalTotalTotalTotal
Year endedYear endedYear endedYear ended Year endedYear endedYear endedYear ended
Year endedYear endedYear endedYear ended Year endedYear endedYear endedYear ended
NoteNoteNoteNote
31 December 31 December 31 December 31 December 2013201320132013
31 December 31 December 31 December 31 December 2012201220122012
31 December 31 December 31 December 31 December 2013201320132013
31 December 31 December 31 December 31 December 2012201220122012
USDUSDUSDUSD USDUSDUSDUSD
EUREUREUREUR EUREUREUREUR
RestatedRestatedRestatedRestated****
RestatedRestatedRestatedRestated****
Net Assets Attributable to Shareholders at the start of the year
59,406,189 -
531,606,200 537,366,558
Foreign exchange translation adjustment - -
(9,188,433) (3,283,194)
Capital issued 16 5,662,500 58,868,963
38,356,042 61,580,235
Capital redeemed 16 (4,645,147) (4,210,751)
(44,124,772) (48,789,317)
Net increase/ (decrease) from capital transactions
1,017,353 54,658,212
(5,768,730) 12,790,918
Changes in Net Assets attributable to Shareholders
12,820,929 4,747,977
(15,545,644) (15,268,082)
Net Assets Attributable to Shareholders at the end of the year
73,244,471 59,406,189
501,103,393 531,606,200
* See Note 19 ** The first drawdown occurred on 6 June 2013. Therefore no comparative figures are available. The notes on pages 36 to 83 form an integral part of these financial statements.

Page 34
CB RICHARD ELLIS REAL ESTATE FUND OF FUNDS CB RICHARD ELLIS REAL ESTATE FUND OF FUNDS CB RICHARD ELLIS REAL ESTATE FUND OF FUNDS CB RICHARD ELLIS REAL ESTATE FUND OF FUNDS PUBLIC LIMITED COMPANYPUBLIC LIMITED COMPANYPUBLIC LIMITED COMPANYPUBLIC LIMITED COMPANY Annual report for the year ended 31 December 201Annual report for the year ended 31 December 201Annual report for the year ended 31 December 201Annual report for the year ended 31 December 2013333 Cash Flow Cash Flow Cash Flow Cash Flow StatementStatementStatementStatement
Alpha FundAlpha FundAlpha FundAlpha Fund Alpha FundAlpha FundAlpha FundAlpha Fund
Asia Alpha PlusAsia Alpha PlusAsia Alpha PlusAsia Alpha Plus FundFundFundFund
Asia Alpha PlusAsia Alpha PlusAsia Alpha PlusAsia Alpha Plus FundFundFundFund
Asia Alpha Plus Asia Alpha Plus Asia Alpha Plus Asia Alpha Plus Fund IIIFund IIIFund IIIFund III
As atAs atAs atAs at As atAs atAs atAs at
As atAs atAs atAs at
As atAs atAs atAs at
As atAs atAs atAs at
31 December 31 December 31 December 31 December 2013201320132013
31 December 31 December 31 December 31 December 2012201220122012
31 December 31 December 31 December 31 December 2013201320132013
31 December 31 December 31 December 31 December 2012201220122012
31 December 31 December 31 December 31 December 2013201320132013********
EUR EUR EUR EUR EUR EUR EUR EUR
USD USD USD USD
USD USD USD USD
USD USD USD USD
Restated* Restated* Restated* Restated*
Cash flows from operating activitiesCash flows from operating activitiesCash flows from operating activitiesCash flows from operating activities
Purchases of/ drawdowns in respect of financial assets at fair value
(664,125) -
(4,567,191)
(46,496,913)
(31,397,602)
Proceeds from sales of/ returns of capital in respect of financial assets at fair value
5,518,413 15,151,215
34,309,985
84,370,819
-
Other income
213,125 1,377
1,308
191,570
8,402 Dividends received, net of withholding taxes
7,333,847 12,381,979
13,640,164
15,656,217
-
Interest received
- -
16,879
8,076
321 Realised (loss)/ gain on share class hedging
(12,868,384) (5,375,388)
-
-
-
Proceeds from settlement of financial derivatives
4,954,647 19,739,765
14,294,513
(2,852,110)
- Currency gain/ (loss)
4,438 5
(748,068)
(109,075)
(740)
Unrealised foreign exchange gain/ (loss)
- -
-
-
- Interest paid
(15,333) -
-
-
-
Operating expenses paid
(1,848,693) (1,213,531)
(1,635,231)
(1,393,282)
(202,946) Foreign exchange translation adjustment
- -
-
-
-
Net cash generated by/ (used in) Net cash generated by/ (used in) Net cash generated by/ (used in) Net cash generated by/ (used in) operating activitiesoperating activitiesoperating activitiesoperating activities
2,627,935 40,685,422
55,312,359
49,375,302
(31,592,565)
Cash flows from financing activitiesCash flows from financing activitiesCash flows from financing activitiesCash flows from financing activities
Proceeds from capital issued
- -
3,970,547
20,236,515
41,270,441
Payments on capital redeemed
(21,131,058) -
(39,746,905)
(39,127,116)
(5,951,318) Dividends paid to Shareholders
(11,305,216) (12,000,000)
(21,549,664)
(22,851,572)
-
Interests paid
- -
(6,545)
(70,215)
-
Net cash generated by financing activitiesNet cash generated by financing activitiesNet cash generated by financing activitiesNet cash generated by financing activities
(32,436,274) (12,000,000)
(57,332,567)
(41,812,388)
35,319,123
Net increase/ (decrease) in cash and cash equivalentsNet increase/ (decrease) in cash and cash equivalentsNet increase/ (decrease) in cash and cash equivalentsNet increase/ (decrease) in cash and cash equivalents
(29,808,339) 28,685,422
(2,020,208)
7,562,914
3,726,558
Analysis of changes in net cash
Cash and bank balances (*)Cash and bank balances (*)Cash and bank balances (*)Cash and bank balances (*)
EUR EUR EUR EUR
EUR EUR EUR EUR
USD USD USD USD
USD USD USD USD
USD USD USD USD
At beginning of yearAt beginning of yearAt beginning of yearAt beginning of year
45,773,082
17,087,660 14,943,228 7,380,314
- MovementMovementMovementMovement
(29,808,339)
28,685,422 (2,020,208) 7,562,914
3,726,558
At end of yearAt end of yearAt end of yearAt end of year
15,964,743
45,773,082
12,923,020
14,943,228
3,726,558
* See Note 19 **The first drawdown occurred on 6 June 2013. Therefore no comparative figures are available. The notes on pages 36 to 83 form an integral part of these financial statements.

Page 35
CB RICHARD ELLIS REAL ESTATE FUND OF FUNDS CB RICHARD ELLIS REAL ESTATE FUND OF FUNDS CB RICHARD ELLIS REAL ESTATE FUND OF FUNDS CB RICHARD ELLIS REAL ESTATE FUND OF FUNDS PUBLIC LIMITED COMPANYPUBLIC LIMITED COMPANYPUBLIC LIMITED COMPANYPUBLIC LIMITED COMPANY Annual report for the year ended 31 December 201Annual report for the year ended 31 December 201Annual report for the year ended 31 December 201Annual report for the year ended 31 December 2013333 Cash Flow Statement (Continued)Cash Flow Statement (Continued)Cash Flow Statement (Continued)Cash Flow Statement (Continued)
Asia Alpha Plus II Asia Alpha Plus II Asia Alpha Plus II Asia Alpha Plus II Feeder FundFeeder FundFeeder FundFeeder Fund
Asia Alpha Plus II Asia Alpha Plus II Asia Alpha Plus II Asia Alpha Plus II Feeder FundFeeder FundFeeder FundFeeder Fund
TotalTotalTotalTotal
TotalTotalTotalTotal
As atAs atAs atAs at As atAs atAs atAs at
As atAs atAs atAs at
As atAs atAs atAs at
31 December 31 December 31 December 31 December 2013201320132013
31 December 31 December 31 December 31 December 2012201220122012
31 December 31 December 31 December 31 December 2013201320132013
31 December 31 December 31 December 31 December 2012201220122012
EUR EUR EUR EUR EUR EUR EUR EUR
USD USD USD USD
USD USD USD USD
Restated* Restated* Restated* Restated*
Restated* Restated* Restated* Restated*
Cash flows from operating activitiesCash flows from operating activitiesCash flows from operating activitiesCash flows from operating activities
Purchases of/ drawdowns in respect of financial assets at fair
value
(5,662,500) (58,718,963) (32,023,214) (81,889,516) Proceeds from sales of/ returns of capital in respect of financial assets at fair value
4,645,147 4,210,751 34,864,483 84,094,251
Other income
270,160 87,176 423,959 218,325 Dividends received, net of withholding taxes
1,488,623 4,098,266 18,730,816 27,756,893
Interest received
- - 12,957 6,286 Realised (loss)/ gain on share class hedging
- - (12,868,384) (5,375,388)
Proceeds from settlement of financial derivatives
- - 15,723,132 17,519,968 Currency gain/ (loss)
(4,068) 319 (562,726) (84,640)
Unrealised foreign exchange gain/ (loss)
- - - - Interest paid
- - (15,333) -
Operating expenses paid
(48,715) (56,491) (3,270,145) (2,341,889) Foreign exchange translation adjustment
- - 196,108 (324,826)
Net cash generated by/ (used in) operating activitiesNet cash generated by/ (used in) operating activitiesNet cash generated by/ (used in) operating activitiesNet cash generated by/ (used in) operating activities
688,647 (50,378,942) 21,211,653 39,579,464
Cash flows from financing activitiesCash flows from financing activitiesCash flows from financing activitiesCash flows from financing activities
Proceeds from capital issued
6,692,451 57,839,012 38,356,042 60,766,182
Payments on capital redeemed
(6,529,055) (2,326,842) (60,475,433) (32,263,616) Dividends paid to Shareholders
(4,886,508) (700,382) (31,220,377) (30,330,485)
Interests paid
- (4,931) (54,648)
Net cash generated by financing activitiesNet cash generated by financing activitiesNet cash generated by financing activitiesNet cash generated by financing activities
(4,723,112) 54,811,788 (53,344,699) (1,882,567)
Net increase/ (decrease) in cash and cash equivalentsNet increase/ (decrease) in cash and cash equivalentsNet increase/ (decrease) in cash and cash equivalentsNet increase/ (decrease) in cash and cash equivalents
(4,034,465) 4,432,846 (32,133,046) 37,696,897
Analysis of changes in net cash
Cash and bank balances (*)Cash and bank balances (*)Cash and bank balances (*)Cash and bank balances (*)
EUR EUR EUR EUR
EUR EUR EUR EUR
USD USD USD USD
USD USD USD USD
At beginning of yearAt beginning of yearAt beginning of yearAt beginning of year
4,432,846 - 60,469,834 22,772,937 MovementMovementMovementMovement
(4,034,465) 4,432,846 (32,133,046) 37,696,897
At end of yearAt end of yearAt end of yearAt end of year
398,381 4,432,846 28,336,788 60,469,834
* See Note 19 The notes on pages 36 to 83 form an integral part of these financial statements.

Page 36
CB RICHARD ELLIS REAL ESTATE FUND OF FUNDS CB RICHARD ELLIS REAL ESTATE FUND OF FUNDS CB RICHARD ELLIS REAL ESTATE FUND OF FUNDS CB RICHARD ELLIS REAL ESTATE FUND OF FUNDS PUBLIC LIMITED COMPANYPUBLIC LIMITED COMPANYPUBLIC LIMITED COMPANYPUBLIC LIMITED COMPANY Annual rAnnual rAnnual rAnnual report for the eport for the eport for the eport for the yearyearyearyear ended 3ended 3ended 3ended 31 December1 December1 December1 December 2012012012013333 Notes to the Notes to the Notes to the Notes to the FFFFinancial Statementsinancial Statementsinancial Statementsinancial Statements
1111 Accounting PoliciesAccounting PoliciesAccounting PoliciesAccounting Policies
The significant accounting policies adopted by CB Richard Ellis Real Estate Fund of Funds Public Limited Company (the “Company”) are as follows:
1.11.11.11.1 Basis of Preparation of Financial StatementsBasis of Preparation of Financial StatementsBasis of Preparation of Financial StatementsBasis of Preparation of Financial Statements
The financial statements are prepared in accordance with accounting standards generally accepted in Ireland and Irish Statute, comprising the Companies Acts, 1963 to 2013, and the Listing Rules of the Irish Stock Exchange. Accounting standards generally accepted in Ireland giving a true and fair view are those published by Chartered Accountants Ireland and issued by the Financial Reporting Council.
The preparation of the financial statements requires management to make certain estimates and assumptions that may affect the amounts reported in the financial statements and accompanying notes. Actual results may differ from those estimates.
The format and certain wordings of the financial statements have been adapted from those contained in the Companies (Amendment) Act, 1986 and Financial Reporting Standard (“FRS”) 3 "Reporting Financial Performance" so that they more appropriately reflect the nature of the Company’s business as an investment fund. 1.21.21.21.2 Valuation of InvestmentsValuation of InvestmentsValuation of InvestmentsValuation of Investments
In accordance with FRS 26, “Financial Instruments – Recognition and Measurement”, the Company classifies its investments and derivatives as financial assets and liabilities at fair value through profit or loss. This category is divided into two sub-categories: financial assets or financial liabilities held for trading and those designated at fair value through profit or loss at inception. For the purpose of FRS 26, the Directors have classified the Company’s portfolio as financial assets and liabilities designated at fair value through profit or loss at inception. Financial assets and financial liabilities designated at fair value through profit or loss at inception are financial instruments that are not classified as held for trading but are managed, and their performance is evaluated on a fair value basis in accordance with the Company’s documented investment strategy. Financial assets and financial liabilities at fair value through profit or loss are initially recognised at fair value. Transaction costs are expensed as incurred in the Profit and Loss Account. Subsequent to initial recognition, all financial assets and financial liabilities at fair value through profit or loss are measured at fair value as described below. Gains and losses arising from changes in the fair value of the “financial assets or financial liabilities at fair value through profit or loss” category are presented in the Profit and Loss Account within “Net changes in fair value of financial assets and liabilities at fair value through profit or loss” in the period in which they arise. The property investments held by the underlying funds are valued at least once annually by each fund based on independent third party appraisals. These property valuations will be reflected in the Company’s valuation of their investments at such time as the underlying fund valuations are reported to the Company by each fund manager. There may be a timing difference between the date of the last reported underlying property valuation and the date of the Company’s financial statements during which the underlying property values may have increased or decreased by a material amount. Subject to adjustments made by the Pricing Committee as discussed below, investments in underlying funds are valued based on the independently audited Net Asset Values of such funds. For those funds for which independently audited financial statements are not available, the valuations are based on the underlying funds’ net asset values as calculated by the administrators of these funds. It is possible that the underlying funds’ results may subsequently be adjusted when results are subjected to an audit, and the adjustments may be material. As of 31 December 2013 the financial statements include investments valued at EUR 215,630,697, whose values have been based on unaudited net asset value as reported by the administrators of the underlying funds.
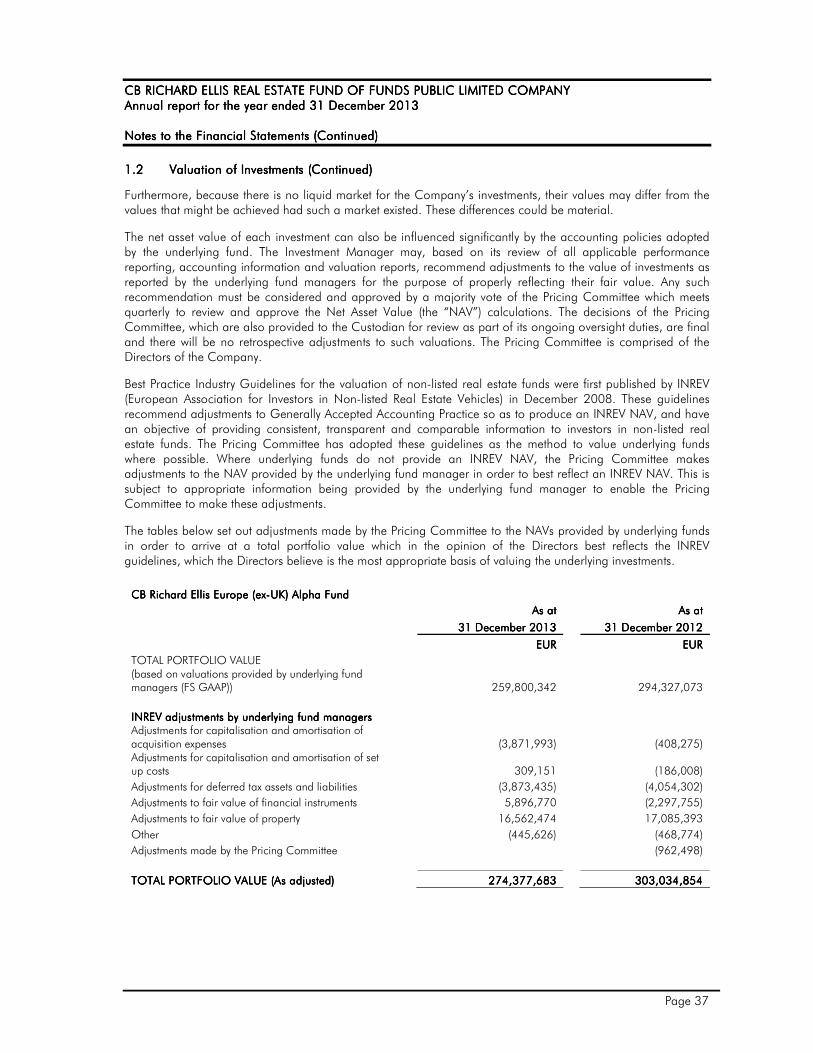
CB RICHARD ELLIS REAL ESTATE FUND OF FUNDS CB RICHARD ELLIS REAL ESTATE FUND OF FUNDS CB RICHARD ELLIS REAL ESTATE FUND OF FUNDS CB RICHARD ELLIS REAL ESTATE FUND OF FUNDS PUBLIC LIMITED COMPANYPUBLIC LIMITED COMPANYPUBLIC LIMITED COMPANYPUBLIC LIMITED COMPANY Annual report for the year ended 31 DecemberAnnual report for the year ended 31 DecemberAnnual report for the year ended 31 DecemberAnnual report for the year ended 31 December 2013201320132013 Notes to the Notes to the Notes to the Notes to the FFFFinancial Statements inancial Statements inancial Statements inancial Statements (Continued)(Continued)(Continued)(Continued)
Page 37
1.21.21.21.2 Valuation of InvestmentsValuation of InvestmentsValuation of InvestmentsValuation of Investments (Continued)(Continued)(Continued)(Continued)
Furthermore, because there is no liquid market for the Company’s investments, their values may differ from the values that might be achieved had such a market existed. These differences could be material.
The net asset value of each investment can also be influenced significantly by the accounting policies adopted by the underlying fund. The Investment Manager may, based on its review of all applicable performance reporting, accounting information and valuation reports, recommend adjustments to the value of investments as reported by the underlying fund managers for the purpose of properly reflecting their fair value. Any such recommendation must be considered and approved by a majority vote of the Pricing Committee which meets quarterly to review and approve the Net Asset Value (the “NAV”) calculations. The decisions of the Pricing Committee, which are also provided to the Custodian for review as part of its ongoing oversight duties, are final and there will be no retrospective adjustments to such valuations. The Pricing Committee is comprised of the Directors of the Company.
Best Practice Industry Guidelines for the valuation of non-listed real estate funds were first published by INREV (European Association for Investors in Non-listed Real Estate Vehicles) in December 2008. These guidelines recommend adjustments to Generally Accepted Accounting Practice so as to produce an INREV NAV, and have an objective of providing consistent, transparent and comparable information to investors in non-listed real estate funds. The Pricing Committee has adopted these guidelines as the method to value underlying funds where possible. Where underlying funds do not provide an INREV NAV, the Pricing Committee makes adjustments to the NAV provided by the underlying fund manager in order to best reflect an INREV NAV. This is subject to appropriate information being provided by the underlying fund manager to enable the Pricing Committee to make these adjustments.
The tables below set out adjustments made by the Pricing Committee to the NAVs provided by underlying funds in order to arrive at a total portfolio value which in the opinion of the Directors best reflects the INREV guidelines, which the Directors believe is the most appropriate basis of valuing the underlying investments.
CB Richard Ellis Europe (exCB Richard Ellis Europe (exCB Richard Ellis Europe (exCB Richard Ellis Europe (ex----UK) Alpha FundUK) Alpha FundUK) Alpha FundUK) Alpha Fund
As atAs atAs atAs at As atAs atAs atAs at
31 Dec31 Dec31 Dec31 December 201ember 201ember 201ember 2013333 31 December 20131 December 20131 December 20131 December 2012222
EUREUREUREUR EUREUREUREUR
TOTAL PORTFOLIO VALUE (based on valuations provided by underlying fund managers (FS GAAP)) 259,800,342 294,327,073
INREV adjustments by underlying fund managersINREV adjustments by underlying fund managersINREV adjustments by underlying fund managersINREV adjustments by underlying fund managers Adjustments for capitalisation and amortisation of acquisition expenses (3,871,993) (408,275) Adjustments for capitalisation and amortisation of set up costs 309,151 (186,008)
Adjustments for deferred tax assets and liabilities (3,873,435) (4,054,302)
Adjustments to fair value of financial instruments 5,896,770 (2,297,755)
Adjustments to fair value of property 16,562,474 17,085,393
Other
(445,626) (468,774)
Adjustments made by the Pricing Committee (962,498)
TOTAL PORTFOLIO VALUE (As adjusted)TOTAL PORTFOLIO VALUE (As adjusted)TOTAL PORTFOLIO VALUE (As adjusted)TOTAL PORTFOLIO VALUE (As adjusted) 274,377,68274,377,68274,377,68274,377,683333 303,034,854303,034,854303,034,854303,034,854

CB RICHARD ELLIS REAL ESTATE FUND OF FUNDS CB RICHARD ELLIS REAL ESTATE FUND OF FUNDS CB RICHARD ELLIS REAL ESTATE FUND OF FUNDS CB RICHARD ELLIS REAL ESTATE FUND OF FUNDS PUBLIC LIMITED COMPANYPUBLIC LIMITED COMPANYPUBLIC LIMITED COMPANYPUBLIC LIMITED COMPANY Annual report for the year ended 31 DecemberAnnual report for the year ended 31 DecemberAnnual report for the year ended 31 DecemberAnnual report for the year ended 31 December 2013201320132013 Notes to the Notes to the Notes to the Notes to the FFFFinancial Statements inancial Statements inancial Statements inancial Statements (Continued)(Continued)(Continued)(Continued)
Page 38
1.21.21.21.2 Valuation of Investments (Continued)Valuation of Investments (Continued)Valuation of Investments (Continued)Valuation of Investments (Continued)
CB Richard Ellis Asia CB Richard Ellis Asia CB Richard Ellis Asia CB Richard Ellis Asia Alpha Plus FundAlpha Plus FundAlpha Plus FundAlpha Plus Fund
As atAs atAs atAs at As atAs atAs atAs at
31313131 DecDecDecDecember 201ember 201ember 201ember 2013333 31 December 20131 December 20131 December 20131 December 2012222
USDUSDUSDUSD USDUSDUSDUSD
TOTAL PORTFOLIO VALUE (based on valuations provided by underlying fund managers (FS GAAP)) 161,161,944 187,445,124
INREV INREV INREV INREV adjustments by underlying fund managersadjustments by underlying fund managersadjustments by underlying fund managersadjustments by underlying fund managers Adjustments for capitalisation and amortisation of acquisition expenses 1,758,359 2,119,716 Adjustments for capitalisation and amortisation of set up costs 63,078 73,103
Adjustments for deferred tax assets and liabilities (1,334,262) -
Adjustments to fair value of financial instruments 278,992 518,420
Adjustments to fair value of property -
Other 1,461 (3,448)
TOTAL PORTFOLIO VALUE (As adjusted)TOTAL PORTFOLIO VALUE (As adjusted)TOTAL PORTFOLIO VALUE (As adjusted)TOTAL PORTFOLIO VALUE (As adjusted) 161,92161,92161,92161,929999,,,,572572572572 190,152,915190,152,915190,152,915190,152,915
CBRE GMM Asia Alpha Plus Fund IIICBRE GMM Asia Alpha Plus Fund IIICBRE GMM Asia Alpha Plus Fund IIICBRE GMM Asia Alpha Plus Fund III
As atAs atAs atAs at
31 December 20131 December 20131 December 20131 December 2013333
USDUSDUSDUSD
TOTAL PORTFOLIO VALUE (based on valuations provided by underlying fund managers (FS GAAP)) 36,453,440
INREV adjustments by underlying fund INREV adjustments by underlying fund INREV adjustments by underlying fund INREV adjustments by underlying fund managersmanagersmanagersmanagers Adjustments for capitalisation and amortisation of acquisition expenses 1,171,312 Adjustments for capitalisation and amortisation of set up costs 216,503
Adjustments for deferred tax assets and liabilities (1,597,408)
Adjustments to fair value of financial instruments 24,808
Adjustments to fair value of property -
Other (1,141,147)
TOTAL PORTFOLIO VALUE (As adjusted)TOTAL PORTFOLIO VALUE (As adjusted)TOTAL PORTFOLIO VALUE (As adjusted)TOTAL PORTFOLIO VALUE (As adjusted) 35,127,50835,127,50835,127,50835,127,508
CB Richard Ellis Asia Alpha Plus CB Richard Ellis Asia Alpha Plus CB Richard Ellis Asia Alpha Plus CB Richard Ellis Asia Alpha Plus II Feeder II Feeder II Feeder II Feeder FundFundFundFund
As atAs atAs atAs at As atAs atAs atAs at
31 31 31 31 December 201December 201December 201December 2013333 31 December 20131 December 20131 December 20131 December 2012222
USDUSDUSDUSD USDUSDUSDUSD
TOTAL PORTFOLIO VALUE (based on valuations provided by underlying fund managers (FS GAAP)) 72,930,959 59,277,668
INREV adjustments by underlying fund managersINREV adjustments by underlying fund managersINREV adjustments by underlying fund managersINREV adjustments by underlying fund managers - -
TOTAL PORTFOLIO VALUE (As adjusted)TOTAL PORTFOLIO VALUE (As adjusted)TOTAL PORTFOLIO VALUE (As adjusted)TOTAL PORTFOLIO VALUE (As adjusted) 72,930,95972,930,95972,930,95972,930,959 59595959,,,,277277277277,,,,668668668668
CB RICHARD ELLIS REAL ESTATE FUND OF FUNDS CB RICHARD ELLIS REAL ESTATE FUND OF FUNDS CB RICHARD ELLIS REAL ESTATE FUND OF FUNDS CB RICHARD ELLIS REAL ESTATE FUND OF FUNDS PUBLIC LIMITED COMPANYPUBLIC LIMITED COMPANYPUBLIC LIMITED COMPANYPUBLIC LIMITED COMPANY Annual report for the year ended 31 DecemberAnnual report for the year ended 31 DecemberAnnual report for the year ended 31 DecemberAnnual report for the year ended 31 December 2013201320132013 Notes to the Notes to the Notes to the Notes to the FFFFinancial Statements inancial Statements inancial Statements inancial Statements (Continued)(Continued)(Continued)(Continued)
Page 39
1.1.1.1.3333 Foreign Currency TranslationForeign Currency TranslationForeign Currency TranslationForeign Currency Translation Functional and presentation currency Items included in the Sub-Funds’ financial statements are measured using the functional currency. The functional currency is dependent on the economic environment in which the Sub-Funds operate. The economic environment can be determined by the predominant currency of the markets in which the underlying funds invest or by the predominant denomination of the issued Share Capital. The combined financial statements of the Company are presented in EUR. The functional and presentation currency of the Sub-Funds is as follows:
- CB Richard Ellis Europe (ex-UK) Alpha Fund : EUR - CB Richard Ellis Asia Alpha Plus Fund: USD - CBRE GMM Asia Alpha Plus Fund III: USD - CB Richard Ellis Asia Alpha Plus II Feeder Fund: USD
Transactions and balances Assets and liabilities denominated in currencies other than the functional currency are translated into the functional currency at the exchange rates prevailing at the Balance Sheet date. Transactions in currencies other than the functional currency are translated into the functional currency at the exchange rates ruling at the dates of the transactions. The resulting profits and losses are included in the Profit and Loss Account. Gains and losses on foreign exchange transactions are recognised in the Profit and Loss Account in determining the results for the year. Proceeds from subscriptions and amount paid on redemption of shares are translated into the functional currency at the exchange rates prevailing at the dates of the transactions. Combined financial statements For the purposes of reporting the combined financial position and results of the Company, assets and liabilities of CB Richard Ellis Asia Alpha Plus Fund and of CB Richard Ellis Asia Alpha Plus II Feeder Fund have been translated into Euro at the closing rate at the year end date and income, expenses and changes resulting from capital transactions have been translated into Euro at the average rate over the year for inclusion in the combined financial statements of the Company. The exchange rates are detailed in note 25. A foreign exchange difference of EUR 9,188,433 as a negative figure (31 December, 2012: EUR 3,283,194 as a negative figure) arising from the translation into Euro is shown as a component of the Statement of Changes in Net Assets. The method of translation has no effect on the value of net assets allocated to the individual Sub-Funds.
1.1.1.1.4444 Forward Forward Forward Forward Foreign Foreign Foreign Foreign Currency ContractsCurrency ContractsCurrency ContractsCurrency Contracts
A forward foreign currency contract is an agreement between two parties to buy and sell a currency at a set price on a future date. Forward foreign currency contracts are included at fair value in the Balance Sheet. The fair value of a forward foreign currency contract fluctuates with changes in forward currency exchange rates. Forward foreign currency contracts are marked to market daily and the change in value is recorded in the Profit and Loss Account as an unrealised gain or loss. Realised gains or losses equal to the difference between the value of the contract at the time it was opened and the value at the time it was closed are recorded upon delivery or receipt of the currency or, if a forward foreign currency contract is offset by entering into another forward foreign currency contract with the same broker, upon settlement of the net gain or loss. These contracts may involve market risk in excess of the unrealised gain or loss reflected.
CB RICHARD ELLIS REAL ESTATE FUND OF FUNDS CB RICHARD ELLIS REAL ESTATE FUND OF FUNDS CB RICHARD ELLIS REAL ESTATE FUND OF FUNDS CB RICHARD ELLIS REAL ESTATE FUND OF FUNDS PUBLIC LIMITED COMPANYPUBLIC LIMITED COMPANYPUBLIC LIMITED COMPANYPUBLIC LIMITED COMPANY Annual report for the year ended 31 DecemberAnnual report for the year ended 31 DecemberAnnual report for the year ended 31 DecemberAnnual report for the year ended 31 December 2013201320132013 Notes to the Notes to the Notes to the Notes to the FFFFinancial Statements inancial Statements inancial Statements inancial Statements (Continued)(Continued)(Continued)(Continued)
Page 40
1.1.1.1.5555 TaxationTaxationTaxationTaxation
Under current law and practice, the Company qualifies as an investment undertaking as defined in Section 739B(1) of the Taxes Consolidation Act, 1997, (as amended). It is not chargeable to Irish tax on its income and gains. However, Irish tax may arise on the happening of a “chargeable event”. A chargeable event includes any distribution payments to shareholders or any encashment, redemption, transfer of shares, or appropriation or cancellation of shares of a shareholder by the Company for the purposes of meeting the amount of the tax payable on a gain arising on a transfer of an entitlement to a share.
No Irish tax will arise for the Company in respect of chargeable events in respect of:
(i) a shareholder who is neither Irish resident nor ordinarily resident in Ireland for tax purposes, in accordance with the provisions of the Taxes Consolidation Act, 1997 (as amended) at the time of the chargeable event, provided the necessary signed statutory declarations are held by the Company; and
(ii) certain exempt Irish resident shareholders who have provided the Company with the necessary statutory declarations.
1.61.61.61.6 Earnings per shareEarnings per shareEarnings per shareEarnings per share In accordance with FRS 25, “Financial Instruments: Disclosure and Presentation”, shares issued are classified as financial liabilities. As a result, the Company is not required to present Earnings per Share under FRS 22, “Earnings Per Share”. 1.1.1.1.7777 Revenue RecognitionRevenue RecognitionRevenue RecognitionRevenue Recognition Dividends are recognised as income on the dates the investments are first quoted “ex-dividend” to the extent that information thereon is reasonably available to the Company. Interest income is recognised in the Profit and Loss Account for all interest bearing instruments on an accrual basis using the effective yield method. 1.1.1.1.8888 ExpensesExpensesExpensesExpenses Expenses are recognised on an accrual basis. 1.1.1.1.9999 Finance Costs (Dividends)Finance Costs (Dividends)Finance Costs (Dividends)Finance Costs (Dividends) Dividends on redeemable shares are recognised in the Profit and Loss Account as finance costs. 1.1.1.1.11110000 Cash and Cash and Cash and Cash and Bank BalancesBank BalancesBank BalancesBank Balances Cash and bank balances may consist of cash at bank, and also readily realisable assets such as commercial paper (i.e. short-term paper issued by credit institutions).
CB RICHARD ELLIS REAL ESTATE FUND OF FUNDS CB RICHARD ELLIS REAL ESTATE FUND OF FUNDS CB RICHARD ELLIS REAL ESTATE FUND OF FUNDS CB RICHARD ELLIS REAL ESTATE FUND OF FUNDS PUBLIC LIMITED COMPANYPUBLIC LIMITED COMPANYPUBLIC LIMITED COMPANYPUBLIC LIMITED COMPANY Annual report for the year ended 31 DecemberAnnual report for the year ended 31 DecemberAnnual report for the year ended 31 DecemberAnnual report for the year ended 31 December 2013201320132013 Notes to the Notes to the Notes to the Notes to the FFFFinancial Statements inancial Statements inancial Statements inancial Statements (Continued)(Continued)(Continued)(Continued)
Page 41
2222 Financial Risk ManagementFinancial Risk ManagementFinancial Risk ManagementFinancial Risk Management In pursuing its investment objective, the Company is exposed to a variety of financial risks: market risk (including market price risk, interest rate risk and currency risk), credit risk and liquidity risk that could result in a reduction in the Company’s net assets. The Company invests primarily in specialist funds. The Company is therefore indirectly exposed to the risks inherent in the investee funds. These are primarily market risk, credit risk and liquidity risk. Investments held at year end are representative of the type of investments held during the year. The risks, and the Directors’ approach to the management of the risks, are as follows: Asia Alpha Plus II Feeder Fund invests substantially all of its assets in CBRE Asia Alpha Plus Fund II FCP-SIF and as such is indirectly exposed to the risks surrounding the activity of CBRE Asia Alpha Plus Fund II FCP-SIF. 2.1 2.1 2.1 2.1 Market RiskMarket RiskMarket RiskMarket Risk
Market risk is the risk that the fair value or future cash flows of a financial instrument will fluctuate because of changes in market prices. The Company is exposed to market price risk, particularly through the strategies employed by the underlying investment funds in which the Company invests. The investments of the Company are subject to normal market fluctuations and the risk inherent in investment in property related assets and there can be no assurance that appreciation will occur.
The success of the Company depends upon the Investment Manager selecting successful underlying funds, as well as on the underlying fund manager implementing investment strategies that achieve the underlying fund’s investment objectives. There can be no assurance that either the Investment Manager or the underlying fund manager will be able to do so. In particular, subjective (as opposed to systematic) decisions made by the Investment Manager and an underlying fund manager may cause the Company to decrease (or not to increase) in a manner which less subjective decision making might have avoided. The Investment Manager manages the exposure of the Company to market risk in a number of ways – firstly the Sub-Funds are well diversified by country, sector and fund. The investment restrictions imposed ensure that the Company’s portfolio is not over concentrated, limiting exposure to a single country, sector and fund. The CBRE Investors Investment Committee which comprises members external to the investment management team meets on a quarterly basis and review the Company’s performance and adherence to investment restrictions. The model portfolio of each Sub----Fund is reviewed every quarter, which incorporates the latest views on countries and sectors and takes into account any changes in market conditions. This may result in changes in allocations to both countries and sectors. Each Sub-Fund is predominately invested in closed ended funds so is unable to rebalance its portfolio every quarter to reflect these changes. However, when the initial investments in funds are made, the Investment Manager makes these decisions with a five year time horizon in order to make the required return over the full holding period. As part of the due diligence process when investing in any underlying fund, the Investment Manager ensures that the underlying fund’s documents do not permit it to incur leverage greater than 75% of the underlying fund’s Gross Asset Value. Leverage is monitored at a portfolio level and all investments are held at their maximum permitted leverage in the Investment Manager’s portfolio model to ensure that maximum weighted average gearing does not exceed 65% of their gross asset value. Each time a new investment is made, its impact on the overall level of leverage in the portfolio is modelled. In reality, each underlying fund is unlikely to leverage up to their maximum permitted level. The Investment Manager also ensures that maximum permitted leverage at the portfolio level is below the maximum permitted of 65% of Gross Asset Value.

CB RICHARD ELLIS REAL ESTATE FUND OF FUNDS CB RICHARD ELLIS REAL ESTATE FUND OF FUNDS CB RICHARD ELLIS REAL ESTATE FUND OF FUNDS CB RICHARD ELLIS REAL ESTATE FUND OF FUNDS PUBLIC LIMITED COMPANYPUBLIC LIMITED COMPANYPUBLIC LIMITED COMPANYPUBLIC LIMITED COMPANY Annual report for the year ended 31 DecemberAnnual report for the year ended 31 DecemberAnnual report for the year ended 31 DecemberAnnual report for the year ended 31 December 2013201320132013 Notes to the Notes to the Notes to the Notes to the FFFFinancial Statements inancial Statements inancial Statements inancial Statements (Continued)(Continued)(Continued)(Continued)
Page 42
2222 Financial Risk ManagementFinancial Risk ManagementFinancial Risk ManagementFinancial Risk Management (Continued)(Continued)(Continued)(Continued) 2.1 2.1 2.1 2.1 MarMarMarMarket Riskket Riskket Riskket Risk (Continued)(Continued)(Continued)(Continued)
Acquisitions of property related assets by way of trade can be difficult to realise and, as there may not be an available market for them, it may not be possible to establish their current value at any particular time. The Company’s investments in property related assets are subject to the general risks incidental to the ownership of real or heritable property, including changes in general economic or local conditions, changes in supply of or demand for competing properties in an area, changes in interest rates and the availability of mortgage funds, changes in property tax rates and zoning or planning laws and credit risks of tenants and borrowers and environmental factors. The marketability and value of any property related assets owned by the Company will, therefore, depend on many factors beyond the control of the Company and there is no assurance that there will be either a ready market for such property related assets or that such property related assets will be sold at a profit. Holdings of property are inherently difficult to value due to the lack of marketability. As a result, estimates of valuation of underlying property related assets are subject to substantial uncertainty and hence there is no assurance that the estimates resulting from the valuation process of underlying property related assets will reflect the actual sales price even where such sales occur shortly after the valuation date. The Investment Manager has in place a pricing committee charged with reviewing all pricing procedures which follows industry standard procedures for valuing investments.
The Directors monitor the market risk inherent in the Company by ensuring full and timely access to relevant information from the Investment Manager. The Directors rely upon the Investment Manager to keep them informed of any material event. The underlying funds’ market risks are managed on a daily basis by the Investment Manager in accordance with policies and procedures in place. There were no changes to the Company’s policies and processes for managing market risk and the methods used to measure risk since the prior year end. Asia Alpha Plus II Feeder Fund’s price risk arises from its investment held in CBRE Asia Alpha Plus Fund II FCP-SIF. The investment held in CBRE Asia Alpha Plus Fund II FCP-SIF presents a risk of loss of capital and is susceptible to price risk from uncertainties about the future performance of CBRE Asia Alpha Plus Fund II FCP-SIF. 2.2 2.2 2.2 2.2 Fair Value MeasurementFair Value MeasurementFair Value MeasurementFair Value Measurement
The Company has classified fair value measurements using a fair value hierarchy which has been determined on the basis of the lowest level inputs that is significant to the fair value measurement of the relevant assets as follows:
(i) Level 1: Investments whose values are based on quoted market prices in active markets. Quoted prices for these instruments are not adjusted;
(ii) Level 2: Financial instruments that trade in markets that are not considered to be active but are valued
based on quoted market prices, dealer quotations or alternative pricing sources supported by observable inputs are classified within level 2. As level 2 investments include positions that are not traded in active markets and/or are subject to transfer restrictions, valuations may be adjusted to reflect illiquidity and/or non-transferability, which are generally based on available market information; and
(iii) Level 3: Investments classified within level 3 have significant unobservable inputs, as they trade
infrequently. Pricing inputs are unobservable for the investment and include situations where there is little if any market activity for the instrument. As observable prices are not available for these securities, the Sub-Funds would have used valuation techniques to derive the fair value if applicable.

CB RICHARD ELLIS REAL ESTATE FUND OF FUNDS CB RICHARD ELLIS REAL ESTATE FUND OF FUNDS CB RICHARD ELLIS REAL ESTATE FUND OF FUNDS CB RICHARD ELLIS REAL ESTATE FUND OF FUNDS PUBLIC LIMITED COMPANYPUBLIC LIMITED COMPANYPUBLIC LIMITED COMPANYPUBLIC LIMITED COMPANY Annual report for the year ended 31 DecemberAnnual report for the year ended 31 DecemberAnnual report for the year ended 31 DecemberAnnual report for the year ended 31 December 2013201320132013 Notes to the Notes to the Notes to the Notes to the FFFFinancial Statements inancial Statements inancial Statements inancial Statements (Continued)(Continued)(Continued)(Continued)
Page 43
2222 Financial RFinancial RFinancial RFinancial Risk Managementisk Managementisk Managementisk Management (Continued)(Continued)(Continued)(Continued) 2.2 2.2 2.2 2.2 Fair Value MeasurementFair Value MeasurementFair Value MeasurementFair Value Measurement (Continued)(Continued)(Continued)(Continued) The significance of an input is assessed against the fair value measurement in its entirety. If a fair value measurement uses observable inputs that require significant adjustment based on unobservable inputs, that measurement is a level 3 measurement. Assessing the significance of a particular input to the fair value measurement in its entirety requires judgement, considering factors specific to the financial asset or liability. The determination of what constitutes ‘observable’ requires significant judgement by the Directors in consultation with the Investment Manager. The Directors consider observable data to be that market data that is readily available, regularly distributed or updated, reliable and verifiable, not proprietary, and provided by independent sources that are actively involved in the relevant market.
In the prior years, all the investments were classified in level 3. For the current reporting year, the Board of Directors reassessed the conditions for classifying the investments in level 2 or level 3 and determined that investments in open-ended funds that are redeemable in the near term at a price equal (or substantially equivalent) to the net asset value (“NAV”) per share and valued as such with no significant adjustment, are eligible for level 2 classification. Accordingly, as of 31 December 2013, all the investments held by the Sub-Funds in open-ended funds that are redeemable in the near term, have been classified in level 2. The other investments were classified in level 3. Similarly, comparatives have been restated to reflect the change in the fair value measurement policy.
The following tables provide an analysis within the fair value hierarchy of the Sub----Funds’ financial assets and liabilities measured at fair value at 31 December 2013 and 31 December 2012:
CB Richard Ellis Europe (exCB Richard Ellis Europe (exCB Richard Ellis Europe (exCB Richard Ellis Europe (ex----UK) Alpha FundUK) Alpha FundUK) Alpha FundUK) Alpha Fund
31 December 20131 December 20131 December 20131 December 2013333 Level 1Level 1Level 1Level 1 Level 2Level 2Level 2Level 2 Level 3Level 3Level 3Level 3 TotalTotalTotalTotal
EUREUREUREUR EUREUREUREUR EUREUREUREUR EUREUREUREUR
Financial Assets at fair value through profit or loss:
Investments in underlying funds - 40,175,140 234,202,543 274,377,683
Forward Foreign Currency Contracts 1,885,048 - 1,885,048
Total Financial AssetsTotal Financial AssetsTotal Financial AssetsTotal Financial Assets ---- 42424242,,,,060060060060,,,,188188188188 222234343434,,,,202202202202,,,,543543543543 222276767676,,,,262262262262,,,,737373731111
Financial Liabilities at fair value through profit or loss:
Forward Foreign Currency Contracts - - - -
Total Financial LiabilitiesTotal Financial LiabilitiesTotal Financial LiabilitiesTotal Financial Liabilities ---- ---- ---- ----

CB RICHARD ELLIS REAL ESTATE FUND OF FUNDS CB RICHARD ELLIS REAL ESTATE FUND OF FUNDS CB RICHARD ELLIS REAL ESTATE FUND OF FUNDS CB RICHARD ELLIS REAL ESTATE FUND OF FUNDS PUBLIC LIMITED COMPANYPUBLIC LIMITED COMPANYPUBLIC LIMITED COMPANYPUBLIC LIMITED COMPANY Annual report for the year ended 31 DecemberAnnual report for the year ended 31 DecemberAnnual report for the year ended 31 DecemberAnnual report for the year ended 31 December 2013201320132013 Notes to the Notes to the Notes to the Notes to the FFFFinancial Statements inancial Statements inancial Statements inancial Statements (Continued)(Continued)(Continued)(Continued)
Page 44
2222 Financial Risk ManagementFinancial Risk ManagementFinancial Risk ManagementFinancial Risk Management (Continued)(Continued)(Continued)(Continued) 2.2 2.2 2.2 2.2 Fair Value MeasurementFair Value MeasurementFair Value MeasurementFair Value Measurement (Continued)(Continued)(Continued)(Continued)
31 December 201231 December 201231 December 201231 December 2012 Level Level Level Level 1111 Level 2Level 2Level 2Level 2 Level 3Level 3Level 3Level 3 TotalTotalTotalTotal
EUREUREUREUR EUREUREUREUR RestatedRestatedRestatedRestated
EUREUREUREUR RestatedRestatedRestatedRestated
EUREUREUREUR
Financial Assets at fair value through profit or loss:
Investments in underlying funds - 39,626,025 263,408,829 303,034,854
Total Financial AssetsTotal Financial AssetsTotal Financial AssetsTotal Financial Assets ---- 39393939,,,,626626626626,,,,025025025025 222263636363,,,,408408408408,,,,829829829829 303,034,854303,034,854303,034,854303,034,854
Financial Liabilities at fair value through profit or loss:
Forward Foreign Currency Contracts - (335,383) - (335,383)
Total Financial LiabilitiesTotal Financial LiabilitiesTotal Financial LiabilitiesTotal Financial Liabilities ---- (335,383) ---- ((((335,383335,383335,383335,383))))
CB Richard Ellis Asia Alpha Plus FundCB Richard Ellis Asia Alpha Plus FundCB Richard Ellis Asia Alpha Plus FundCB Richard Ellis Asia Alpha Plus Fund
31 31 31 31 December 2013December 2013December 2013December 2013 Level 1Level 1Level 1Level 1 Level 2Level 2Level 2Level 2 Level 3Level 3Level 3Level 3 TotalTotalTotalTotal
USDUSDUSDUSD USDUSDUSDUSD USDUSDUSDUSD USDUSDUSDUSD
Financial Assets at fair value through profit or loss:
Investments in underlying funds - - 161,929,572 161,929,572
Forward Foreign Currency Contracts - 1,318,595 - 1,318,595
Total Financial AssetsTotal Financial AssetsTotal Financial AssetsTotal Financial Assets ---- 1,318,5951,318,5951,318,5951,318,595 111161616161,,,,929929929929,,,,572572572572 111163636363,,,,248248248248,,,,167167167167
Financial Liabilities at fair value through profit or loss:
Forward Foreign Currency Contracts - - - -
Total Financial LiabilitiesTotal Financial LiabilitiesTotal Financial LiabilitiesTotal Financial Liabilities ---- ---- ---- ----
31 December 31 December 31 December 31 December 2012201220122012 Level 1Level 1Level 1Level 1 Level 2Level 2Level 2Level 2 Level 3Level 3Level 3Level 3 TotalTotalTotalTotal
USDUSDUSDUSD USDUSDUSDUSD USDUSDUSDUSD USDUSDUSDUSD
Financial Assets at fair value through profit or loss:
Investments in underlying funds - - 190,152,915 190,152,915
Forward Foreign Currency Contracts - 2,854,064 - 2,854,064
Total Financial AssetsTotal Financial AssetsTotal Financial AssetsTotal Financial Assets ---- 2,854,0642,854,0642,854,0642,854,064 111190909090,,,,152152152152,,,,915915915915 111199993333,,,,006006006006,,,,999979797979
Financial Liabilities at fair value through profit or loss:
Forward Foreign Currency Contracts - - - -
Total Financial LiabilitiesTotal Financial LiabilitiesTotal Financial LiabilitiesTotal Financial Liabilities ---- ---- ---- ----

CB RICHARD ELLIS REAL ESTATE FUND OF FUNDS CB RICHARD ELLIS REAL ESTATE FUND OF FUNDS CB RICHARD ELLIS REAL ESTATE FUND OF FUNDS CB RICHARD ELLIS REAL ESTATE FUND OF FUNDS PUBLIC LIMITED COMPANYPUBLIC LIMITED COMPANYPUBLIC LIMITED COMPANYPUBLIC LIMITED COMPANY Annual report for the year ended 31 DecemberAnnual report for the year ended 31 DecemberAnnual report for the year ended 31 DecemberAnnual report for the year ended 31 December 2013201320132013 Notes to the Notes to the Notes to the Notes to the FFFFinancial Statements inancial Statements inancial Statements inancial Statements (Continued)(Continued)(Continued)(Continued)
Page 45
2222 Financial Risk Financial Risk Financial Risk Financial Risk ManagementManagementManagementManagement (Continued)(Continued)(Continued)(Continued) 2.2 2.2 2.2 2.2 Fair Value MeasurementFair Value MeasurementFair Value MeasurementFair Value Measurement (Continued)(Continued)(Continued)(Continued) CBCBCBCBRE GMM Asia Alpha Plus Fund IIIRE GMM Asia Alpha Plus Fund IIIRE GMM Asia Alpha Plus Fund IIIRE GMM Asia Alpha Plus Fund III
31 December 20131 December 20131 December 20131 December 2013333 Level 1Level 1Level 1Level 1 Level 2Level 2Level 2Level 2 Level 3Level 3Level 3Level 3 TotalTotalTotalTotal
USDUSDUSDUSD USDUSDUSDUSD USDUSDUSDUSD USDUSDUSDUSD
Financial Assets at fair value through profit or loss:
Investments in underlying funds - - 35,127,508 35,127,508
Total Financial AssetsTotal Financial AssetsTotal Financial AssetsTotal Financial Assets ---- ---- 33335555,,,,127127127127,,,,508508508508 33335555,,,,127127127127,,,,508508508508
CB Richard Ellis Asia Alpha PlusCB Richard Ellis Asia Alpha PlusCB Richard Ellis Asia Alpha PlusCB Richard Ellis Asia Alpha Plus II FeederII FeederII FeederII Feeder FundFundFundFund
31 December 20131 December 20131 December 20131 December 2013333 Level 1Level 1Level 1Level 1 Level 2Level 2Level 2Level 2 Level 3Level 3Level 3Level 3 TotalTotalTotalTotal
USDUSDUSDUSD USDUSDUSDUSD USDUSDUSDUSD USDUSDUSDUSD
Financial Assets at fair value through profit or loss:
Investments in underlying funds - - 72,930,959 72,930,959 Total Financial AssetsTotal Financial AssetsTotal Financial AssetsTotal Financial Assets ---- ---- 77772222,,,,930930930930,,,,959959959959 77772222,,,,930930930930,,,,959959959959
31 December 201231 December 201231 December 201231 December 2012 Level 1Level 1Level 1Level 1 Level 2Level 2Level 2Level 2 Level 3Level 3Level 3Level 3 TotalTotalTotalTotal
USDUSDUSDUSD USDUSDUSDUSD USDUSDUSDUSD USDUSDUSDUSD
Financial Assets at fair value through profit or loss:
Investments in underlying funds - - 59,277,668 59,277,668
Total Financial AssetsTotal Financial AssetsTotal Financial AssetsTotal Financial Assets ---- ---- 59,59,59,59,277277277277,,,,668668668668 59,59,59,59,277277277277,,,,668668668668

CB RICHARD ELLIS REAL ESTATE FUND OF FUNDS CB RICHARD ELLIS REAL ESTATE FUND OF FUNDS CB RICHARD ELLIS REAL ESTATE FUND OF FUNDS CB RICHARD ELLIS REAL ESTATE FUND OF FUNDS PUBLIC LIMITED COMPANYPUBLIC LIMITED COMPANYPUBLIC LIMITED COMPANYPUBLIC LIMITED COMPANY Annual report for the year ended 31 DecemberAnnual report for the year ended 31 DecemberAnnual report for the year ended 31 DecemberAnnual report for the year ended 31 December 2013201320132013 Notes to the Notes to the Notes to the Notes to the FFFFinancial Statements inancial Statements inancial Statements inancial Statements (Continued)(Continued)(Continued)(Continued)
Page 46
2222 Financial Risk ManagementFinancial Risk ManagementFinancial Risk ManagementFinancial Risk Management (Continued)(Continued)(Continued)(Continued) 2.2 2.2 2.2 2.2 Fair Value MeasurementFair Value MeasurementFair Value MeasurementFair Value Measurement (Continued)(Continued)(Continued)(Continued) The following tables present a reconciliation of movements in the fair value of investments in underlying funds categorised within level 3 for the years ended 31 December 2013 and 31 December 2012: CB Richard Ellis Europe (exCB Richard Ellis Europe (exCB Richard Ellis Europe (exCB Richard Ellis Europe (ex----UK) Alpha FundUK) Alpha FundUK) Alpha FundUK) Alpha Fund
31 December 31 December 31 December 31 December 2013201320132013 Portfolio ValuationPortfolio ValuationPortfolio ValuationPortfolio Valuation EUREUREUREUR
Opening balance 263,408,829 Purchases/ Issues 664,125 Sales/ Redemptions (7,620,678) Transfers into level 3 - Gains or losses recognised in profit or loss (22,249,733)
Closing balanceClosing balanceClosing balanceClosing balance 222234343434,,,,202202202202,,,,543543543543
Gains or losses recognised in profit or loss can be attributed to assets as follows:
Assets held at the end of the reporting year (22,249,733)
Assets not held at the end of the reporting year -
Total gains or lossesTotal gains or lossesTotal gains or lossesTotal gains or losses ((((22222222,,,,249249249249,,,,733733733733))))
31 December 201231 December 201231 December 201231 December 2012 Portfolio ValuationPortfolio ValuationPortfolio ValuationPortfolio Valuation EUREUREUREUR
RestatedRestatedRestatedRestated
Opening balance 298,613,861 Purchases/ Issues - Sales/ Redemptions (15,151,215) Transfers into level 3 - Gains or losses recognised in profit or loss (20,053,817)
Closing balanceClosing balanceClosing balanceClosing balance 222263636363,,,,408408408408,,,,829829829829
Gains or losses recognised in profit or loss can be attributed to assets as follows:
Assets held at the end of the reporting year (20,359,033)
Assets not held at the end of the reporting year 305,216
Total gains or lossesTotal gains or lossesTotal gains or lossesTotal gains or losses ((((20202020,,,,053053053053,,,,817817817817))))
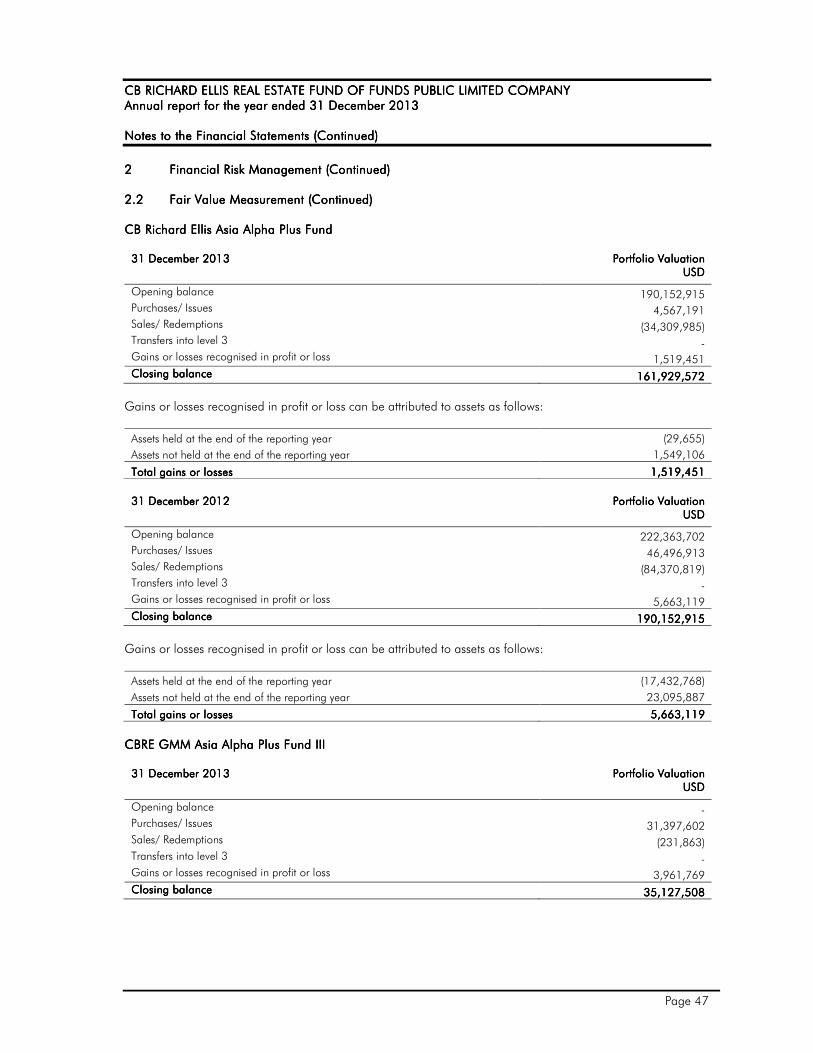
CB RICHARD ELLIS REAL ESTATE FUND OF FUNDS CB RICHARD ELLIS REAL ESTATE FUND OF FUNDS CB RICHARD ELLIS REAL ESTATE FUND OF FUNDS CB RICHARD ELLIS REAL ESTATE FUND OF FUNDS PUBLIC LIMITED COMPANYPUBLIC LIMITED COMPANYPUBLIC LIMITED COMPANYPUBLIC LIMITED COMPANY Annual report for the year ended 31 DecemberAnnual report for the year ended 31 DecemberAnnual report for the year ended 31 DecemberAnnual report for the year ended 31 December 2013201320132013 Notes to the Notes to the Notes to the Notes to the FFFFinancial Statements inancial Statements inancial Statements inancial Statements (Continued)(Continued)(Continued)(Continued)
Page 47
2222 Financial Risk ManagementFinancial Risk ManagementFinancial Risk ManagementFinancial Risk Management (Continued)(Continued)(Continued)(Continued) 2.2 2.2 2.2 2.2 Fair Value MeasurementFair Value MeasurementFair Value MeasurementFair Value Measurement (Continued)(Continued)(Continued)(Continued) CB Richard Ellis Asia Alpha Plus FundCB Richard Ellis Asia Alpha Plus FundCB Richard Ellis Asia Alpha Plus FundCB Richard Ellis Asia Alpha Plus Fund
31 December 201331 December 201331 December 201331 December 2013 Portfolio ValuationPortfolio ValuationPortfolio ValuationPortfolio Valuation USDUSDUSDUSD
Opening balance 190,152,915 Purchases/ Issues 4,567,191 Sales/ Redemptions (34,309,985) Transfers into level 3 - Gains or losses recognised in profit or loss 1,519,451
Closing balanceClosing balanceClosing balanceClosing balance 111161616161,,,,929929929929,,,,572572572572
Gains or losses recognised in profit or loss can be attributed to assets as follows:
Assets held at the end of the reporting year (29,655)
Assets not held at the end of the reporting year 1,549,106
Total gains or lossesTotal gains or lossesTotal gains or lossesTotal gains or losses 1,519,451 1,519,451 1,519,451 1,519,451
31 December 201231 December 201231 December 201231 December 2012 Portfolio ValuationPortfolio ValuationPortfolio ValuationPortfolio Valuation
USDUSDUSDUSD
Opening balance 222,363,702 Purchases/ Issues 46,496,913 Sales/ Redemptions (84,370,819) Transfers into level 3 - Gains or losses recognised in profit or loss 5,663,119
Closing balanceClosing balanceClosing balanceClosing balance 111190909090,,,,152152152152,,,,915915915915
Gains or losses recognised in profit or loss can be attributed to assets as follows:
Assets held at the end of the reporting year (17,432,768)
Assets not held at the end of the reporting year 23,095,887
Total gains or lossesTotal gains or lossesTotal gains or lossesTotal gains or losses 5555,,,,663663663663,,,,119119119119
CBCBCBCBRE GMM Asia Alpha Plus Fund IIIRE GMM Asia Alpha Plus Fund IIIRE GMM Asia Alpha Plus Fund IIIRE GMM Asia Alpha Plus Fund III
31 December 201331 December 201331 December 201331 December 2013 Portfolio ValuationPortfolio ValuationPortfolio ValuationPortfolio Valuation USDUSDUSDUSD
Opening balance - Purchases/ Issues 31,397,602 Sales/ Redemptions (231,863) Transfers into level 3 - Gains or losses recognised in profit or loss 3,961,769
Closing balanceClosing balanceClosing balanceClosing balance 35,127,508 35,127,508 35,127,508 35,127,508

CB RICHARD ELLIS REAL ESTATE FUND OF FUNDS CB RICHARD ELLIS REAL ESTATE FUND OF FUNDS CB RICHARD ELLIS REAL ESTATE FUND OF FUNDS CB RICHARD ELLIS REAL ESTATE FUND OF FUNDS PUBLIC LIMITED COMPANYPUBLIC LIMITED COMPANYPUBLIC LIMITED COMPANYPUBLIC LIMITED COMPANY Annual report for the year ended 31 DecemberAnnual report for the year ended 31 DecemberAnnual report for the year ended 31 DecemberAnnual report for the year ended 31 December 2013201320132013 Notes to the Notes to the Notes to the Notes to the FFFFinancial Statements inancial Statements inancial Statements inancial Statements (Continued)(Continued)(Continued)(Continued)
Page 48
2222 Financial Risk ManagementFinancial Risk ManagementFinancial Risk ManagementFinancial Risk Management (Continued)(Continued)(Continued)(Continued) 2.2 2.2 2.2 2.2 Fair Value MeasurementFair Value MeasurementFair Value MeasurementFair Value Measurement (Continued)(Continued)(Continued)(Continued) Gains or losses recognised in profit or loss can be attributed to assets as follows:
Assets held at the end of the reporting year 3,961,769
Assets not held at the end of the reporting year -
Total gains or lossesTotal gains or lossesTotal gains or lossesTotal gains or losses 3,961,769 3,961,769 3,961,769 3,961,769
CB Richard Ellis Asia Alpha Plus CB Richard Ellis Asia Alpha Plus CB Richard Ellis Asia Alpha Plus CB Richard Ellis Asia Alpha Plus II Feeder II Feeder II Feeder II Feeder FundFundFundFund
31 December 201331 December 201331 December 201331 December 2013 Portfolio ValuationPortfolio ValuationPortfolio ValuationPortfolio Valuation USDUSDUSDUSD
Opening balance 59,277,668 Purchases/ Issues 5,662,500 Sales/ Redemptions (4,645,147) Transfers into level 3 - Gains or losses recognised in profit or loss 12,635,938
Closing balanceClosing balanceClosing balanceClosing balance 77772222,,,,930930930930,,,,959959959959
Gains or losses recognised in profit or loss can be attributed to assets as follows:
Assets held at the end of the reporting year 12,635,938
Assets not held at the end of the reporting year -
Total gains or lossesTotal gains or lossesTotal gains or lossesTotal gains or losses 11112222,,,,635635635635,,,,938938938938
31 December 201231 December 201231 December 201231 December 2012 Portfolio ValuationPortfolio ValuationPortfolio ValuationPortfolio Valuation
USDUSDUSDUSD
Opening balance - Purchases/ Issues 58,718,963 Sales/ Redemptions (4,210,751) Transfers into level 3 - Gains or losses recognised in profit or loss 4,769,456
Closing balanceClosing balanceClosing balanceClosing balance 59,59,59,59,277277277277,,,,668668668668
Gains or losses recognised in profit or loss can be attributed to assets as follows:
Assets held at the end of the reporting year 4,769,456
Assets not held at the end of the reporting year -
Total gains or lossesTotal gains or lossesTotal gains or lossesTotal gains or losses 4,4,4,4,769769769769,,,,456456456456
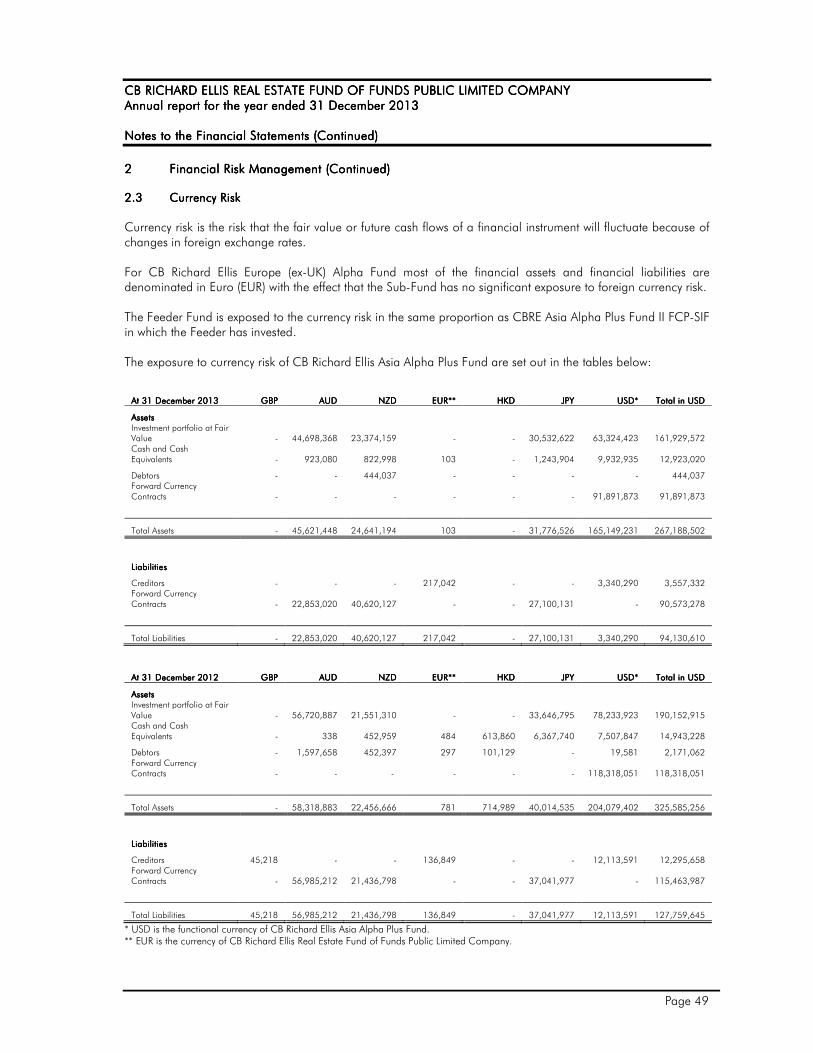
CB RICHARD ELLIS REAL ESTATE FUND OF FUNDS CB RICHARD ELLIS REAL ESTATE FUND OF FUNDS CB RICHARD ELLIS REAL ESTATE FUND OF FUNDS CB RICHARD ELLIS REAL ESTATE FUND OF FUNDS PUBLIC LIMITED COMPANYPUBLIC LIMITED COMPANYPUBLIC LIMITED COMPANYPUBLIC LIMITED COMPANY Annual report for the year ended 31 DecemberAnnual report for the year ended 31 DecemberAnnual report for the year ended 31 DecemberAnnual report for the year ended 31 December 2013201320132013 Notes to the Notes to the Notes to the Notes to the FFFFinancial Statements inancial Statements inancial Statements inancial Statements (Continued)(Continued)(Continued)(Continued)
Page 49
2222 Financial Risk ManagementFinancial Risk ManagementFinancial Risk ManagementFinancial Risk Management (Continued)(Continued)(Continued)(Continued) 2.3 2.3 2.3 2.3 Currency RiskCurrency RiskCurrency RiskCurrency Risk
Currency risk is the risk that the fair value or future cash flows of a financial instrument will fluctuate because of changes in foreign exchange rates. For CB Richard Ellis Europe (ex-UK) Alpha Fund most of the financial assets and financial liabilities are denominated in Euro (EUR) with the effect that the Sub-Fund has no significant exposure to foreign currency risk. The Feeder Fund is exposed to the currency risk in the same proportion as CBRE Asia Alpha Plus Fund II FCP-SIF in which the Feeder has invested. The exposure to currency risk of CB Richard Ellis Asia Alpha Plus Fund are set out in the tables below:
At 31 December 2013At 31 December 2013At 31 December 2013At 31 December 2013 GBPGBPGBPGBP AUD AUD AUD AUD NZD NZD NZD NZD EUREUREUREUR******** HKD HKD HKD HKD JPY JPY JPY JPY USD* USD* USD* USD* Total in USD Total in USD Total in USD Total in USD
AssetsAssetsAssetsAssets Investment portfolio at Fair
Value - 44,698,368 23,374,159 - - 30,532,622 63,324,423 161,929,572 Cash and Cash Equivalents - 923,080 822,998 103 - 1,243,904 9,932,935 12,923,020
Debtors - - 444,037 - - - - 444,037 Forward Currency Contracts - - - - - - 91,891,873 91,891,873
Total Assets - 45,621,448 24,641,194 103 - 31,776,526 165,149,231 267,188,502
LiabilitiesLiabilitiesLiabilitiesLiabilities
Creditors - - - 217,042 - - 3,340,290 3,557,332 Forward Currency Contracts - 22,853,020 40,620,127 - - 27,100,131 - 90,573,278
Total Liabilities - 22,853,020 40,620,127 217,042 - 27,100,131 3,340,290 94,130,610
At 31 December 2012At 31 December 2012At 31 December 2012At 31 December 2012 GBPGBPGBPGBP AUD AUD AUD AUD NZD NZD NZD NZD EUREUREUREUR******** HKD HKD HKD HKD JPY JPY JPY JPY USD* USD* USD* USD* Total in USD Total in USD Total in USD Total in USD
AssetsAssetsAssetsAssets Investment portfolio at Fair
Value - 56,720,887 21,551,310 - - 33,646,795 78,233,923 190,152,915 Cash and Cash Equivalents - 338 452,959 484 613,860 6,367,740 7,507,847 14,943,228
Debtors - 1,597,658 452,397 297 101,129 - 19,581 2,171,062 Forward Currency Contracts - - - - - - 118,318,051 118,318,051
Total Assets - 58,318,883 22,456,666 781 714,989 40,014,535 204,079,402 325,585,256
LiabilitiesLiabilitiesLiabilitiesLiabilities
Creditors 45,218 - - 136,849 - - 12,113,591 12,295,658 Forward Currency Contracts - 56,985,212 21,436,798 - - 37,041,977 - 115,463,987
Total Liabilities 45,218 56,985,212 21,436,798 136,849 - 37,041,977 12,113,591 127,759,645
* USD is the functional currency of CB Richard Ellis Asia Alpha Plus Fund. ** EUR is the currency of CB Richard Ellis Real Estate Fund of Funds Public Limited Company.

CB RICHARD ELLIS REAL ESTATE FUND OF FUNDS CB RICHARD ELLIS REAL ESTATE FUND OF FUNDS CB RICHARD ELLIS REAL ESTATE FUND OF FUNDS CB RICHARD ELLIS REAL ESTATE FUND OF FUNDS PUBLIC LIMITED COMPANYPUBLIC LIMITED COMPANYPUBLIC LIMITED COMPANYPUBLIC LIMITED COMPANY Annual report for the year ended 31 DecemberAnnual report for the year ended 31 DecemberAnnual report for the year ended 31 DecemberAnnual report for the year ended 31 December 2013201320132013 Notes to the Notes to the Notes to the Notes to the FFFFinancial Statements inancial Statements inancial Statements inancial Statements (Continued)(Continued)(Continued)(Continued)
Page 50
2222 Financial Risk ManagementFinancial Risk ManagementFinancial Risk ManagementFinancial Risk Management (Continued)(Continued)(Continued)(Continued) 2.3 2.3 2.3 2.3 Currency RiskCurrency RiskCurrency RiskCurrency Risk (Continued)(Continued)(Continued)(Continued)
The exposure to currency risk of CBRE GMM Asia Alpha Plus Fund III are set out in the tables below:
At 31 December 2013At 31 December 2013At 31 December 2013At 31 December 2013 AUD AUD AUD AUD EUREUREUREUR******** JPY JPY JPY JPY USD* USD* USD* USD* Total in USD Total in USD Total in USD Total in USD
AssetsAssetsAssetsAssets Investment portfolio at Fair
Value 10,285,061 - 21,392,006 3,450,441 35,127,508
Cash and Cash Equivalents 8,616 - - 3,717,942 3,726,558
Debtors - - - 263,281 263,281
Total Assets 10,293,677 - 21,392,006 7,431,664 39,117,347
LiabilitiesLiabilitiesLiabilitiesLiabilities
Creditors - 78,905 - 714,014 792,919
Total Liabilities - 78,905 - 714,014 792,919
* USD is the functional currency of CBRE GMM Asia Alpha Plus Fund III. ** EUR is the currency of CB Richard Ellis Real Estate Fund of Funds Public Limited Company. In accordance with the Company’s policy, the Investment Manager monitors the Company’s currency position on a daily basis and the Board of Directors rely upon the Investment Manager to keep it informed of any material event. Although CB Richard Ellis Europe (ex-UK) Alpha Fund has no significant exposure to foreign currency risk, CB Richard Ellis Europe (ex-UK) Alpha Fund currently utilises hedging strategies in respect of the Class B (GBP Hedged) shares in order to hedge the exposure to Euro. This hedging is undertaken by means of forward currency contracts. All costs and losses arising in relation to such currency hedging transactions will be borne by the Class B (GBP Hedged) shares and all gains arising in connection with such hedging transactions will be attributable to the Class B (GBP Hedged) shares of CB Richard Ellis Europe (ex-UK) Alpha Fund. 2.42.42.42.4 Credit RiskCredit RiskCredit RiskCredit Risk
Credit risk is the risk that a counterparty or an issuer will be unable to pay amounts in full when due. The Company is exposed to credit risk on parties with whom it trades, which includes counterparties and underlying funds and may also bear the risk of settlement default. The Company may at certain times hold relatively few investments. The Company could, therefore, be subject to significant losses if it holds a large position in a particular investment that declines in value or is otherwise adversely affected. Cash accounts opened on the books of RBC Investor Services Bank S.A., Dublin Branch are obligations of RBC Investor Services Bank S.A. (“RBC”). The credit rating for RBC at 31 December 2013 is Aa3 (Moody’s) and AA- (S&P). (2012: Aa3/AA-). In accordance with the Company’s policy, the Investment Manager monitors the underlying funds’ credit position on a daily basis. The Directors rely upon the Investment Manager to keep them informed of any material events. There were no changes to the Company’s policies and processes for managing credit risk and the methods used to measure risk since the prior year end....
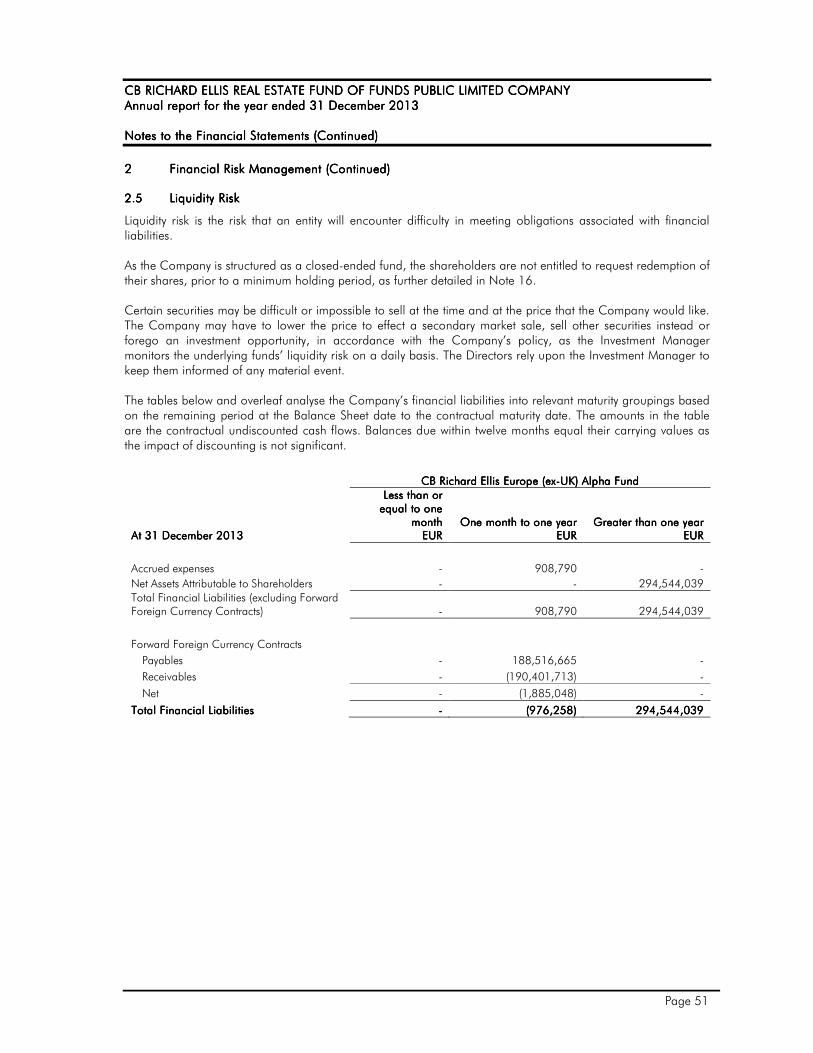
CB RICHARD ELLIS REAL ESTATE FUND OF FUNDS CB RICHARD ELLIS REAL ESTATE FUND OF FUNDS CB RICHARD ELLIS REAL ESTATE FUND OF FUNDS CB RICHARD ELLIS REAL ESTATE FUND OF FUNDS PUBLIC LIMITED COMPANYPUBLIC LIMITED COMPANYPUBLIC LIMITED COMPANYPUBLIC LIMITED COMPANY Annual report for the year ended 31 DecemberAnnual report for the year ended 31 DecemberAnnual report for the year ended 31 DecemberAnnual report for the year ended 31 December 2013201320132013 Notes to the Notes to the Notes to the Notes to the FFFFinancial Statements inancial Statements inancial Statements inancial Statements (Continued)(Continued)(Continued)(Continued)
Page 51
2222 Financial Risk ManagementFinancial Risk ManagementFinancial Risk ManagementFinancial Risk Management (Continued)(Continued)(Continued)(Continued)
2.2.2.2.5555 Liquidity RiskLiquidity RiskLiquidity RiskLiquidity Risk
Liquidity risk is the risk that an entity will encounter difficulty in meeting obligations associated with financial liabilities. As the Company is structured as a closed-ended fund, the shareholders are not entitled to request redemption of their shares, prior to a minimum holding period, as further detailed in Note 16. Certain securities may be difficult or impossible to sell at the time and at the price that the Company would like. The Company may have to lower the price to effect a secondary market sale, sell other securities instead or forego an investment opportunity, in accordance with the Company’s policy, as the Investment Manager monitors the underlying funds’ liquidity risk on a daily basis. The Directors rely upon the Investment Manager to keep them informed of any material event. The tables below and overleaf analyse the Company’s financial liabilities into relevant maturity groupings based on the remaining period at the Balance Sheet date to the contractual maturity date. The amounts in the table are the contractual undiscounted cash flows. Balances due within twelve months equal their carrying values as the impact of discounting is not significant.
CB Richard Ellis Europe (exCB Richard Ellis Europe (exCB Richard Ellis Europe (exCB Richard Ellis Europe (ex----UK) Alpha FundUK) Alpha FundUK) Alpha FundUK) Alpha Fund
At 31 December 2013At 31 December 2013At 31 December 2013At 31 December 2013
Less than or Less than or Less than or Less than or equal to one equal to one equal to one equal to one
monthmonthmonthmonth EUR EUR EUR EUR
One month to one yearOne month to one yearOne month to one yearOne month to one year EUREUREUREUR
Greater than one yearGreater than one yearGreater than one yearGreater than one year EUREUREUREUR
Accrued expenses - 908,790 -
Net Assets Attributable to Shareholders - - 294,544,039
Total Financial Liabilities (excluding Forward Foreign Currency Contracts) - 908,790 294,544,039
Forward Foreign Currency Contracts
Payables - 188,516,665 -
Receivables - (190,401,713) -
Net - (1,885,048) -
Total Financial LiabilitiesTotal Financial LiabilitiesTotal Financial LiabilitiesTotal Financial Liabilities ---- (976,258) (976,258) (976,258) (976,258) 294,544,0294,544,0294,544,0294,544,039393939

CB RICHARD ELLIS REAL ESTATE FUND OF FUNDS CB RICHARD ELLIS REAL ESTATE FUND OF FUNDS CB RICHARD ELLIS REAL ESTATE FUND OF FUNDS CB RICHARD ELLIS REAL ESTATE FUND OF FUNDS PUBLIC LIMITED COMPANYPUBLIC LIMITED COMPANYPUBLIC LIMITED COMPANYPUBLIC LIMITED COMPANY Annual report for the year ended 31 DecemberAnnual report for the year ended 31 DecemberAnnual report for the year ended 31 DecemberAnnual report for the year ended 31 December 2013201320132013 Notes to the Notes to the Notes to the Notes to the FFFFinancial Statements inancial Statements inancial Statements inancial Statements (Continued)(Continued)(Continued)(Continued)
Page 52
2222 Financial Risk ManagementFinancial Risk ManagementFinancial Risk ManagementFinancial Risk Management (Continued)(Continued)(Continued)(Continued)
2.52.52.52.5 Liquidity RiskLiquidity RiskLiquidity RiskLiquidity Risk (Continued)(Continued)(Continued)(Continued)
CB Richard Ellis Europe (exCB Richard Ellis Europe (exCB Richard Ellis Europe (exCB Richard Ellis Europe (ex----UK) Alpha FundUK) Alpha FundUK) Alpha FundUK) Alpha Fund
At 31 December 2012At 31 December 2012At 31 December 2012At 31 December 2012
Less than or Less than or Less than or Less than or equal to one equal to one equal to one equal to one
monthmonthmonthmonth EUR EUR EUR EUR
One One One One month to one yearmonth to one yearmonth to one yearmonth to one year EUREUREUREUR
Greater than one yearGreater than one yearGreater than one yearGreater than one year EUREUREUREUR
Accrued expenses - 12,405,041 -
Net Assets Attributable to Shareholders - - 336,495,880
Total Financial Liabilities (excluding Forward Foreign Currency Contracts) - 12,405,041 336,495,880
Forward Foreign Currency Contracts
Payables - 227,069,094 -
Receivables - (226,733,711) -
Net - 335,383 -
Total Financial LiabilitiesTotal Financial LiabilitiesTotal Financial LiabilitiesTotal Financial Liabilities ---- 12,740,424 12,740,424 12,740,424 12,740,424 336,495,880 336,495,880 336,495,880 336,495,880
CB Richard Ellis Asia Alpha Plus Fund CB Richard Ellis Asia Alpha Plus Fund CB Richard Ellis Asia Alpha Plus Fund CB Richard Ellis Asia Alpha Plus Fund
At 31 December 2013At 31 December 2013At 31 December 2013At 31 December 2013
Less than or Less than or Less than or Less than or equal to one equal to one equal to one equal to one
month month month month USD USD USD USD
One month to one year One month to one year One month to one year One month to one year USDUSDUSDUSD
Greater than one yearGreater than one yearGreater than one yearGreater than one year USDUSDUSDUSD
Accrued expenses - 741,779 2,815,553
Net Assets Attributable to Shareholders - - 173,057,892
Total Financial Liabilities (excluding Forward Foreign Currency Contracts) - 741,779 175,873,445
Forward Foreign Currency Contracts
Payables - 90,573,278 -
Receivables - (91,891,873) -
Net - (1,318,595) -
Total Financial Total Financial Total Financial Total Financial LiabilitiesLiabilitiesLiabilitiesLiabilities ---- ((((576,816576,816576,816576,816)))) 175,873,445 175,873,445 175,873,445 175,873,445

CB RICHARD ELLIS REAL ESTATE FUND OF FUNDS CB RICHARD ELLIS REAL ESTATE FUND OF FUNDS CB RICHARD ELLIS REAL ESTATE FUND OF FUNDS CB RICHARD ELLIS REAL ESTATE FUND OF FUNDS PUBLIC LIMITED COMPANYPUBLIC LIMITED COMPANYPUBLIC LIMITED COMPANYPUBLIC LIMITED COMPANY Annual report for the year ended 31 DecemberAnnual report for the year ended 31 DecemberAnnual report for the year ended 31 DecemberAnnual report for the year ended 31 December 2013201320132013 Notes to the Notes to the Notes to the Notes to the FFFFinancial Statements inancial Statements inancial Statements inancial Statements (Continued)(Continued)(Continued)(Continued)
Page 53
2222 Financial Risk ManagementFinancial Risk ManagementFinancial Risk ManagementFinancial Risk Management (Continued)(Continued)(Continued)(Continued)
2.52.52.52.5 Liquidity RiskLiquidity RiskLiquidity RiskLiquidity Risk (Continued)(Continued)(Continued)(Continued)
CB Richard Ellis Asia Alpha Plus Fund CB Richard Ellis Asia Alpha Plus Fund CB Richard Ellis Asia Alpha Plus Fund CB Richard Ellis Asia Alpha Plus Fund
At 31 December 2012At 31 December 2012At 31 December 2012At 31 December 2012
Less than or Less than or Less than or Less than or equal to one equal to one equal to one equal to one
month month month month USD USD USD USD
One One One One month to one year month to one year month to one year month to one year USDUSDUSDUSD
Greater than one yearGreater than one yearGreater than one yearGreater than one year USDUSDUSDUSD
Accrued expenses - 10,222,816 2,072,842
Net Assets Attributable to Shareholders - - 197,825,611
Total Financial Liabilities (excluding Forward Foreign Currency Contracts) - 10,222,816 199,898,453
Forward Foreign Currency Contracts
Payables - 115,463,987 -
Receivables - (118,318,051) -
Net - (2,854,064) -
Total Financial LiabilitiesTotal Financial LiabilitiesTotal Financial LiabilitiesTotal Financial Liabilities ---- 7,368,752 7,368,752 7,368,752 7,368,752 199,898,453 199,898,453 199,898,453 199,898,453
CBRE GMM Asia Alpha Plus CBRE GMM Asia Alpha Plus CBRE GMM Asia Alpha Plus CBRE GMM Asia Alpha Plus Fund IIIFund IIIFund IIIFund III
At 31 December 2013At 31 December 2013At 31 December 2013At 31 December 2013
Less than or Less than or Less than or Less than or equal to one equal to one equal to one equal to one
month month month month USD USD USD USD
One month to one year One month to one year One month to one year One month to one year USDUSDUSDUSD
Greater than one yearGreater than one yearGreater than one yearGreater than one year USDUSDUSDUSD
Accrued expenses - 404,688 388,231
Net Assets Attributable to Shareholders - - 38,324,428
Total Financial LiabilitiesTotal Financial LiabilitiesTotal Financial LiabilitiesTotal Financial Liabilities ---- 404,688 38,712,659
CB Richard Ellis Asia Alpha Plus II Feeder Fund CB Richard Ellis Asia Alpha Plus II Feeder Fund CB Richard Ellis Asia Alpha Plus II Feeder Fund CB Richard Ellis Asia Alpha Plus II Feeder Fund
At 31 December 2013At 31 December 2013At 31 December 2013At 31 December 2013
Less than or Less than or Less than or Less than or equal to one equal to one equal to one equal to one
month month month month USD USD USD USD
One month to one year One month to one year One month to one year One month to one year USDUSDUSDUSD
Greater than one yearGreater than one yearGreater than one yearGreater than one year USDUSDUSDUSD
Accrued expenses - 91,098 -
Net Assets Attributable to Shareholders - - 73,244,471
Total Financial LiabilitiesTotal Financial LiabilitiesTotal Financial LiabilitiesTotal Financial Liabilities ---- 91,098 73,244,471
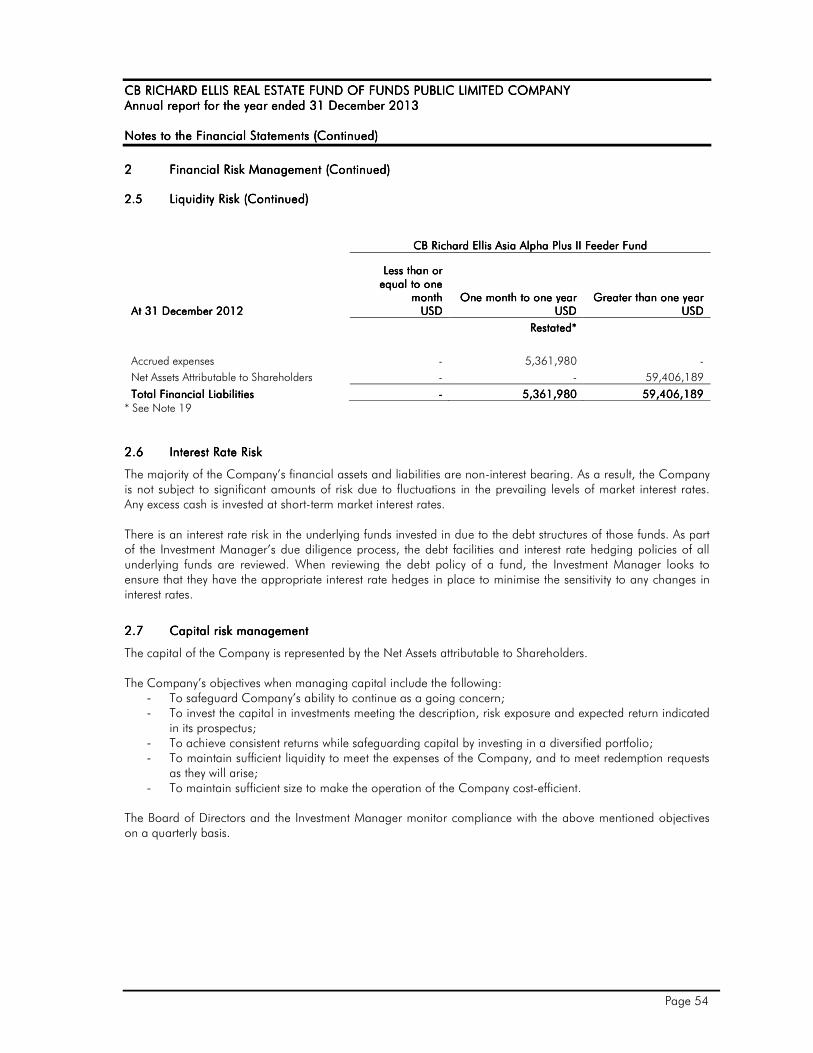
CB RICHARD ELLIS REAL ESTATE FUND OF FUNDS CB RICHARD ELLIS REAL ESTATE FUND OF FUNDS CB RICHARD ELLIS REAL ESTATE FUND OF FUNDS CB RICHARD ELLIS REAL ESTATE FUND OF FUNDS PUBLIC LIMITED COMPANYPUBLIC LIMITED COMPANYPUBLIC LIMITED COMPANYPUBLIC LIMITED COMPANY Annual report for the year ended 31 DecemberAnnual report for the year ended 31 DecemberAnnual report for the year ended 31 DecemberAnnual report for the year ended 31 December 2013201320132013 Notes to the Notes to the Notes to the Notes to the FFFFinancial Statements inancial Statements inancial Statements inancial Statements (Continued)(Continued)(Continued)(Continued)
Page 54
2222 Financial Risk ManagementFinancial Risk ManagementFinancial Risk ManagementFinancial Risk Management (Continued)(Continued)(Continued)(Continued)
2.52.52.52.5 Liquidity RiskLiquidity RiskLiquidity RiskLiquidity Risk (Continued)(Continued)(Continued)(Continued)
CB Richard Ellis Asia Alpha Plus II Feeder Fund CB Richard Ellis Asia Alpha Plus II Feeder Fund CB Richard Ellis Asia Alpha Plus II Feeder Fund CB Richard Ellis Asia Alpha Plus II Feeder Fund
At 31 December 2012At 31 December 2012At 31 December 2012At 31 December 2012
Less than or Less than or Less than or Less than or equal to one equal to one equal to one equal to one
month month month month USD USD USD USD
One month to one year One month to one year One month to one year One month to one year USDUSDUSDUSD
Greater than one yearGreater than one yearGreater than one yearGreater than one year USDUSDUSDUSD
RestatedRestatedRestatedRestated****
Accrued expenses - 5,361,980 -
Net Assets Attributable to Shareholders - - 59,406,189
Total Financial LiabilitiesTotal Financial LiabilitiesTotal Financial LiabilitiesTotal Financial Liabilities ---- 5555,,,,361361361361,,,,980980980980 59,406,189 59,406,189 59,406,189 59,406,189
* See Note 19
2.62.62.62.6 Interest Rate RiskInterest Rate RiskInterest Rate RiskInterest Rate Risk
The majority of the Company’s financial assets and liabilities are non-interest bearing. As a result, the Company is not subject to significant amounts of risk due to fluctuations in the prevailing levels of market interest rates. Any excess cash is invested at short-term market interest rates. There is an interest rate risk in the underlying funds invested in due to the debt structures of those funds. As part of the Investment Manager’s due diligence process, the debt facilities and interest rate hedging policies of all underlying funds are reviewed. When reviewing the debt policy of a fund, the Investment Manager looks to ensure that they have the appropriate interest rate hedges in place to minimise the sensitivity to any changes in interest rates.
2.72.72.72.7 Capital risk managementCapital risk managementCapital risk managementCapital risk management
The capital of the Company is represented by the Net Assets attributable to Shareholders. The Company’s objectives when managing capital include the following:
- To safeguard Company’s ability to continue as a going concern; - To invest the capital in investments meeting the description, risk exposure and expected return indicated
in its prospectus; - To achieve consistent returns while safeguarding capital by investing in a diversified portfolio; - To maintain sufficient liquidity to meet the expenses of the Company, and to meet redemption requests
as they will arise; - To maintain sufficient size to make the operation of the Company cost-efficient.
The Board of Directors and the Investment Manager monitor compliance with the above mentioned objectives on a quarterly basis.

CB RICHARD ELLIS REAL ESTATE FUND OF FUNDS CB RICHARD ELLIS REAL ESTATE FUND OF FUNDS CB RICHARD ELLIS REAL ESTATE FUND OF FUNDS CB RICHARD ELLIS REAL ESTATE FUND OF FUNDS PUBLIC LIMITED COMPANYPUBLIC LIMITED COMPANYPUBLIC LIMITED COMPANYPUBLIC LIMITED COMPANY Annual report for the year ended 31 DecemberAnnual report for the year ended 31 DecemberAnnual report for the year ended 31 DecemberAnnual report for the year ended 31 December 2013201320132013 Notes to the Notes to the Notes to the Notes to the FFFFinancial Statements inancial Statements inancial Statements inancial Statements (Continued)(Continued)(Continued)(Continued)
Page 55
3333 Financial Assets and Financial Liabilities at Fair ValueFinancial Assets and Financial Liabilities at Fair ValueFinancial Assets and Financial Liabilities at Fair ValueFinancial Assets and Financial Liabilities at Fair Value
Alpha FundAlpha FundAlpha FundAlpha Fund Alpha FundAlpha FundAlpha FundAlpha Fund Asia Alpha PlusAsia Alpha PlusAsia Alpha PlusAsia Alpha Plus
FundFundFundFund Asia Alpha PlusAsia Alpha PlusAsia Alpha PlusAsia Alpha Plus
FundFundFundFund Asia Alpha Plus Fund Asia Alpha Plus Fund Asia Alpha Plus Fund Asia Alpha Plus Fund
IIIIIIIIIIII
As atAs atAs atAs at As atAs atAs atAs at As atAs atAs atAs at As atAs atAs atAs at Year endedYear endedYear endedYear ended
31 December 201331 December 201331 December 201331 December 2013 31 31 31 31 December 2012December 2012December 2012December 2012 31 December 201331 December 201331 December 201331 December 2013 31 December 201231 December 201231 December 201231 December 2012 31 December 201331 December 201331 December 201331 December 2013
EUREUREUREUR EUREUREUREUR USDUSDUSDUSD
USDUSDUSDUSD USDUSDUSDUSD
Investment portfolio
274,377,683 303,034,854 161,929,572 190,152,915 35,127,508
Forward Currency Contracts
1,885,048 (335,383) 1,318,595 2,854,064 -
Total Financial Assets and Financial Liabilities at Fair Value
276,262,73276,262,73276,262,73276,262,731111 302,699,471 302,699,471 302,699,471 302,699,471
163,248,167 163,248,167 163,248,167 163,248,167
193,006,979 193,006,979 193,006,979 193,006,979
35,127,508 35,127,508 35,127,508 35,127,508
Asia Alpha Plus IIAsia Alpha Plus IIAsia Alpha Plus IIAsia Alpha Plus II Feeder FundFeeder FundFeeder FundFeeder Fund
Asia Alpha Plus IIAsia Alpha Plus IIAsia Alpha Plus IIAsia Alpha Plus II Feeder FundFeeder FundFeeder FundFeeder Fund TotalTotalTotalTotal TotalTotalTotalTotal
As atAs atAs atAs at As atAs atAs atAs at As atAs atAs atAs at As atAs atAs atAs at
31 December 201331 December 201331 December 201331 December 2013 31 December 201231 December 201231 December 201231 December 2012 31 December 201331 December 201331 December 201331 December 2013 31 December 31 December 31 December 31 December 2012201220122012
USDUSDUSDUSD USDUSDUSDUSD EUREUREUREUR EUREUREUREUR
Investment portfolio
72,930,959 59,277,668 470,313,403 492,227,951
Forward Currency Contracts
- - 2,841,978 1,829,425
Total Financial Assets and Financial Liabilities at Fair Value
77772222,,,,930930930930,,,,959959959959 59,277,668 59,277,668 59,277,668 59,277,668
474747473333,,,,155155155155,,,,381381381381 494,057,376 494,057,376 494,057,376 494,057,376
For the purpose of FRS 26, the investment portfolio and the forward currency contracts have been classified as financial assets and liabilities designated at fair value through profit or loss at inception.

CB RICHARD ELLIS REAL ESTATE FUND OF FUNDS CB RICHARD ELLIS REAL ESTATE FUND OF FUNDS CB RICHARD ELLIS REAL ESTATE FUND OF FUNDS CB RICHARD ELLIS REAL ESTATE FUND OF FUNDS PUBLIC LIMITED COMPANYPUBLIC LIMITED COMPANYPUBLIC LIMITED COMPANYPUBLIC LIMITED COMPANY Annual report for the year ended 31 DecemberAnnual report for the year ended 31 DecemberAnnual report for the year ended 31 DecemberAnnual report for the year ended 31 December 2013201320132013 Notes to the Notes to the Notes to the Notes to the FFFFinancial Statements inancial Statements inancial Statements inancial Statements (Continued)(Continued)(Continued)(Continued)
Page 56
4 4 4 4 Cash and Cash and Cash and Cash and Bank BalancesBank BalancesBank BalancesBank Balances
Alpha FundAlpha FundAlpha FundAlpha Fund Alpha FundAlpha FundAlpha FundAlpha Fund
Asia Alpha Plus FundAsia Alpha Plus FundAsia Alpha Plus FundAsia Alpha Plus Fund Asia Alpha Plus FundAsia Alpha Plus FundAsia Alpha Plus FundAsia Alpha Plus Fund
Asia Alpha Plus Fund IIIAsia Alpha Plus Fund IIIAsia Alpha Plus Fund IIIAsia Alpha Plus Fund III
As atAs atAs atAs at As atAs atAs atAs at
As atAs atAs atAs at
As atAs atAs atAs at
Year endedYear endedYear endedYear ended
31 December 201331 December 201331 December 201331 December 2013 31 December 201231 December 201231 December 201231 December 2012 31 December 201331 December 201331 December 201331 December 2013 31 December 201231 December 201231 December 201231 December 2012 31 December 201331 December 201331 December 201331 December 2013
EUREUREUREUR EUREUREUREUR
USDUSDUSDUSD
USDUSDUSDUSD
USDUSDUSDUSD
RBC IS, Luxembourg
15,964,743 45,773,082
12,923,020
14,943,228
3,726,558
15,964,743 15,964,743 15,964,743 15,964,743 45,773,082 45,773,082 45,773,082 45,773,082
12,923,020 12,923,020 12,923,020 12,923,020
14,943,228 14,943,228 14,943,228 14,943,228
3,726,558 3,726,558 3,726,558 3,726,558
Asia Alpha Plus IIAsia Alpha Plus IIAsia Alpha Plus IIAsia Alpha Plus II Feeder FundFeeder FundFeeder FundFeeder Fund
Asia Alpha Plus IIAsia Alpha Plus IIAsia Alpha Plus IIAsia Alpha Plus II Feeder FundFeeder FundFeeder FundFeeder Fund
TotalTotalTotalTotal TotalTotalTotalTotal
As atAs atAs atAs at As atAs atAs atAs at
As atAs atAs atAs at As atAs atAs atAs at
31 December 201331 December 201331 December 201331 December 2013 31 December 201231 December 201231 December 201231 December 2012 31 31 31 31 December 2013December 2013December 2013December 2013 31 December 201231 December 201231 December 201231 December 2012
USDUSDUSDUSD USDUSDUSDUSD
EUREUREUREUR EUREUREUREUR
RBC IS, Luxembourg
398,381 4,432,846
28,336,788 60,469,834
398,381 398,381 398,381 398,381 4,432,846 4,432,846 4,432,846 4,432,846
28,336,788 28,336,788 28,336,788 28,336,788 60,469,834 60,469,834 60,469,834 60,469,834

CB RICHARD ELLIS REAL ESTATE FUND OF FUNDS CB RICHARD ELLIS REAL ESTATE FUND OF FUNDS CB RICHARD ELLIS REAL ESTATE FUND OF FUNDS CB RICHARD ELLIS REAL ESTATE FUND OF FUNDS PUBLIC LIMITED COMPANYPUBLIC LIMITED COMPANYPUBLIC LIMITED COMPANYPUBLIC LIMITED COMPANY Annual report for the year ended 31 DecemberAnnual report for the year ended 31 DecemberAnnual report for the year ended 31 DecemberAnnual report for the year ended 31 December 2013201320132013 Notes to the Notes to the Notes to the Notes to the FFFFinancial Statements inancial Statements inancial Statements inancial Statements (Continued)(Continued)(Continued)(Continued)
Page 57
5555 Investment Management and Performance FeeInvestment Management and Performance FeeInvestment Management and Performance FeeInvestment Management and Performance Fee CB Richard Ellis Europe (exCB Richard Ellis Europe (exCB Richard Ellis Europe (exCB Richard Ellis Europe (ex----UK) Alpha FundUK) Alpha FundUK) Alpha FundUK) Alpha Fund
CB Richard Ellis Europe (ex----UK) Alpha Fund pays 0.40% per annum of the NAV of the Class B (EUR) shares, Class B (GBP Hedged) and Class B (GBP Unhedged) shares, subject to a minimum quarterly fee of EUR 50,000 to the Investment Manager, which accrues quarterly and is payable quarterly in arrears out of the assets of the Sub-Fund. CB Richard CB Richard CB Richard CB Richard Ellis Asia Alpha Plus FundEllis Asia Alpha Plus FundEllis Asia Alpha Plus FundEllis Asia Alpha Plus Fund
CB Richard Ellis Asia Alpha Plus Fund pays to the Investment Manager a fee of 0.50% on the invested equity in respect of the Class B (USD) shares of the Sub-Fund, subject to a minimum quarterly investment management fee of 0.10% of the commitment to the Investment Manager. The fee is calculated on the invested equity at each quarter-end, accrues quarterly and is payable quarterly in arrears out of the assets of the Sub-Fund. No investment management fee or any other fee is payable in respect of the Class I (USD) shares.
As further explained in the prospectus, CB Richard Ellis Asia Alpha Plus Fund pays a performance fee of 10% of
the excess of the Internal Rate of Return over the Hurdle of 10% per annum. Attributable Performance shall be paid to the Class I (USD) Shareholders as a distribution or directly to the Investment Manager or an affiliate company as an incentive fee or a combination of both, where at any Calculation Date (date on which Distributable Cash Flow is received by the Sub-Fund), the Internal Rate of Return exceeds the Hurdle. CBRE GMM Asia Alpha Plus Fund IIICBRE GMM Asia Alpha Plus Fund IIICBRE GMM Asia Alpha Plus Fund IIICBRE GMM Asia Alpha Plus Fund III The Investment Manager is entitled to a fee of 0.80% per annum of the invested equity relevant to all shares other than Class M (USD) shares and Class I (USD) shares, based on the NAV of the Sub-Fund and any amounts which have been committed by the Sub-Fund, but not yet called, in relation to any Investment. The fee accrues quarterly and is payable quarterly in arrears out of the assets of the Sub-Fund. As further explained in the prospectus, CB Richard Ellis Asia Alpha Plus Fund pays a performance fee of 15% of the excess of the Internal Rate of Return over the Hurdle of 10% per annum. Attributable Performance shall be paid to the Class I (USD) Shareholders as a distribution or directly to the Investment Manager or an affiliate company as an incentive fee or a combination of both, where at any Calculation Date (date on which Distributable Cash Flow is received by the Sub-Fund), the Internal Rate of Return exceeds the Hurdle. CB Richard Ellis Asia Alpha PlusCB Richard Ellis Asia Alpha PlusCB Richard Ellis Asia Alpha PlusCB Richard Ellis Asia Alpha Plus II FeederII FeederII FeederII Feeder FundFundFundFund The Feeder Fund pays no direct investment management fees and is not liable for any direct performance fees. The investment management fees charged at the Master Fund level is equal to 0.75% applied to (1) the net asset value of the Fund and (2) any amounts which have been committed, but not yet called, by the Master Fund to any Investment Fund. In addition, the Master Fund is liable for a performance fee which shall be equal to 10% of the profits realised by it above a 10% cumulative preferred return.

CB RICHARD ELLIS REAL ESTATE FUND OF FUNDS CB RICHARD ELLIS REAL ESTATE FUND OF FUNDS CB RICHARD ELLIS REAL ESTATE FUND OF FUNDS CB RICHARD ELLIS REAL ESTATE FUND OF FUNDS PUBLIC LIMITED COMPANYPUBLIC LIMITED COMPANYPUBLIC LIMITED COMPANYPUBLIC LIMITED COMPANY Annual report for the year ended 31 DecemberAnnual report for the year ended 31 DecemberAnnual report for the year ended 31 DecemberAnnual report for the year ended 31 December 2013201320132013 Notes to the Notes to the Notes to the Notes to the FFFFinancial Statements inancial Statements inancial Statements inancial Statements (Continued)(Continued)(Continued)(Continued)
Page 58
6666 Administrative Administrative Administrative Administrative and Custodian Feesand Custodian Feesand Custodian Feesand Custodian Fees Administrative Administrative Administrative Administrative FeesFeesFeesFees
CB Richard Ellis Europe (ex-UK) Alpha Fund and CB Richard Ellis Asia Alpha Plus Fund The Administrator is entitled to a fee, payable out of the assets of each of the Sub----Funds, at a rate of 0.025% per annum, up to and including the first EUR 100 million (or USD equivalent) of the NAV of the Sub----Fund concerned and in respect of any excess thereafter, at a rate of 0.0175% per annum of the NAV of the Sub----Fund which accrues quarterly and is payable quarterly in arrears. In addition Asia Alpha Plus Fund is charged a quarterly fee of EUR 5,000 (or USD equivalent) for reporting purposes and also a quarterly fee of EUR 2,500 (or USD equivalent) for performance fee calculation while the Alpha Fund is charged a quarterly fee of EUR 5,000 for reporting purposes. The Administrator is also entitled to be reimbursed for all out of pocket expenses properly incurred by it in the performance of its duties and responsibilities under the Administration Agreement. CBRE GMM Asia Alpha Plus Fund III The Administrator is entitled to a fee, payable out of the assets of the Sub-Fund, at a rate of 0.025% per annum, up to and including the first EUR 100 million (or USD equivalent) of the NAV of the Sub-Fund and in respect of any excess thereafter, at a rate of 0.0175% per annum of the NAV of the Sub-Fund, subject to a minimum annual fee of EUR 16,000, which shall accrue quarterly and be payable quarterly in arrears. In addition the Sub-Fund is charged a quarterly fee of EUR 5,000 (or USD equivalent) for reporting purposes. CB Richard Ellis Asia Alpha Plus II Feeder Fund The Administrator is entitled to a fee, payable out of the assets of the Sub-Fund, at a rate of 0.045% per annum of the Net Asset Value of the Sub-Fund, which accrues quarterly and is payable quarterly in arrears. The Administrator is also entitled to be reimbursed for all out of pocket expenses properly incurred by it in the performance of its duties and responsibilities under the Administration Agreement. Custodian FeesCustodian FeesCustodian FeesCustodian Fees
The Custodian is entitled to a fee of 0.015% per annum of the NAV for CB Richard Ellis Europe (ex-UK) Alpha Fund and CB Richard Ellis Asia Alpha Plus Fund and to a fee of 0.030% per annum of the NAV for CBRE GMM Asia Alpha Plus Fund III and CB Richard Ellis Asia Alpha Plus II Feeder Fund. The fee accrues quarterly and is payable quarterly in arrears out of assets of each of the Sub----Funds. The Custodian is also entitled to be reimbursed for all agreed transaction fees and out of pocket expenses properly incurred by it in the performance of its duties and responsibilities under the Custodian Agreement. The Custodian also charges third party transaction fees and sub-custodian fees and charges at normal commercial rates. All such fees and expenses are borne by each of the Sub----Funds.

CB RICHARD ELLIS REAL ESTATE FUND OF FUNDS CB RICHARD ELLIS REAL ESTATE FUND OF FUNDS CB RICHARD ELLIS REAL ESTATE FUND OF FUNDS CB RICHARD ELLIS REAL ESTATE FUND OF FUNDS PUBLIC LIMITED COMPANYPUBLIC LIMITED COMPANYPUBLIC LIMITED COMPANYPUBLIC LIMITED COMPANY Annual report for the year ended 31 DecemberAnnual report for the year ended 31 DecemberAnnual report for the year ended 31 DecemberAnnual report for the year ended 31 December 2013201320132013 Notes to the Notes to the Notes to the Notes to the FFFFinancial Statements inancial Statements inancial Statements inancial Statements (Continued)(Continued)(Continued)(Continued)
Page 59
7777 DDDDirectors’ Feesirectors’ Feesirectors’ Feesirectors’ Fees
Each independent Director is entitled to a fee and remuneration for their services in respect of the Company at a rate determined from time to time by the Directors. The fees of any independent Director in any accounting period shall not exceed EUR 30,000 (or USD equivalent) without the approval of the Board. In addition, all Directors are also entitled to be reimbursed for their reasonable out of pocket expenses incurred in discharging their duties as Directors. The aggregate emoluments of the Directors (including expenses) for year ended 31 December 2013 was EUR 35,760 (31 December 2012: EUR 42,890) of which EUR 9,238 was outstanding at the year ended (31 December 2012: EUR 19,247). 8888 Subscription FeesSubscription FeesSubscription FeesSubscription Fees CB Richard Ellis Europe (ex-UK) Alpha Fund and CB Richard Ellis Asia Alpha Plus Fund No subscription fees are charged as both funds are closed for new investors. CBRE GMM Asia Alpha Plus Fund III No subscription fees are charged on Shares in the Sub-Fund. CB Richard Ellis Asia Alpha Plus II Feeder Fund No subscription fees are charged on Shares in the Sub-Fund. 9999 TrusteeTrusteeTrusteeTrustee FeesFeesFeesFees The Custodian also acts as Trustee of the Company. Accordingly, the Custodian is entitled to a trustee fee of 0.015% per annum of the NAV of each of the Sub-Funds which accrues quarterly and is payable quarterly in arrears out of assets of each of the Sub----Funds. 10101010 OtOtOtOther Feesher Feesher Feesher Fees The Company also pays fees in respect of the publication and circulation of details of the NAV per Redeemable Participating Share, stamp duties, taxes, brokerage, the fees and expenses of auditors, tax, legal and other professional advisers.

CB RICHARD ELLIS REAL ESTATE FUND OF FUNDS CB RICHARD ELLIS REAL ESTATE FUND OF FUNDS CB RICHARD ELLIS REAL ESTATE FUND OF FUNDS CB RICHARD ELLIS REAL ESTATE FUND OF FUNDS PUBLIC LIMITED COMPANYPUBLIC LIMITED COMPANYPUBLIC LIMITED COMPANYPUBLIC LIMITED COMPANY Annual report for the year ended 31 DecemberAnnual report for the year ended 31 DecemberAnnual report for the year ended 31 DecemberAnnual report for the year ended 31 December 2013201320132013 Notes to the Notes to the Notes to the Notes to the FFFFinancial Statements inancial Statements inancial Statements inancial Statements (Continued)(Continued)(Continued)(Continued)
Page 60
11111111 Interest IncomeInterest IncomeInterest IncomeInterest Income
Alpha FundAlpha FundAlpha FundAlpha Fund Alpha FundAlpha FundAlpha FundAlpha Fund
Asia Asia Asia Asia Alpha PlusAlpha PlusAlpha PlusAlpha Plus FundFundFundFund
Asia Alpha PlusAsia Alpha PlusAsia Alpha PlusAsia Alpha Plus FundFundFundFund Asia Alpha Plus Fund IIIAsia Alpha Plus Fund IIIAsia Alpha Plus Fund IIIAsia Alpha Plus Fund III
Year endedYear endedYear endedYear ended Year endedYear endedYear endedYear ended Year endedYear endedYear endedYear ended Year endedYear endedYear endedYear ended Year endedYear endedYear endedYear ended
31 December 201331 December 201331 December 201331 December 2013 31 December 201231 December 201231 December 201231 December 2012 31 December 201331 December 201331 December 201331 December 2013 31 December 201231 December 201231 December 201231 December 2012 31 December 201331 December 201331 December 201331 December 2013
EUREUREUREUR EUREUREUREUR USDUSDUSDUSD USDUSDUSDUSD EUREUREUREUR
Interest income arises from:
Cash and bank balances
- - 16,879 8,076 321
---- ---- 16,87916,87916,87916,879 8,0768,0768,0768,076 321321321321
Asia Alpha Plus IIAsia Alpha Plus IIAsia Alpha Plus IIAsia Alpha Plus II Feeder FundFeeder FundFeeder FundFeeder Fund
Asia Alpha Plus IIAsia Alpha Plus IIAsia Alpha Plus IIAsia Alpha Plus II Feeder FundFeeder FundFeeder FundFeeder Fund TotalTotalTotalTotal TotalTotalTotalTotal
Year endedYear endedYear endedYear ended Year endedYear endedYear endedYear ended Year endedYear endedYear endedYear ended Year endedYear endedYear endedYear ended
31 December 201331 December 201331 December 201331 December 2013 31 December 201231 December 201231 December 201231 December 2012 31 December 31 December 31 December 31 December 2013201320132013 31 December 201231 December 201231 December 201231 December 2012
USDUSDUSDUSD USDUSDUSDUSD EUREUREUREUR EUREUREUREUR
Interest income arises from:
Cash and bank balances
- - 12,957 6,286
---- ---- 12,95712,95712,95712,957 6,2866,2866,2866,286

CB RICHARD ELLIS REAL ESTATE FUND OF FUNDS CB RICHARD ELLIS REAL ESTATE FUND OF FUNDS CB RICHARD ELLIS REAL ESTATE FUND OF FUNDS CB RICHARD ELLIS REAL ESTATE FUND OF FUNDS PUBLIC LIMITED COMPANYPUBLIC LIMITED COMPANYPUBLIC LIMITED COMPANYPUBLIC LIMITED COMPANY Annual report for the year ended 31 DecemberAnnual report for the year ended 31 DecemberAnnual report for the year ended 31 DecemberAnnual report for the year ended 31 December 2013201320132013 Notes to the Notes to the Notes to the Notes to the FFFFinancial Statements inancial Statements inancial Statements inancial Statements (Continued)(Continued)(Continued)(Continued)
Page 61
12121212 Debtors Debtors Debtors Debtors ---- Amounts falling due within one yearAmounts falling due within one yearAmounts falling due within one yearAmounts falling due within one year
Alpha FundAlpha FundAlpha FundAlpha Fund Alpha FundAlpha FundAlpha FundAlpha Fund
Asia Alpha PlusAsia Alpha PlusAsia Alpha PlusAsia Alpha Plus FundFundFundFund
Asia Alpha PlusAsia Alpha PlusAsia Alpha PlusAsia Alpha Plus FundFundFundFund
Asia Alpha Plus Asia Alpha Plus Asia Alpha Plus Asia Alpha Plus Fund IIIFund IIIFund IIIFund III
As atAs atAs atAs at As atAs atAs atAs at
As atAs atAs atAs at
As atAs atAs atAs at
Year endedYear endedYear endedYear ended
31 December 201331 December 201331 December 201331 December 2013 31 December 201231 December 201231 December 201231 December 2012
31 December 201331 December 201331 December 201331 December 2013
31 December 201231 December 201231 December 201231 December 2012
31 December 201331 December 201331 December 201331 December 2013
EUREUREUREUR EUREUREUREUR
USDUSDUSDUSD
USDUSDUSDUSD
USDUSDUSDUSD
Dividends receivable
997,644 361,588
444,037
2,151,185
-
Receivable on subscriptions
- -
-
19,581
31,418
Receivable on sales/redemption of investee funds*
2,177,265 -
-
-
231,863
Other debtors
50,446 66,780
-
296
-
3,23,23,23,225252525,,,,355355355355 428,368 428,368 428,368 428,368
444,037444,037444,037444,037
2,171,062 2,171,062 2,171,062 2,171,062
263,28263,28263,28263,281111
* The amounts owed to CB Richard Ellis Europe (ex-UK) Alpha Fund relate to a return of capital from Stam Rei III
Asia Alpha Plus IIAsia Alpha Plus IIAsia Alpha Plus IIAsia Alpha Plus II Feeder FundFeeder FundFeeder FundFeeder Fund
Asia Alpha Plus IIAsia Alpha Plus IIAsia Alpha Plus IIAsia Alpha Plus II Feeder FundFeeder FundFeeder FundFeeder Fund
TotalTotalTotalTotal TotalTotalTotalTotal
As atAs atAs atAs at As atAs atAs atAs at
As atAs atAs atAs at As atAs atAs atAs at
31 December 201331 December 201331 December 201331 December 2013 31 December 201231 December 201231 December 201231 December 2012
31 December 201331 December 201331 December 201331 December 2013 31 December 201231 December 201231 December 201231 December 2012
USDUSDUSDUSD USDUSDUSDUSD
EUREUREUREUR EUREUREUREUR
Restated*Restated*Restated*Restated*
Restated*Restated*Restated*Restated*
Dividends receivable
- 1,029,951
1,319,891 2,774,480
Receivables on subscriptions
- -
22,801 14,852
Receivables on sales/redemption in respect of units/ shares held in investee funds
- -
2,345,533 -
Other debtors
6,229 27,704
54,965 88,018
6,2296,2296,2296,229 1,057,655 1,057,655 1,057,655 1,057,655
3,743,1903,743,1903,743,1903,743,190 2,877,350 2,877,350 2,877,350 2,877,350
* See Note 19

CB RICHARD ELLIS REAL ESTATE FUND OF FUNDS CB RICHARD ELLIS REAL ESTATE FUND OF FUNDS CB RICHARD ELLIS REAL ESTATE FUND OF FUNDS CB RICHARD ELLIS REAL ESTATE FUND OF FUNDS PUBLIC LIMITED COMPANYPUBLIC LIMITED COMPANYPUBLIC LIMITED COMPANYPUBLIC LIMITED COMPANY Annual report for the year ended 31 DecemberAnnual report for the year ended 31 DecemberAnnual report for the year ended 31 DecemberAnnual report for the year ended 31 December 2013201320132013 Notes to the Notes to the Notes to the Notes to the FFFFinancial Statements inancial Statements inancial Statements inancial Statements (Continued)(Continued)(Continued)(Continued)
Page 62
13131313 CreditorsCreditorsCreditorsCreditors
Alpha FundAlpha FundAlpha FundAlpha Fund Alpha FundAlpha FundAlpha FundAlpha Fund
Asia Alpha PlusAsia Alpha PlusAsia Alpha PlusAsia Alpha Plus FundFundFundFund
Asia Alpha PlusAsia Alpha PlusAsia Alpha PlusAsia Alpha Plus FundFundFundFund
Asia Alpha Plus Fund Asia Alpha Plus Fund Asia Alpha Plus Fund Asia Alpha Plus Fund IIIIIIIIIIII
As atAs atAs atAs at As atAs atAs atAs at
As atAs atAs atAs at
As atAs atAs atAs at
Year endedYear endedYear endedYear ended
31 December 201331 December 201331 December 201331 December 2013 31 December 201231 December 201231 December 201231 December 2012
31 December 201331 December 201331 December 201331 December 2013
31 December 201231 December 201231 December 201231 December 2012
31 December 31 December 31 December 31 December 2013201320132013
EUREUREUREUR EUREUREUREUR
USDUSDUSDUSD
USDUSDUSDUSD
USDUSDUSDUSD
Amounts falling due within one year:Amounts falling due within one year:Amounts falling due within one year:Amounts falling due within one year:
Payable on redemptions
- 11,069,829
-
5,126,077
-
Investment management fees 610,319 710,785 485,625 655,940 323,270
Trustee fees 35,243 41,095 19,856 26,857 -
Legal fees
89,092 11,047
60,500
9,579
8,294
Organisational expenses
- -
-
-
-
Fund administration fees
86,984 99,665
67,996
81,284
48,267
Directors' fees
7,083 12,400
2,539
9,027
430
Audit fees
19,065 13,374
25,169
17,456
21,355
Transaction fees
- 57,161
-
-
-
Transfer agent fees
- -
-
-
-
Listing expenses payable
- -
-
-
-
Professional expenses
1,313 1,688
2,325
15,573
1,033
Dividends payable
- 305,216
-
4,159,096
-
Other creditors
59,691 82,781
77,769
121,927
2,039
Amounts falling due greater than one year:Amounts falling due greater than one year:Amounts falling due greater than one year:Amounts falling due greater than one year:
Performance fees
- -
2,815,553
2,072,842
388,231
908908908908,,,,790790790790 12,405,04112,405,04112,405,04112,405,041
3,5573,5573,5573,557,,,,332332332332
12,295,65812,295,65812,295,65812,295,658
792792792792,,,,919919919919

CB RICHARD ELLIS REAL ESTATE FUND OF FUNDS CB RICHARD ELLIS REAL ESTATE FUND OF FUNDS CB RICHARD ELLIS REAL ESTATE FUND OF FUNDS CB RICHARD ELLIS REAL ESTATE FUND OF FUNDS PUBLIC LIMITED COMPANYPUBLIC LIMITED COMPANYPUBLIC LIMITED COMPANYPUBLIC LIMITED COMPANY Annual report for the year ended 31 DecemberAnnual report for the year ended 31 DecemberAnnual report for the year ended 31 DecemberAnnual report for the year ended 31 December 2013201320132013 Notes to the Notes to the Notes to the Notes to the FFFFinancial Statements inancial Statements inancial Statements inancial Statements (Continued)(Continued)(Continued)(Continued)
Page 63
13131313 Creditors (Continued)Creditors (Continued)Creditors (Continued)Creditors (Continued)
Asia Alpha Plus IIAsia Alpha Plus IIAsia Alpha Plus IIAsia Alpha Plus II Feeder FundFeeder FundFeeder FundFeeder Fund
Asia Alpha Plus IIAsia Alpha Plus IIAsia Alpha Plus IIAsia Alpha Plus II Feeder FundFeeder FundFeeder FundFeeder Fund
TotalTotalTotalTotal TotalTotalTotalTotal
As atAs atAs atAs at As atAs atAs atAs at
As atAs atAs atAs at As atAs atAs atAs at
31 December 201331 December 201331 December 201331 December 2013 31 December 201231 December 201231 December 201231 December 2012
31 December 201331 December 201331 December 201331 December 2013 31 31 31 31 December 2012December 2012December 2012December 2012
USDUSDUSDUSD USDUSDUSDUSD
EUREUREUREUR EUREUREUREUR
RestatedRestatedRestatedRestated****
RestatedRestatedRestatedRestated****
Amounts falling due within one year:Amounts falling due within one year:Amounts falling due within one year:Amounts falling due within one year:
Payable on redemptions
- -
- 14,957,958
Investment management fees
- - 1,197,350 1,208,315
Trustee fees
25,779 19,721 68,361 76,424
Legal fees
- -
139,017 18,313
Organisational expenses
- -
- -
Fund administration fees
51,433 34,297
208,684 187,333
Directors' fees
- -
9,238 19,247
Audit fees
11,864 7,641
61,438 32,410
Transaction fees
- -
- 57,161
Transfer agent fees
- -
- -
Listing expenses payable
- -
- -
Professional expenses
- -
3,750 13,500
Dividends payable
- 3,397,884
- 6,037,186
Redemptions payable
- 1,883,909
117,609 1,428,945
Other creditors
2,022 18,528
1,469 189,317
Amounts falling due greater than one year:Amounts falling due greater than one year:Amounts falling due greater than one year:Amounts falling due greater than one year:
Performance fees
- -
2,325,050 1,572,251
99991111,,,,098098098098 5,361,9805,361,9805,361,9805,361,980
4444,,,,131313131111,,,,966966966966 25,798,36025,798,36025,798,36025,798,360
* See Note 19
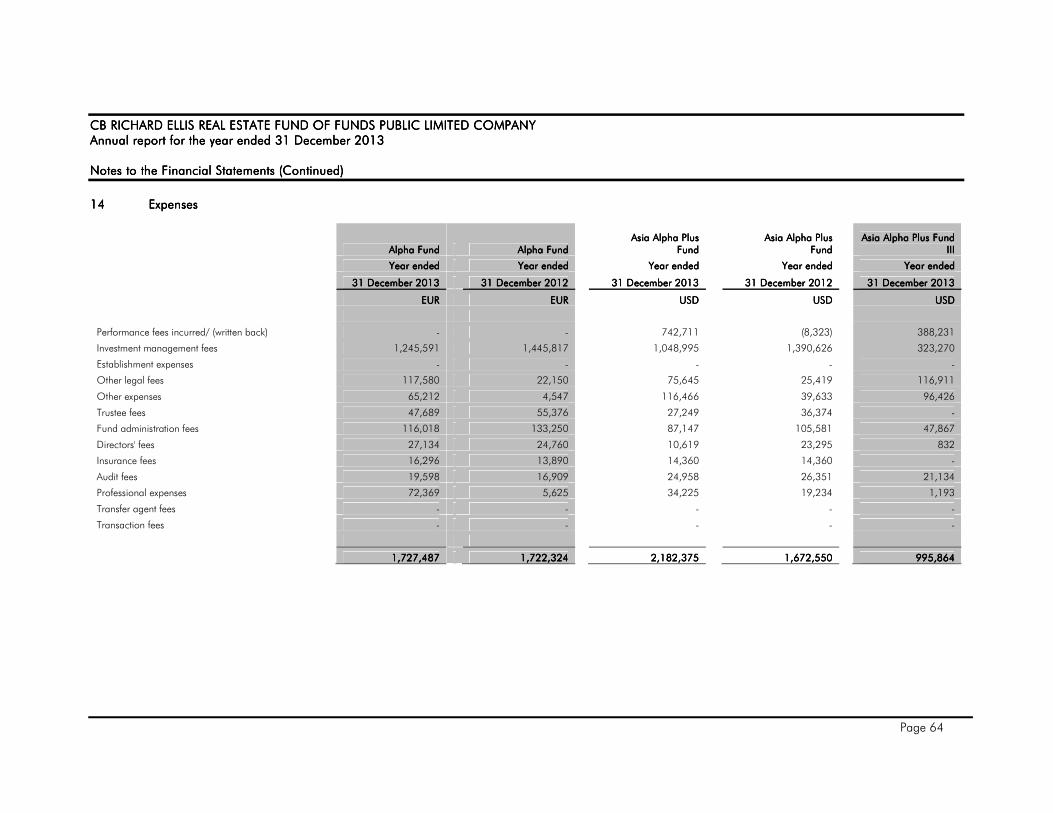
CB RICHARD ELLIS REAL ESTATE FUND OF FUNDS CB RICHARD ELLIS REAL ESTATE FUND OF FUNDS CB RICHARD ELLIS REAL ESTATE FUND OF FUNDS CB RICHARD ELLIS REAL ESTATE FUND OF FUNDS PUBLIC LIMITED COMPANYPUBLIC LIMITED COMPANYPUBLIC LIMITED COMPANYPUBLIC LIMITED COMPANY Annual report for the year ended 31 DecemberAnnual report for the year ended 31 DecemberAnnual report for the year ended 31 DecemberAnnual report for the year ended 31 December 2013201320132013 Notes to the Notes to the Notes to the Notes to the FFFFinancial Statements inancial Statements inancial Statements inancial Statements (Continued)(Continued)(Continued)(Continued)
Page 64
14141414 ExpensesExpensesExpensesExpenses
Alpha FundAlpha FundAlpha FundAlpha Fund Alpha FundAlpha FundAlpha FundAlpha Fund
Asia Alpha PlusAsia Alpha PlusAsia Alpha PlusAsia Alpha Plus FundFundFundFund
Asia Alpha PlusAsia Alpha PlusAsia Alpha PlusAsia Alpha Plus FundFundFundFund
Asia Alpha Plus Fund Asia Alpha Plus Fund Asia Alpha Plus Fund Asia Alpha Plus Fund IIIIIIIIIIII
Year endedYear endedYear endedYear ended Year endedYear endedYear endedYear ended
Year endedYear endedYear endedYear ended Year endedYear endedYear endedYear ended
Year endedYear endedYear endedYear ended
31 December 201331 December 201331 December 201331 December 2013 31 December 201231 December 201231 December 201231 December 2012
31 December 201331 December 201331 December 201331 December 2013 31 December 201231 December 201231 December 201231 December 2012
31 December 201331 December 201331 December 201331 December 2013
EUREUREUREUR EUREUREUREUR
USDUSDUSDUSD
USDUSDUSDUSD
USDUSDUSDUSD
Performance fees incurred/ (written back)
- -
742,711
(8,323)
388,231
Investment management fees
1,245,591 1,445,817
1,048,995
1,390,626
323,270
Establishment expenses
- -
-
-
-
Other legal fees
117,580 22,150
75,645
25,419
116,911
Other expenses
65,212 4,547
116,466
39,633
96,426
Trustee fees
47,689 55,376
27,249
36,374
-
Fund administration fees
116,018 133,250
87,147
105,581
47,867
Directors' fees
27,134 24,760
10,619
23,295
832
Insurance fees
16,296 13,890
14,360
14,360
-
Audit fees
19,598 16,909
24,958
26,351
21,134
Professional expenses
72,369 5,625
34,225
19,234
1,193
Transfer agent fees
- -
-
-
-
Transaction fees
- -
-
-
-
1,727,481,727,481,727,481,727,487777 1,722,324 1,722,324 1,722,324 1,722,324
2,182,375 2,182,375 2,182,375 2,182,375
1,672,550 1,672,550 1,672,550 1,672,550
995,864 995,864 995,864 995,864

CB RICHARD ELLIS REAL ESTATE FUND OF FUNDS CB RICHARD ELLIS REAL ESTATE FUND OF FUNDS CB RICHARD ELLIS REAL ESTATE FUND OF FUNDS CB RICHARD ELLIS REAL ESTATE FUND OF FUNDS PUBLIC LIMITED COMPANYPUBLIC LIMITED COMPANYPUBLIC LIMITED COMPANYPUBLIC LIMITED COMPANY Annual report for the year ended 31 DecemberAnnual report for the year ended 31 DecemberAnnual report for the year ended 31 DecemberAnnual report for the year ended 31 December 2013201320132013 Notes to the Notes to the Notes to the Notes to the FFFFinancial Statements inancial Statements inancial Statements inancial Statements (Continued)(Continued)(Continued)(Continued)
Page 65
14 14 14 14 Expenses (Continued)Expenses (Continued)Expenses (Continued)Expenses (Continued)
Asia Alpha Plus IIAsia Alpha Plus IIAsia Alpha Plus IIAsia Alpha Plus II Feeder FundFeeder FundFeeder FundFeeder Fund
Asia Alpha Plus IIAsia Alpha Plus IIAsia Alpha Plus IIAsia Alpha Plus II Feeder FundFeeder FundFeeder FundFeeder Fund
TotalTotalTotalTotal TotalTotalTotalTotal
As atAs atAs atAs at As atAs atAs atAs at
Year endedYear endedYear endedYear ended Year endedYear endedYear endedYear ended
31 December 201331 December 201331 December 201331 December 2013 31 December 201231 December 201231 December 201231 December 2012
31 31 31 31 December 2013December 2013December 2013December 2013 31 December 201231 December 201231 December 201231 December 2012
USDUSDUSDUSD USDUSDUSDUSD
EUREUREUREUR EUREUREUREUR
Performance fees incurred/ (written back)
- -
851,973 (6,478)
Investment management fees
- -
2,279,359 2,528,141
Establishment expenses
- 42,914
- 33,400
Other legal fees
- 1,797
262,638 43,332
Other expenses
4,810 584
229,213 35,850
Trustee fees
19,933 19,466
83,233 98,836
Fund administration fees
44,586 33,868
251,316 241,783
Directors' fees
- -
35,760 42,890
Insurance fees
- -
27,114 25,066
Audit fees
11,772 10,345
63,189 45,469
Professional expenses
- -
99,051 20,595
Transfer agent fees
- -
- -
Transaction fees
- -
- -
81818181,,,,101101101101 108,974 108,974 108,974 108,974
4,14,14,14,182828282,,,,846846846846 3,108,884 3,108,884 3,108,884 3,108,884
Fees and expenses paid to the statutory auditors, Deloitte & Touche, in respect of the financial year, relate entirely to the audit of the financial statements of the Company. There were no fees and expenses paid in respect of other assurance, tax advisory services or non-audit services provided by the auditors for the years ended 31 December 2013 or 31 December 2012.
Independent auditor’s fees charged for the year ended 31 December 2013 were EUR 50,450 excluding VAT (31 December 2012: EUR 36,350).

CB RICHARD ELLIS REAL ESTATE FUND OF FUNDS CB RICHARD ELLIS REAL ESTATE FUND OF FUNDS CB RICHARD ELLIS REAL ESTATE FUND OF FUNDS CB RICHARD ELLIS REAL ESTATE FUND OF FUNDS PUBLIC LIMITED COMPANYPUBLIC LIMITED COMPANYPUBLIC LIMITED COMPANYPUBLIC LIMITED COMPANY Annual report for the year ended 31 DecemberAnnual report for the year ended 31 DecemberAnnual report for the year ended 31 DecemberAnnual report for the year ended 31 December 2013201320132013 Notes to the Notes to the Notes to the Notes to the FFFFinancial Statements inancial Statements inancial Statements inancial Statements (Continued)(Continued)(Continued)(Continued)
Page 66
15151515 Company’s cCompany’s cCompany’s cCompany’s commitmentsommitmentsommitmentsommitments to Investee Fundsto Investee Fundsto Investee Fundsto Investee Funds
The Company entered into subscription agreements with the underlying funds it invested in. All underlying funds are commitment-based and the Company committed to contribute to the underlying funds each time a capital call is made. The amount of commitments is disclosed in the Statement of Investments. Each contribution is accounted for at original cost and its value is further revised to reflect the fair value of the underlying fund. 16161616 Share CapitalShare CapitalShare CapitalShare Capital The Company has an authorised share capital of 500,000,000,000 shares of no par value designated as unclassified shares. The shares issued have the following rights attached to them:
- on a vote taken on show of hands, be entitled to one vote per holder and, on a poll, be entitled to one vote per whole share;
- be entitled to such dividends as the Directors may from time to time declare; and - in the event of a winding up or dissolution of the Company, have the entitlements referred to under the
“Distribution of Assets on a Liquidation” as per the prospectus. CB Richard Ellis Europe (ex-UK) Alpha Fund CB Richard Ellis Europe (ex-UK) Alpha Fund may offer four classes of shares: the Class B (EUR) shares, the Class B (GBP Hedged) shares, the Class B (GBP Unhedged) shares and the Class I (EUR) shares. Class I (EUR) shares are not open to investors and are subject to the prior approval of the Board of Directors of the Company. To date only Class B (EUR), Class B (GBP Hedged) and Class B (GBP Unhedged) shares have been issued. The shares issued are not redeemable at the option of shareholders, until the first redemption day being the 31 December date immediately following 5 complete years from 24 April 2007 being the First Close. Redemptions are subject to a 6 months’ notice. As further detailed in the prospectus, redemptions will be reduced proportionately if aggregate redemption requests for a redemption day exceed 10% of the total number of shares issued. The payment of redemption proceeds, where applicable, is expected to occur within 6 months of the redemption day.

CB RICHARD ELLIS REAL ESTATE FUND OF FUNDS CB RICHARD ELLIS REAL ESTATE FUND OF FUNDS CB RICHARD ELLIS REAL ESTATE FUND OF FUNDS CB RICHARD ELLIS REAL ESTATE FUND OF FUNDS PUBLIC LIMITED COMPANYPUBLIC LIMITED COMPANYPUBLIC LIMITED COMPANYPUBLIC LIMITED COMPANY Annual report for the year ended 31 DecemberAnnual report for the year ended 31 DecemberAnnual report for the year ended 31 DecemberAnnual report for the year ended 31 December 2013201320132013 Notes to the Notes to the Notes to the Notes to the FFFFinancial Statements inancial Statements inancial Statements inancial Statements (Continued)(Continued)(Continued)(Continued)
Page 67
16161616 Share CapitalShare CapitalShare CapitalShare Capital (Continued)(Continued)(Continued)(Continued) For the year ended 31 December 2013, movement in participating shares was as follows:
CB Richard Ellis Europe (exCB Richard Ellis Europe (exCB Richard Ellis Europe (exCB Richard Ellis Europe (ex----UK) Alpha FundUK) Alpha FundUK) Alpha FundUK) Alpha Fund
CLASS B (EURCLASS B (EURCLASS B (EURCLASS B (EUR) SHARES) SHARES) SHARES) SHARES Number of SharesNumber of SharesNumber of SharesNumber of Shares Subscription ValueSubscription ValueSubscription ValueSubscription Value
EUREUREUREUR
As at 1 January 2013 480,876 46,600,208
Capital issued - -
Capital redeemed ---- (1,108,392)
As at 31 December 2013 480,876480,876480,876480,876 45,491,81645,491,81645,491,81645,491,816
CLASS B (GBP HEDGED) SHARESCLASS B (GBP HEDGED) SHARESCLASS B (GBP HEDGED) SHARESCLASS B (GBP HEDGED) SHARES Number of SharesNumber of SharesNumber of SharesNumber of Shares Subscription ValueSubscription ValueSubscription ValueSubscription Value Subscription ValueSubscription ValueSubscription ValueSubscription Value
GBPGBPGBPGBP EUREUREUREUR
As at 1 January 2013 2,286,762 224,538,809 312,235,317
Capital issued - - -
Capital redeemed (339) (5,243,609) (6,299,335)
As at 31 December 2013 2,286,4232,286,4232,286,4232,286,423 222219191919,,,,295295295295,,,,200200200200 305,935,982305,935,982305,935,982305,935,982
CLASS B (GBP UNHEDGED) SHARESCLASS B (GBP UNHEDGED) SHARESCLASS B (GBP UNHEDGED) SHARESCLASS B (GBP UNHEDGED) SHARES Number of SharesNumber of SharesNumber of SharesNumber of Shares Subscription ValueSubscription ValueSubscription ValueSubscription Value Subscription ValueSubscription ValueSubscription ValueSubscription Value
GBPGBPGBPGBP EUREUREUREUR
As at 1 January 2013 1,011,515 95,216,532 115,967,807
Capital issued - - -
Capital redeemed (346) (2,212,016) (2,653,502)
As at 31 December 2013 1,011,1691,011,1691,011,1691,011,169 93939393,,,,004004004004,,,,516516516516 113,314,305113,314,305113,314,305113,314,305
For the year ended 31 December 2012, movement in participating shares was as follows:
CB Richard Ellis Europe (exCB Richard Ellis Europe (exCB Richard Ellis Europe (exCB Richard Ellis Europe (ex----UK) Alpha FundUK) Alpha FundUK) Alpha FundUK) Alpha Fund
CLASS B (EURCLASS B (EURCLASS B (EURCLASS B (EUR) SHARES) SHARES) SHARES) SHARES Number of SharesNumber of SharesNumber of SharesNumber of Shares Subscription ValueSubscription ValueSubscription ValueSubscription Value
EUREUREUREUR
As at 1 January 2012 480,876 47,788,752
Capital issued - -
Capital redeemed ---- (1,188,544)
As at 31 December 2012 480,876480,876480,876480,876 44446666,,,,600600600600,,,,202020208888
CLASS B (GBP HEDGED) SHARESCLASS B (GBP HEDGED) SHARESCLASS B (GBP HEDGED) SHARESCLASS B (GBP HEDGED) SHARES Number of SharesNumber of SharesNumber of SharesNumber of Shares Subscription ValueSubscription ValueSubscription ValueSubscription Value Subscription ValueSubscription ValueSubscription ValueSubscription Value
GBPGBPGBPGBP EUREUREUREUR
As at 1 January 2012 2,286,762 230,270,407 319,302,028
Capital issued - - -
Capital redeemed ---- (5,731,598) (7,066,711)
As at 31 December 2012 2,286,7622,286,7622,286,7622,286,762 222224242424,,,,538538538538,,,,809809809809 313131312222,,,,235235235235,,,,317317317317
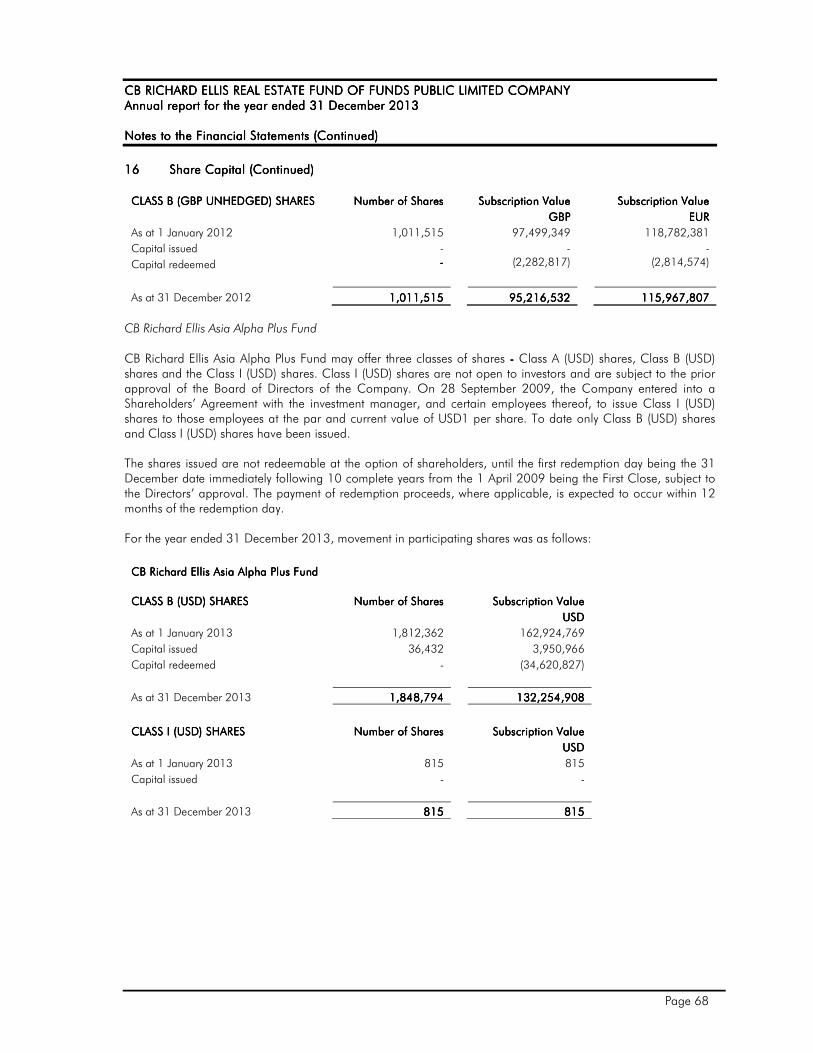
CB RICHARD ELLIS REAL ESTATE FUND OF FUNDS CB RICHARD ELLIS REAL ESTATE FUND OF FUNDS CB RICHARD ELLIS REAL ESTATE FUND OF FUNDS CB RICHARD ELLIS REAL ESTATE FUND OF FUNDS PUBLIC LIMITED COMPANYPUBLIC LIMITED COMPANYPUBLIC LIMITED COMPANYPUBLIC LIMITED COMPANY Annual report for the year ended 31 DecemberAnnual report for the year ended 31 DecemberAnnual report for the year ended 31 DecemberAnnual report for the year ended 31 December 2013201320132013 Notes to the Notes to the Notes to the Notes to the FFFFinancial Statements inancial Statements inancial Statements inancial Statements (Continued)(Continued)(Continued)(Continued)
Page 68
16161616 Share CapitalShare CapitalShare CapitalShare Capital (Continued)(Continued)(Continued)(Continued)
CLASS B (GBP UNHEDGED) SHARESCLASS B (GBP UNHEDGED) SHARESCLASS B (GBP UNHEDGED) SHARESCLASS B (GBP UNHEDGED) SHARES Number of SharesNumber of SharesNumber of SharesNumber of Shares Subscription ValueSubscription ValueSubscription ValueSubscription Value Subscription ValueSubscription ValueSubscription ValueSubscription Value
GBPGBPGBPGBP EUREUREUREUR
As at 1 January 2012 1,011,515 97,499,349 118,782,381
Capital issued - - -
Capital redeemed ---- (2,282,817) (2,814,574)
As at 31 December 2012 1,011,5151,011,5151,011,5151,011,515 99995555,,,,216216216216,,,,532532532532 115115115115,,,,967967967967,,,,807807807807
CB Richard Ellis Asia Alpha Plus Fund CB Richard Ellis Asia Alpha Plus Fund may offer three classes of shares ---- Class A (USD) shares, Class B (USD) shares and the Class I (USD) shares. Class I (USD) shares are not open to investors and are subject to the prior approval of the Board of Directors of the Company. On 28 September 2009, the Company entered into a Shareholders’ Agreement with the investment manager, and certain employees thereof, to issue Class I (USD) shares to those employees at the par and current value of USD1 per share. To date only Class B (USD) shares and Class I (USD) shares have been issued. The shares issued are not redeemable at the option of shareholders, until the first redemption day being the 31 December date immediately following 10 complete years from the 1 April 2009 being the First Close, subject to the Directors’ approval. The payment of redemption proceeds, where applicable, is expected to occur within 12 months of the redemption day. For the year ended 31 December 2013, movement in participating shares was as follows:
CB Richard Ellis Asia Alpha Plus FundCB Richard Ellis Asia Alpha Plus FundCB Richard Ellis Asia Alpha Plus FundCB Richard Ellis Asia Alpha Plus Fund
CLASS B (USD) CLASS B (USD) CLASS B (USD) CLASS B (USD) SHARESSHARESSHARESSHARES Number of SharesNumber of SharesNumber of SharesNumber of Shares Subscription ValueSubscription ValueSubscription ValueSubscription Value
USDUSDUSDUSD
As at 1 January 2013 1,812,362 162,924,769
Capital issued 36,432 3,950,966
Capital redeemed - (34,620,827)
As at 31 December 2013 1,848,7941,848,7941,848,7941,848,794 132,254,908132,254,908132,254,908132,254,908
CLASS I (USD) SHARESCLASS I (USD) SHARESCLASS I (USD) SHARESCLASS I (USD) SHARES Number of Number of Number of Number of SharesSharesSharesShares Subscription ValueSubscription ValueSubscription ValueSubscription Value
USDUSDUSDUSD
As at 1 January 2013 815 815
Capital issued - -
As at 31 December 2013 815815815815
815815815815
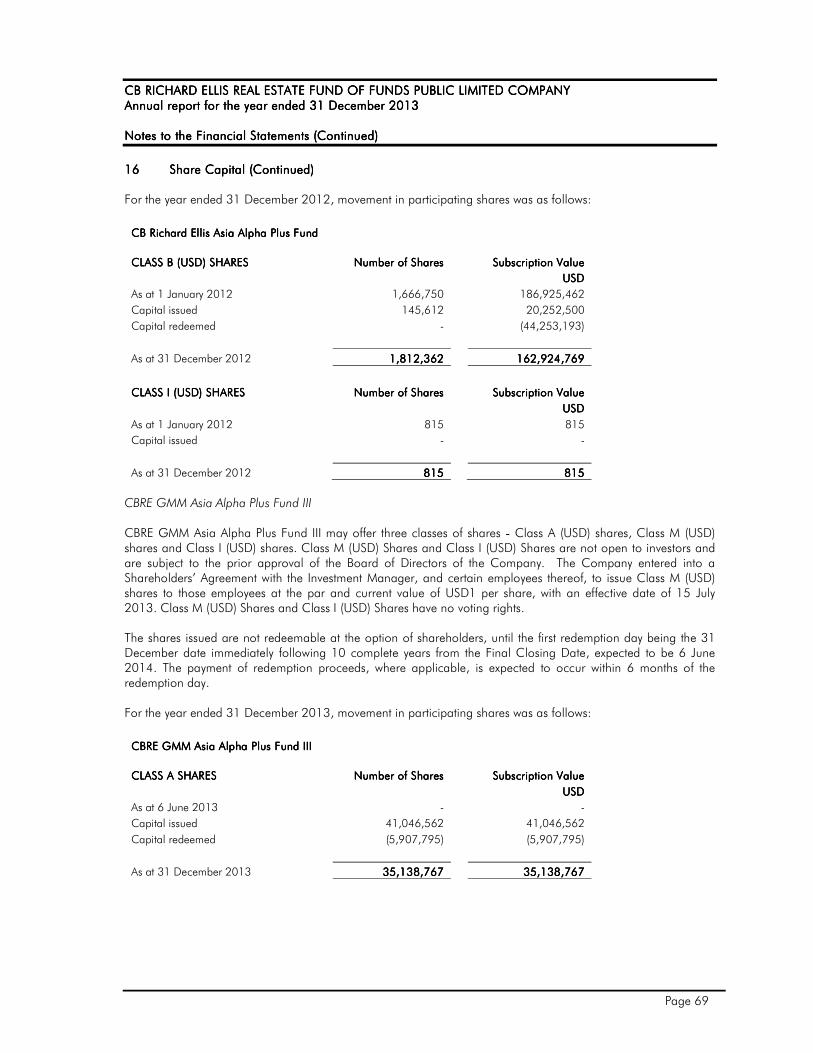
CB RICHARD ELLIS REAL ESTATE FUND OF FUNDS CB RICHARD ELLIS REAL ESTATE FUND OF FUNDS CB RICHARD ELLIS REAL ESTATE FUND OF FUNDS CB RICHARD ELLIS REAL ESTATE FUND OF FUNDS PUBLIC LIMITED COMPANYPUBLIC LIMITED COMPANYPUBLIC LIMITED COMPANYPUBLIC LIMITED COMPANY Annual report for the year ended 31 DecemberAnnual report for the year ended 31 DecemberAnnual report for the year ended 31 DecemberAnnual report for the year ended 31 December 2013201320132013 Notes to the Notes to the Notes to the Notes to the FFFFinancial Statements inancial Statements inancial Statements inancial Statements (Continued)(Continued)(Continued)(Continued)
Page 69
16161616 Share CapitalShare CapitalShare CapitalShare Capital (Continued)(Continued)(Continued)(Continued) For the year ended 31 December 2012, movement in participating shares was as follows:
CB CB CB CB Richard Ellis Asia Alpha Plus FundRichard Ellis Asia Alpha Plus FundRichard Ellis Asia Alpha Plus FundRichard Ellis Asia Alpha Plus Fund
CLASS B (USD) SHARESCLASS B (USD) SHARESCLASS B (USD) SHARESCLASS B (USD) SHARES Number of SharesNumber of SharesNumber of SharesNumber of Shares Subscription ValueSubscription ValueSubscription ValueSubscription Value
USDUSDUSDUSD
As at 1 January 2012 1,666,750 186,925,462
Capital issued 145,612 20,252,500
Capital redeemed - (44,253,193)
As at 31 December 2012 1,1,1,1,812812812812,,,,362362362362 161616162222,,,,924924924924,,,,769769769769
CLASS I (USD) SHARESCLASS I (USD) SHARESCLASS I (USD) SHARESCLASS I (USD) SHARES Number of SharesNumber of SharesNumber of SharesNumber of Shares Subscription ValueSubscription ValueSubscription ValueSubscription Value
USDUSDUSDUSD
As at 1 January 2012 815 815
Capital issued - -
As at 31 December 2012 815815815815 815815815815
CBRE GMM Asia Alpha Plus Fund III CBRE GMM Asia Alpha Plus Fund III may offer three classes of shares ---- Class A (USD) shares, Class M (USD) shares and Class I (USD) shares. Class M (USD) Shares and Class I (USD) Shares are not open to investors and are subject to the prior approval of the Board of Directors of the Company. The Company entered into a Shareholders’ Agreement with the Investment Manager, and certain employees thereof, to issue Class M (USD) shares to those employees at the par and current value of USD1 per share, with an effective date of 15 July 2013. Class M (USD) Shares and Class I (USD) Shares have no voting rights. The shares issued are not redeemable at the option of shareholders, until the first redemption day being the 31 December date immediately following 10 complete years from the Final Closing Date, expected to be 6 June 2014. The payment of redemption proceeds, where applicable, is expected to occur within 6 months of the redemption day. For the year ended 31 December 2013, movement in participating shares was as follows:
CBCBCBCBRE GMM RE GMM RE GMM RE GMM Asia Alpha Plus FundAsia Alpha Plus FundAsia Alpha Plus FundAsia Alpha Plus Fund IIIIIIIIIIII
CLASSCLASSCLASSCLASS AAAA SHARESSHARESSHARESSHARES Number of SharesNumber of SharesNumber of SharesNumber of Shares Subscription ValueSubscription ValueSubscription ValueSubscription Value
USDUSDUSDUSD
As at 6 June 2013 - -
Capital issued 41,046,562 41,046,562
Capital redeemed (5,907,795) (5,907,795)
As at 31 December 2013 35,138,76735,138,76735,138,76735,138,767
35,138,76735,138,76735,138,76735,138,767

CB RICHARD ELLIS REAL ESTATE FUND OF FUNDS CB RICHARD ELLIS REAL ESTATE FUND OF FUNDS CB RICHARD ELLIS REAL ESTATE FUND OF FUNDS CB RICHARD ELLIS REAL ESTATE FUND OF FUNDS PUBLIC LIMITED COMPANYPUBLIC LIMITED COMPANYPUBLIC LIMITED COMPANYPUBLIC LIMITED COMPANY Annual report for the year ended 31 DecemberAnnual report for the year ended 31 DecemberAnnual report for the year ended 31 DecemberAnnual report for the year ended 31 December 2013201320132013 Notes to the Notes to the Notes to the Notes to the FFFFinancial Statements inancial Statements inancial Statements inancial Statements (Continued)(Continued)(Continued)(Continued)
Page 70
16161616 Share CapitalShare CapitalShare CapitalShare Capital (Continued)(Continued)(Continued)(Continued)
CLASSCLASSCLASSCLASS MMMM SHARESSHARESSHARESSHARES Number of SharesNumber of SharesNumber of SharesNumber of Shares Subscription ValueSubscription ValueSubscription ValueSubscription Value
USDUSDUSDUSD
As at 6 June 2013 - -
Capital issued 254,357 254,357
Capital redeemed (43,524) (43,524)
As at 31 December 2013 210,833210,833210,833210,833 210,833210,833210,833210,833
CLASSCLASSCLASSCLASS IIII SHARESSHARESSHARESSHARES Number of SharesNumber of SharesNumber of SharesNumber of Shares
Subscription ValueSubscription ValueSubscription ValueSubscription Value
USDUSDUSDUSD
As at 6 June 2013 - -
Capital issued 940 940
Capital redeemed - -
As at 31 December 2013 940940940940 940940940940
CB Richard Ellis Asia Alpha Plus II Feeder Fund The shares issued are not redeemable at the option of shareholders, until the first redemption day being the business day immediately following 10 complete years from 3 January 2012, being the First Close. As further discussed in the prospectus, the payment of redemption proceeds, where applicable, depends on the redemption facilities which are provided based on the Investment Managers’ assessment of the liquidity of the underlying portfolio. For the year ended 31 December 2013, movement in participating shares was as follows:
CB Richard Ellis Asia Alpha Plus CB Richard Ellis Asia Alpha Plus CB Richard Ellis Asia Alpha Plus CB Richard Ellis Asia Alpha Plus II Feeder II Feeder II Feeder II Feeder FundFundFundFund
ORDINARY ORDINARY ORDINARY ORDINARY SHARESSHARESSHARESSHARES Number of SharesNumber of SharesNumber of SharesNumber of Shares Subscription ValueSubscription ValueSubscription ValueSubscription Value
USDUSDUSDUSD
As at 1 January 2013 58,597,801 54,658,212
Capital issued 5,508,272 5,662,500
Capital redeemed - (4,645,147)
As at 31 December 2013 64,106,07364,106,07364,106,07364,106,073
55,675,56555,675,56555,675,56555,675,565
For the year ended 31 December 2012, movement in participating shares was as follows:
CB Richard Ellis Asia Alpha Plus CB Richard Ellis Asia Alpha Plus CB Richard Ellis Asia Alpha Plus CB Richard Ellis Asia Alpha Plus II Feeder II Feeder II Feeder II Feeder FundFundFundFund
ORDINARY ORDINARY ORDINARY ORDINARY SHARESSHARESSHARESSHARES Number of SharesNumber of SharesNumber of SharesNumber of Shares Subscription ValueSubscription ValueSubscription ValueSubscription Value
USDUSDUSDUSD
As at 1 January 2012 - -
Capital issued 58,597,801 58,868,963
Capital redeemed - (4,210,751)
As at 31 December 2012 58,597,80158,597,80158,597,80158,597,801
54,658,21254,658,21254,658,21254,658,212
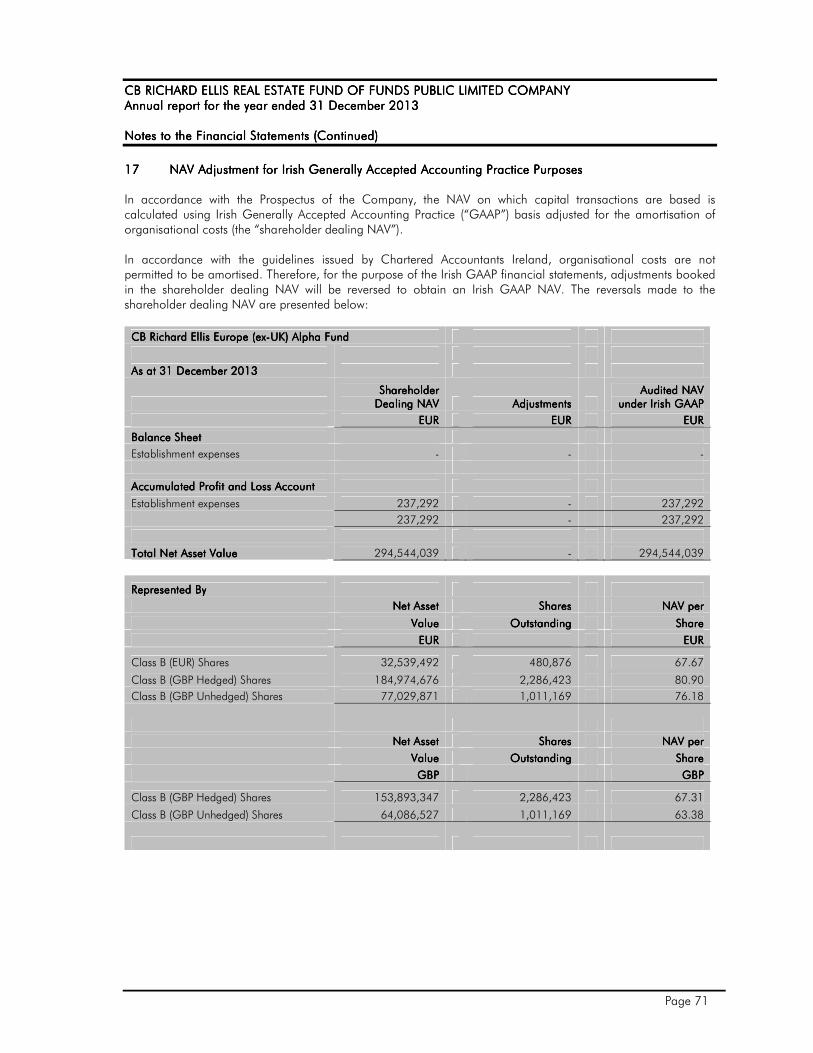
CB RICHARD ELLIS REAL ESTATE FUND OF FUNDS CB RICHARD ELLIS REAL ESTATE FUND OF FUNDS CB RICHARD ELLIS REAL ESTATE FUND OF FUNDS CB RICHARD ELLIS REAL ESTATE FUND OF FUNDS PUBLIC LIMITED COMPANYPUBLIC LIMITED COMPANYPUBLIC LIMITED COMPANYPUBLIC LIMITED COMPANY Annual report for the year ended 31 DecemberAnnual report for the year ended 31 DecemberAnnual report for the year ended 31 DecemberAnnual report for the year ended 31 December 2013201320132013 Notes to the Notes to the Notes to the Notes to the FFFFinancial Statements inancial Statements inancial Statements inancial Statements (Continued)(Continued)(Continued)(Continued)
Page 71
17171717 NAV Adjustment for Irish Generally Accepted Accounting Practice PurposesNAV Adjustment for Irish Generally Accepted Accounting Practice PurposesNAV Adjustment for Irish Generally Accepted Accounting Practice PurposesNAV Adjustment for Irish Generally Accepted Accounting Practice Purposes In accordance with the Prospectus of the Company, the NAV on which capital transactions are based is calculated using Irish Generally Accepted Accounting Practice (“GAAP”) basis adjusted for the amortisation of organisational costs (the “shareholder dealing NAV”). In accordance with the guidelines issued by Chartered Accountants Ireland, organisational costs are not permitted to be amortised. Therefore, for the purpose of the Irish GAAP financial statements, adjustments booked in the shareholder dealing NAV will be reversed to obtain an Irish GAAP NAV. The reversals made to the shareholder dealing NAV are presented below:
CB Richard Ellis Europe (exCB Richard Ellis Europe (exCB Richard Ellis Europe (exCB Richard Ellis Europe (ex----UK) Alpha FundUK) Alpha FundUK) Alpha FundUK) Alpha Fund
As at 31 DecAs at 31 DecAs at 31 DecAs at 31 December 2013ember 2013ember 2013ember 2013
Shareholder Shareholder Shareholder Shareholder
Dealing NAVDealing NAVDealing NAVDealing NAV AdjustmentsAdjustmentsAdjustmentsAdjustments Audited NAV Audited NAV Audited NAV Audited NAV
under Irish GAAPunder Irish GAAPunder Irish GAAPunder Irish GAAP
EUREUREUREUR EUREUREUREUR EUREUREUREUR
Balance SheetBalance SheetBalance SheetBalance Sheet
Establishment expenses - - -
Accumulated Profit and Loss AccountAccumulated Profit and Loss AccountAccumulated Profit and Loss AccountAccumulated Profit and Loss Account
Establishment expenses 237,292 - 237,292
237,292 - 237,292
Total Net Asset ValueTotal Net Asset ValueTotal Net Asset ValueTotal Net Asset Value 294,544,039 - 294,544,039
Represented ByRepresented ByRepresented ByRepresented By
Net AssetNet AssetNet AssetNet Asset Shares Shares Shares Shares NAV perNAV perNAV perNAV per
ValueValueValueValue OutstandingOutstandingOutstandingOutstanding ShareShareShareShare
EUREUREUREUR EUREUREUREUR
Class B (EUR) Shares 32,539,492 480,876 67.67
Class B (GBP Hedged) Shares 184,974,676 2,286,423 80.90
Class B (GBP Unhedged) Shares 77,029,871 1,011,169 76.18
Net AssetNet AssetNet AssetNet Asset Shares Shares Shares Shares NAV perNAV perNAV perNAV per
ValueValueValueValue OutstandingOutstandingOutstandingOutstanding ShareShareShareShare
GBPGBPGBPGBP GBPGBPGBPGBP
Class B (GBP Hedged) Shares 153,893,347 2,286,423 67.31
Class B (GBP Unhedged) Shares 64,086,527 1,011,169 63.38
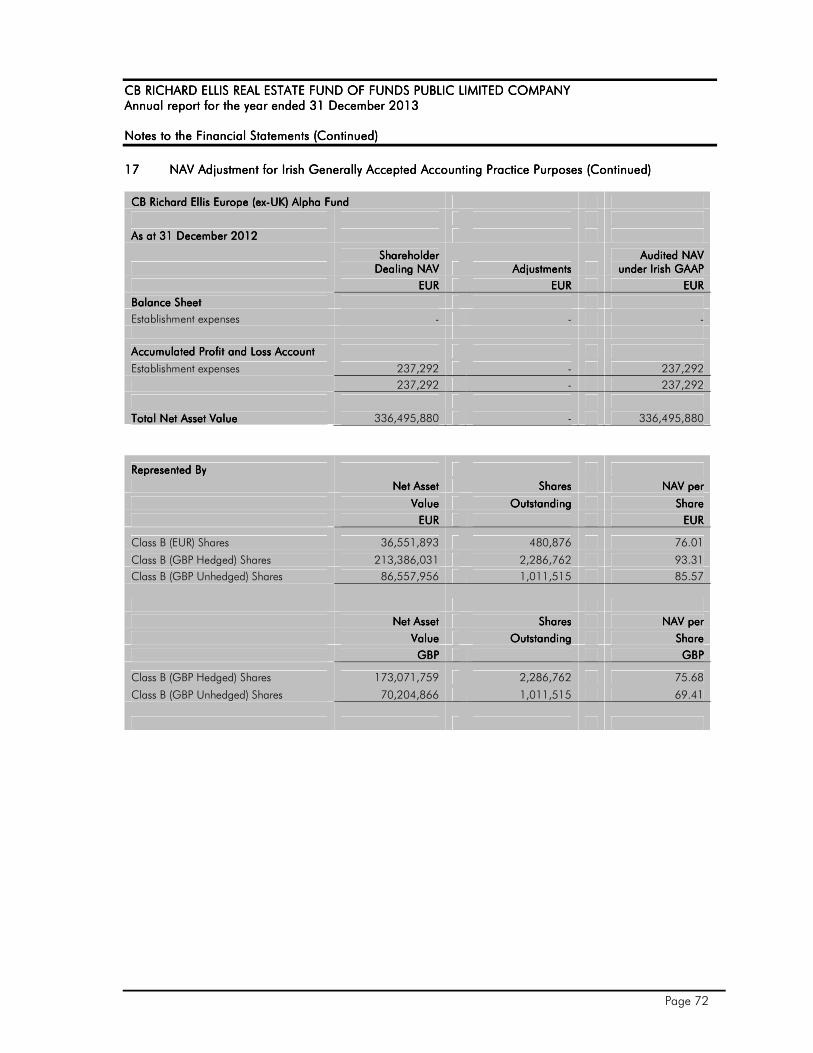
CB RICHARD ELLIS REAL ESTATE FUND OF FUNDS CB RICHARD ELLIS REAL ESTATE FUND OF FUNDS CB RICHARD ELLIS REAL ESTATE FUND OF FUNDS CB RICHARD ELLIS REAL ESTATE FUND OF FUNDS PUBLIC LIMITED COMPANYPUBLIC LIMITED COMPANYPUBLIC LIMITED COMPANYPUBLIC LIMITED COMPANY Annual report for the year ended 31 DecemberAnnual report for the year ended 31 DecemberAnnual report for the year ended 31 DecemberAnnual report for the year ended 31 December 2013201320132013 Notes to the Notes to the Notes to the Notes to the FFFFinancial Statements inancial Statements inancial Statements inancial Statements (Continued)(Continued)(Continued)(Continued)
Page 72
17171717 NAV Adjustment for Irish Generally Accepted Accounting Practice PurposesNAV Adjustment for Irish Generally Accepted Accounting Practice PurposesNAV Adjustment for Irish Generally Accepted Accounting Practice PurposesNAV Adjustment for Irish Generally Accepted Accounting Practice Purposes (Continued)(Continued)(Continued)(Continued)
CB Richard Ellis Europe (exCB Richard Ellis Europe (exCB Richard Ellis Europe (exCB Richard Ellis Europe (ex----UK) Alpha FundUK) Alpha FundUK) Alpha FundUK) Alpha Fund
As at 31 DecAs at 31 DecAs at 31 DecAs at 31 December 2012ember 2012ember 2012ember 2012
Shareholder Shareholder Shareholder Shareholder
Dealing NAVDealing NAVDealing NAVDealing NAV AdjustmentsAdjustmentsAdjustmentsAdjustments Audited NAV Audited NAV Audited NAV Audited NAV
under Irish GAAPunder Irish GAAPunder Irish GAAPunder Irish GAAP
EUREUREUREUR EUREUREUREUR EUREUREUREUR
Balance SheetBalance SheetBalance SheetBalance Sheet
Establishment expenses - - -
Accumulated Profit and Loss AccountAccumulated Profit and Loss AccountAccumulated Profit and Loss AccountAccumulated Profit and Loss Account
Establishment expenses 237,292 - 237,292
237,292 - 237,292
Total Net Asset ValueTotal Net Asset ValueTotal Net Asset ValueTotal Net Asset Value 336,495,880 - 336,495,880
Represented ByRepresented ByRepresented ByRepresented By
Net AssetNet AssetNet AssetNet Asset Shares Shares Shares Shares NAV perNAV perNAV perNAV per
ValueValueValueValue OutstandingOutstandingOutstandingOutstanding ShareShareShareShare
EUREUREUREUR EUREUREUREUR
Class B (EUR) Shares 36,551,893 480,876 76.01
Class B (GBP Hedged) Shares 213,386,031 2,286,762 93.31
Class B (GBP Unhedged) Shares 86,557,956 1,011,515 85.57
Net AssetNet AssetNet AssetNet Asset Shares Shares Shares Shares NAV perNAV perNAV perNAV per
ValueValueValueValue OutstandingOutstandingOutstandingOutstanding ShareShareShareShare
GBPGBPGBPGBP GBPGBPGBPGBP
Class B (GBP Hedged) Shares 173,071,759 2,286,762 75.68
Class B (GBP Unhedged) Shares 70,204,866 1,011,515 69.41
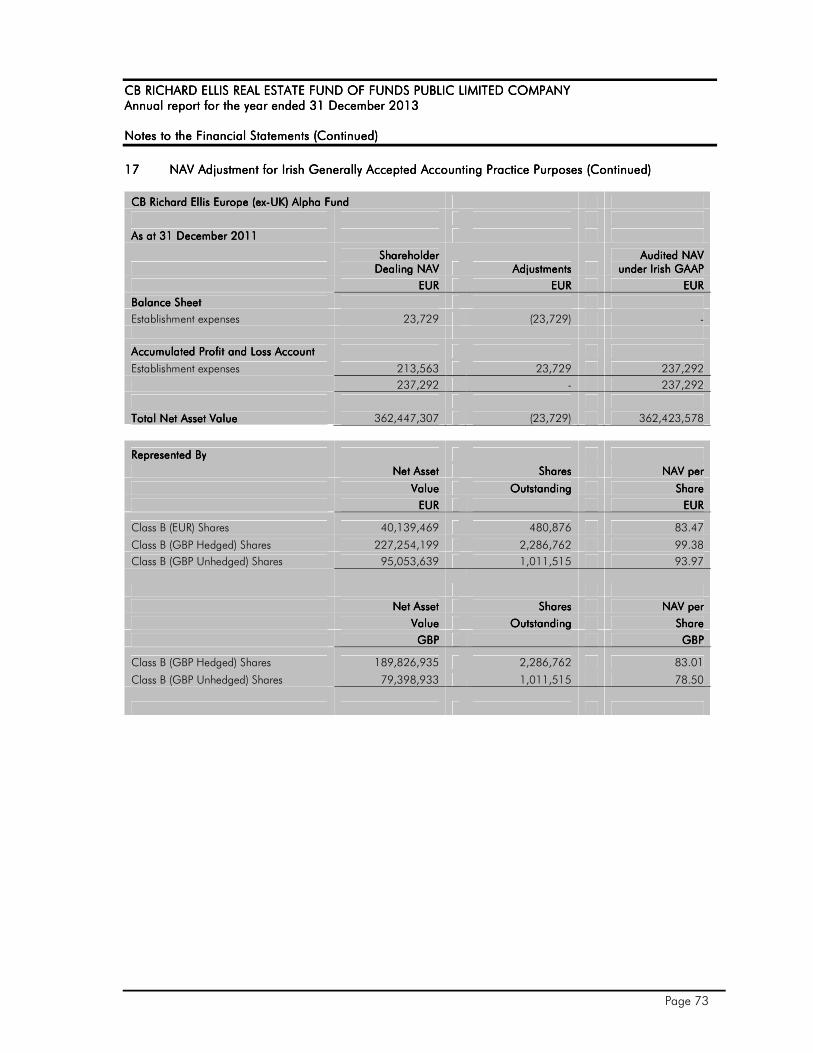
CB RICHARD ELLIS REAL ESTATE FUND OF FUNDS CB RICHARD ELLIS REAL ESTATE FUND OF FUNDS CB RICHARD ELLIS REAL ESTATE FUND OF FUNDS CB RICHARD ELLIS REAL ESTATE FUND OF FUNDS PUBLIC LIMITED COMPANYPUBLIC LIMITED COMPANYPUBLIC LIMITED COMPANYPUBLIC LIMITED COMPANY Annual report for the year ended 31 DecemberAnnual report for the year ended 31 DecemberAnnual report for the year ended 31 DecemberAnnual report for the year ended 31 December 2013201320132013 Notes to the Notes to the Notes to the Notes to the FFFFinancial Statements inancial Statements inancial Statements inancial Statements (Continued)(Continued)(Continued)(Continued)
Page 73
17171717 NAV Adjustment for Irish Generally Accepted Accounting Practice PurposesNAV Adjustment for Irish Generally Accepted Accounting Practice PurposesNAV Adjustment for Irish Generally Accepted Accounting Practice PurposesNAV Adjustment for Irish Generally Accepted Accounting Practice Purposes (Continued)(Continued)(Continued)(Continued)
CB Richard Ellis Europe (exCB Richard Ellis Europe (exCB Richard Ellis Europe (exCB Richard Ellis Europe (ex----UK) Alpha FundUK) Alpha FundUK) Alpha FundUK) Alpha Fund
As at 31 December 2011As at 31 December 2011As at 31 December 2011As at 31 December 2011
Shareholder Shareholder Shareholder Shareholder
Dealing NAVDealing NAVDealing NAVDealing NAV AdjustmentsAdjustmentsAdjustmentsAdjustments Audited NAV Audited NAV Audited NAV Audited NAV
under Irish GAAPunder Irish GAAPunder Irish GAAPunder Irish GAAP
EUREUREUREUR EUREUREUREUR EUREUREUREUR
Balance SheetBalance SheetBalance SheetBalance Sheet
Establishment expenses 23,729 (23,729) -
Accumulated Profit and Loss AccountAccumulated Profit and Loss AccountAccumulated Profit and Loss AccountAccumulated Profit and Loss Account
Establishment expenses 213,563 23,729 237,292
237,292 - 237,292
Total Net Asset ValueTotal Net Asset ValueTotal Net Asset ValueTotal Net Asset Value 362,447,307 (23,729) 362,423,578
Represented ByRepresented ByRepresented ByRepresented By
Net AssetNet AssetNet AssetNet Asset Shares Shares Shares Shares NAV perNAV perNAV perNAV per
ValueValueValueValue OutstandingOutstandingOutstandingOutstanding ShareShareShareShare
EUREUREUREUR EUREUREUREUR
Class B (EUR) Shares 40,139,469 480,876 83.47
Class B (GBP Hedged) Shares 227,254,199 2,286,762 99.38
Class B (GBP Unhedged) Shares 95,053,639 1,011,515 93.97
Net AssetNet AssetNet AssetNet Asset Shares Shares Shares Shares NAV perNAV perNAV perNAV per
ValueValueValueValue OutstandingOutstandingOutstandingOutstanding ShareShareShareShare
GBPGBPGBPGBP GBPGBPGBPGBP
Class B (GBP Hedged) Shares 189,826,935 2,286,762 83.01
Class B (GBP Unhedged) Shares 79,398,933 1,011,515 78.50

CB RICHARD ELLIS REAL ESTATE FUND OF FUNDS CB RICHARD ELLIS REAL ESTATE FUND OF FUNDS CB RICHARD ELLIS REAL ESTATE FUND OF FUNDS CB RICHARD ELLIS REAL ESTATE FUND OF FUNDS PUBLIC LIMITED COMPANYPUBLIC LIMITED COMPANYPUBLIC LIMITED COMPANYPUBLIC LIMITED COMPANY Annual report for the year ended 31 DecemberAnnual report for the year ended 31 DecemberAnnual report for the year ended 31 DecemberAnnual report for the year ended 31 December 2013201320132013 Notes to the Notes to the Notes to the Notes to the FFFFinancial Statements inancial Statements inancial Statements inancial Statements (Continued)(Continued)(Continued)(Continued)
Page 74
17171717 NAV Adjustment for Irish Generally Accepted Accounting Practice PurposesNAV Adjustment for Irish Generally Accepted Accounting Practice PurposesNAV Adjustment for Irish Generally Accepted Accounting Practice PurposesNAV Adjustment for Irish Generally Accepted Accounting Practice Purposes (Continued)(Continued)(Continued)(Continued)
CBCBCBCB Richard Ellis Asia Alpha Plus FundRichard Ellis Asia Alpha Plus FundRichard Ellis Asia Alpha Plus FundRichard Ellis Asia Alpha Plus Fund
As at 31 DecAs at 31 DecAs at 31 DecAs at 31 December 2013ember 2013ember 2013ember 2013
Shareholder Dealing Shareholder Dealing Shareholder Dealing Shareholder Dealing NAVNAVNAVNAV AdjustmentsAdjustmentsAdjustmentsAdjustments
Audited NAV Audited NAV Audited NAV Audited NAV under Irish GAAPunder Irish GAAPunder Irish GAAPunder Irish GAAP
USDUSDUSDUSD USDUSDUSDUSD USDUSDUSDUSD
Balance SheetBalance SheetBalance SheetBalance Sheet
Establishment expenses 19,915 (19,915) -
Accumulated Profit and Loss AccountAccumulated Profit and Loss AccountAccumulated Profit and Loss AccountAccumulated Profit and Loss Account
Establishment expenses 172,810 19,915 192,725
192,725 - 192,725
Total Net Asset ValueTotal Net Asset ValueTotal Net Asset ValueTotal Net Asset Value 173,077,807 (19,915) 173,057,892
Represented ByRepresented ByRepresented ByRepresented By
Net AssetNet AssetNet AssetNet Asset Shares Shares Shares Shares NAV perNAV perNAV perNAV per
ValueValueValueValue OutstandingOutstandingOutstandingOutstanding ShareShareShareShare
USDUSDUSDUSD USDUSDUSDUSD
Class B (USD) Shares 173,076,992 1,848,794 93.62
Class I (USD) Shares 815 815 1.00
CB Richard Ellis Asia Alpha Plus FundCB Richard Ellis Asia Alpha Plus FundCB Richard Ellis Asia Alpha Plus FundCB Richard Ellis Asia Alpha Plus Fund
As at 31 DecAs at 31 DecAs at 31 DecAs at 31 December 2012ember 2012ember 2012ember 2012 Shareholder Dealing Shareholder Dealing Shareholder Dealing Shareholder Dealing
NAVNAVNAVNAV AdjustmentsAdjustmentsAdjustmentsAdjustments Audited NAV Audited NAV Audited NAV Audited NAV
under Irish GAAPunder Irish GAAPunder Irish GAAPunder Irish GAAP
USDUSDUSDUSD USDUSDUSDUSD USDUSDUSDUSD
Balance SheetBalance SheetBalance SheetBalance Sheet
Establishment expenses 58,460 (58,460) -
Accumulated Profit and Loss AccountAccumulated Profit and Loss AccountAccumulated Profit and Loss AccountAccumulated Profit and Loss Account
Establishment expenses 134,265 58,460 192,725
192,725 - 192,725
Total Net Asset ValueTotal Net Asset ValueTotal Net Asset ValueTotal Net Asset Value 197,884,071 (58,460) 197,825,611
Represented ByRepresented ByRepresented ByRepresented By
Net AssetNet AssetNet AssetNet Asset Shares Shares Shares Shares NAV perNAV perNAV perNAV per
ValueValueValueValue OutstandingOutstandingOutstandingOutstanding ShareShareShareShare
USDUSDUSDUSD USDUSDUSDUSD
Class B (USD) Shares 197,883,256 1,812,362 109.19
Class I (USD) Shares 815 815 1.00

CB RICHARD ELLIS REAL ESTATE FUND OF FUNDS CB RICHARD ELLIS REAL ESTATE FUND OF FUNDS CB RICHARD ELLIS REAL ESTATE FUND OF FUNDS CB RICHARD ELLIS REAL ESTATE FUND OF FUNDS PUBLIC LIMITED COMPANYPUBLIC LIMITED COMPANYPUBLIC LIMITED COMPANYPUBLIC LIMITED COMPANY Annual report for the year ended 31 DecemberAnnual report for the year ended 31 DecemberAnnual report for the year ended 31 DecemberAnnual report for the year ended 31 December 2013201320132013 Notes to the Notes to the Notes to the Notes to the FFFFinancial Statements inancial Statements inancial Statements inancial Statements (Continued)(Continued)(Continued)(Continued)
Page 75
17171717 NAV Adjustment for Irish Generally Accepted Accounting Practice PurposesNAV Adjustment for Irish Generally Accepted Accounting Practice PurposesNAV Adjustment for Irish Generally Accepted Accounting Practice PurposesNAV Adjustment for Irish Generally Accepted Accounting Practice Purposes (Continued)(Continued)(Continued)(Continued)
CB Richard Ellis Asia Alpha Plus FundCB Richard Ellis Asia Alpha Plus FundCB Richard Ellis Asia Alpha Plus FundCB Richard Ellis Asia Alpha Plus Fund
As at 31 December 2011As at 31 December 2011As at 31 December 2011As at 31 December 2011
Shareholder Dealing Shareholder Dealing Shareholder Dealing Shareholder Dealing NAVNAVNAVNAV AdjustmentsAdjustmentsAdjustmentsAdjustments
Audited NAV Audited NAV Audited NAV Audited NAV under Irish under Irish under Irish under Irish GAAPGAAPGAAPGAAP
USDUSDUSDUSD USDUSDUSDUSD USDUSDUSDUSD
Balance SheetBalance SheetBalance SheetBalance Sheet
Establishment expenses 97,005 (97,005) -
Accumulated Profit and Loss AccountAccumulated Profit and Loss AccountAccumulated Profit and Loss AccountAccumulated Profit and Loss Account
Establishment expenses 95,720 97,005 192,725
192,725 - 192,725
Total Net Asset Total Net Asset Total Net Asset Total Net Asset ValueValueValueValue 227,198,350 (97,005) 227,101,345
Represented ByRepresented ByRepresented ByRepresented By
Net AssetNet AssetNet AssetNet Asset Shares Shares Shares Shares NAV perNAV perNAV perNAV per
ValueValueValueValue OutstandingOutstandingOutstandingOutstanding ShareShareShareShare
USDUSDUSDUSD
USDUSDUSDUSD
Class B (USD) Shares 227,197,535 1,666,750 136.31
Class I (USD) Shares 815 815 1.00
CBRE GMM Asia Alpha Plus CBRE GMM Asia Alpha Plus CBRE GMM Asia Alpha Plus CBRE GMM Asia Alpha Plus Fund IIIFund IIIFund IIIFund III
As at 31 December 2013As at 31 December 2013As at 31 December 2013As at 31 December 2013
Shareholder Shareholder Shareholder Shareholder
Dealing NAVDealing NAVDealing NAVDealing NAV AdjustmentsAdjustmentsAdjustmentsAdjustments NAV NAV NAV NAV
under Irish GAAPunder Irish GAAPunder Irish GAAPunder Irish GAAP
USDUSDUSDUSD USDUSDUSDUSD USDUSDUSDUSD
Balance SheetBalance SheetBalance SheetBalance Sheet
Establishment expenses 102,535 (102,535) -
Accumulated Profit and Loss Accumulated Profit and Loss Accumulated Profit and Loss Accumulated Profit and Loss AccountAccountAccountAccount
Establishment expenses 15,903 102,535 118,438
118,438 - 118,438
Total Net Asset ValueTotal Net Asset ValueTotal Net Asset ValueTotal Net Asset Value 38,426,963 (102,535) 38,324,428
Represented ByRepresented ByRepresented ByRepresented By
Net AssetNet AssetNet AssetNet Asset
ValueValueValueValue Shares Shares Shares Shares OutstandingOutstandingOutstandingOutstanding
NAV perNAV perNAV perNAV per
ShareShareShareShare
USDUSDUSDUSD USDUSDUSDUSD
Class A shares 38,193,847 35,138,767 1.0869
Class M shares 232,176 210,833 1.1012
Class I shares 940 940 1.0000
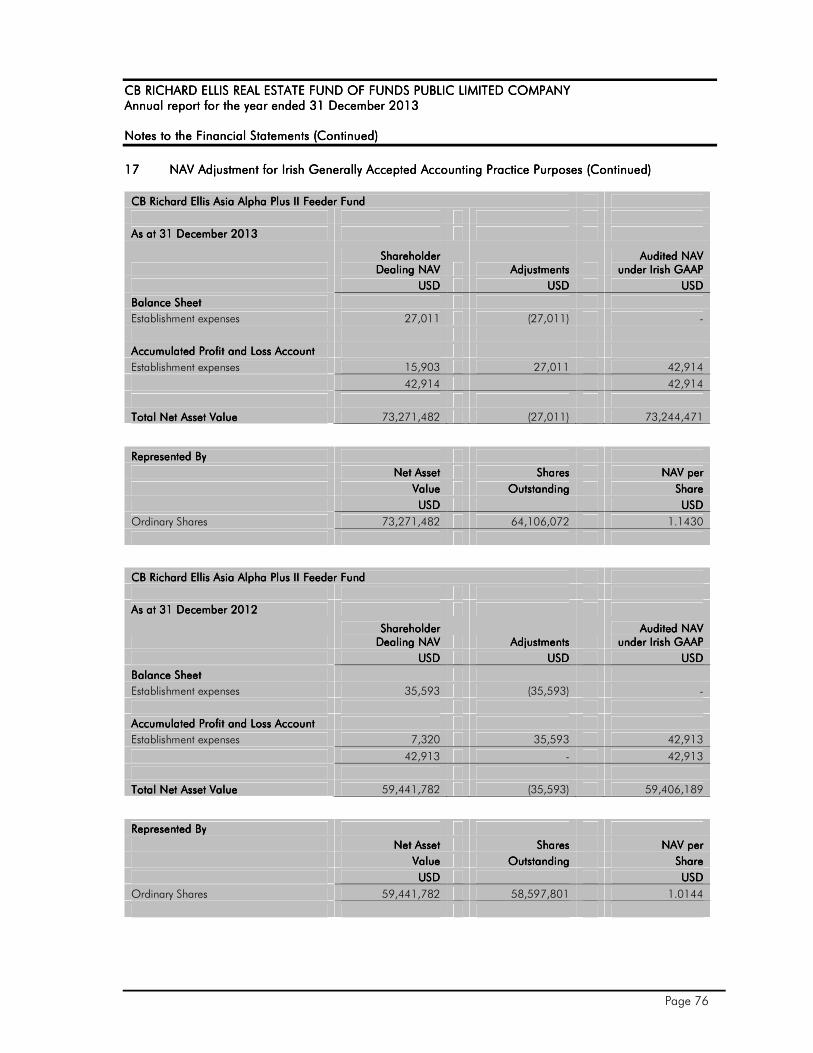
CB RICHARD ELLIS REAL ESTATE FUND OF FUNDS CB RICHARD ELLIS REAL ESTATE FUND OF FUNDS CB RICHARD ELLIS REAL ESTATE FUND OF FUNDS CB RICHARD ELLIS REAL ESTATE FUND OF FUNDS PUBLIC LIMITED COMPANYPUBLIC LIMITED COMPANYPUBLIC LIMITED COMPANYPUBLIC LIMITED COMPANY Annual report for the year ended 31 DecemberAnnual report for the year ended 31 DecemberAnnual report for the year ended 31 DecemberAnnual report for the year ended 31 December 2013201320132013 Notes to the Notes to the Notes to the Notes to the FFFFinancial Statements inancial Statements inancial Statements inancial Statements (Continued)(Continued)(Continued)(Continued)
Page 76
17171717 NAV Adjustment for Irish Generally Accepted Accounting Practice NAV Adjustment for Irish Generally Accepted Accounting Practice NAV Adjustment for Irish Generally Accepted Accounting Practice NAV Adjustment for Irish Generally Accepted Accounting Practice PurposesPurposesPurposesPurposes (Continued)(Continued)(Continued)(Continued)
CB Richard Ellis Asia Alpha CB Richard Ellis Asia Alpha CB Richard Ellis Asia Alpha CB Richard Ellis Asia Alpha PlusPlusPlusPlus II Feeder FundII Feeder FundII Feeder FundII Feeder Fund
As at 31 December 201As at 31 December 201As at 31 December 201As at 31 December 2013333
Shareholder Shareholder Shareholder Shareholder
Dealing NAVDealing NAVDealing NAVDealing NAV AdjustmentsAdjustmentsAdjustmentsAdjustments Audited NAV Audited NAV Audited NAV Audited NAV
under Irish GAAPunder Irish GAAPunder Irish GAAPunder Irish GAAP
USDUSDUSDUSD USDUSDUSDUSD USDUSDUSDUSD
Balance SheetBalance SheetBalance SheetBalance Sheet
Establishment expenses 27,011 (27,011) -
Accumulated Profit and Loss AccountAccumulated Profit and Loss AccountAccumulated Profit and Loss AccountAccumulated Profit and Loss Account
Establishment expenses 15,903 27,011 42,914
42,914
42,914
Total Net Asset ValueTotal Net Asset ValueTotal Net Asset ValueTotal Net Asset Value 73,271,482 (27,011) 73,244,471
Represented ByRepresented ByRepresented ByRepresented By
Net AssetNet AssetNet AssetNet Asset Shares Shares Shares Shares NAV perNAV perNAV perNAV per
ValueValueValueValue OutstandingOutstandingOutstandingOutstanding ShareShareShareShare
USDUSDUSDUSD USDUSDUSDUSD
Ordinary Shares 73,271,482 64,106,072 1.1430
CB Richard Ellis Asia Alpha CB Richard Ellis Asia Alpha CB Richard Ellis Asia Alpha CB Richard Ellis Asia Alpha PlusPlusPlusPlus II Feeder FundII Feeder FundII Feeder FundII Feeder Fund
As at 31 December 201As at 31 December 201As at 31 December 201As at 31 December 2012222
Shareholder Shareholder Shareholder Shareholder
Dealing NAVDealing NAVDealing NAVDealing NAV AdjustmentsAdjustmentsAdjustmentsAdjustments Audited NAV Audited NAV Audited NAV Audited NAV
under Irish GAAPunder Irish GAAPunder Irish GAAPunder Irish GAAP
USDUSDUSDUSD USDUSDUSDUSD USDUSDUSDUSD
Balance SheetBalance SheetBalance SheetBalance Sheet
Establishment expenses 35,593 (35,593) -
Accumulated Profit and Loss AccountAccumulated Profit and Loss AccountAccumulated Profit and Loss AccountAccumulated Profit and Loss Account
Establishment expenses 7,320 35,593 42,913
42,913 - 42,913
Total Net Asset ValueTotal Net Asset ValueTotal Net Asset ValueTotal Net Asset Value 59,441,782 (35,593) 59,406,189
Represented ByRepresented ByRepresented ByRepresented By
Net AssetNet AssetNet AssetNet Asset Shares Shares Shares Shares NAV perNAV perNAV perNAV per
ValueValueValueValue OutstandingOutstandingOutstandingOutstanding ShareShareShareShare
USDUSDUSDUSD USDUSDUSDUSD
Ordinary Shares 59,441,782 58,597,801 1.0144

CB RICHARD ELLIS REAL ESTATE FUND OF FUNDS CB RICHARD ELLIS REAL ESTATE FUND OF FUNDS CB RICHARD ELLIS REAL ESTATE FUND OF FUNDS CB RICHARD ELLIS REAL ESTATE FUND OF FUNDS PUBLIC LIMITED COMPANYPUBLIC LIMITED COMPANYPUBLIC LIMITED COMPANYPUBLIC LIMITED COMPANY Annual report for the year ended 31 DecemberAnnual report for the year ended 31 DecemberAnnual report for the year ended 31 DecemberAnnual report for the year ended 31 December 2013201320132013 Notes to the Notes to the Notes to the Notes to the FFFFinancial Statements inancial Statements inancial Statements inancial Statements (Continued)(Continued)(Continued)(Continued)
Page 77
18181818 Net Changes in Fair Value on Financial Assets and Financial Liabilities at Fair ValueNet Changes in Fair Value on Financial Assets and Financial Liabilities at Fair ValueNet Changes in Fair Value on Financial Assets and Financial Liabilities at Fair ValueNet Changes in Fair Value on Financial Assets and Financial Liabilities at Fair Value
Alpha FundAlpha FundAlpha FundAlpha Fund Alpha FundAlpha FundAlpha FundAlpha Fund
Asia Alpha PlusAsia Alpha PlusAsia Alpha PlusAsia Alpha Plus FundFundFundFund
Asia Alpha PlusAsia Alpha PlusAsia Alpha PlusAsia Alpha Plus FundFundFundFund
Asia Alpha Plus Asia Alpha Plus Asia Alpha Plus Asia Alpha Plus Fund IIIFund IIIFund IIIFund III
Year endedYear endedYear endedYear ended Year endedYear endedYear endedYear ended
Year endedYear endedYear endedYear ended Year endedYear endedYear endedYear ended
Year endedYear endedYear endedYear ended
31 December 201331 December 201331 December 201331 December 2013 31 December 201231 December 201231 December 201231 December 2012
31 December 201331 December 201331 December 201331 December 2013 31 December 201231 December 201231 December 201231 December 2012
31 December 201331 December 201331 December 201331 December 2013
EUREUREUREUR EUREUREUREUR
USDUSDUSDUSD
USDUSDUSDUSD
EUREUREUREUR
Realised gain/ (loss) on investments
- 305,216
1,549,106
23,095,887
-
Unrealised gain/ (loss) on investments
(21,625,618) (20,622,772)
(29,655)
(17,432,768)
3,961,769
Realised loss on share class hedging
(12,868,384) (5,375,388)
-
-
-
Unrealised gain/ (loss) on share class hedging
2,220,431 (6,884,660)
-
-
-
Realised gain/ (loss) on forward currency contracts
4,954,647 19,739,765
14,294,513
(2,852,110)
-
Unrealised gain/ (loss) on forward currency contracts
- -
(1,535,470)
3,364,808
-
(27,318,924) (12,837,839)
14,278,494 6,175,817
3,961,769
Currency gain/ (loss)
4,438 5
(748,068)
(109,075)
(740)
(27,314,486) (12,837,834)
13,530,426
6,066,742
3,961,029
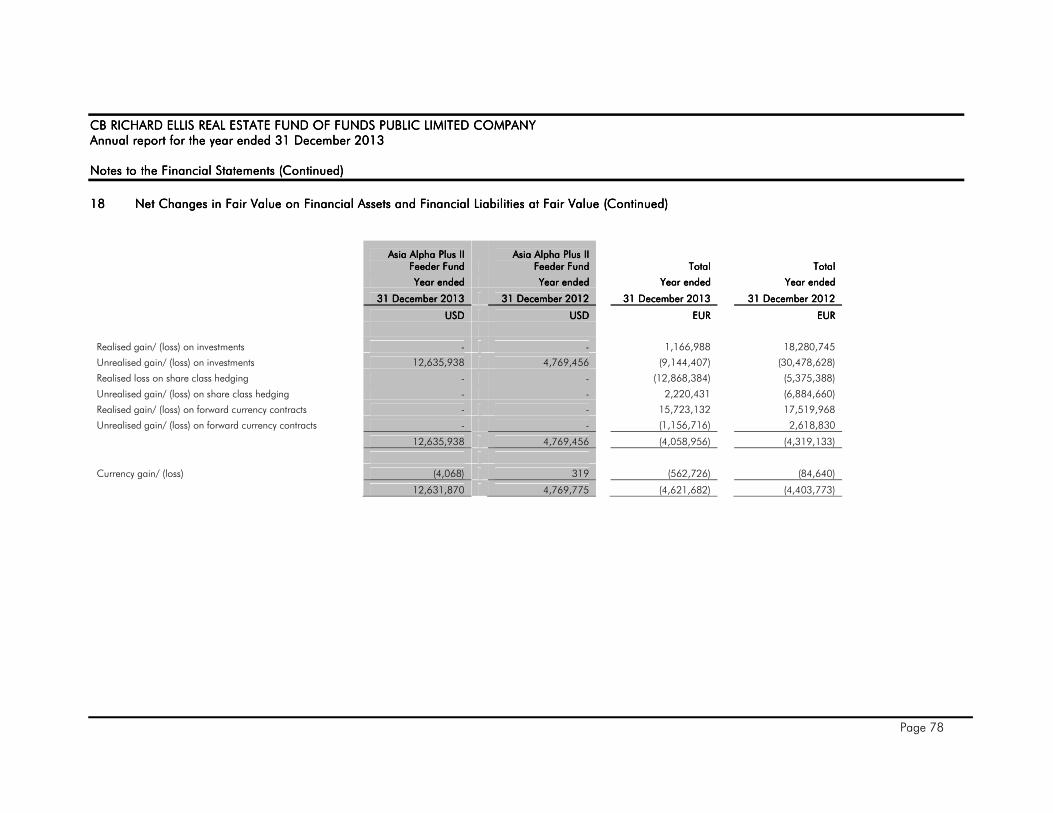
CB RICHARD ELLIS REAL ESTATE FUND OF FUNDS CB RICHARD ELLIS REAL ESTATE FUND OF FUNDS CB RICHARD ELLIS REAL ESTATE FUND OF FUNDS CB RICHARD ELLIS REAL ESTATE FUND OF FUNDS PUBLIC LIMITED COMPANYPUBLIC LIMITED COMPANYPUBLIC LIMITED COMPANYPUBLIC LIMITED COMPANY Annual report for the year ended 31 DecemberAnnual report for the year ended 31 DecemberAnnual report for the year ended 31 DecemberAnnual report for the year ended 31 December 2013201320132013 Notes to the Notes to the Notes to the Notes to the FFFFinancial Statements inancial Statements inancial Statements inancial Statements (Continued)(Continued)(Continued)(Continued)
Page 78
18181818 Net Changes in Fair Value on Financial Assets and Financial Liabilities at Fair ValueNet Changes in Fair Value on Financial Assets and Financial Liabilities at Fair ValueNet Changes in Fair Value on Financial Assets and Financial Liabilities at Fair ValueNet Changes in Fair Value on Financial Assets and Financial Liabilities at Fair Value (Continued)(Continued)(Continued)(Continued)
Asia Alpha Plus IIAsia Alpha Plus IIAsia Alpha Plus IIAsia Alpha Plus II Feeder FundFeeder FundFeeder FundFeeder Fund
Asia Alpha Plus IIAsia Alpha Plus IIAsia Alpha Plus IIAsia Alpha Plus II Feeder FundFeeder FundFeeder FundFeeder Fund
TotalTotalTotalTotal TotalTotalTotalTotal
Year endedYear endedYear endedYear ended Year endedYear endedYear endedYear ended
Year endedYear endedYear endedYear ended Year endedYear endedYear endedYear ended
31 December 201331 December 201331 December 201331 December 2013 31 December 201231 December 201231 December 201231 December 2012
31 December 201331 December 201331 December 201331 December 2013 31 December 201231 December 201231 December 201231 December 2012
USDUSDUSDUSD USDUSDUSDUSD
EUREUREUREUR EUREUREUREUR
Realised gain/ (loss) on investments
- -
1,166,988 18,280,745
Unrealised gain/ (loss) on investments
12,635,938 4,769,456
(9,144,407) (30,478,628)
Realised loss on share class hedging
- -
(12,868,384) (5,375,388)
Unrealised gain/ (loss) on share class hedging
- -
2,220,431 (6,884,660)
Realised gain/ (loss) on forward currency contracts
- -
15,723,132 17,519,968
Unrealised gain/ (loss) on forward currency contracts
- -
(1,156,716) 2,618,830
12,635,938 4,769,456
(4,058,956) (4,319,133)
Currency gain/ (loss)
(4,068) 319
(562,726) (84,640)
12,631,870 4,769,775
(4,621,682) (4,403,773)
CB RICHARD ELLIS REAL ESTATE FUND OF FUNDS CB RICHARD ELLIS REAL ESTATE FUND OF FUNDS CB RICHARD ELLIS REAL ESTATE FUND OF FUNDS CB RICHARD ELLIS REAL ESTATE FUND OF FUNDS PUBLIC LIMITED COMPANYPUBLIC LIMITED COMPANYPUBLIC LIMITED COMPANYPUBLIC LIMITED COMPANY Annual report for the year ended 31 DecemberAnnual report for the year ended 31 DecemberAnnual report for the year ended 31 DecemberAnnual report for the year ended 31 December 2013201320132013 Notes to the Notes to the Notes to the Notes to the FFFFinancial Statements inancial Statements inancial Statements inancial Statements (Continued)(Continued)(Continued)(Continued)
Page 79
19191919 Restatement of comparative figuresRestatement of comparative figuresRestatement of comparative figuresRestatement of comparative figures CB Richard Ellis Asia Alpha Plus II Feeder Fund As of 31 December 2012, a receivable on subscriptions amounting to USD 1,029,951 was initially shown net of a dividend payable. Therefore the prior year Balance Sheet has been restated, resulting in an increase of USD 1,029,951 in “Debtors – Amounts falling due within one year” and a decrease of USD 1,029,951 in “Creditors – Amounts falling due within one year”. Other related schedules were amended accordingly. With respect to the financial year ended 31 December 2012, distributions amounting to USD 4,210,751 were initially qualified as dividends instead of redemptions of capital. Therefore the prior year Profit and Loss Account and Statement of Changes in Net Assets Attributable to Shareholders have been restated resulting in a decrease of USD 4,210,751 in “Dividends to Shareholders” in the Profit and Loss Account and an increase of USD 4,210,751 in “Capital redeemed” in the Changes in Net Assets attributable to Shareholders being it understood that the Net Assets Attributable to Shareholders at the end of the year did not change. Likewise, a year-end payable amounting to USD 1,883,909 and arising out of those distributions was initially booked as a dividend payable and subsequently reclassified as a payable on redemptions. Other related schedules including the Cash Flow Statement were amended as well. CB Richard Ellis Europe (ex-UK) Alpha Fund Comparative figures have been restated to reflect reclassification of payables on redemptions and dividends payable from "Net cash generated by operating activities" to "Net cash generated by financing activities".

CB RICHARD ELLIS REAL ESTATE FUND OF FUNDS CB RICHARD ELLIS REAL ESTATE FUND OF FUNDS CB RICHARD ELLIS REAL ESTATE FUND OF FUNDS CB RICHARD ELLIS REAL ESTATE FUND OF FUNDS PUBLIC LIMITED COMPANYPUBLIC LIMITED COMPANYPUBLIC LIMITED COMPANYPUBLIC LIMITED COMPANY Annual report for the year ended 31 DecemberAnnual report for the year ended 31 DecemberAnnual report for the year ended 31 DecemberAnnual report for the year ended 31 December 2013201320132013 Notes to the Notes to the Notes to the Notes to the FFFFinancial Statements inancial Statements inancial Statements inancial Statements (Continued)(Continued)(Continued)(Continued)
Page 80
20202020 Distributions to ShareholdersDistributions to ShareholdersDistributions to ShareholdersDistributions to Shareholders During the year ended 31 December 2013 and 31 December 2012 the following dividends were declared or paid to the Shareholders: CB Richard Ellis Europe (exCB Richard Ellis Europe (exCB Richard Ellis Europe (exCB Richard Ellis Europe (ex----UK) Alpha FundUK) Alpha FundUK) Alpha FundUK) Alpha Fund
Date of resolutionDate of resolutionDate of resolutionDate of resolution Payment datePayment datePayment datePayment date CurrencyCurrencyCurrencyCurrency Dividend per Dividend per Dividend per Dividend per
shareshareshareshare Year endedYear endedYear endedYear ended
31 December 201331 December 201331 December 201331 December 2013
28/05/2013 28/06/2013 EUR 3.00 11,000,000
11,000,000
Date of resolutionDate of resolutionDate of resolutionDate of resolution Payment datePayment datePayment datePayment date CurrencyCurrencyCurrencyCurrency Dividend per Dividend per Dividend per Dividend per
shareshareshareshare Year endedYear endedYear endedYear ended
31 December 201231 December 201231 December 201231 December 2012
13/11/2012 28/12/2012 EUR 2.68 12,000,000
13/11/2012 27/02/2013 EUR 0.07 305,216
12,305,216
CB Richard Ellis Asia Alpha Plus FundCB Richard Ellis Asia Alpha Plus FundCB Richard Ellis Asia Alpha Plus FundCB Richard Ellis Asia Alpha Plus Fund
Date of resolutionDate of resolutionDate of resolutionDate of resolution Payment datePayment datePayment datePayment date CurrencyCurrencyCurrencyCurrency Dividend per Dividend per Dividend per Dividend per
shareshareshareshare Year endedYear endedYear endedYear ended
31 December 201331 December 201331 December 201331 December 2013
28/05/2013 27/06/2013 USD 2.26 4,088,730
09/08/2013 16/08/2013 USD 4.95 9,124,643
29/11/2013 19/12/2013 USD 2.26 4,177,195
17,390,568
Date of resolutionDate of resolutionDate of resolutionDate of resolution Payment datePayment datePayment datePayment date CurrencyCurrencyCurrencyCurrency Dividend per Dividend per Dividend per Dividend per
shareshareshareshare Year endedYear endedYear endedYear ended
31 December 201231 December 201231 December 201231 December 2012
13/11/2012 30/11/2012 USD 11.07 20,066,034
13/11/2012 20/12/2012 USD 1.54 2,785,538*
13/11/2012 20/02/2013 USD 2.30 4,159,096*
27,010,668
* Restated

CB RICHARD ELLIS REAL ESTATE FUND OF FUNDS CB RICHARD ELLIS REAL ESTATE FUND OF FUNDS CB RICHARD ELLIS REAL ESTATE FUND OF FUNDS CB RICHARD ELLIS REAL ESTATE FUND OF FUNDS PUBLIC LIMITED COMPANYPUBLIC LIMITED COMPANYPUBLIC LIMITED COMPANYPUBLIC LIMITED COMPANY Annual report for the year ended 31 DecemberAnnual report for the year ended 31 DecemberAnnual report for the year ended 31 DecemberAnnual report for the year ended 31 December 2013201320132013 Notes to the Notes to the Notes to the Notes to the FFFFinancial Statements inancial Statements inancial Statements inancial Statements (Continued)(Continued)(Continued)(Continued)
Page 81
20202020 Distributions to ShareholdersDistributions to ShareholdersDistributions to ShareholdersDistributions to Shareholders (Continued)(Continued)(Continued)(Continued) CB Richard Ellis Asia Alpha Plus II Feeder FundCB Richard Ellis Asia Alpha Plus II Feeder FundCB Richard Ellis Asia Alpha Plus II Feeder FundCB Richard Ellis Asia Alpha Plus II Feeder Fund
Date of resolutionDate of resolutionDate of resolutionDate of resolution Payment datePayment datePayment datePayment date CurrencyCurrencyCurrencyCurrency Dividend per Dividend per Dividend per Dividend per
shareshareshareshare Year endedYear endedYear endedYear ended
31 December 31 December 31 December 31 December 2013201320132013
10/06/2013 14/06/2013 USD 0.015 932,955
13/09/2013 17/09/2013 USD 0.003 214,602
14/10/2013 17/10/2013 USD 0.005 341,066
1,488,623
Date of resolutionDate of resolutionDate of resolutionDate of resolution Payment datePayment datePayment datePayment date CurrencyCurrencyCurrencyCurrency Dividend per Dividend per Dividend per Dividend per
shareshareshareshare
Year endedYear endedYear endedYear ended 31 December 201231 December 201231 December 201231 December 2012
RestatedRestatedRestatedRestated****
13/11/2012 09/10/2012 USD 0.08 700,382
13/11/2012 09/01/2013 USD 0.09 3,397,884
4,098,266
* See Note 19 21212121 Share Class HedgingShare Class HedgingShare Class HedgingShare Class Hedging CB Richard Ellis Europe (ex----UK) Alpha Fund operates a hedge at share class level against the functional currency of the GBP (Hedged) share class. The value of open contracts as at 31 December 2013 was reflecting an unrealised gain/ loss of GBP 1,569,308 (31 December 2012: an unrealised loss of GBP 272,289) equivalent to an unrealised gain/ loss of EUR 1,885,048 (31 December 2012: unrealised gain of EUR 335,383). The cost of the hedge is attributable solely to the GBP hedged share class. 22222222 Loan from Class B (GBP Hedged) ShareholdersLoan from Class B (GBP Hedged) ShareholdersLoan from Class B (GBP Hedged) ShareholdersLoan from Class B (GBP Hedged) Shareholders In December 2008, a loan agreement was entered into between the CB Richard Ellis Europe (ex-UK) Alpha Fund and Class B (GBP Hedged) shareholders for the purposes of ensuring that the CB Richard Ellis Europe (ex-UK) Alpha Fund has sufficient collateral to meet its obligations with respect to the currency hedging programme. A loan commitment of 13% of the shareholders original capital commitment was agreed at this time, amounting to GBP 33,547,039. During 2009 there was an extension of this loan commitment to 24% of the shareholders original commitment amounting to GBP 55,932,994. As of 31 December 2013 none of this commitment was drawn down (31 December 2012: Nil).

CB RICHARD ELLIS REAL ESTATE FUND OF FUNDS CB RICHARD ELLIS REAL ESTATE FUND OF FUNDS CB RICHARD ELLIS REAL ESTATE FUND OF FUNDS CB RICHARD ELLIS REAL ESTATE FUND OF FUNDS PUBLIC LIMITED COMPANYPUBLIC LIMITED COMPANYPUBLIC LIMITED COMPANYPUBLIC LIMITED COMPANY Annual report for the year ended 31 DecemberAnnual report for the year ended 31 DecemberAnnual report for the year ended 31 DecemberAnnual report for the year ended 31 December 2013201320132013 Notes to the Notes to the Notes to the Notes to the FFFFinancial Statements inancial Statements inancial Statements inancial Statements (Continued)(Continued)(Continued)(Continued)
Page 82
22223333 Related Party TransactionsRelated Party TransactionsRelated Party TransactionsRelated Party Transactions Under FRS 8 “Related Party Transactions” parties are related if any one party has the ability to control the other party or exercise significant influence over the other party in making financial or operational decisions. In October 2011, CBRE Group completed the acquisition of ING Group N.V.'s real estate investment management (ING REIM) operations in Europe. Accordingly, CBRE Property Central and Eastern Europe FGR, (formerly ING Central and Eastern European Fund II), has become a related party of the Company as the Fund Manager is since then an affiliate to CBRE group. However, given the nature of the merger, it could not have been anticipated that the CBRE Property Fund Central and Eastern Europe becomes an “in-house” fund at the time the investment was made. Refer to the statement of investments for details regarding this fund. On 28 September 2009 and 6 June 2013, the Company entered into a Shareholders’ Agreement with the investment manager, and certain employees thereof, to issue Class I (USD) shares to those employees at the par and current value of USD1 per share. The following are the Directors’ and their families interest in CB Richard Ellis Asia Alpha Plus Fund and CBRE GMM Asia Alpha Plus Fund III as at 31 December 2013 and as at 31 December 2012:
CB Richard Ellis Asia Alpha Plus FundCB Richard Ellis Asia Alpha Plus FundCB Richard Ellis Asia Alpha Plus FundCB Richard Ellis Asia Alpha Plus Fund
NameNameNameName Class B (USD) sharesClass B (USD) sharesClass B (USD) sharesClass B (USD) shares Class I (USD) sharesClass I (USD) sharesClass I (USD) sharesClass I (USD) shares
31 December 2013 31 December 2012 31 December 2013 31 December 2012
Stuart Savidge 171.28 167.90 80.00 80.00
CBRE GMM Asia CBRE GMM Asia CBRE GMM Asia CBRE GMM Asia Alpha Plus Fund IIIAlpha Plus Fund IIIAlpha Plus Fund IIIAlpha Plus Fund III
NameNameNameName Class Class Class Class MMMM (USD) shares(USD) shares(USD) shares(USD) shares Class Class Class Class IIII (USD) shares(USD) shares(USD) shares(USD) shares
31 December 2013 31 December 2012 31 December 2013 31 December 2012
Stuart Savidge 12,625.67 - 80.00 -
The Board of Directors are not aware of any transactions with connected persons during the year, other than those disclosed above and in note 5 and note 7 to the financial statements. 22224444 Soft CommissionsSoft CommissionsSoft CommissionsSoft Commissions There were no soft commission arrangements entered into by the Investment Manager on behalf of the Company during the year ended 31 December 2013 (31 December 2012: Nil).
CB RICHARD ELLIS REAL ESTATE FUND OF FUNDS CB RICHARD ELLIS REAL ESTATE FUND OF FUNDS CB RICHARD ELLIS REAL ESTATE FUND OF FUNDS CB RICHARD ELLIS REAL ESTATE FUND OF FUNDS PUBLIC LIMITED COMPANYPUBLIC LIMITED COMPANYPUBLIC LIMITED COMPANYPUBLIC LIMITED COMPANY Annual report for the year ended 31 DecemberAnnual report for the year ended 31 DecemberAnnual report for the year ended 31 DecemberAnnual report for the year ended 31 December 2013201320132013 Notes to the Notes to the Notes to the Notes to the FFFFinancial Statements inancial Statements inancial Statements inancial Statements (Continued)(Continued)(Continued)(Continued)
Page 83
22225555 Exchange RatesExchange RatesExchange RatesExchange Rates The exchange rates as at 31 December 2013 and as at 31 December 2012 are as follows:
31 December 2013 31 December 2012
EUR : GBP 0.8320 0.8111 USD : EUR 0.7257 0.7585 USD : HKD 7.7537 7.7509 USD : JPY 105.1049 86.4650 USD : AUD 1.1178 0.9632 USD : NZD 1.2150 1.2121 The average exchange rates for the year ended to 31 December 2013 and to 31 December 2012 are as follows: 31 December 2013 31 December 2012
USD : EUR 0.7533 0.7783 22226666 Significant EventsSignificant EventsSignificant EventsSignificant Events during the Yearduring the Yearduring the Yearduring the Year CBRE GMM Asia Alpha Plus Fund III launched on 6 June 2013. The total commitments by investors to Asia Alpha Plus Fund III amount to USD 120.7 million as of the date of approval of the Financial Statements. CB Richard Ellis Asia Alpha Plus sold its interest in the AMP Capital Fund in Quarter 2 2013 and sales proceeds totalling USD 15.5 million were distributed to investors. The Investment Manager further distributed USD 36.4 million (of which USD 20.5 million return of capital and USD 15.9 million dividends) resulting from partial realisations in the SCJREP IV Loan Fund and the ARA Asia Dragon Fund. During the year, CB Richard Ellis Europe (ex-UK) Alpha Fund paid an extraordinary distribution to its investors of EUR 11 million in June 2013. In addition to this, a return of capital of EUR 11.4million occurred in February 2013 followed by a second return of capital of EUR 10.0 million in December 2013. On 19 November 2013, the Prospectus and Sub-Fund supplements were updated to reflect amendments to the Investment Management Agreements for each of the Sub-Funds whereby the Investment Manager may be removed without cause by a vote of 75% of the Shareholders of a Sub-Fund. A notice to Shareholders detailing the changes was circulated 25 November 2013. 22227777 Significant Significant Significant Significant Post Balance Sheet EventsPost Balance Sheet EventsPost Balance Sheet EventsPost Balance Sheet Events
From 28 April 2014, the Company’s Listing Sponsor, Investec Capital & Investments (Ireland) Limited will transfer its listing business to Matheson Solicitors, who will become the Listing Sponsor of the Company.

CB RICHARD ELLIS REAL ESTATE FUND OF FUNDS CB RICHARD ELLIS REAL ESTATE FUND OF FUNDS CB RICHARD ELLIS REAL ESTATE FUND OF FUNDS CB RICHARD ELLIS REAL ESTATE FUND OF FUNDS PUBLIC LIMITED COMPANYPUBLIC LIMITED COMPANYPUBLIC LIMITED COMPANYPUBLIC LIMITED COMPANY Annual report for Annual report for Annual report for Annual report for the year ended 31 Decemberthe year ended 31 Decemberthe year ended 31 Decemberthe year ended 31 December 2013201320132013 AdministrationAdministrationAdministrationAdministration
Page 84
INVESTMENT MANAGERINVESTMENT MANAGERINVESTMENT MANAGERINVESTMENT MANAGER CBRE Global Collective Investors UK Limited Third Floor One New Change London, EC 4M 9AF United Kingdom
REGISTERED OFFICEREGISTERED OFFICEREGISTERED OFFICEREGISTERED OFFICE George’s Quay House 43, Townsend Street Dublin 2 Ireland
DIRECTORSDIRECTORSDIRECTORSDIRECTORS James McMahon (Independent Director, Ireland) Colm Luddy (CBRE, Ireland) James Cleary (Independent Director, Ireland) Laurie Romanak (CBRE Global Investors, United States) (until 28 May 2013) Paul Mundell (CBRE Global Investors, United Kingdom) (as from 23 August 2013) Stuart Savidge (CBRE Global Investors, United Kingdom)
COMPANY SECRETARYCOMPANY SECRETARYCOMPANY SECRETARYCOMPANY SECRETARY (as from(as from(as from(as from 30303030 January 201January 201January 201January 2013333)))) Dechert Secretarial Limited Ground Floor, Riverside Two Sir John Rogerson’s Quay Dublin 2 Ireland
COMPANY SECRETARYCOMPANY SECRETARYCOMPANY SECRETARYCOMPANY SECRETARY (until(until(until(until 29292929 January 201January 201January 201January 2013333)))) Wilton Secretarial Limited Fitz Wilton House Wilton Place Dublin 2 Ireland
ADMINISTRATOR, REGISTRAR AND TRANSFER AGENTADMINISTRATOR, REGISTRAR AND TRANSFER AGENTADMINISTRATOR, REGISTRAR AND TRANSFER AGENTADMINISTRATOR, REGISTRAR AND TRANSFER AGENT RBC Investor Services Ireland Limited George’s Quay House 43 Townsend Street Dublin 2 Ireland
CUSTODIANCUSTODIANCUSTODIANCUSTODIAN RBC Investor Services Bank S.A., Dublin Branch George’s Quay House 43 Townsend Street Dublin 2 Ireland
LEGAL COUNSEL LEGAL COUNSEL LEGAL COUNSEL LEGAL COUNSEL –––– UKUKUKUK Jones Day 21 Tudor Street London, EC4Y 0DJ United Kingdom
LEGAL COUNSEL LEGAL COUNSEL LEGAL COUNSEL LEGAL COUNSEL –––– IRELANDIRELANDIRELANDIRELAND (as from(as from(as from(as from 30303030 January 201January 201January 201January 2013333)))) Dechert Ground Floor, Riverside Two Sir John Rogerson’s Quay Dublin 2 Ireland
LEGAL COUNSEL LEGAL COUNSEL LEGAL COUNSEL LEGAL COUNSEL –––– IRELANDIRELANDIRELANDIRELAND ((((untiluntiluntiluntil 29292929 January 2013January 2013January 2013January 2013)))) William Fry Fitzwilton House Wilton Place Dublin 2 Ireland
INDEPENDENT AUDITORSINDEPENDENT AUDITORSINDEPENDENT AUDITORSINDEPENDENT AUDITORS Deloitte & Touche Chartered Accountants Deloitte & Touche House Earlsfort Terrace Dublin 2 Ireland
SPONSORING BROKER AND IRISH PAYING AGENTSPONSORING BROKER AND IRISH PAYING AGENTSPONSORING BROKER AND IRISH PAYING AGENTSPONSORING BROKER AND IRISH PAYING AGENT Investec Capital and Investments (Ireland) Limited The Harcourt Building Harcourt Street Dublin 2 Ireland