cavbench: a benchmark suite for connected and autonomous...
TRANSCRIPT

CAVBench: A Benchmark Suite for Connectedand Autonomous Vehicles
Yifan Wang∗†§, Shaoshan Liu‡, Xiaopei Wu†, Weisong Shi†∗SKL of Computer Architecture, Institute of Computing Technology, CAS, Beijing, China
†Department of Computer Science, Wayne State University, Michigan, USA‡PerceptIn, California, USA
§University of Chinese Academy of Sciences, Beijing, [email protected], [email protected], {xiaopei.wu, weisong}@wayne.edu
Abstract—Connected and autonomous vehicles (CAVs)have recently attracted a significant amount of attentionboth from researchers and industry fields. Numerous stud-ies targeting algorithms, software frameworks, and appli-cations on the CAVs scenario have emerged. Meanwhile,several pioneer efforts have focused on the edge computingsystem and architecture design for the CAVs scenarioand provided various heterogeneous platform prototypesfor CAVs. However, a standard and comprehensive ap-plication benchmark for CAVs is missing, hindering thestudy of these emerging computing systems. To addressthis challenging problem, we present CAVBench, the firstbenchmark suite for the edge computing system in theCAVs scenario. CAVBench is comprised of six typicalapplications covering four dominate CAVs scenarios andtakes four datasets as standard input. CAVBench pro-vides quantitative evaluation results via application andsystem perspective output metrics. We perform a seriesof experiments and acquire three systemic characteristicsof the applications in CAVBench. First, the operationintensity of the applications is polarized, which explainswhy heterogeneous hardware is important for a CAVscomputing system. Second, all applications in CAVBenchconsume high memory accesses bandwidth, so the systemshould be equipped with high bandwidth memory orleverage good memory bandwidth management to avoidthe performance degradation caused by memory band-width competition. Third, some applications have worsedata/instruction locality based on the cache miss observa-tion, so the computing system targeting these applicationsshould optimize the cache architecture. Last, we use theCAVBench to evaluate a typical edge computing platformand present the quantitative and qualitative analysis of thebenchmarking results.
I. INTRODUCTION
With the rapid development of computer vision, deeplearning, mobile communication and sensor technology,the functions of vehicles are no longer limited to drivingand transportation, but have gradually become an intel-ligent, connected, and autonomous system. We refer tothese advanced vehicles as connected and autonomousvehicles (CAVs). The evolution of the vehicles has givenrise to numerous new application scenarios, such asAdvanced Driver Assistance Systems (ADAS) or Au-tonomous Driving (AD) [1], [2], Internet of Vehicles
(IoV) [3] and Intelligent Transportation Systems (ITS)[4], etc. Especially for ADAS/AD scenarios, many in-dustry leaders have recently published their own au-tonomous driving systems, such as Google Waymo [5],Tesla Autopilot [6], and Baidu Apollo [7].
Under these scenarios, the CAVs system becomes atypical edge computing system [8], [9]. The CAVs com-puting system collects sensors data via the CAN bus andfeeds the data to on-vehicle applications. In addition, theCAVs system is not isolated in the network, so the CAVswill communicate with cloud servers [10], Roadside Unit(RSU) and other CAVs to perform some computing taskscollaboratively. Much research focusing on the edgecomputing on CAVs from the application aspect haveemerged [11]–[13]. There have also been some pioneerstudies about exploring the computing architecture andsystems for CAVs. NVIDIA R©DRIVETMPX2 is an AIplatform for autonomous driving that equips two dis-crete GPUs [14]. Liu et al. proposed their computingarchitecture for CAVs, which fully used hybrid hetero-geneous hardware (GPUs, FPGAs, and ASICs) [15].Unlike other computing scenarios, edge computing isstill a booming computing domain. However, to date, acomplete, dedicated benchmark suite to evaluate the edgecomputing platforms designed for CAVs is missing, bothin academic and industrial fields. This makes it difficultfor developers to quantify the performance of platformsrunning different on-vehicle applications, as well asto systematically optimize the computing architectureon CAVs or on-vehicle applications. To address thesechallenges, we propose CAVBench, the first benchmarksuite for edge computing systems on CAVs.
CAVBench is a benchmark suite for CAVs computingsystem performance. It takes six diverse real-world on-vehicle applications as evaluation workloads, coveringfour applications scenarios summarized in OpenVDAP:autonomous driving, real-time diagnostics, in-vehicleinfotainment and third-party applications [16]. The sixapplications that we have chosen are Simultaneous lo-calization and mapping (SLAM), object detection, object
1
tracking, battery diagnostics, speech recognition andedge video analysis. We collect four real-world datasetsfor CAVBench as the standard input to the six applica-tions, which include three types of data: image, audio,and text. CAVBench also has two categories of outputmetrics. One is application perspective metrics, whichincludes the execution time breakdown for each applica-tion, helping developers find the performance bottleneckin the application side. Another is system perspectivemetrics, which we called the quality of service-resourceutilization curve (QoS-RU curve). The QoS-RU curvecan be used to calculate the Matching Factor betweenthe application and the computing platform on CAVs.The QoS-RU curve can be considered as a quantitativeperformance index of the computing platform that helpsresearchers and developers optimize on-vehicle applica-tions and CAVs computing architecture. Furthermore,we analyze the characteristics of the applications inCAVBench. We observe the application information andconclude three basic features of the applications onCAVs. First, the CAVs applications types are diverse,and the real-time applications are dominated in CAVsscenarios. Second, the input data of CAVs applicationsis mostly unstructured. Third, deep learning applicationsin CAVs scenarios prefer end-to-end models. Then,we comprehensively characterize the six applications inCAVBench via several experiments. On a typical state-of-the-practice edge computing platform, we have thefollowing conclusions:
• The operation intensity of applications inCAVBench is polarized. The deep learningapplications have higher floating point operationintensity because the neural networks are their mainworkloads, which includes plenty of floating pointmultiplications and additions. As for computervision applications, the algorithms rely more onmathematical models, which contains lower floatingpoint operation intensity. Hence, the computingplatform in CAVs should contain heterogeneoushardware for the different applications.
• Similar to the traditional computing scenarios, theapplications in CAVBench need high memory ac-cess bandwidth. That will cause competition formemory bandwidth when multiple applications arerunning concurrently in real environments.
• On average, the CAVBench has a lower cache andTLB miss rate, which means the applications inCAVs scenarios have good data/instruction locality,but for specific workloads, some applications haveone or two higher miss rates. Thus, the computingsystems targeting these applications should valuethe optimization of the cache architecture and thedata/instruction locality to improve the applicationperformance.
Finally, we use the CAVBench to evaluate a typicaledge computing platform and present the quantitativeand qualitative evaluation results of this platform.
The remainder of this paper is organized as follows.In Section II, we discuss the related work. Section IIIsummarizes the methodology for designing CAVBenchand presents the overview and detailed components ofCAVBench. In Section IV, we analyze the characteristicsof the applications in CAVBench from different views.The experimental evaluation results of CAVBench areillustrated in Section V. Finally, we conclude our workin Section VI.
II. RELATED WORK
CAVBench is designed for evaluating the performanceof the computing architecture and system of connectedand autonomous vehicles. In this section, we summarizethe related work from two aspects: the CAVs computingarchitecture and system, and the benchmark suite relatedto CAVs.
A. Architecture and System for CAVs
Junior [17] was the first work to introduce a completesystem of self-driving vehicles, which included type andlocation of sensors, as well as software architecturedesign [18]. Junior presented dedicated and compre-hensive information about applications and a softwareflow diagram for autonomous driving. However, Juniorprovided less information about the computing systemon their self-driving vehicles.
Liu et al. proposed a computer architecture for au-tonomous vehicles which fully used hybrid heteroge-neous hardware [15]. In this work, the applicationsfor autonomous driving were divided into three stages:sensing, perception, and decision-making. They com-pared the performance of different hardware runningbasic autonomous driving tasks and concluded somerules to perform different tasks for dedicated hetero-geneous hardware. Lin et al. explored the architec-tural constraints and acceleration of autonomous drivingsystem in [19]. They presented a detailed comparisonof accelerating related algorithms using heterogeneousplatforms including GPUs, FPGAs, and ASICs. Theevaluation metrics included running latency and power,which will help developers build an end-to-end au-tonomous driving system that meets all design con-straints. OpenVDAP [16] proposed a vehicle computingunit, which contained a tasks scheduling frameworkand heterogeneous computing platform. The frameworkscheduled the tasks to specific acceleration hardware,according to task computing characteristics and hard-ware utilization. In the industrial field, there are sev-eral state-of-the-practice computing platforms designed
2

for CAVs, such as NVIDIA R©DRIVETMPX2 [14] andXilinx R©Zynq R©UltraScale+TMZCU106 [20].
These projects can be regarded as pioneering researchin exploring the computing architecture and systemsfor connected and autonomous vehicles from differentaspects. However, the evaluation method of these sys-tems lacks uniform standards; all the research groupschose application type and implementation from theirperspectives. Hence, it is challenging to evaluate andcompare these systems fairly and comprehensively.
B. Benchmark Suite Related to CAVs
There are many classic benchmark suites in the tradi-tional computing field, such as BigDataBench [21] forbig data computing, Parsec [22] for parallel computingand HPCC [23] for high-performance computing etc.However, for the computing scenario in CAVs, thebenchmark research work is still at the beginning stageand can be divided into two categories according to theircontents: datasets and workloads.
KITTI [1], [24] was the first benchmark datasetsrelated to autonomous driving. It comprised rich stereoimage data and 2D/3D object annotated data. Accordingto different data types, it also provided the dedicatedmethod to generate the ground truth and calculate theevaluation metrics. KITTI was built for evaluating theperformance of algorithms in the autonomous drivingscenario, including but not limited to optical flow esti-mation, visual odometry, and object detection. There aresome customized benchmark datasets for each algorithm,such as TUM RGB-D [25] for RGB-D SLAM, PAS-CAL3D [26] for 3D object detection and the MOTChal-lenge benchmark [27], [28] for multi-target tracking.These kinds of benchmark suites will help us choosethe implementations and datesets of CAVBench.
Another class of related benchmark suites used a setof computer vision kernels and applications to bench-mark novel hardware architectures. SD-VBS [29] andMEVBench [30] both are system performance bench-mark suites based on computer vision workloads indiversified fields. SD-VBS assembled 9 high-level visionapplications and decomposed them into 28 commoncomputer vision kernels. It also provided single-threadedC and MATLAB implementations of these kernels.MEVBench focused on a set of workloads related withvisual recognition applications including feature extrac-tion, feature classication, object detection and tracking,etc. MEVBench provided single- and multi-threadedC++ implementations for some of the vision kernels.However, these two benchmarks are prior works in thefield, so they are not targeted toward heterogeneous plat-forms such as GPUs. SLAMBench [31] concentrated onusing a complete RGB-D SLAM application to evaluatenovel heterogeneous hardware. It chose KinectFusion
[32] as the implementation and provided C++, OpenMP,OpenCL and CUDA versions of key function kernelsfor different platforms. The RGB-D cameras are moresuitable for indoor environments and the workload typein SLAMBench is single. These efforts are a step inthe right direction, but we still need a comprehensivebenchmark which contains diverse workloads that covervaried application scenarios of CAVs to evaluate theCAVs system as we mentioned above.
III. BENCHMARK DESIGN
The objective of developing CAVBench is to helpdevelopers determine if a given computing platform iscompetent for all CAVs scenarios. This section presentsthe methodology, overview, and components of ourCAVBench.
A. Methodology and Overview
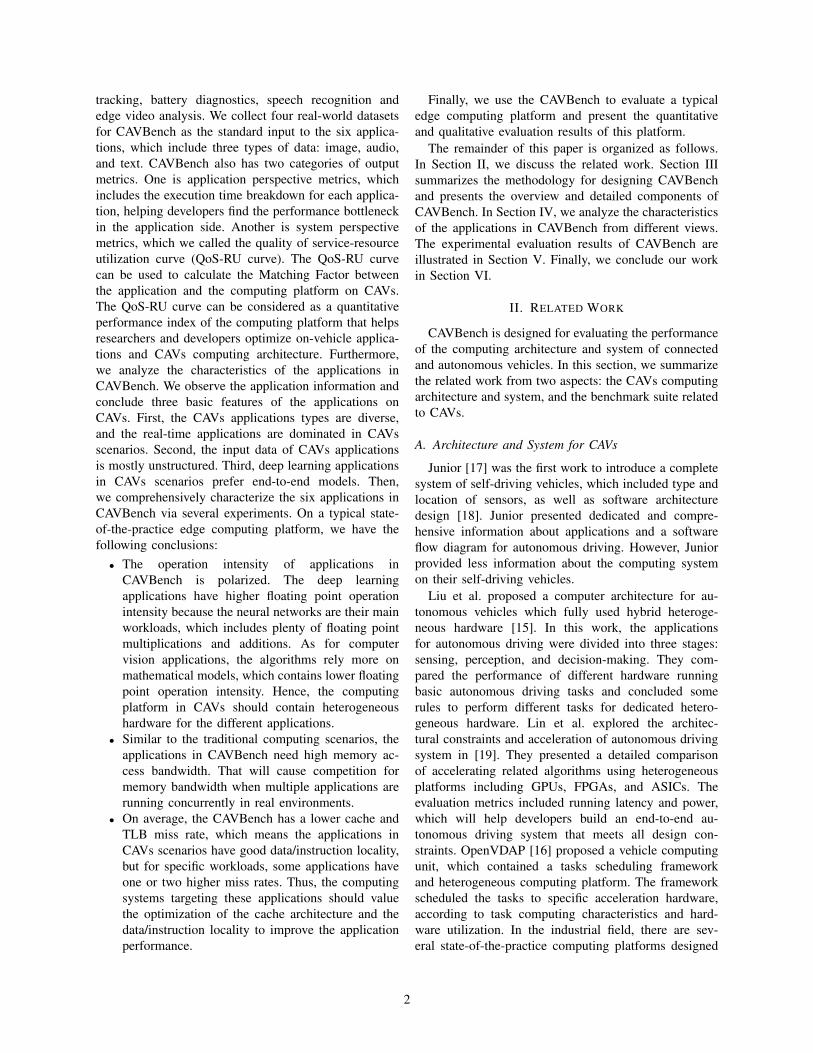
Combined with the survey and analysis of the relatedworks on CAVs architectures and systems and existingbenchmark suites, we present our methodology for de-signing CAVBench as shown in Figure 1. The computingand application scenarios of connected and autonomousvehicles are much different from the traditional domain.First, we investigate the typical application scenarios ofCAVs. It is well-known that Advanced Driver-AssistantSystems (ADAS) and Autonomous Driving (AD) havealready become a dominant application scenario of CAVs[1], [18], [33], [34]. In addition to ADAS/AD, Open-VDAP summarizes three other scenarios which are Real-time Diagnostics (RD), In-Vehicle Infotainment (IVI)and Third-Party Application (TApp) [16]. Thus, we focuson the exemplary and key applications in each dominantscenario.
The tasks in the ADAS/AD scenario can be dividedinto three stages according to their functions: sensing,perception, and decision-making [15]. Sensing tasksmanage and calibrate the various sensors around theCAVs and provide reliable sensing data to upper-leveltasks. Perception tasks take the sensing data as the inputand output the surrounding information to the decision-making tasks, which in turn generate a safe and efficientaction plan in real time. It can be seen that perceptionis an important connecting link between sensing anddecision-making. The three main perception tasks aresimultaneous localization and mapping (SLAM), objectdetection, and object tracking, which are all visual-basedapplications. Many studies take them as the vital parts inthe autonomous driving pipeline [1], [19], [35]. Hence,we chose these three applications in the ADAS/ADscenario.
Vehicle system fault diagnostics and prognosis isimportant for keeping vehicles stable and safe [36]. Withthe development and widespread use of electric and
3
Typical CAVsApplicationScenarios
Implementation:• Open source;• Diverse domains;• Real production
environments;
Datasets:• Image data;• Audio data;• Text data;
CAVBench: ABenchmark
Suite for CAVs
Applications:• SLAM;• Object Detection;• Object Tracking;• Vehicle Diagnostics;• Speech Recognition;• Edge Video Analysis
Scenarios:• Autonomous Driving;• Real-time Diagnostics;• In-Vehicle Infotainment;• Third-Party Application;
Diverse and KeyCAVs Applications
Output Metrics:• Apps perspective;• System perspective;
Fig. 1. CAVBench Methodology.
hybrids vehicles, the health monitoring and diagnosticsof Li-ion batteries in these vehicles have received in-creasingly more attention [37]. It is extremely importantto monitor and predict the battery status in a real-timefashion, including multiple parameters of each batterycell, e.g., voltage, current, temperature, and so on. Thus,battery diagnostics will be the application chosen in theRD scenario.
The In-Vehicle infotainment (IVI) scenario includes awide range of applications that provide audio or videoentertainment. Compared with manual interaction, thespeech-based interaction method reduces the distractionof drivers and ensures driving safety [38], so motor com-panies have increasingly begun to develop their own IVIsystems with speech recognition such as Ford R© SYNC R©
[39]. We choose speech recognition applications for theIVI scenario.
There are some preliminary projects for the third-party application scenario. PreDriveID [40] is a driveridentification application based on in-vehicle data. It canenhance vehicle safety by detecting whether the driveris registered or not through by analyzing how a driveroperates a vehicle. A3 [41] is an edge video analysisapplication which uses a vehicle onboard camera torecognize targeted vehicles to enhance the AMBER alertsystem. It is easier to acquire the data from an onboardcamera than the vehicle bus data, and edge video analysiscould well be a killer application for edge computing[42], so we choose this kind of application for the TAppscenario.
After selecting the six applications, we pay attentionto the implementation, data sets and output metrics forthe applications. The implementation of each applicationshould be state-of-the-art and representative, ensuringthat it can be deployed in a real production environment.We provide real-world data sets for each applicationwhich are open source or collected by ourselves to letthe applications have a standard input. To give the user
a complete understanding of the benchmark results, theoutput metrics contain two categories: application per-spective metrics and system perspective metrics. Thesethree parts (implementation, data sets and output metrics)form the CAVBench and will be introduced in detail inthe next three subsections, respectively.
B. Implementation
The implementation we chose in CAVBench is shownin Table I. The reasons for choosing these implementa-tions are presented as follows.
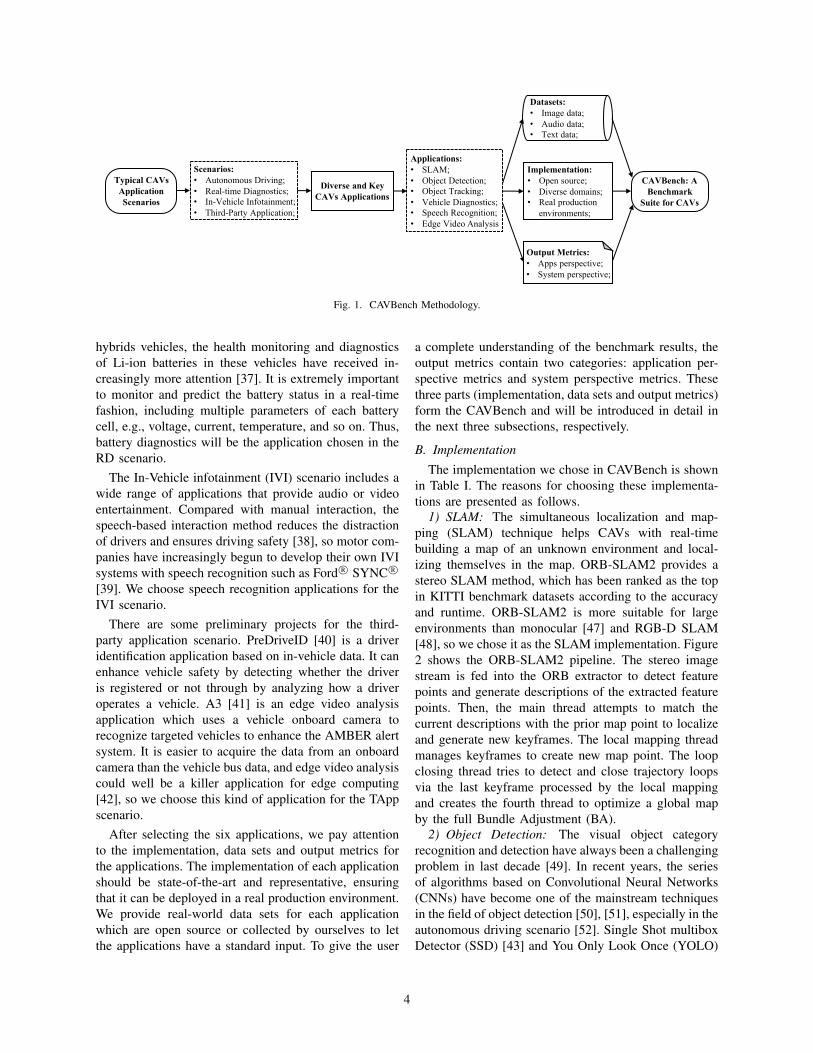
1) SLAM: The simultaneous localization and map-ping (SLAM) technique helps CAVs with real-timebuilding a map of an unknown environment and local-izing themselves in the map. ORB-SLAM2 provides astereo SLAM method, which has been ranked as the topin KITTI benchmark datasets according to the accuracyand runtime. ORB-SLAM2 is more suitable for largeenvironments than monocular [47] and RGB-D SLAM[48], so we chose it as the SLAM implementation. Figure2 shows the ORB-SLAM2 pipeline. The stereo imagestream is fed into the ORB extractor to detect featurepoints and generate descriptions of the extracted featurepoints. Then, the main thread attempts to match thecurrent descriptions with the prior map point to localizeand generate new keyframes. The local mapping threadmanages keyframes to create new map point. The loopclosing thread tries to detect and close trajectory loopsvia the last keyframe processed by the local mappingand creates the fourth thread to optimize a global mapby the full Bundle Adjustment (BA).
2) Object Detection: The visual object categoryrecognition and detection have always been a challengingproblem in last decade [49]. In recent years, the seriesof algorithms based on Convolutional Neural Networks(CNNs) have become one of the mainstream techniquesin the field of object detection [50], [51], especially in theautonomous driving scenario [52]. Single Shot multiboxDetector (SSD) [43] and You Only Look Once (YOLO)
4
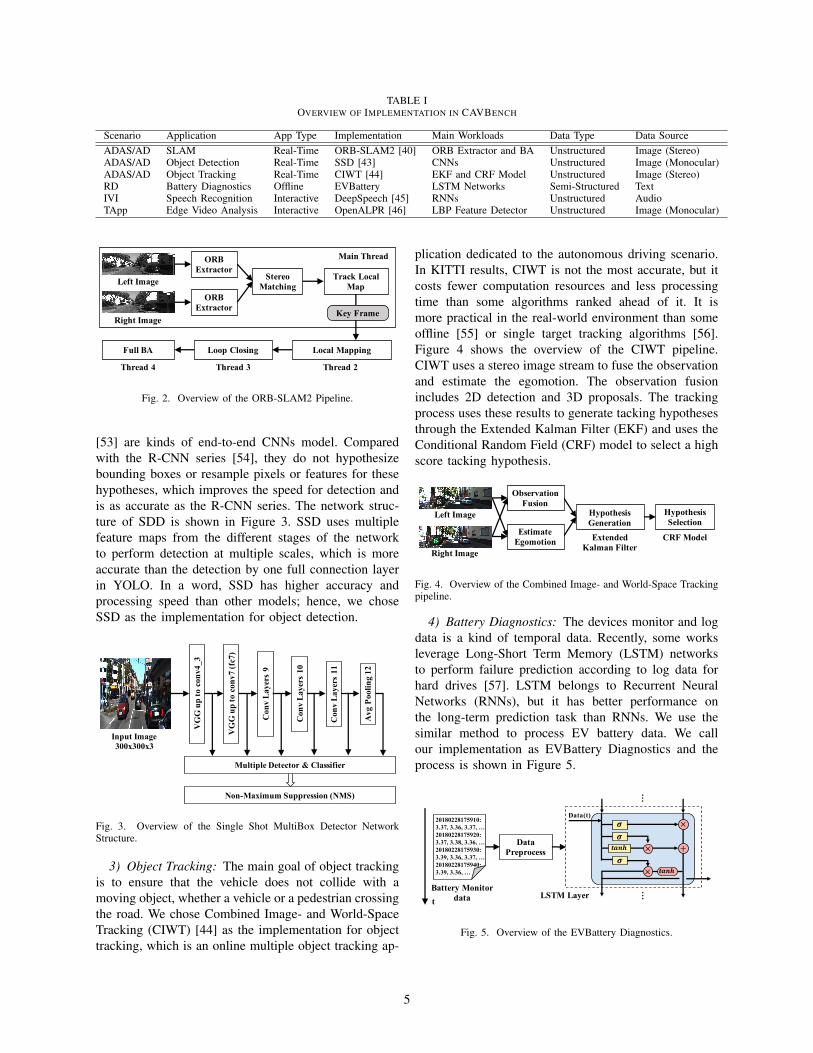
TABLE IOVERVIEW OF IMPLEMENTATION IN CAVBENCH
Scenario Application App Type Implementation Main Workloads Data Type Data SourceADAS/AD SLAM Real-Time ORB-SLAM2 [40] ORB Extractor and BA Unstructured Image (Stereo)ADAS/AD Object Detection Real-Time SSD [43] CNNs Unstructured Image (Monocular)ADAS/AD Object Tracking Real-Time CIWT [44] EKF and CRF Model Unstructured Image (Stereo)RD Battery Diagnostics Offline EVBattery LSTM Networks Semi-Structured TextIVI Speech Recognition Interactive DeepSpeech [45] RNNs Unstructured AudioTApp Edge Video Analysis Interactive OpenALPR [46] LBP Feature Detector Unstructured Image (Monocular)
ORBExtractor
StereoMatching
Local Mapping
ORBExtractor
Track LocalMap
Loop ClosingFull BA
Left Image
Right ImageKey Frame
Main Thread
Thread 2Thread 3Thread 4
Fig. 2. Overview of the ORB-SLAM2 Pipeline.
[53] are kinds of end-to-end CNNs model. Comparedwith the R-CNN series [54], they do not hypothesizebounding boxes or resample pixels or features for thesehypotheses, which improves the speed for detection andis as accurate as the R-CNN series. The network struc-ture of SDD is shown in Figure 3. SSD uses multiplefeature maps from the different stages of the networkto perform detection at multiple scales, which is moreaccurate than the detection by one full connection layerin YOLO. In a word, SSD has higher accuracy andprocessing speed than other models; hence, we choseSSD as the implementation for object detection.
VG
Gup
toco
nv4_
3
VG
Gup
toco
nv7
(fc7
)
Con
vLa
yers
9
Con
vLa
yers
10
Con
vLa
yers
11
Avg
Pool
ing
12
Multiple Detector & Classifier
Non-Maximum Suppression (NMS)
Input Image300x300x3
Fig. 3. Overview of the Single Shot MultiBox Detector NetworkStructure.
3) Object Tracking: The main goal of object trackingis to ensure that the vehicle does not collide with amoving object, whether a vehicle or a pedestrian crossingthe road. We chose Combined Image- and World-SpaceTracking (CIWT) [44] as the implementation for objecttracking, which is an online multiple object tracking ap-
plication dedicated to the autonomous driving scenario.In KITTI results, CIWT is not the most accurate, but itcosts fewer computation resources and less processingtime than some algorithms ranked ahead of it. It ismore practical in the real-world environment than someoffline [55] or single target tracking algorithms [56].Figure 4 shows the overview of the CIWT pipeline.CIWT uses a stereo image stream to fuse the observationand estimate the egomotion. The observation fusionincludes 2D detection and 3D proposals. The trackingprocess uses these results to generate tacking hypothesesthrough the Extended Kalman Filter (EKF) and uses theConditional Random Field (CRF) model to select a highscore tacking hypothesis.
Left Image
Right Image
Hypothesis Generation
Hypothesis Selection
ObservationFusion
EstimateEgomotion Extended
Kalman FilterCRF Model
Fig. 4. Overview of the Combined Image- and World-Space Trackingpipeline.
4) Battery Diagnostics: The devices monitor and logdata is a kind of temporal data. Recently, some worksleverage Long-Short Term Memory (LSTM) networksto perform failure prediction according to log data forhard drives [57]. LSTM belongs to Recurrent NeuralNetworks (RNNs), but it has better performance onthe long-term prediction task than RNNs. We use thesimilar method to process EV battery data. We callour implementation as EVBattery Diagnostics and theprocess is shown in Figure 5.
DataPreprocess
20180228175910:3.37, 3.36, 3.37, …20180228175920:3.37, 3.38, 3.36, …20180228175930:3.39, 3.36, 3.37, …20180228175940:3.39, 3.36, …
Battery Monitordatat
𝝈𝝈𝒕𝒂𝒏𝒉 ×
×
×
+𝝈
𝒕𝒂𝒏𝒉
……
Data(t)
LSTM Layer
Fig. 5. Overview of the EVBattery Diagnostics.
5

5) Speech Recognition: Voice service generally con-sists of two steps: speech to text and text to intent,with the former being the process of speech recognition.DeepSpeech [45] is an end-to-end speech recognitionalgorithm based on RNNs. The deep learning methodsupersedes traditional processing stages in speech recog-nition systems, such as those that have been hand-engineered. Figure 6 shows the DeepSpeech networkstructure. The first three and the fifth layers in Deep-Speech have the basic NNs structure. The fourth layeris a bi-directional recurrent layer which is used tocharacterize the temporal correlation of the voice data.The evaluation results show that DeepSpeech has lesslatency and error rates than traditional methods basedon Hidden Markov Model (HMM) [58], especially innoisy environments. Therefore, DeepSpeech is a suitableimplementation for speech recognition.
Voice fc1, fc2, fc3 Bi-DirectionalRecurrent Layer 4
…
…Forw
ard
Bac
kwar
d… …
fc5t
Fig. 6. Overview of the DeepSpeech Network Structure.
6) Edge Video Analysis: As we mentioned above,AMBER Alert Assistant (A3) is a typical edge videoanalysis application that takes OpenALPR [46] as thecore workload to detect target vehicles in the video. TheOpenALRP pipeline is shown in Figure 7. OpenALRPis a classic implementation of automatic license platerecognition, including several typical computer visionmodules: LBP detector, image deskew and ORC. There-fore, we chose OpenALPR as the implementation ofedge video analysis.
LicensePlate
Detection
ImageDeskew
CharacterAnalysis
CharacterSegment & OCR
LBP DetectorImage
Fig. 7. Overview of the OpenALPR Pipeline.
C. Datasets
To guarantee that the evaluation results are similar torunning in the real environment, we need to choose areal-world, not a synthetic, dataset for each application.Table II shows the basic information of the datasets we
TABLE IITHE SUMMARY OF DATASETS IN CAVBENCH
Application Datasets Data Size and TypeSLAM KITTI VO/SLAM
Datasets [24]21 sequencesstereo grayscaleimage
Object Detection KITTI ObjectDetection Datasets[24]
7518 monocularcolor image
Object Tracking KITTI ObjectTracking Datasets[24]
28 sequencesstereo color image
Battery Diagnostics EV Battery Moni-tor Data
30 days batterymonitor data,160000 rows
Speech Recognition Mozilla Corpus[59]
3995 valid humanvoice data
Edge Video Analysis Images of Vehicleswith License Plates
1000 monocularcolor image
have chosen. It must be noted that we collected thedatasets of Battery Diagnostics and Edge Video Analysisbecause of the lack of relative open source datasets orsome datasets did not meet our real-world requirements.
1) KITTI Datasets [24]: As mentioned in Section II,KITTI provides rich, open source and real-world imagedata for different autonomous driving applications. Theimage characteristics varies, because each dataset fo-cuses on one specific application. Each dataset containsvarious traffic scenes which can evaluate the applicationperformance comprehensively.
2) EV Battery Monitor Data: There are few datasetsthat provide vehicle battery monitoring data. We collectthe battery monitoring data of an electric vehicle in thereal environment for one month. Each record of the datacontains 60 items, such as voltage and temperature.
3) Mozilla Corpus [59]: The Mozilla corpus provides3995 valid common voice files for testing. Each file isa record in which a person reads a common sentence,and records are collected by numerous people readingdifferent sentences. It must be noted that the Mozillacorpus still has some limitations. It was collected in adaily environment, so it may not contain words that areused in the vehicular setting and may not have enoughbackground noise that is likely to be very common in avehicular environment.
4) Images of Vehicles with License Plates: The im-ages in KITTI datasets could not meet the resolutionrequirement of performing license plate recognition, andsome license plate datasets are not collected by a vehicleonboard camera. Thus, we use the Leopard R© LI-USB30-AR023ZWDRB video camera [60] with a 25mm lenswhich was suggested by the Apollo project [7] to collectimage data in real traffic scenes. Each image we providedcontains at least one vehicle with its license plate.
6

D. Output Metrics
The Output metrics show quantitatively whether thegiven hardware platform can be used for CAVs scenariosor not. In CAVBench, the output metrics contain twoparts: application perspective metrics and system per-spective metrics.
1) Application Perspective Metric: Like some tra-ditional benchmark suites, the application perspectivemetric shows the running time of each application.For computer vision applications (ORB-SALM2, CIWT,and OpenALPR), we output the average latency foreach module in the applications, and we provide theaverage and tail latency for deep learning applications(SSD, EVBattery, and DeepSpeech). This metric helpsdevelopers optimize the platform in term of applications.
2) System Perspective Metric: For the system per-spective metric, we call it the quality of service-resourceutilization curve (QoS-RU curve). We evaluate the QoSof each application under different system resource allo-cations and draw the QoS-RU curve for each system re-source (CPU utilization, memory footprint, and memorybandwidth, etc.). Figure 8 shows an example of the QoS-RU curve. We use the area under the curve of each sys-tem resource to calculate the Matching Factor betweenthe application and the platform, indicating whether theplatform is suitable for the CAVs application. Followingis our approach to calculate the Matching Factor:
We denote the area under the curve of each systemresource as Ai, and we take the weighted average of eacharea as the Matching Factor M , as Equation 1 shows.
M =
n∑i=1
(wi ·Ai) (1)
The weight for each resource wi can be calculated byEquation 2, in which the n is the number of systemresources we considered.
wi = (1−Ai)/n∑
i=1
(1−Ai) (2)
We notice that the wi is the normalized 1 − Ai. If theAi is large, the resource i is relatively sufficient for theapplication. Similarly, if the Ai is small, the resource ihas the potential to be the bottle-neck of the platform.Thus, the Ai and its weight have opposite values, whichis why we chose the normalized 1−Ai as the weight.
A more detailed explanation of the output metrics willbe presented in Section V.
IV. BENCHMARK CHARACTERIZATION
In this section, we present the detailed description ofthe experiments of our CAVBench workload characteri-zation analysis.
0 0.1 0.2 0.3 0.4 0.5 0.6 0.7 0.8 0.9 1
Resource Utilization Rate
0
0.2
0.4
0.6
0.8
1
Qu
an
tity
of
Serv
ice
CPU Utilization
Memory Bandwidth
Memory Footprint
Disk I/O Bandwidth
Network I/O Bandwidth
Fig. 8. An example of QoS-RU Curve.
A. Overview
Before we did the characterization analysis exper-iments, we first observed the information of the sixapplications presented in Table I to conclude some basicfeatures of the applications in CAVs scenarios. Theobservations are described as follows:
1) Real-Time Applications are Dominant: The ap-plication types in the CAVs computing scenarios arediverse, including real-time, offline and interactive. Thisdiversity corresponds to cloud computing and the bigdata computing domain [21]. In contrast to traditionalcomputing fields, real-time applications are dominant inCAVs, and they all belong to the ADAS/AD scenario.Furthermore, the applications in other scenarios areoffline and interactive. That explains why ADAS/ADapplications always have the highest priority.
2) Unstructured Data Type: The input data type ofCAVs applications is mostly unstructured data. As wementioned above, CAVs is a typical embedded and edgecomputing system, and it deploys various sensors tocollect information from the real physical world, anduses the information (data) to execute computation tasks.Therefore, the input data is generally unstructured, suchas images and audios. Even for vehicle monitor data, itusually has little structural constraints, so we consider itas semi-structured data. As for cloud computing, thereare still some classic workloads that use the structureddata, for example, the relational query operation.
3) End-to-End Deep Learning Workloads: Accordingto the classification of the main workloads in CAVBench,we find that the workloads in CAVs all belong tocomputer vision, machine learning, and the deep learningdomain because the main functions of the applicationsin CAVs are detection, recognition, and prediction. Inaddition, due to the limitation of latency, deep learningworkloads in CAVs choose end-to-end models, whichmeans that with the exception of deep neural networks,there are no other processes between input and output;this improves the running speed while not decreasing thealgorithm accuracy.
[Insights] These three observations can be regarded asthe basic characteristics of the applications in the CAVs
7

TABLE IIIEDGE COMPUTING PLATFORM CONFIGURATIONS
Platform Intel Fog NodeCPU Intel Xeon E3-1275 v5
Number of Sockets 1Core(s) per Socket 4Thread(s) per Core 2
Architecture X86 64L1d cache 4×32KBL1i cache 4×32KBL2 cache 4×256KBL3 cache 8MBMemory 32GB SODIMM 3122 MHz
Disk 256GB PCIe SSD
computing scenario. We can conclude some insightsregarding the CAVs computing system and applicationsdesign. First, real-time applications have the highestpriority in real production environments, so the CAVssystem should contain a task scheduling framework toensure that the real-time applications can be allocatedwith enough computing resources. Second, preprocess-ing the unstructured data consumes more time, so a hard-ware accelerator aimed at transforming the unstructureddata to structured will be a benefit to the performanceof the whole CAVs system. Third, the end-to-end deeplearning algorithm reduces the number and frequencyof data movements (main memory to GPUs memory),decreasing the processing latency. Thus, this kind ofalgorithm will be more suitable for CAVs applications.
B. Experiments Configurations
To obtain insights regarding application characteristicsin CAVBench, we ran the six applications in a typicaledge device, and use the Linux profiling tool Perf to col-lect the behaviors of the applications at the architecturelevel. We chose Intel R© Fog Reference Design (FRD) asthe experiment platform, which has one Xeon R© E3-1275v5 processor equipped with 32GB DDR4 memory and256GB PCIe SSD. The processor has four physical cores,and hyper-threading is enabled. Other detailed informa-tion of the platform is shown in Table III. The operatingsystem is Ubuntu 16.04 with Linux kernel 4.13.0. Thedeep learning applications are built on TensorFlow 1.5.0,and some visual modules are implemented on OpenCV3.3.1. To acquire the pure and original characteristicsof the applications, the platform is not equipped withheterogeneous devices. Each application executes for500 seconds, sequentially processing different data.
C. Operation Intensity
First, we analyzed the operation intensity ofCAVBench via the instruction breakdown of each ap-plication in CAVBench. As shown in Figure 9, thedistribution of the instructions is diverse, even polarized.
The difference is mainly due to floating point instruction(FL). The average proportion of floating point instructionin CAVBench is 20.77%, and the average ratio of integerinstructions (Int) to FL is 24.44. However, for eachapplication, the minimum and maximum FL proportionis 0.38% (CIWT) and 48.89% (SSD), and the minimumand maximum Int/FL ratio is 0.63 (SSD) and 79.59(OpenALPR). In addition, the average FL proportion forBigDataBench, HPCC and Parsec are 2.12%, 24.11%,and 18.25%, respectively. The instruction distributionin CAVBench is similar to HPCC, Parsec according tothe average values, but the distribution is also polarizedwhen investigating specific applications in CAVBench.In contrast, the distribution of each workload in thetraditional benchmark is comparable, such as the resultspresented in BigDataBench [21].
In order to characterize the computation behaviors, wecalculated the ratio of computation to memory accessfor each application, which represents the integer andfloating point operation intensity. As shown in Figure10, the floating point operation (FLO) intensity of eachapplication in CAVBench is still polarized, and the mini-mum and maximum values are 0.0079 (CIWT) and 5.46(SSD),respectively, which differ by about three orders ofmagnitude. As for integer operation (IntO) intensity, theminimum and maximum values are 0.28 (CIWT) and1.80 (SSD), and the IntO intensity for BigDataBench,HPCC and Parsec are 0.52, 0.43 and 1.50, respectively.Hence, the IntO intensity of CAVBench is almost inthe same order of magnitude as those of the otherbenchmarks.
[Insights] According to operation intensity experi-ments, we can draw an important conclusion: the op-eration intensity of applications in the CAVs scenariois polarized. Deep learning applications, such as SSDand DeepSpeech, have higher floating point operationintensity, which is similar to the workloads in thehigh-performance computing domain. That is becausethe neural networks are the main workloads in deeplearning applications, which includes a large numberof matrix operations, causing plenty of point operation
0%
10%
20%
30%
40%
50%
60%
70%
80%
90%
100%
ORB-SLAM2
SSD
CIWT
EVBattery
DeepSpeech
OpenALPR
BigDataBench
HPCC
Parsec
IntegerFPBranchLoadStore
Fig. 9. Instruction Breakdown.
8
0.001
0.01
0.1
1
10
OR
B-SL
AM
2
SSD
CIW
T
EVB
atte
ry
Dee
pSpe
ech
Ope
nALP
R
BigD
ataB
ench
HPC
C
Pars
ec
Integer Operations/Byte Floating Point Operations/Byte
Fig. 10. Integer and Floating Point Operation Intensity.
multiplications and additions. As for computer visionapplications, the algorithms rely more on mathematicalmodeling, and the computation is not so high; thus,they have lower floating point operation intensity. Thisphenomenon explains why modern CAVs computingplatforms leverage heterogeneous hardware to acceleratesome tasks. The state-of-the-practice CPUs provide SSE,AVX instructions for floating point operations, but theperformance does not yet match that of the GPUs.
D. Memory Behavior
Memory is a very important part of the computer sys-tem; the memory wall problem exists in many computingdomains. Therefore, we further investigated the memorybehaviors of CAVBench. Our experiments included threeparts: memory bandwidth, memory footprint, and cachebehavior, which we discuss below:
Due to the restriction of the hardware function in theprocessor, we cannot monitor memory access bandwidthdirectly, so we use Perf tools to acquire the indirectmemory access bandwidth. The measuring method willlead to some errors, but it can still help us analyze
0 50 100 150 200 250 300 350 400 450 500 550
Time (s)
0
2
4
6
8
10
12
14
16
Mem
ory
Ba
nd
wid
th (
GB
/s)
ORB-SLAM2
SSD
CIWT
EVBattery
DeepSpeech
OpenALPR
Fig. 11. Memory Access Bandwidth Behaviors.
the memory access behaviors of each application inCAVBench.
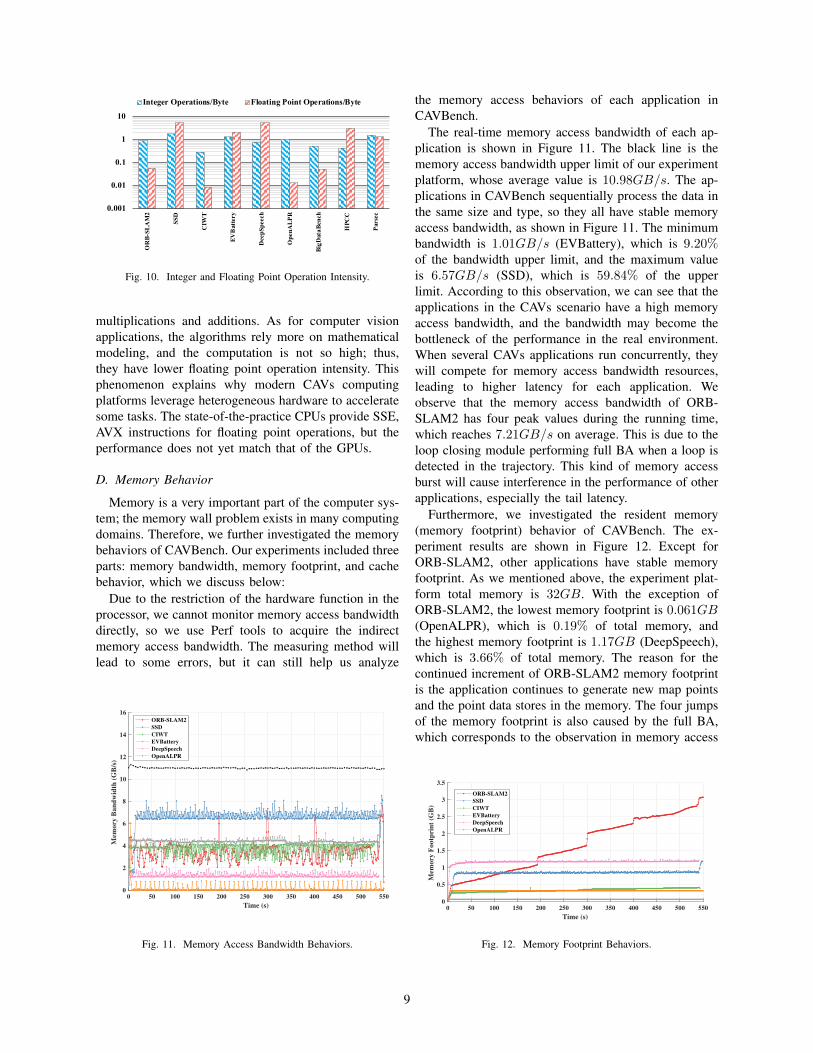
The real-time memory access bandwidth of each ap-plication is shown in Figure 11. The black line is thememory access bandwidth upper limit of our experimentplatform, whose average value is 10.98GB/s. The ap-plications in CAVBench sequentially process the data inthe same size and type, so they all have stable memoryaccess bandwidth, as shown in Figure 11. The minimumbandwidth is 1.01GB/s (EVBattery), which is 9.20%of the bandwidth upper limit, and the maximum valueis 6.57GB/s (SSD), which is 59.84% of the upperlimit. According to this observation, we can see that theapplications in the CAVs scenario have a high memoryaccess bandwidth, and the bandwidth may become thebottleneck of the performance in the real environment.When several CAVs applications run concurrently, theywill compete for memory access bandwidth resources,leading to higher latency for each application. Weobserve that the memory access bandwidth of ORB-SLAM2 has four peak values during the running time,which reaches 7.21GB/s on average. This is due to theloop closing module performing full BA when a loop isdetected in the trajectory. This kind of memory accessburst will cause interference in the performance of otherapplications, especially the tail latency.
Furthermore, we investigated the resident memory(memory footprint) behavior of CAVBench. The ex-periment results are shown in Figure 12. Except forORB-SLAM2, other applications have stable memoryfootprint. As we mentioned above, the experiment plat-form total memory is 32GB. With the exception ofORB-SLAM2, the lowest memory footprint is 0.061GB(OpenALPR), which is 0.19% of total memory, andthe highest memory footprint is 1.17GB (DeepSpeech),which is 3.66% of total memory. The reason for thecontinued increment of ORB-SLAM2 memory footprintis the application continues to generate new map pointsand the point data stores in the memory. The four jumpsof the memory footprint is also caused by the full BA,which corresponds to the observation in memory access
0 50 100 150 200 250 300 350 400 450 500 550
Time (s)
0
0.5
1
1.5
2
2.5
3
3.5
Mem
ory
Fo
otp
rin
t (G
B)
ORB-SLAM2
SSD
CIWT
EVBattery
DeepSpeech
OpenALPR
Fig. 12. Memory Footprint Behaviors.
9

02468
101214161820
ORB-SLAM2 SSD CIWT EVBattery DeepSpeech OpenALPR CAVBench
L1I Misses L2 Misses L3 Misses
(a) Cache Behaviors
0
0.1
0.2
0.3
0.4
0.5
0.6
ORB-SLAM2 SSD CIWT EVBattery DeepSpeech OpenALPR CAVBench
ITLB Misses DTLB Misses
(b) TLB Behaviors
Fig. 13. Cache and TLB Behaviors.
bandwidth experiment. The maximum memory footprintof ORB-SLAM2 is 3.07GB (9.59%). We can concludethat the applications in the CAVs scenario consume lessmemory footprint, and the large capacity memory isavailable for the edge computing platform, so the CAVsapplication performance will not be constrained by thememory footprint.
Finally, we investigated the cache behaviors ofCAVBench to see that the memory hierarchy architec-ture in the state-of-the-practice edge platform is properfor CAVs applications. The cache behavior and TLBbehavior of each application are shown in Figure 13.The CAVBench average L1i, L2 and L3 cache MPKI(Misses Per Kilo Instructions) are 4.86, 5.44, and 2.51,respectively, which are almost in the same order ofmagnitude as HPCC (0.41, 5.59, and 4.22) and Parsec(3.51, 7.25, and 3.37), respectively. The TLB behaviorof CAVBench is also similar to HPCC and Parsec. Ac-cording to this observation, we find that the applicationsin CAVBench have good data and instruction locality.These characteristics differ from the big data computing,which has a huge code size and deep software stackleading to higher MPKI.
Focusing on specific applications, ORB-SLAM2, EV-Battery, and DeepSpeech have a higher MPKI than theother three. The ORB-SLAMS have high L1i MPKIand DTLB MPKI. We infer that this phenomenon isstill caused by the periodic loop detection operation andirregular full BA operation. The loop closing modulequeries the local map database periodically to detect the
potential trajectory loop. The DLTB has less capacityto store all the page tables of the local map database,causing the high DTLB miss rate, and the irregularfull BA operation interferes with the instruction locality,increasing the L1i cache miss rate. As for EVBatteryand DeepSpeech, we infer that the RNNs structure leadsto a high cache miss rate. The convolution operations inCNNs make the data and instruction localized, which iswhy SSD does not have a high cache miss rate, but theRNNs do not have such convolution operations.
[Insights] According to the memory experiments, wecan draw some important conclusions: First, applicationsin the CAVs scenario consume high memory accessbandwidth, which will be a performance bottleneck whenmultiple applications run concurrently in real environ-ments. Second, the memory footprint of each applicationtakes a very low proportion of the total memory in thestate-of-the-practice edge computing platform. Third, onaverage, the applications in the CAVs scenario have gooddata and instruction locality. This characteristic is similarto the workload in high-performance computing and theparallel computing domain. As for specific applications,the SLAM and RNNs model based applications have ahigher probability to increase the cache and TLB missrate. Therefore, with the CAVs computing system payingmore attention to these applications, we should focuson the optimization of the cache architecture and theapplication data/instruction locality.
V. EVALUATION
We use the CAVBench to evaluate our typical edgecomputing platform; its configurations are presented inSection IV. The evaluation results are presented in thissection.
A. Latency Results
First, we present the application perspective metrics(latency) of the platform in Figure 14. According to theresults, we find this platform has a good performance interms of the computer vision applications; the averageFPS (Frame Per Second) of ORB-SLAM2, CIWT andOpenALPR are 12.5, 6.67 and 8.83, respectively. Theprocessing speed of these applications is near-acceptablein the real environment. Please note that the latency ofMapping, Loop Closing, and Full BA is quite high, butthese modules are not executed for each frame, and theyrun in different threads, so the latency of these functionsis negligible to the average latency.
However, the performance of deep learning applica-tions is not as good as computer vision applications.The FPS of SSD is only 2.55, which is unacceptable inthe real autonomous driving scenario, and the averagelatency of EVBattery and DeepSpeech are 0.21s and3.74s, respectively. The latency of DeepSpeech is much
10

0.06 0.02 0.26
1.41
0.08 0
0.20.40.60.8
11.21.4
ORBExtractor
Tracking Mapping LoopClosing
Full BA Mean
Tim
e(s)
6.87
(a) ORB-SLAM2
0.08
0.01 0.04
0.10
0.15
0
0.05
0.1
0.15
0.2
Egomotion Fusion HypothesisGeneration
HypothesisSelection
Mean
Tim
e(s)
(b) CIWT
0.0528
0.0024 0.0002 0.0111
0.1133
00.02
0.04
0.06
0.08
0.10.12
LBPDetector
CharacterAnalysis
ImageDeskew
OCR Mean
Tim
e(s)
(c) OpenALPR
0.39 0.45 0.21 0.31
3.74
6.94
0
2
4
6
8
SSD SSD (99%) EVBattery EVBattery(99%)
DeepSpeech DeepSpeech(99%)
Tim
e(s)
(d) Deep Learning Applications
Fig. 14. Application Latency Results on Intel Fog Node.
longer than user-perceived QoS in an interactive system.Because the input data source of EVBattery is text,the data batch size is only one-hour monitor data, andthe neural networks scale is smaller (one layer LSTM),so it has less running latency, which is enough for areal environment. As for SSD and DeepSpeech, theyboth have a deep and large-scale network structure, andthe input data source is image and audio (Unstructureddata). The platform is incompetent for these kinds ofapplications since it is not equipped with heterogeneoushardware to acceleration.
B. QoS-RU Curve Case Study
The application perspective metrics give the user anoverview of the platform performance when runningdifferent applications. Furthermore, CAVBench providesthe system perspective metrics (QoS-RU) to calculate aquantitative benchmarking result. We take ORB-SLAM2and SSD as the case study. According to the aboveresults, we set 10 FPS as the best QoS (QoS=1). TheQoS-RU curves of ORB-SLAM2 and SSD are shown inFigure 15. As for ORB-SLAM2, the area under CPU uti-lization (CPU), memory bandwidth (MEMBAND) andmemory footprint (MEMFOOT) curve are 0.84, 0.75,and 0.93, respectively. The Matching Factor (MF) is0.80. In SSD case, the area under CPU, MEMBAND,and MEMFOOT curves are 0.09, 0.14, and 0.23, respec-tively, and the MF is 0.15. The results correspond to theapplication perspective metrics, but it is from the systemview and quantitative.
No doubt, if an application cannot reach the acceptableQoS, the MF will be poor. Meanwhile, if the application
0 0.1 0.2 0.3 0.4 0.5 0.6 0.7 0.8 0.9 1
Resource Utilization Rate
0
0.2
0.4
0.6
0.8
1
Qu
an
tity
of
Serv
ice
CPU Utilization
Memory Bandwidth
Memory Footprint
(a) ORB-SLAM2
0 0.1 0.2 0.3 0.4 0.5 0.6 0.7 0.8 0.9 1
Resource Utilization Rate
0
0.05
0.1
0.15
0.2
0.25
0.3
Qu
an
tity
of
Serv
ice
CPU Utilization
Memory Bandwidth
Memory Footprint
(b) SSD
Fig. 15. QoS-RU Curves Case Study of ORB-SLAM2 and SSD.
needs more system resources to reach high QoS, the MFwill decrease more. In the real production environments,the on-vehicle applications run concurrently in one sys-tem and compete for the system’s resources. Hence, thehigh QoS application with less system resource con-sumption will be preferable to CAVs computing systems.That is why we consider system resource utilizationwhen calculating the Match Factor.
11

VI. CONCLUSION
CAVBench is the first benchmark suite for computingsystem and architectures designed for connected and au-tonomous vehicles targeting computational performanceevaluation. We chose four typical and dominate applica-tion scenarios of CAVs, and summarized six applicationsin these scenarios as the evaluation applications. Afterthat, we collected state-of-the-art implementation andstandard input datasets for each application and deter-mined the output metrics of the CAVBench. We gotthree basic features from CAVBench. First, the real-timeapplications are dominated in CAVs scenarios. Second,the input data is mostly unstructured. Third, the end-to-end deep learning algorithm is more preferable for CAVscomputing system. Then, we ran a series experimentsto explore the characteristics of CAVBench, and con-cluded three observations as follows. First, the operationintensity of the applications in CAVBench is polarized.Second, the applications in CAVBench all consumehigh memory access bandwidth. Third, CAVBench hasa lower cache miss rate on average, but for specificapplications, the optimization of the cache architectureand data/instruction locality is still important. Accordingto these features and characteristics, we presented someinsights and suggestions about the CAVs computingsystem design or CAVs application implementation. Fi-nally, we used the CAVBench to evaluate a typical edgecomputing platform and presented the quantitative andqualitative analysis of the benchmarking results.
We hope this work will be helpful to researchers anddevelopers who target the computing system or archi-tecture design of connected and autonomous vehicles.According to the insights proposed in this paper, ourfuture work will proceed from the following aspects.First, we will focus on providing the CUDA and OpenCLimplementation of the CAVBench to support more het-erogeneous platforms. Second, we will explore moremethodologies to evaluate the computing system in theCAVs scenarios comprehensively, such as a benchmarkdedicating system memory behaviors. Third, we willimplement a full stack computing system for CAVs thatwill be competent for all CAVs applications.
ACKNOWLEDGMENT
The authors are very grateful to the reviewers and ourshepherd Fan Bai for their constructive comments andsuggestions. We also would like to thank our colleagueYongtao Yao, who provided the implementation of someapplications in CAVBench. This work is supported inpart by National Science Foundation (NSF) grant CNS-1741635.
REFERENCES
[1] A. Geiger, P. Lenz, and R. Urtasun, “Are we ready for au-tonomous driving? the KITTI vision benchmark suite,” in Com-puter Vision and Pattern Recognition (CVPR), 2012 IEEE Con-ference on. IEEE, 2012, pp. 3354–3361.
[2] SAE International., “Taxonomy and definitions for terms relatedto driving automation systems for on-road motor vehicles J3016,”https://www.sae.org/standards/content/j3016 201609/, 2016.
[3] M. Gerla, E.-K. Lee, G. Pau, and U. Lee, “Internet of vehicles:From intelligent grid to autonomous cars and vehicular clouds,”in Internet of Things (WF-IoT), 2014 IEEE World Forum on.IEEE, 2014, pp. 241–246.
[4] G. Dimitrakopoulos and P. Demestichas, “Intelligent transporta-tion systems,” IEEE Vehicular Technology Magazine, vol. 5,no. 1, pp. 77–84, 2010.
[5] Waymo, “Waymo Self-Driving Car.” https://waymo.com, 2018.[6] Tesla, “Tesla Autopilot: Full Self-Driving Hardware on All Cars.”
https://www.tesla.com/autopilot, 2018.[7] Baidu, “Apollo Open Platform,” http://apollo.auto/index.html,
2018.[8] W. Shi, J. Cao, Q. Zhang, Y. Li, and L. Xu, “Edge computing:
Vision and challenges,” IEEE Internet of Things Journal, vol. 3,no. 5, pp. 637–646, 2016.
[9] W. Shi and S. Dustdar, “The promise of edge computing,”Computer, vol. 49, no. 5, pp. 78–81, 2016.
[10] S. Liu, J. Tang, C. Wang, Q. Wang, and J.-L. Gaudiot, “A unifiedcloud platform for autonomous driving,” Computer, vol. 50,no. 12, pp. 42–49, 2017.
[11] G. Kar, S. Jain, M. Gruteser, F. Bai, and R. Govindan, “Real-time traffic estimation at vehicular edge nodes,” in Proceedings ofthe Second ACM/IEEE Symposium on Edge Computing. ACM,2017, p. 3.
[12] K. Lee, J. Flinn, and B. D. Noble, “Gremlin: scheduling inter-actions in vehicular computing,” in Proceedings of the SecondACM/IEEE Symposium on Edge Computing. ACM, 2017, p. 4.
[13] B. Qi, L. Kang, and S. Banerjee, “A vehicle-based edge com-puting platform for transit and human mobility analytics,” inProceedings of the Second ACM/IEEE Symposium on EdgeComputing. ACM, 2017, p. 1.
[14] NVIDIA Corporation, “NVIDIA DRIVE PX2: Scalable AIplatform for Autonomous Driving,” https://www.nvidia.com/en-us/self-driving-cars/drive-platform, 2018.
[15] S. Liu, J. Tang, Z. Zhang, and J.-L. Gaudiot, “Computer archi-tectures for autonomous driving,” Computer, vol. 50, no. 8, pp.18–25, 2017.
[16] Q. Zhang, Y. Wang, X. Zhang, L. Liu, X. Wu, W. Shi, andH. Zhong, “OpenVDAP: An open vehicular data analytics plat-form for CAVs,” in Distributed Computing Systems (ICDCS),2018 IEEE 38th International Conference on. IEEE, 2018.
[17] M. Montemerlo, J. Becker, S. Bhat, H. Dahlkamp, D. Dolgov,S. Ettinger, D. Haehnel, T. Hilden, G. Hoffmann, B. Huhnkeet al., “Junior: The Stanford entry in the urban challenge,”Journal of field Robotics, vol. 25, no. 9, pp. 569–597, 2008.
[18] J. Levinson, J. Askeland, J. Becker, J. Dolson, D. Held, S. Kam-mel, J. Z. Kolter, D. Langer, O. Pink, V. Pratt et al., “Towardsfully autonomous driving: Systems and algorithms,” in IntelligentVehicles Symposium (IV), 2011 IEEE. IEEE, 2011, pp. 163–168.
[19] S.-C. Lin, Y. Zhang, C.-H. Hsu, M. Skach, M. E. Haque, L. Tang,and J. Mars, “The architectural implications of autonomousdriving: Constraints and acceleration,” in Proceedings of theTwenty-Third International Conference on Architectural Supportfor Programming Languages and Operating Systems. ACM,2018, pp. 751–766.
[20] Xilinx Inc., “Xilinx Zynq Ultrascale+ MPSoC ZCU106Evaluation Kit,” https://www.xilinx.com/products/boards-and-kits/zcu106.html, 2018.
[21] L. Wang, J. Zhan, C. Luo, Y. Zhu, Q. Yang, Y. He, W. Gao, Z. Jia,Y. Shi, S. Zhang et al., “BigDataBench: A big data benchmarksuite from internet services,” in High Performance ComputerArchitecture (HPCA), 2014 IEEE 20th International Symposiumon. IEEE, 2014, pp. 488–499.
12

[22] C. Bienia, S. Kumar, J. P. Singh, and K. Li, “The PARSEC bench-mark suite: Characterization and architectural implications,” inProceedings of the 17th international conference on Parallelarchitectures and compilation techniques. ACM, 2008, pp. 72–81.
[23] P. R. Luszczek, D. H. Bailey, J. J. Dongarra, J. Kepner, R. F.Lucas, R. Rabenseifner, and D. Takahashi, “The HPC Chal-lenge (HPCC) benchmark suite,” in Proceedings of the 2006ACM/IEEE conference on Supercomputing. Citeseer, 2006, p.213.
[24] A. Geiger, P. Lenz, C. Stiller, and R. Urtasun, “Vision meetsrobotics: The KITTI dataset,” The International Journal ofRobotics Research, vol. 32, no. 11, pp. 1231–1237, 2013.
[25] J. Sturm, N. Engelhard, F. Endres, W. Burgard, and D. Cremers,“A benchmark for the evaluation of RGB-D SLAM systems,” inIntelligent Robots and Systems (IROS), 2012 IEEE/RSJ Interna-tional Conference on. IEEE, 2012, pp. 573–580.
[26] Y. Xiang, R. Mottaghi, and S. Savarese, “Beyond PASCAL: Abenchmark for 3D object detection in the wild,” in Applicationsof Computer Vision (WACV), 2014 IEEE Winter Conference on.IEEE, 2014, pp. 75–82.
[27] L. Leal-Taixe, A. Milan, I. Reid, S. Roth, and K. Schindler,“MOTChallenge 2015: Towards a benchmark for multi-targettracking,” arXiv preprint arXiv:1504.01942, 2015.
[28] A. Milan, L. Leal-Taixe, I. Reid, S. Roth, and K. Schindler,“MOT16: A benchmark for multi-object tracking,” arXiv preprintarXiv:1603.00831, 2016.
[29] S. K. Venkata, I. Ahn, D. Jeon, A. Gupta, C. Louie, S. Garcia,S. Belongie, and M. B. Taylor, “SD-VBS: The San Diego visionbenchmark suite,” in Workload Characterization (IISWC), 2009IEEE International Symposium on. IEEE, 2009, pp. 55–64.
[30] J. Clemons, H. Zhu, S. Savarese, and T. Austin, “MEVBench:A mobile computer vision benchmarking suite,” in WorkloadCharacterization (IISWC), 2011 IEEE International Symposiumon. IEEE, 2011, pp. 91–102.
[31] L. Nardi, B. Bodin, M. Z. Zia, J. Mawer, A. Nisbet, P. H. Kelly,A. J. Davison, M. Lujan, M. F. O’Boyle, G. Riley et al., “Intro-ducing SLAMBench, a performance and accuracy benchmarkingmethodology for slam,” in Robotics and Automation (ICRA),2015 IEEE International Conference on. IEEE, 2015, pp. 5783–5790.
[32] R. A. Newcombe, S. Izadi, O. Hilliges, D. Molyneaux, D. Kim,A. J. Davison, P. Kohi, J. Shotton, S. Hodges, and A. Fitzgibbon,“KinectFusion: Real-time dense surface mapping and tracking,”in Mixed and augmented reality (ISMAR), 2011 10th IEEEinternational symposium on. IEEE, 2011, pp. 127–136.
[33] C. Urmson, J. Anhalt, D. Bagnell, C. Baker, R. Bittner, M. Clark,J. Dolan, D. Duggins, T. Galatali, C. Geyer et al., “Autonomousdriving in urban environments: Boss and the urban challenge,”Journal of Field Robotics, vol. 25, no. 8, pp. 425–466, 2008.
[34] C. Berger and B. Rumpe, “Autonomous driving-5 years afterthe urban challenge: The anticipatory vehicle as a cyber-physicalsystem,” arXiv preprint arXiv:1409.0413, 2014.
[35] S. Kato, E. Takeuchi, Y. Ishiguro, Y. Ninomiya, K. Takeda, andT. Hamada, “An open approach to autonomous vehicles,” IEEEMicro, vol. 35, no. 6, pp. 60–68, 2015.
[36] Y. Zhang, G. W. Gantt, M. J. Rychlinski, R. M. Edwards, J. J.Correia, and C. E. Wolf, “Connected vehicle diagnostics andprognostics, concept, and initial practice,” IEEE Transactions onReliability, vol. 58, no. 2, pp. 286–294, 2009.
[37] J. Zhang and J. Lee, “A review on prognostics and healthmonitoring of li-ion battery,” Journal of Power Sources, vol. 196,no. 15, pp. 6007–6014, 2011.
[38] J. Maciej and M. Vollrath, “Comparison of manual vs. speech-based interaction with in-vehicle information systems,” AccidentAnalysis & Prevention, vol. 41, no. 5, pp. 924–930, 2009.
[39] Ford, “SYNC,” https://www.ford.com/technology/sync/, 2018.[40] G. Kar, S. Jain, M. Gruteser, J. Chen, F. Bai, and R. Govindan,
“PredriveID: Pre-trip driver identification from in-vehicle data,”in Proceedings of the Second ACM/IEEE Symposium on EdgeComputing. ACM, 2017, pp. 2:1–2:12.
[41] Q. Zhang, Q. Zhang, W. Shi, and H. Zhong, “Enhancing AMBERalert using collaborative edges: poster,” in Proceedings of theSecond ACM/IEEE Symposium on Edge Computing. ACM,2017, p. 27.
[42] G. Ananthanarayanan, P. Bahl, P. Bodık, K. Chintalapudi,M. Philipose, L. Ravindranath, and S. Sinha, “Real-time videoanalytics: The killer app for edge computing,” Computer, vol. 50,no. 10, pp. 58–67, 2017.
[43] W. Liu, D. Anguelov, D. Erhan, C. Szegedy, S. Reed, C.-Y.Fu, and A. C. Berg, “SSD: Single shot multibox detector,” inEuropean conference on computer vision. Springer, 2016, pp.21–37.
[44] A. Osep, W. Mehner, M. Mathias, and B. Leibe, “Combinedimage-and world-space tracking in traffic scenes,” in Roboticsand Automation (ICRA), 2017 IEEE International Conference on.IEEE, 2017, pp. 1988–1995.
[45] A. Hannun, C. Case, J. Casper, B. Catanzaro, G. Diamos,E. Elsen, R. Prenger, S. Satheesh, S. Sengupta, A. Coates et al.,“Deep Speech: Scaling up end-to-end speech recognition,” arXivpreprint arXiv:1412.5567, 2014.
[46] OpenALPR Technology Inc., “OpenALPR,”http://www.openalpr.com, 2018.
[47] R. Mur-Artal, J. M. M. Montiel, and J. D. Tardos, “ORB-SLAM: a versatile and accurate monocular SLAM system,” IEEETransactions on Robotics, vol. 31, no. 5, pp. 1147–1163, 2015.
[48] F. Endres, J. Hess, J. Sturm, D. Cremers, and W. Burgard, “3-D mapping with an RGB-D camera,” IEEE Transactions onRobotics, vol. 30, no. 1, pp. 177–187, 2014.
[49] M. Everingham, L. Van Gool, C. K. Williams, J. Winn, andA. Zisserman, “The PASCAL Visual Object Classes (VOC)challenge,” International journal of computer vision, vol. 88,no. 2, pp. 303–338, 2010.
[50] S. Ren, K. He, R. Girshick, and J. Sun, “Faster R-CNN: Towardsreal-time object detection with region proposal networks,” inAdvances in neural information processing systems, 2015, pp.91–99.
[51] Z. Cai, Q. Fan, R. S. Feris, and N. Vasconcelos, “A unified multi-scale deep convolutional neural network for fast object detection,”in European Conference on Computer Vision. Springer, 2016,pp. 354–370.
[52] X. Chen, K. Kundu, Z. Zhang, H. Ma, S. Fidler, and R. Urtasun,“Monocular 3D object detection for autonomous driving,” inProceedings of the IEEE Conference on Computer Vision andPattern Recognition, 2016, pp. 2147–2156.
[53] J. Redmon, S. Divvala, R. Girshick, and A. Farhadi, “You onlylook once: Unified, real-time object detection,” in Proceedings ofthe IEEE conference on computer vision and pattern recognition,2016, pp. 779–788.
[54] R. Girshick, J. Donahue, T. Darrell, and J. Malik, “Rich featurehierarchies for accurate object detection and semantic segmenta-tion,” in Proceedings of the IEEE conference on computer visionand pattern recognition, 2014, pp. 580–587.
[55] A. Geiger, M. Lauer, C. Wojek, C. Stiller, and R. Urtasun, “3dtraffic scene understanding from movable platforms,” IEEE trans-actions on pattern analysis and machine intelligence, vol. 36,no. 5, pp. 1012–1025, 2014.
[56] D. Held, S. Thrun, and S. Savarese, “Learning to track at 100fps with deep regression networks,” in European Conference onComputer Vision. Springer, 2016, pp. 749–765.
[57] F. D. dos Santos Lima, G. M. R. Amaral, L. G. de Moura Leite,J. P. P. Gomes, and J. de Castro Machado, “Predicting failures inhard drives with lstm networks,” in Intelligent Systems (BRACIS),2017 Brazilian Conference on. IEEE, 2017, pp. 222–227.
[58] A. L. Maas, A. Y. Hannun, C. T. Lengerich, P. Qi, D. Jurafsky,and A. Y. Ng, “Increasing deep neural network acoustic modelsize for large vocabulary continuous speech recognition,” arXivpreprint, 2014.
[59] Mozilla, “Mozilla Corpus,” https://voice.mozilla.org/en/data,2018.
[60] Leopard Imaging Inc., “USB 3.0 Box Camera: AR023ZWDRB,”https://leopardimaging.com/product/li-usb30-ar023zwdrb/, 2018.
13