causes of corruption: testing competing hypotheses are some public officials more prone to corrupt...
TRANSCRIPT

Causes of Corruption: Testing Competing Hypotheses
Margit Tavits Nuffield College
University of Oxford [email protected]
March 23, 2005
Abstract
In this paper I argue that for both public officials and citizens, the decision to engage in
corrupt behavior is primarily influenced by a personal definition of corruption and individual
perceptions of how widespread corrupt activities are (imitation). This explanation borrows
from the social learning theory developed by sociologists to understand the causes of various
sorts of deviant behavior. I will also show that one of the most popular alternative
explanations in political science research on compliance – political and social trust – remains
less efficient for explaining an individual’s decision to engage in corrupt exchange.
1

Why are some public officials more prone to corrupt behavior than other officials? Why are
some citizens more likely to offer bribes than others? These are important questions for
understanding the causes of street-level corruption. Yet, in the midst of the growing number
of studies on corruption, these questions have been largely left unanswered. Political scientists
and economists alike have devoted a lot of energy to explaining cross-national differences in
the level of perceived corruption. This body of research has focused mostly on structural
features. However, corruption is ultimately the direct result of decisions, choices and behavior
at the level of the individual. One can restructure institutions or political systems, but if
individual level motivations for corrupt behavior are not understood, these restructurings may
not be effective.
This paper will take an individual level approach and tackle the question of why
people engage in corrupt exchange. I will argue that for both public officials and citizens, the
decision to engage in corrupt behavior is primarily influenced by a personal definition of
corruption and a perception of how widespread corrupt activities are (imitation). This
explanation borrows from the social learning theory (Akers 1998) developed by sociologists
to explain various sorts of deviant behavior. I will also show that one of the most common
explanations in political science research on compliance – political and social trust – remains
less efficient for explaining an individual’s decision to engage in corrupt exchange.
Causes of corruption
Literature on both the causes and consequences of corruption is voluminous. We now have a
substantial body of evidence that corruption has serious costs on both economy in terms of
slowing growth and increasing inequality (Ades and DiTella 1996, Gupta, Davoodi, and
Alonso-Terne 1998, Mauro 1995); as well as its effects on democracy in terms of decreasing
government effectiveness; stability (Adsera, Boix and Payne 2000, La Porta et al. 1998,
Mauro 1995); and political legitimacy (Della Porta 2000, Doig and Theobald 2000, Morris
2
1991, Pharr 2000, Rose et al. 1998, Seligson 2002). Given these negative consequences,
researchers have also tried to explain what causes variation in the (mostly perceived) level of
corruption. The list of potential causes of corruption is very long including the wealth of a
country (Lambsdorff 1999, Mauro 1995, Montinola and Jackman 2002, Paldam 1999),
democracy (Amudsen 1999, Lipset and Salman Lenz 2000, Montinola and Jackman 2002,
Sung 2004, Treisman 2000), the size of unofficial economy (Lambsdorff 1999), political
institutions (Chang and Golden forthcoming, Fisman and Gatti 2000, Gerring and Thacker
2004, Kunicova and Rose-Ackerman 2002, Persson, Tabellini and Trebbi 2003, Treisman
2000), ethno-linguistic diversity (Treisman 2000), political stability (Leite and Weidman
1999, Treisman 2000), trade openness (Wei 2000), public sector recruitment and wages (La
Porta et al. 1998, Rauch and Evans 1997, Tanzi 1998, Treisman 2000), and voting turnout
(Adsera et al. 2003). Further, in their literature review, Gerring and Thacker (2004) list the
following factors as additional causes of corruption: population density, geography, mineral
wealth, state formations, colonial legacies, social heterogeneity, clientelism and inequality,
religion, media and political culture. Even this extended list does not aspire to be complete,
but just serves the purpose of illustrating the myriad of explanations proposed.1
These explanations, however, focus almost exclusively on the country level. The most
common dependent variable in these studies is an aggregate country level measure of the
perception of corruption. These approaches, while informative, have two limitations. First, it
is often difficult to figure out the cause and effect of corruption: even in the brief review
above one can see that similar variables have been proposed both as causes and consequences
of corruption. Second, and more importantly for the current study, these aggregate level
1 An interested reader is advised to look at Andvig and Fjeldstad (2001), Rose-Ackerman
(1999), and Gerring and Thacker (2004) for a more complete survey of literature on
corruption.
3

variables tell us little about the actual individual level motivation to engage in corrupt
exchange. Individual level motivation, however, is a key to understanding why corruption
occurs in the first place, i.e. why people are willing to engage in illegal or immoral behavior.
Structural reasons can only be secondary causes of corruption. For example, if people are
hard-wired to believe that corrupt behavior is normal or beneficial, institutional or structural
changes do little to eliminate corruption. As Uslaner (2004) has suggested, the corrupt
exchanges between street level bureaucracies and citizens may be resistant to large-scale
structural reform making micro-level analysis even more important.
Individual level causes of corruption
Corruption is most often understood as a “misuse of public office for private gain” (Kunicova
and Rose-Ackerman 2003, Rose-Ackerman 1999, Sandholtz and Koetzle 2000, Treisman
2000). Although corruption refers most often to the behavior of public officials, citizens’
willingness to pay bribes or engage in corrupt behavior in some other way feeds the corrupt
system, and, thus, becomes an important defining feature on its own. So what explains the
readiness of public officials to misuse public office for private gain? And on a related note,
what explains the willingness of citizens to pay bribes?
The research on the consequences of social and political trust may offer one potential
explanation. The literature on government regulation has argued that the higher the level of
trust in government and in one’s fellow citizens, the more likely the citizenry will comply
with government demands and regulations (Levi and Stoker 2000, Scholz and Lubell 1998a,
1998b, Tyler 1990, 1998). This literature approaches trust from a rational perspective: trust
reflects beliefs about risk and trust is a result of encapsulated interest (Levi and Stoker 2000,
Scholz 1998a, 1998b). This rational approach argues that in case of social dilemmas both
sides cooperate as long as the other is perceived to be trustworthy. In large-scale collectives
(such as entire societies) it becomes more difficult to determine in any single exchange
4
whether the other party is trustworthy. In these cases, the theory argues, people use trust
heuristics obtained from some prior experiences with beneficial collective action. To the
extent that people are able to make such a generalization, trust should be related to higher
probabilities of compliance (Scholz and Lubell 1998a). Applying this argument to corruption,
one would expect that the extent to which people (both public officials and citizens) trust
government (i.e. the judicial system and police) to be fair and trust other people to behave
fairly, it is rational for them to reciprocate and also behave fairly. Trust, thus, becomes the
basis on which non-corrupt exchange is sustained.
Research specifically on corruption, rather than just compliance, has also argued that
trust matters. Authors claim a strong relationship between both trust in government and trust
in other people on the one hand and the level of corruption on the other, both across counties
and at the individual level (Camp, Coleman, and Davis 2000, 2004, Della Porta 2000, Morris
1991, Rothstein 2000, Uslaner and Badescu 2003, 2004). This line of research tends to argue
that trust has a positive consequence on reducing corruption via social bonds rather than via
rational calculation of utility: “trust leads to empathy with others – and thus a respect for the
law” (Uslaner 2004: 10). This mechanism is much less specific and the causal relationship
between corruption and trust is not that clear. Seligson (2002), for example, uses individual
level data to argue that corruption influences the level of trust in other people and trust in the
fairness of the political system. Uslaner (2004), on the other hand, relying on aggregate
country level data, establishes a causal link from trust to corruption.2 Uslaner and Badescu
(2004) establish several reciprocal relationships between political and social trust on the one
hand and the perception of and actual encounters with corruption on the other. Given the
2 Anderson and Tverdova (2003) and Letki (2005) argue in similar lines, although their
modeling procedures do not allow determining the causality directly.
5

ambivalent support for the trust argument in the context of corruption, it remains, at best, only
a partial explanation of the individual level motivation for engaging in corrupt exchange.
A possible alternative explanation of individual motivation to engage in corrupt
behavior is offered by the social learning theory (Akers 1998) developed within sociology to
explain deviant behavior. The theory is based on four interrelated concepts that operate to
promote or undermine conformity: differential association, definitions, differential
reinforcement and imitation. These concepts are overlapping and also mutually reinforcing.
The basic mechanism of the social learning theory works as follows: behavior is acquired and
sustained (1) through adopting definitions favorable to illegal behavior via differential
association with one’s peers, (2) through imitating such behavior by peers, and (3) through the
positive reinforcement provided by rewards for such a behavior (Akers 1998). Given the
reciprocal relationships between these variables, the causal order between them is not
determined (Akers 1998, Akers et al. 1979, Lanza-Kaduce et al. 1982). Furthermore, as the
measures of different concepts of social learning theory are likely to overlap empirically
(Akers et al. 1979, Krohn et al. 1985), I will focus here on key variables that can be more or
less clearly distinguished: definitions and models of behavior (or imitation).
Definitions constitute normative attitudes toward certain behavior. The more
individuals define a behavior as good (“positive” definition) or as justified (“neutralizing”
definition) rather than bad (“negative” definition) the more likely they are to engage in it
(Akers et al. 1979, Akers 1998). There is a strong and consistent empirical relationship
between individual’s definitions and attitudes toward the behavior in question and
misbehavior in a wide variety of contexts such as substance abuse, sexual aggression, white
collar crimes, and police misconduct including police corruption (Krohn et al. 1985, Akers
1998). Furthermore, in their recent study on corruption on Eastern Europe, Miller et al. (2001)
6
argue that values, i.e. condemnation of bribery, increased resistance to both accepting and
paying bribes.
Social behavior is also acquired and sustained through conditioning and imitation or
modeling of others’ behavior. If people perceive that a behavior is widespread and that there
is an approval of problem behavior, then they are more likely to engage in such behavior.
Definitions and imitation are mutually reinforcing in their effect on individual’s behavior. By
using others’ behaviors as models, a person learns “evaluative” definitions of behavior as
good or bad, right or wrong. To an extent, these definitions are themselves verbal and
cognitive behavior, which can be directly reinforced and can act as discriminative stimuli for
other behavior (Akers 1985, Kohen et al. 1985). Again, a body of evidence supports the
argument that models and approval are the major predictors of problem behavior (Jessor and
Jessor 1977, Akes 1998).
In sum, individuals learn from their own past behavior and from their association with
peers, both of which condition their evaluative definitions and reinforce imitation. Applying
these arguments to situations of corruption, the theory would propose that a willingness to
engage in corrupt behavior can be expected to the extent that one does not define corruption
as morally or situationally wrong, but rather that it is a justified and acceptable mode for
exchange; and that one has been exposed to corrupt behavior or at least perceives that such a
behavior is widespread and, thus, approved.
The combination of the arguments based on trust heuristic and social learning allows
the formulation of the following three hypotheses to be tested about individual level
motivation to engage in corrupt behavior:
H1: The more people trust in government and trust in other citizens the less likely they are to
engage in corrupt behavior.
7
H2a: The more positively people define a corrupt behavior the more likely they are to engage
in it.
H2b: The more widespread people perceive a corrupt behavior to be, the more likely they are
to engage in it.
Data and measures
The present study draws upon survey data collected in Estonia. This country has been ranked
5.5-6.0 (out of 10, which is the maximum level of corruption) on Transparency International’s
corruption perception index for the past 7 years. It is because it falls into the middle category
of the aggregate comparative scale of perceived levels of corruption that Estonia is a suitable
country for conducting an individual level analysis of the determinants of corruption. That is,
the individual level relationships uncovered in this analysis are expected to be more broadly
representative and generalizable, and less conditional upon the general level of corruption in
this country than would be the case when analyzing data from a country placed on either
extreme.3 It is, of course, possible to argue that the case of Estonia may carry certain post-
communist legacy effects4 and, thus, may not be very representative. Yet Estonia itself is not
very representative of the post-communist region: together with Slovenia, it is the highest
ranking post-communist country on the corruption perception scale, and surpasses even some
West European democracies such as Italy and Greece on this scale. Thus, Estonia should be
representative of an “average” country and the relationships uncovered using data from this
country should be more broadly generalizable, rather than just characterizing a post-
communist developmental phase.
3 See Uslaner and Badescu (2003) how relationships between trust and its predictor variables
can vary according to what the general comparative level of corruption in a country is.
4 See Miller et al. (2001) and Uslaner and Badescu (2003, 2004) on the effect of communist
regime and transition on the level of corruption.
8

As we are interested in the tendency towards corrupt behavior by both public officials
and citizens, the study is based on two separate surveys. One of these surveys was conducted
face-to-face using a national probability sample of the general public (1002 respondents,
response rate: 52%). The other survey was conducted using Computer Assisted Web
Interviewing with a sample of public officials. The sample was first selected according to
quotas in order to get a representative sample of respondents from the following public sector
institutions: (1) ministries, county governments, constitutional institutions, (2) agencies and
boards, (3) institutions of law and order, (4) political officials, (5) local governments. The
data was then weighted in order to get a general representative sample of public officials (901
respondents). The response rate was lower than in the case of the general public – 36%, which
can partially be explained by the method of how the survey was conducted.5
Finding a good measure for individual’s engagement in corruption is a non-trivial
task. Given the sensitivity of the topic, asking directly whether somebody has ever been
engaged in corruption is most probably going to lead to an unreliable measure. Especially so
5 The surveys were conducted in December 2004 by an Estonian polling firm Emor as part of
a research project administered by the Estonian Ministry of Justice on mapping the level of
public sector corruption in Estonia. Interviews were conducted in Estonian or Russian
depending on the preference of the respondent. Both in the case of the general public as well
as in the case of public officials, follow-up contacts were made with a selection of
respondents in order to get feedback on how the survey was received. The feedback was
overwhelmingly positive increasing the confidence in the reliability of the survey measures.
In the case of both surveys the interviewees were not told that the survey was trying to get
information on corruption; also, all respondents were guaranteed anonymity. Both of these
measures should work towards decreasing bias in response and, in the case of public officials,
also the selection bias.
9

in the case of public officials: while in the case of ordinary citizens such an engagement may
occur as a result of extortion, public officials have to take full responsibility for involvement
in corruption. Given this, it is preferable to use more subtle questions in order to get at the
extent to which public officials are susceptible to corruption. I obtained a measure for
Corruptibility by presenting the respondents with the following scenario: “Imagine that you
are an official, who decides upon whether or not to give financial support for certain projects.
One of the applicants for financial support offers you a trip to a summer resort in case you
decide in favor of their project. To what extent do you agree with the following statements?
(1) I would decide in favor of the project as it would be impolite to refuse the offer; (2) I
would decide in favor of the project as there is little chance of getting caught; (3) I would
decide in favor of the project as it would be a good economic gain; (4) I would decide in favor
of the project as such a counter-favor would be harmless – nobody would suffer; (5) I would
decide in favor of the project as it is a rather widespread practice.” For every one of these five
options respondents could (1) completely agree, (2) rather agree than disagree, (3) rather
disagree than agree, (4) completely disagree. Note that if the respondent agrees (or rather
agrees) with any of these statements, they agree to participate in a corrupt exchange. The
excuse for agreement becomes irrelevant for our purposes. The dependent variable for public
officials is, thus, measured as follows: if the respondent completely agreed or rather agreed
than disagreed with any of these five statements, they were assigned the score “1”, the rest of
the respondents were assigned the score “0”. Such measurement has face validity. In terms of
reliability, responses to a hypothetical scenario are expected to be less contaminated by
socially desirable responses than asking for someone’s direct involvement in corruption.
In the case of citizens I had to rely on more direct questions about their involvement in
corruption. However, I was able to use two separate indicators, which increases the reliability
10

of the measurement.6 Furthermore, prior research has consistently shown that the self-report
questionnaire technique is reliable and valid in measuring even more sensitive topics such as
delinquent, drug, and drinking behavior (see Akers et al. 1983, Thornberg and Krohn 2000 for
an overview of the validity and reliability of such a measurement). One might still argue,
however, that due to the sensitivity of the topic people may be reluctant to reveal their
personal involvement. There are two ways that this concern was mitigated. First, in the case
of these self-report measures, I have accounted for both personal involvement as well as
“witnessing” as respondents may find it easier to refer to a third person even if they
themselves were involved. Further, although both indicators ask respondents about their
personal involvement in corrupt deals, the blame for the deal could still be shifted to public
officials as people may have been extorted. Given the possibility of blame shifting,
respondents should be less reluctant to report their personal involvement, enhancing the
reliability of the measures.
The following two indicators were used to measure citizen involvement in corruption.
First, the respondents were asked “Have you ever paid a bribe or offered a gift to a public
official or do you know if any of your friends has, in order to influence the provision of a
public service?” “Yes” responses for this question were coded 1 and “no” responses 0 to form
a variable Bribe. Second, the respondents were presented with different scenarios of corrupt
exchange and asked the following: “Please tell me whether you have personally participated
6 The analysis with citizens should be treated as a complementary rather than as the main test
of the theoretical arguments. As stated earlier the ultimate source of corrupt deals is a corrupt
official. If officials refused citizens’ initiative, corrupt exchange would not take place. At the
same time, of course, less submissive citizens can curb officials’ greed, which is why
understanding the behavior of ordinary citizens in their interactions with public officials is
also essential for understanding causes of corruption.
11

in or witnessed such situations within the past few years: (1) Acquiring a public service or
good through acquaintances; (2) Fast-tracking administrative processing through
acquaintances with a public official; (3) Offering a gift to a public official; (4) A public
official uses official information for his or her own benefit; (5) A public official does a favor
in return for a counter-favor; (6) An official makes a business contract on behalf of his or her
institution with a company owned by his or her relative; (7) A political party agrees to pass a
decision favorable to a company if the latter agreed to make a sizable donation to the party”.
Again, in the case of all seven scenarios, those who said they had personally participated in or
witnessed such a situation were coded 1 and the rest were coded 0. The seven variables were
then added together in order to form a count variable of Involvement in a corrupt deal.
Trust in other people (Generalized trust) was measured for both citizens and public
officials by asking a standard question on a four point scale “How trustworthy are most
people in Estonia?” Trust in government was measured by questions asking respondents to
state on a four point scale (1) “Do you think Estonian courts guarantee a fair trial?” (2) “How
much do you trust Estonian police?” (3) How much do you trust that Estonian politicians will
do what is best for the country?” (alpha = .55, for both citizens and public officials).
For measuring definitions and imitation, series of questions were again used in order
to increase reliability of the measures. To set up a further robustness test, definitions were
operationalized using two alternative measures. All of these batteries of questions were based
on several hypothetical third person scenarios (or vignettes) to present respondents with
realistic examples of a variety of corrupt behavior.7 Definitions were measured by an average8
7 This is a common technique in social sciences (Chappell and Piquero 2004, Nagin and
Paternoster 1993, Weber 1992).
12

of the respondent’s agreement on a 4-point scale with the following definitions: (1) “If a
public official accepts a gift for a personal favor then it is corruption”; (2) “If a public official
accepts a bribe or a gift in exchange for avoiding a fine or for fast-tracking bureaucratic
processing then it is corruption”; (3) “If a person is employed thanks to personal relationships
with a senior public official, then it is corruption”; (4) “If a public official sells classified
information, then it is corruption” (for public officials alpha = .49, for citizens alpha = .67).9
I also used an alternative measure for definitions, called Acceptance. The measure is,
again based on an average score of the responses (on a 4-point scale) to the following
question: “I will now describe you situations that may sometimes happen. Please, tell me to
what extent do you find the following situations acceptable? (1) A driver offers a police a
good or a service by his or her firm at a discount price in order to avoid a speeding ticket; (2)
An entrepreneur offers the headmaster of an elite school10 a trip to a summer resort for
admitting his or her son to the school; (3) A public official uses a government provided car
for private purposes; (4) A civil servant offers, for a fee, lectures on the area of his or her
work-related expertise; (5) An entrepreneur calls up a public official who he or she knows
8 For all of the index measures I also generated factor scores. The results of the analyses
remained unaltered regardless of whether factor scores or averages were used. I resorted to
using the averages as they preserve the interpretability of the scores.
9 All of these situations are classified as “criminal” according to the Estonian Penal Code and
Anti-Corruption Act, thus there should not be any confusion about whether the situations
referred to can actually be classified as corruption in Estonian culture. The same is true about
the situations presented for the alternative measurement of the definitions as well as for
situations measuring imitations.
10 With a very few exceptions all schools in Estonia are public and headmasters as well as
teachers are considered public officials.
13

from previous personal contacts, and asks to fast-track the processing of his or her file; (6) An
entrepreneur offers a public official personal favors in return for a public contract; (7) A
public official buys goods on behalf of his or her institution from a company owned by his or
her relative; (8) A patient is moved up on a waiting list for surgery because his or her brother
is friends with the surgeon”; (9) (only in the case of public officials) An entrepreneur offers a
public official a good or a service by his or her firm (for public officials alpha = .68, for
citizens alpha = .81).
Imitation is based on the same battery of situations as acceptance, only in this case
respondents were asked on a 4-point scale “To what extent do you think these are behaviors
common in Estonia?” (for public officials alpha = .8, for citizens alpha = .85). All of these
measures have considerable face validity: the first measure of Definitions asks directly about
how people define corruption. The alternative measure of definitions – Acceptance – also
attempts to classify people’s attitudes towards corrupt behavior as either good, bad or neutral,
corresponding well to the theoretical concept measured. The measure for imitation asks for
the respondent’s perception of how widespread or common corrupt behavior is: if it is
perceived as more common and widespread, a person is more likely to imitate it.
In both analyses I will also control for socio-economic and regional variables.
Additionally, in the case of public officials, it has been argued that salaries and satisfaction
with the workplace in general might influence how prone to corruption they are (Rauch and
Evans 2000 see also La Porta et al. 1998, Mauro 1995, Treisman 2000). Thus I will add two
controls measuring to what extent the respondent agrees (on a 4-point scale) that (1) “My job
is secure and stable” (variable name Job security) and (2) “I am satisfied with my salary and
benefits” (variable name Satisfied with salary) to the analysis of the sample of public
officials. The correlation between these two variables is only .19 (alpha = .3), which is why I
have entered both to the equation separately. In the case of citizens, I will also control for the
14

possibility that they have been Asked to pay a bribe.11 Further, since some authors have
argued that confidence in corrupt deals enhances the further spread of corruption (Lambsdorff
2002), I will also control for whether the person thinks that a bribe influences the quality of
the public service (variable name Bribe helps).12
Analyses
As usual with survey data, the variables included in the models to be analyzed contain a non-
trivial degree of missing data. On the one hand, most of the models will be estimated by a
non-linear regression, in which case listwise deletion of missing data is less problematic
(Allison 2002). On the other hand, missingness reaches 21% in the public officials’ dataset
and 13% in the case of the general public – levels at which selection bias generated by
missing data becomes a reasonable concern (King et al. 2001). Thus, I have used multiple
imputations to replace missing observations. An algorithm developed by King et al. (2001)
was used for imputation carried out in the statistical program Amelia.13 The multiple
11 The index is based on the average of positive responses to the question of whether and how
often (seldom, often, every time) they have been asked to pay a bribe for the following public
services: (1) applying for a driving license/registering a car, (2) in relation to taxes, (3)
applying for a passport or an ID card, (4) in relation to the “property reform”, (5) in courts,
(6) in hospitals, (8) by police, (9) in relation to schools, universities or kindergartens, (10) in
relation to social services, (11) when crossing the border, (12) by the local government. The
measure ranges from 0 (never had to pay) to 1 (had to always pay in relation all of these
services).
12 “To what extent does bribing or gift giving influence the quality of the public service?” 1 =
not at all, 2 = not much, 3 = influences quite a bit, 4 = influences a lot.
13 For more information about the algorithm and about the program Amelia see
http://GKing.Harvard.Edu
15

imputation uses information from all the variables included in the models plus from additional
variables in the dataset that are expected to be highly correlated with missingness in order to
generate values for missing observations (Allison 2002, King et al. 2001). Amelia generates
five imputations – five different datasets for both analyses. The same regressions are then run
on each dataset and the results are combined by using the MI procedure in Stata (King et al.
2001).14 The differences in the results between the analysis with imputed data and with
listwise deleted data are not striking, but the imputed data performs more efficiently.
Table 1 reports the summary statistics of the substantively important variables for both
datasets. As for the frequency distribution of the dependent variables, the about 14% of the
public officials would agree to participate in a corrupt activity. The share of the respondents
amongst the general public who admitted that they have bribed an official is about equal size:
17%. About 42% of the respondents claimed that they had never participated in or witnessed a
corrupt activity from the list provided (see above); 17% of the respondents had participated in
or witnessed more than 5 different types of corrupt activities. These percentages have
informative rather than evaluative purpose as without any comparative data, it is difficult to
14 The multiple imputation estimate of a parameter (univariate mean, regression coefficient,
etc.), q , is the average of the m separate estimates, qj (j = 1,…,m): ∑=
=m
jjq
m 1
1q The variance
of the point estimate is the average of the estimated variances from within each completed
dataset, plus the sample variance in the point estimate across the datasets (multiplied by a
factor score): ),1()(1)(
1
1222 ∑=
++=m
jmqj SqSE
mqSE
where SE(qj)2 is the estimated variance of qj
from dataset j, and )1/()( 2
1
2 −−= ∑=
mqqSEm
jjq
is the sample variance across the m point
estimates (Honaker et al. 2003).
16

assess whether the shares are too large or reasonably small. In any event, all dependent
variables contain enough variance to be analyzed with statistical techniques.
Table 1: Descriptive statistics Public officials N Mean SD Min Max Corruptibility 901 .145 .349 0 1 Generalized trust 901 2.635 .518 1 4 Trust in government 901 2.642 .448 1 4 Definitions 901 1.645 .437 1 4 Acceptance 901 1.752 .425 1 4 Imitation 901 2.809 .432 1 4 General public Bribe 1002 .164 .372 0 1 Involvement 1002 1.994 2.237 0 7 Generalized trust 1002 2.628 .614 1 4 Trust in government 1002 2.550 .534 1 4 Definitions 1002 1.779 .576 1 4 Acceptance 1002 2.108 .761 1 4 Imitation 1002 2.939 .517 1 4
Results for public officials
Table 2 presents the results for the analysis of the sample of public officials. As the dependent
variable is binary, the model is estimated using logit regression. The table presents both
coefficients as well as odds ratios for statistically significant variables for easier
interpretation. Model A uses Definitions while Model B uses Acceptance as the measure of
definitions.
The explanations based on generalized trust and trust in government fail to perform in
an expected manner: neither of these variables is significant in either model. These results did
not change when the variables were entered one by one rather than together or when the
different components of trust in government rather than the composed variable were used.
Both variables remained insignificant even in the bivariate analysis. Thus, there is no
evidence that trust, either in strangers or in government, are associated with lower levels of
corruptibility.
17
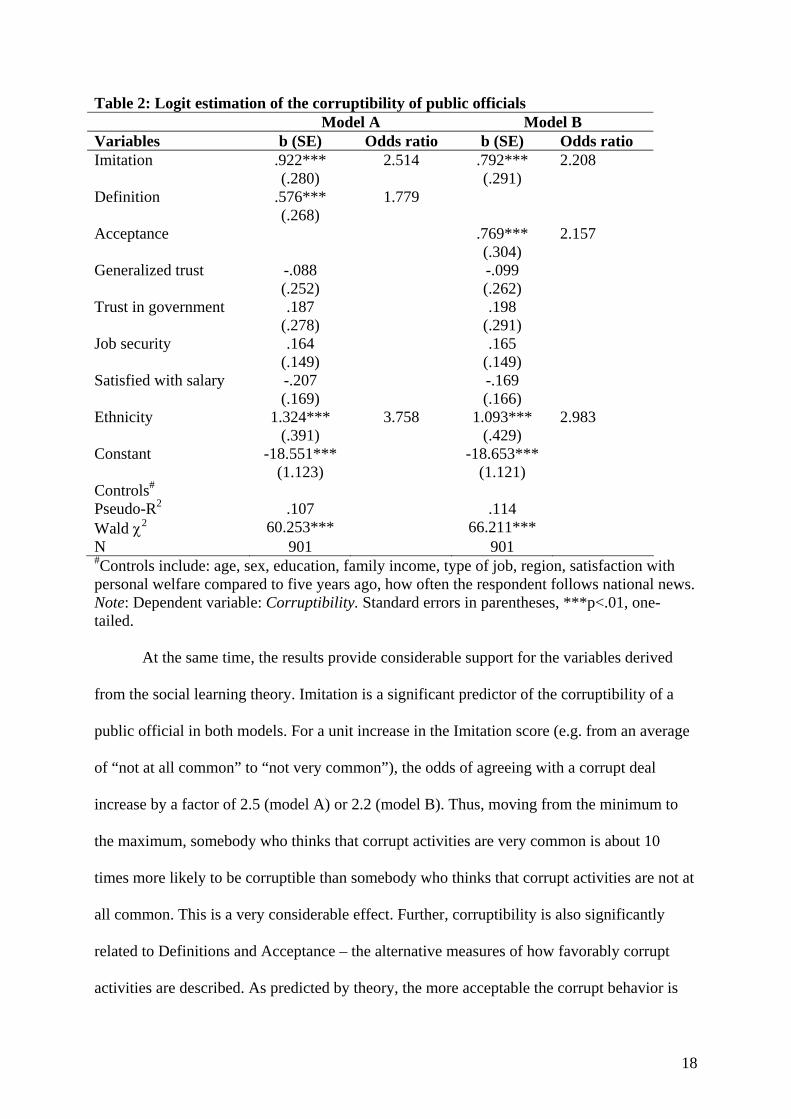
Table 2: Logit estimation of the corruptibility of public officials Model A Model B Variables b (SE) Odds ratio b (SE) Odds ratio Imitation .922***
(.280) 2.514 .792***
(.291) 2.208
Definition .576*** (.268)
1.779
Acceptance .769*** (.304)
2.157
Generalized trust -.088 (.252)
-.099 (.262)
Trust in government .187 (.278)
.198 (.291)
Job security .164 (.149)
.165 (.149)
Satisfied with salary -.207 (.169)
-.169 (.166)
Ethnicity 1.324*** (.391)
3.758 1.093*** (.429)
2.983
Constant -18.551*** (1.123)
-18.653*** (1.121)
Controls# Pseudo-R2 .107 .114 Wald χ2 60.253*** 66.211*** N 901 901 #Controls include: age, sex, education, family income, type of job, region, satisfaction with personal welfare compared to five years ago, how often the respondent follows national news. Note: Dependent variable: Corruptibility. Standard errors in parentheses, ***p<.01, one-tailed.
At the same time, the results provide considerable support for the variables derived
from the social learning theory. Imitation is a significant predictor of the corruptibility of a
public official in both models. For a unit increase in the Imitation score (e.g. from an average
of “not at all common” to “not very common”), the odds of agreeing with a corrupt deal
increase by a factor of 2.5 (model A) or 2.2 (model B). Thus, moving from the minimum to
the maximum, somebody who thinks that corrupt activities are very common is about 10
times more likely to be corruptible than somebody who thinks that corrupt activities are not at
all common. This is a very considerable effect. Further, corruptibility is also significantly
related to Definitions and Acceptance – the alternative measures of how favorably corrupt
activities are described. As predicted by theory, the more acceptable the corrupt behavior is
18
perceived to be, the greater the likelihood of engaging in it. Indeed, for a unit increase in the
Acceptance or Definitions score, the odds of agreeing to participate in a corrupt deal increase
about two times. Again, a public official who perceives the different corrupt activities as
completely acceptable is about eight times more likely to be corruptible than an official who
perceives the same activities as not acceptable at all.
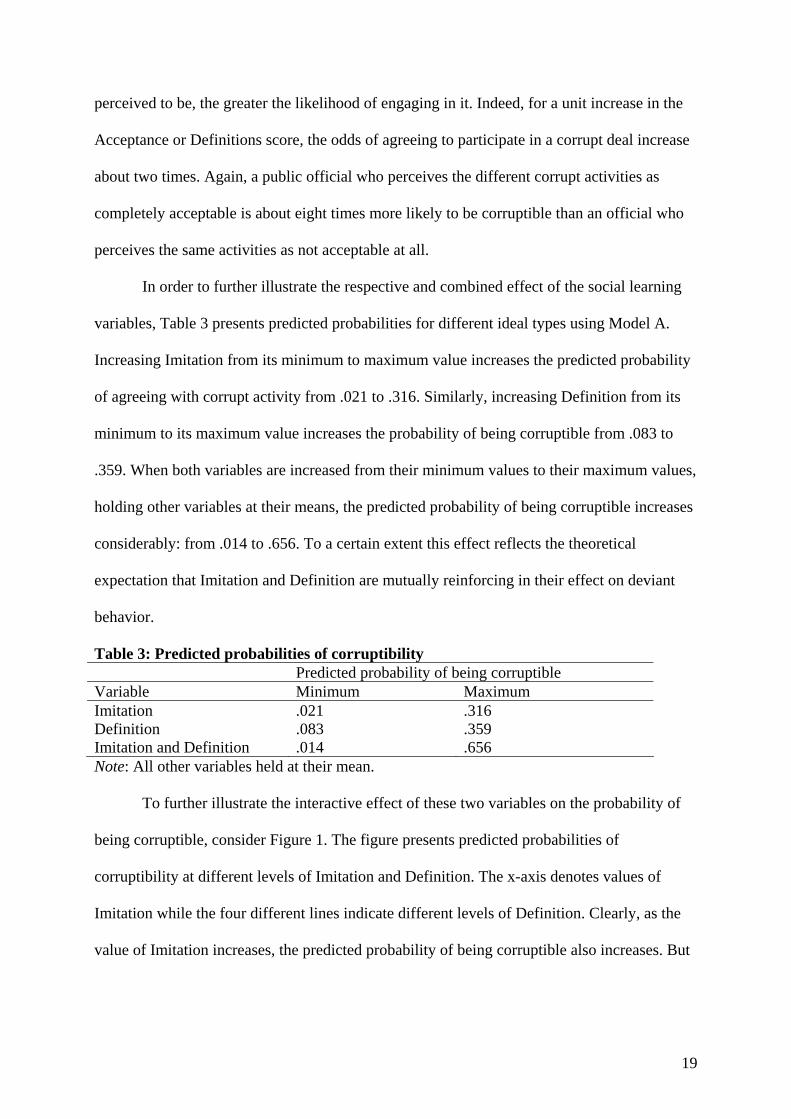
In order to further illustrate the respective and combined effect of the social learning
variables, Table 3 presents predicted probabilities for different ideal types using Model A.
Increasing Imitation from its minimum to maximum value increases the predicted probability
of agreeing with corrupt activity from .021 to .316. Similarly, increasing Definition from its
minimum to its maximum value increases the probability of being corruptible from .083 to
.359. When both variables are increased from their minimum values to their maximum values,
holding other variables at their means, the predicted probability of being corruptible increases
considerably: from .014 to .656. To a certain extent this effect reflects the theoretical
expectation that Imitation and Definition are mutually reinforcing in their effect on deviant
behavior.
Table 3: Predicted probabilities of corruptibility Predicted probability of being corruptible Variable Minimum Maximum Imitation .021 .316 Definition .083 .359 Imitation and Definition .014 .656 Note: All other variables held at their mean.
To further illustrate the interactive effect of these two variables on the probability of
being corruptible, consider Figure 1. The figure presents predicted probabilities of
corruptibility at different levels of Imitation and Definition. The x-axis denotes values of
Imitation while the four different lines indicate different levels of Definition. Clearly, as the
value of Imitation increases, the predicted probability of being corruptible also increases. But
19
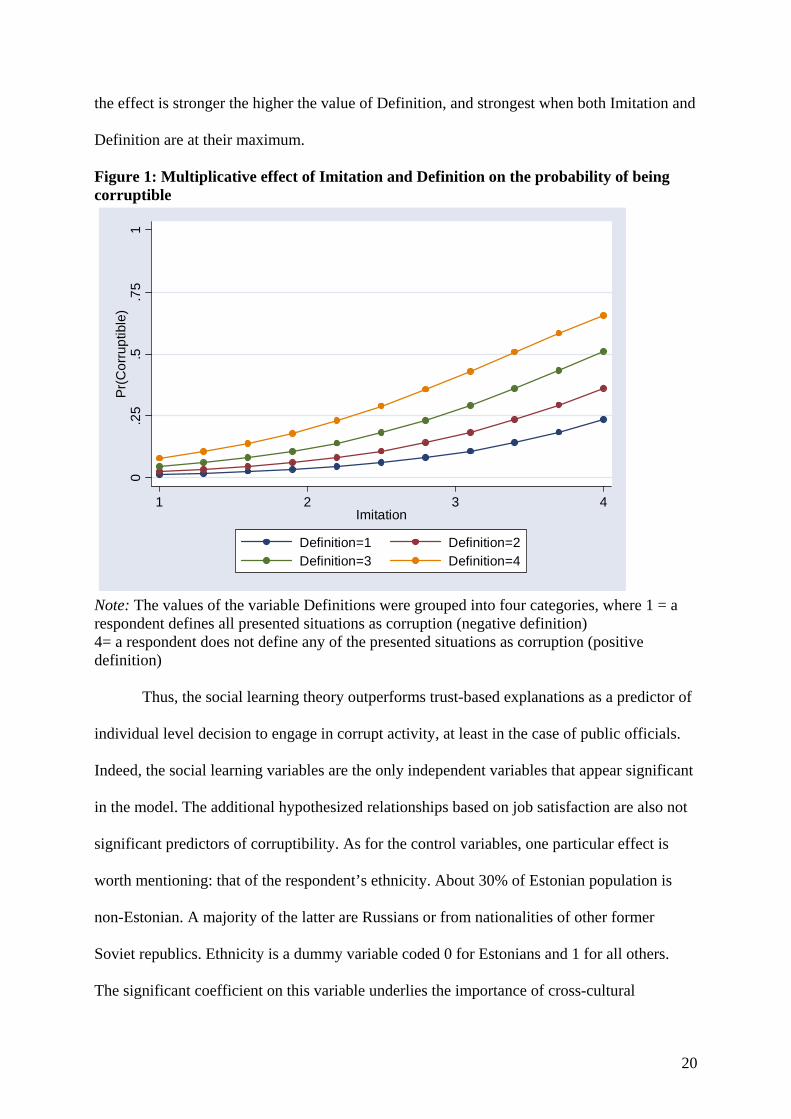
the effect is stronger the higher the value of Definition, and strongest when both Imitation and
Definition are at their maximum.
Figure 1: Multiplicative effect of Imitation and Definition on the probability of being corruptible
0.2
5.5
.75
1Pr
(Cor
rupt
ible
)
1 2 3 4Imitation
Definition=1 Definition=2Definition=3 Definition=4
Note: The values of the variable Definitions were grouped into four categories, where 1 = a respondent defines all presented situations as corruption (negative definition) 4= a respondent does not define any of the presented situations as corruption (positive definition)
Thus, the social learning theory outperforms trust-based explanations as a predictor of
individual level decision to engage in corrupt activity, at least in the case of public officials.
Indeed, the social learning variables are the only independent variables that appear significant
in the model. The additional hypothesized relationships based on job satisfaction are also not
significant predictors of corruptibility. As for the control variables, one particular effect is
worth mentioning: that of the respondent’s ethnicity. About 30% of Estonian population is
non-Estonian. A majority of the latter are Russians or from nationalities of other former
Soviet republics. Ethnicity is a dummy variable coded 0 for Estonians and 1 for all others.
The significant coefficient on this variable underlies the importance of cross-cultural
20
differences in the level of corruption and corruptibility. It supports those who oppose a
unified definition and explanation of corruption applicable across cultures. As the current
analysis shows, although the individual level motivations for corrupt behavior are accounted
for, ethnicity has still a strong effect on the extent to which an official agrees to participate in
a corrupt exchange. Similar differences between nationalities have been pointed out also in
previous research (Miller et al. 2001). Exploring this finding further is beyond the scope of
the current study, but deserves attention in future studies.
Results for the general public
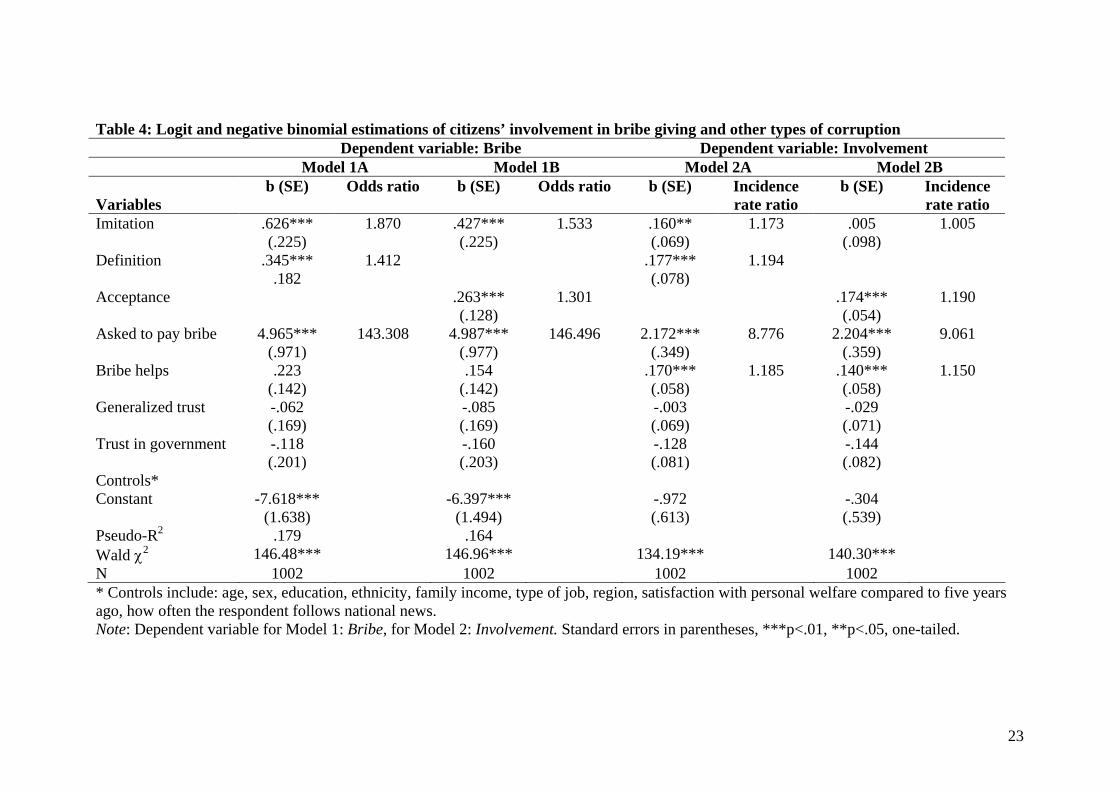
Table 4 reports the results for the analysis of general public. It presents four different
models: Models 1 use Bribe as the dependent variable, while Models 2 use Involvement; A
and B under different models differ in the measure for definitions: A reports results with
Definitions, B with Acceptance. Please note also that Bribe is a binary variable, which is why
Models 1A and 1B are estimated with logit. Involvement, however, is a count variable with a
considerable overdispersion (for Model 2A G2 = 526.59, p<.01; for Model 2B G2 = 540.23,
p<.01). Thus, models 2A and 2B are estimated with a negative binomial regression model
rather than Poisson. Again, the second column reports odds ratios and incidence rate ratios for
logit and negative binomial models respectively, for easier interpretation.
As was the case with public officials, the trust-based explanations of engaging in
corruption are not supported by the results of the analysis. Both generalized trust and trust in
government remain consistently insignificant in all four models. Again, these results are not
altered when the trust variables are entered in the models one by one or when trust in
government variable is disaggregated into its constituent components. Both variables remain
insignificant even if the variables with the strongest effects – extortion and the social learning
variables – are excluded from the analyses. In sum, I have been unable to detect any empirical
evidence that trust in others or in government is associated with less corruptibility or a
21

As for the substantive explanation of the social learning variables, consider Model 1.
For a unit increase in imitation, the odds of offering a bribe increase by 87% (model 1A) or
53% (model 1B). For a unit increase in positive definitions or acceptability of corrupt
activities the odds of offering a bribe increase 40% or 30% respectively. The second and the
third column in Table 4 reports predicted probabilities of offering a bribe in order to better
illustrate the respective and combined effect of Imitation and Definition. All other variables
are held at their means. Increasing the value of Imitation from its minimum to its maximum
increases the predicted probability of offering a bribe from .045 to .211; a similar
manipulation in the values of Definition increase the predicted probability from .095 to .260;
the combined effect of Imitation and Definition amounts to an increase in predicted
probability from .033 to .396.
The variables based on social learning behave similarly to those in the analysis of
public officials: both Definition and Imitation are statistically significant in almost all models.
The only exception is model 2B where Imitation fails to reach the level of statistical
significance. The effects remain significant even when controlling for extortion, i.e. whether
the respondents were asked to pay a bribe. This is by far the strongest predictor of both
actually having paid a bribe and being involved in a corrupt deal. Indeed, about half of the
respondents who had positive scores on the variable Bribe, also stated that they had been
asked to pay a bribe. When this variable is excluded from the analysis, the performance of the
social learning variables improves even more. The fact that the relationships survive despite
including this powerful control offers additional confidence in the theoretical and empirical
importance of the social learning variables.
willingness to engage in corrupt activities, both in the case of public officials (demand side)
and citizens (supply side).
22
23
Table 4: Logit and negative binomial estimations of citizens’ involvement in bribe giving and other types of corruption Dependent variable: Bribe Dependent variable: Involvement Model 1A Model 1B Model 2A Model 2B Variables
b (SE) Odds ratio b (SE) Odds ratio b (SE) Incidence rate ratio
b (SE) Incidence rate ratio
Imitation .626*** 1.870(.225)
.427***(.225)
1.533 .160**(.069)
1.173 .005(.098)
1.005
Definition
trols*
.345*** 1.412.182
.177***(.078)
1.194
Acceptance .263*** 1.301(.128)
.174***(.054)
1.190
Asked to pay bribe 4.965*** (.971)
143.308 4.987***(.977)
146.496 2.172***(.349)
8.776 2.204***(.359)
9.061
Bribe helps .223 (.142)
.154 (.142)
.170*** 1.185(.058)
.140***(.058)
1.150
Generalized trust -.062 (.169)
-.085(.169)
-.003(.069)
-.029(.071)
Trust in government -.118 (.201)
-.160(.203)
-.128(.081)
-.144(.082)
ConConstant -7.618***
(1.638) -6.397***
(1.494) -.972(.613)
-.304(.539)
Pseudo-R2 .179 .164Wald χ2 146.48*** 146.96*** 134.19*** 140.30***N 1002 1002 1002 1002* Controls include: age, sex, education, ethnicity, family income, type of job, region, satisfaction with personal welfare compared to five years ago, how often the respondent follows national news. Note: Dependent variable for Model 1: Bribe, for Model 2: Involvement. Standard errors in parentheses, ***p<.01, **p<.05, one-tailed.

In model 2, a unit increase in the Imitation increases the number of corrupt
activities that a person has been involved in by about 17 percent. The effect of the
alternative measures of definition is almost equal in models 2A and 2B. One unit
increase in a positive definition or acceptability of corruption increases the number of
corrupt activities a person has been involved with by about 19%. As the dependent
variable in Model 2 is a count variable, I have used predicted counts rather than
predicted probabilities to illustrate the effects of Imitation and Definition. These
predicted counts for different scenarios are reported in the last two columns of Table
5. Increasing the value of Imitation from its minimum to its maximum increases the
predicted count of corrupt activities that an individual has been involved with from
1.25 to 2.17. A similar manipulation of the values of Definition increases the
respective count from 1.56 to 2.6. The combined effect of these variables is even
stronger, as expected: the predicted count increases from 1.09 to 3.17 corrupt
activities when both variables are moved from their minimum values to their
maximum values, holding other variables at their mean.
Table 5: Predicted probabilities of offering a bribe and predicted counts of corrupt activities an individual has been involved with Predicted probabilities of
offering a bribe Predicted counts of corrupt activities
Variable Minimum Maximum Minimum Maximum Imitation .045 .211 1.25 2.17 Definition .095 .260 1.56 2.60 Imitation and Definition
.033 .396 1.09 3.17
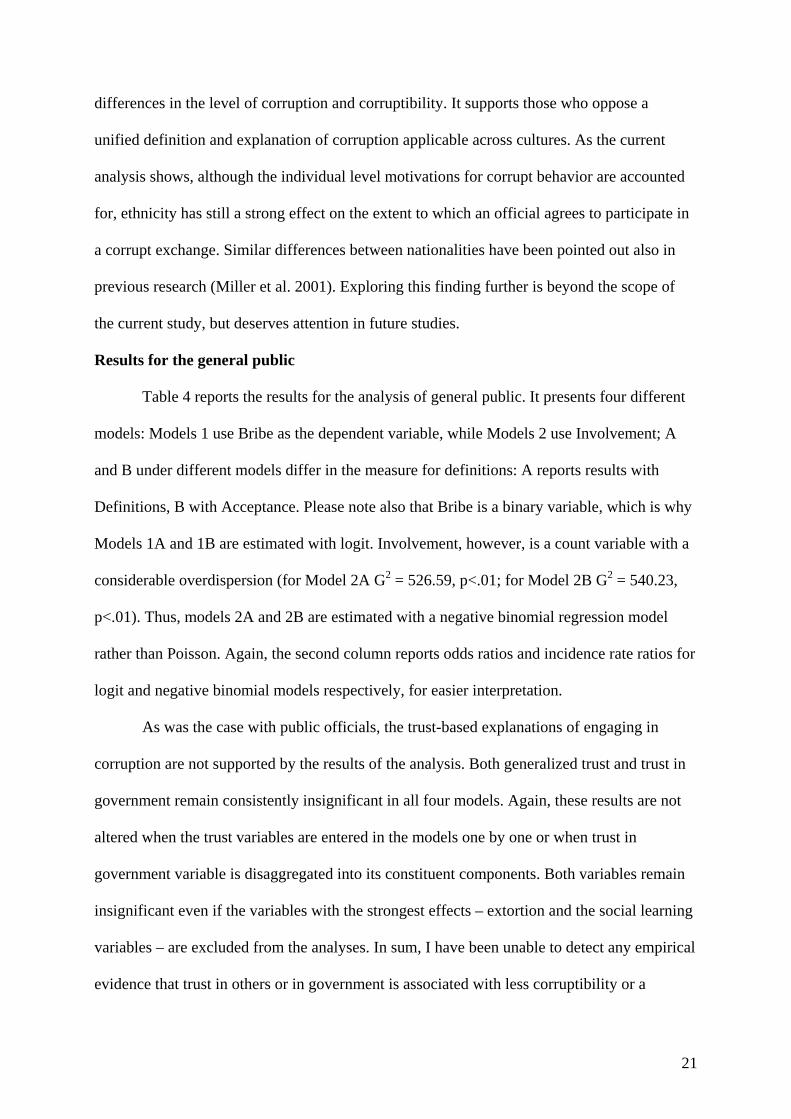
Note: Other variables at their mean. Figure 2 combines two graphs: the one on the left illustrates the interactive
effect of Imitation and Definition on the probability of offering a bribe; the one on the
right illustrates the same effect on the probability of zero count of corrupt activities,
i.e. on the probability that an individual has not been involved with any corrupt
activities. The presentations differ again because in the latter case, the dependent
24
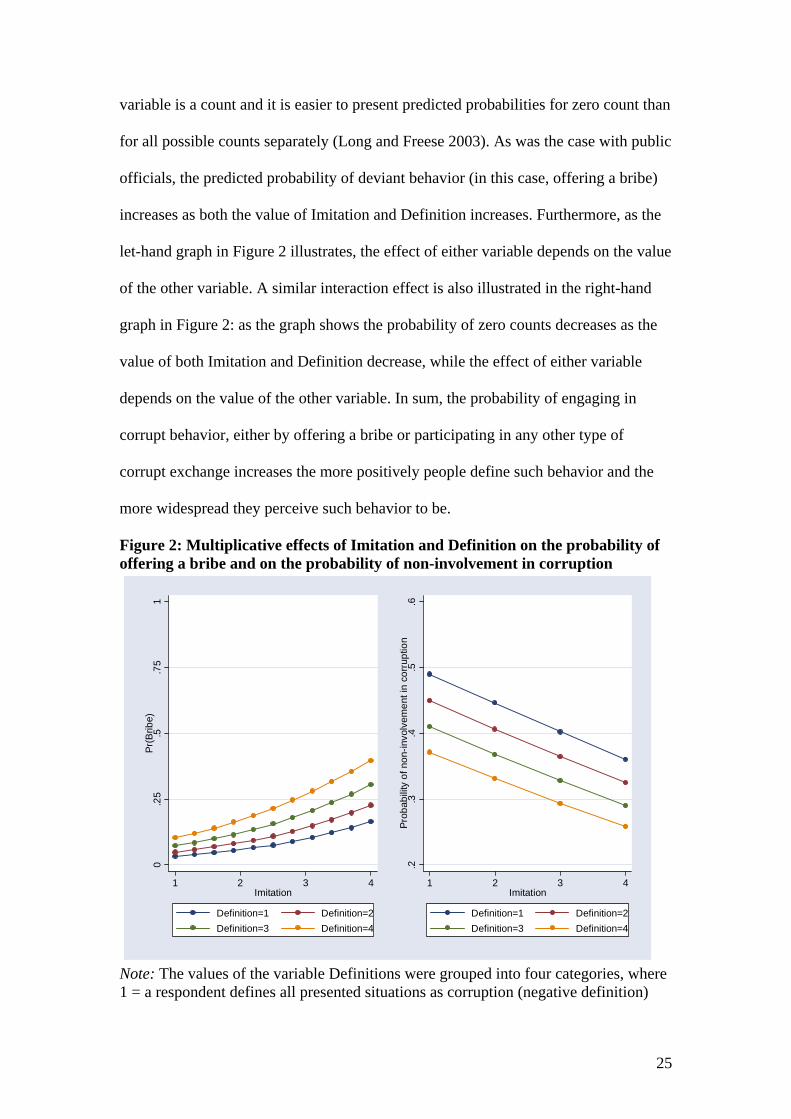
variable is a count and it is easier to present predicted probabilities for zero count than
for all possible counts separately (Long and Freese 2003). As was the case with public
officials, the predicted probability of deviant behavior (in this case, offering a bribe)
increases as both the value of Imitation and Definition increases. Furthermore, as the
let-hand graph in Figure 2 illustrates, the effect of either variable depends on the value
of the other variable. A similar interaction effect is also illustrated in the right-hand
graph in Figure 2: as the graph shows the probability of zero counts decreases as the
value of both Imitation and Definition decrease, while the effect of either variable
depends on the value of the other variable. In sum, the probability of engaging in
corrupt behavior, either by offering a bribe or participating in any other type of
corrupt exchange increases the more positively people define such behavior and the
more widespread they perceive such behavior to be.
Figure 2: Multiplicative effects of Imitation and Definition on the probability of offering a bribe and on the probability of non-involvement in corruption
0.2
5.5
.75
1Pr
(Brib
e)
1 2 3 4Imitation
Definition=1 Definition=2Definition=3 Definition=4
.2.3
.4.5
.6Pr
obab
ility
of n
on-in
volv
emen
t in
corr
uptio
n
1 2 3 4Imitation
Definition=1 Definition=2Definition=3 Definition=4
Note: The values of the variable Definitions were grouped into four categories, where 1 = a respondent defines all presented situations as corruption (negative definition)
25

4= a respondent does not define any of the presented situations as corruption (positive definition) In addition to the variable capturing extortion or the extent to which
respondents have been asked to pay a bribe and the social learning variables, the
belief that a bribe helps to increase the responsiveness of public officials is also a
significant predictor of the extent to which an individual engages in corrupt exchange,
though not of the probability of offering a bribe. In alternative models (2A and 2B),
one unit increase in the belief of the power of bribe increases the number of corrupt
activities a person has been involved with by 15-18%. Contrary to the analysis of the
sample of public officials, ethnicity does not reach the conventional level of statistical
significance in the case of the general public. The variable becomes weakly
significant only when the indicator measuring extortion is excluded from the analysis.
There is a significant difference between the share of Estonians and non-Estonians
who have offered a bribe: the shares are 36% and 48% respectively. For Involvement,
the difference, while similar in proportion, is not statistically significant. Thus,
nothing conclusive can be inferred about the potential effect of ethnicity in
determining corruption. However, the topic of cultural differences in defining
corruption is worth pursuing, especially considering that an overwhelming majority of
existing studies takes a one-size-fits-all approach to defining corruption across
nations.15
15 A preliminary look at the differences in the definition, acceptability and perception
of commonness of corrupt behaviour between Estonians and non-Estonians using the
current datasets and the variables employed in the analyses presented above indicates
that these differences are significant both in the case of public officials as well as the
general public.
26
In sum, the empirical models demonstrate rather well the individual level
rationale, a utility and value-based calculation of whether or not to engage in corrupt
exchange. Both public officials as well as citizens are motivated by their perception of
what is acceptable and commonplace behavior in their decision to participate in
corruption. At the same time, the general views of government and other people as
trustworthy and fair remains inconsequential for such a decision.
Conclusions
Research on corruption is a growth industry. Given the negative consequences of
corruption on the economy and democratic legitimacy, there clearly is a need to better
understand the causes of corruption. There is a growing list of studies on cross-
national variation in (mostly perceived) levels of corruption that have put forward an
endless list of economic, structural, institutional, political, and geographic variables
that arguably cause some countries to be more corrupt than others. In essence,
however, people are corrupt, not countries. Thus, as informative as the cross-national
studies of corruption may be about how different structural conditions co-vary with
country’s level of corruption, they do not tell us about the individual level motivation
to engage in corrupt exchange.
This study has taken the individual level approach and tackled the question of
why public officials and citizens engage in corrupt exchange. I have argued and
shown that willingness to engage in corrupt behavior is more likely when one does
not define corruption as morally or situationally wrong, but rather considers it as an
acceptable mode for exchange. Furthermore, a willingness to engage in corruption is
also enhanced by the perception that such a behavior is widespread and, thus,
approved. At the same time, the analyses provide no support for a more common
hypothesis for engaging in corrupt behavior – that people who are less trusting of their
27
fellow-citizens and of government institutions, are more likely to engage in
corruption.
These findings have several important implications, related to both policy and
theory. First, the results suggest that there are significant interpersonal differences in
willingness to engage in corrupt exchange. Thus, the level of corruption is not
exclusively a structural phenomenon: within similar structural circumstances some
people are more prone to corruption than others. The results also suggest that
intervention strategies designed to reduce the street-level corruption should target the
social processes through which public officials and citizens learn that corrupt behavior
is acceptable. The focus of such effort should be on raising awareness of acceptable
and unacceptable (or illegal) behavior, because, as the strong influence of definitions
indicated, it is not necessarily that people purposely break the law, but they may just
not be aware that what they are doing is corrupt. This is especially important in the
case of public officials, who are in the position to either promote or stop a corrupt
exchange. Furthermore, the analysis uncovered important linkages between the
attitudes and behaviors of public officials; these attitudes may translate directly into
“on-the-street” behaviors. In sum, individual level reasons for corruption could more
easily be combated by developing a supportive subculture among public officials and
by educating the general public than the much more daunting task of instilling trust or
through an easier, but perhaps too far removed task of changing institutional
structures, as suggested by previous studies.
These are just initial suggestions. Further studies into individual level
determinants of corrupt behavior are necessary to be able to make any conclusive
recommendations. Future studies might concentrate on the actual process of attitude
formation about corruption in order to paint a fuller picture of the social processes
28
leading to corruption. Other future research might empirically assess the extent to
which the definitions and models of behavior are acquired or conditioned via
association with one’s peers, as Akers’ social learning theory suggests, and examine
the extent to which bureaucratic subcultures can be conditioned to curb corruption.
The results of the current study also provide other leads for further research. I have
shown that there may be a significant cross-cultural difference in the definition of
corruption and hence in a willingness to engage in corrupt behavior. These
differences, although sometimes recognized in a footnote, are usually not taken
seriously in cross-national research. Future studies should explore this relationship in
order to determine whether the finding is specific to the current dataset, or more
general, and thus, more consequential to cross-national research.
Last but not least, this study also contributes to the discussion about the
relationship between corruption and trust, both in terms of trust in other people as well
as trust in government institutions (or democratic legitimacy as some authors have
called it (Seligson 2002)). The non-finding presented in this study does not mean that
trust and corruption are not related. Rather, this non-finding helped to clarify when
trust and corruption may be related. Given the complex, and under certain conditions,
reciprocal relationship between trust and corruption, it is as important to know when
trust and corruption are not related as when they are. The current study has shown that
when engagement in corrupt exchange is voluntary, or even unsuspecting, then the
extent to which a person trusts other people or government has no effect on his or her
willingness to engage in corrupt activity. This does not invalidate the findings that
when extorted, people lose trust in their government (as Seligson 2002 shows) or
when being skeptical about one’s government and the trustworthiness of other people,
29
one also tends to perceive others (including government) to be more corrupt (Della
Porta 2000).
References Ades, Alberto and Rafael DiTella. 1996. “The Causes and Consequences of
Corruption: A Review of Recent Empirical Contributions.” Institute of Development Studies Bulletin 27 (2): 6-10.
Adsera, Alicia, Carles Boix and Mark Payne. 2003. “Are You Being Served? Political Accountability and Quality of Government.” Journal of Law Economics & Organization 19 (2): 445-490.
Akers, Ronald L. 1988. Social Structure and Social Learning. Los Angeles: Roxbury. Akers, Ronald L., Marvin D. Krohn, Lonn Lanza-Kaduze, and Marcia Radosevic.
1979. “Social Learning and Deviant Behavior: A Specific Test of A General Theory.” American Sociological Review 44 (4): 636-655.
Allison, Paul D. 2002. Missing Data. London: Sage. Amundsen, Inge. 1999. “Political Corruption: An Introduction to the Issues.” Chr.
Michelsen Institute Working Paper 99:7. Anderson, Christopher J. and YuliaV. Tverdova. 2003. “Corruption, Political
Allegiances, and Attitudes toward Government in Contemporary Democracies.” American Journal of Political Science 47 (1): 91-109.
Andvig, Jens Christian and Odd-Helge Fjeldstad. 2001. “Corruption: A Review of Contemporary Research.” Norwegian Institute of International Affairs Report 268. Oslo.
Camp, Roderic Ai, Kenneth M. Coleman, and Charles L. Davis. 2000. “Public Opinion about Corruption: An Exploratory Study in Chile, Costa Rica and Mexico.” Paper presented at the Annual Meeting of the World Association of Public Opinion Research, Portland Oregon, May 15-17.
Camp, Roderic Ai, Kenneth M. Coleman, and Charles L. Davis. 2004. “Influence of Party Systems on Citizens’ Perceptions of Corruption and Electoral Response in Latin America.” Comparative Political Studies 37 (6): 677-703.
Chang, Eric C. C. and Miriam A. Golder. Forthcoming. “Electoral Systems, District Magnitude and Corruption.” British Journal of Political Science.
Chapell, Allison T. and Alex R. Piquero. 2004. “Applying Social Learning Theory to Police Misconduct.” Deviant Behavior 25 (1): 89-108.
Della Porta, Dontanella. 2000. “Social Capital, Beliefs in Government, and Political Corruption.” In Disaffected Democracies: What's Troubling the Trilateral Countries? ed. Susan J. Pharr and Robert D. Putnam. Princeton: Princeton University Press.
Doig, Alan and Robin Theobald (ed). 2000. Corruption and Democratisation. London: Frank Cass.
Evans, Peter B. and James Rauch. 2000. “Bureuacratic Structure and Bureaucratic Performance in Less Developed Countries.” Journal of Public Economics 75 (1): 49-62.
Fisman, Raymond and Roberta Gatti. 2002. “Decentralization and Corruption: Evidence across Countries.” Journal of Public Economics 83: 325-345.
30
Gerring, John and Strom C. Thacker. 2004. “Political Institutions and Corruption: The Role of Unitarism and Parliamentarism.” British Journal of Political Science 34: 295-330.
Gupta, Sanjeev, Hamid Davoodi, and Rosa Alonso Terne. 1998. “Does Corruption Affect Income Inequality and Poverty?” IMF Working Paper 98/76. Washington D.C.
Honaker, James, Anne Joseph, Gary King, and Kenneth Scheve. 2003. “Amelia: A Program for Missing Data.” Department of Government. Harvard University.
Jessor, Richard and Shirley L. Jessor. 1977. Problem Behavior and Psychosocial Development: A Longitudinal Study of Youth. New York: Academic Press.
King, Gary, James Honaker, Anne Joseph, and Kenneth Scheve. 2001. “Analyzing Incomplete Political Science Data: An Alternative Algorithm for Multiple Imputation.” American Political Science Review 95 (1): 49-69.
Krohn, Marvin D., William F. Skinner, James L. Massey, Ronald L. Akers. 1985. “Social Learning Theory and Adolescent Cigarette Smoking: A Longitudinal Study.” Social Problems 32 (5): 455-473.
Kunicova, Jana and Susan Rose-Ackerman. 2003. “Electoral Rules as Constraints on Corruption.” Memo. Yale University.
Lambsdorff, Johann Graf. 1999. “Corruption in Empirical Research: A Review.” Transparency International Working Paper.
Lanza-Kaduce, Lonn, Ronald L. Akers, Marvin D. Krohn, and Marcia Radosevich. 1982. “Conceptual and Analytical Models in Testing Social Learning Theory: Reply.” American Sociological Review 47 (1): 169-173.
LaPorta, Rafael, Florencio Lopez-Silanes, Andrei Schleifer, and Robert W. Vishney. 1998. “The Quality of Government.” Journal of Law Economics & Organization 15 (1): 222-279.
Letki, Natalia. 2005. “Investigating Roots of Civic Morality: Trust, Civic Community, and Institutional Performance.” Nuffield College Working Papers in Politics 2003-W13. University of Oxford.
Levi, Margaret and Laura Stoker. 2000. “Political Trust and Trustworthiness.” Annual Review of Political Science 3: 475-507.
Lipset, Seymour Martin and Gabriel Salman Lenz. 2000. “Corruption, Culture and Markets.” In Culture Matters: How Values Change Human Progress ed. Lawrence J. Harrison and Samuel P. Huntington. New York: Basic Books.
Long, Scott J. and Jeremy Freese. 2003. Regression Models for Categorical Dependent Variables Using Stata. College Station: Stata.
Mauro, Paolo. 1995. “Corruption and Growth.” The Quarterly Journal of Economics 110 (3): 681-712.
Miller, William L., Åse B. Grødeland, and Tatyana Y. Koshechkina. 2001. A Culture of Corruption: Coping with Government in Post-Communist Europe. Budapest: Central European University Press.
Montionola, Gabriella R. and Robert W. Jackman. 2002. “Sources of Corruption: A Cross-Country Study.” British Journal of Political Science 32(1): 147-170.
Morris, Stephen D. 1991. Corruption and Politics in Contemporary Mexico. Tuscaloosa: University of Alabama Press.
Nagin, Daniel and Raymond Paternoster. 1993. “Enduring Individual Differences and Rational Choice Theories of Crime.” Law and Society Review 27: 467-96.
Paldam, Martin. 2002. “The Cross-Country Pattern of Corruption: Economics, Culture and the Seesaw Dynamics.” European Journal of Political Economy 18: 215-240.
31

Persson, Torsten, Guido Tabellini and Francesco Trebbi. 2003. “Electoral Rules and Corruption.” Journal of the European Economic Association 1 (4): 958-989.
Pharr, Susan J. 2000. “Officials' Misconduct and Public Distrust: Japan and the Trilateral Democracies.” In Disaffected Democracies: What's Troubling the Trilateral Democracies ed. Susan J. Pharr and Robert D. Putnam. Princeton: Princeton University Press.
Rose, Richard, William Mishler and Christian Haerpfer. 1998. Democracy and Its Alternatives: Understanding Postcommunist Societies. Oxford: Polity Press.
Rose-Ackerman, Susan. 1999. Corruption and Government: Causes, Consequences and Reform. Cambridge: Cambridge University Press.
Sandholtz, Wayne and William Koetzle. 2000. “Accounting for Corruption: Economic Structure, Democracy, and Trade.” International Studies Quarterly 44 (1): 31-50.
Scholz, John T. and Mark Lubell. 1998a. “Adaptive Political Attitudes: Duty, Trust, and Fear as Monitors of Tax Policy.” American Journal of Political Science 42 (3): 903-920.
Scholz, John T. and Mark Lubell. 1998b. “Trust and Taxpaying: Testing the Heuristic Approach to Collective Action.” American Journal of Political Science 42 (2): 398-417.
Seligson, Michell A. 2002. “The Impact of Corruption on Regime Legitimacy: A Comparative Study of Four Latin American Countries.” Journal of Politics 64(2): 408-433.
Sung, Hung En. 2004. “Democracy and Political Corruption: A cross-national Comparison.” Crime, Law and Social Change 41 (2): 179-194.
Tanzi, Vito. 1998. “Corruption around the World - Causes, Consequences, Scope, and Cures.” International Monetary Fund Staff Papers 45 (4): 559-594.
Thornberry, Terence P. and Marvin D. Krohn. 2000. “The Self-Report Method for Measuring Delinquency and Crime.” Criminal Justice 4: 33-83.
Treisman, Daniel. 2000. “The Causes of Corruption: A Cross-National Study.” Journal of Public Economics 76: 399-457.
Tyler, Tom R. 1990. Why People Obey Law? New Haven: Yale University Press. Tyler, Tom R. 1998. “Trust and Democratic Government.” In Trust and Governance
ed. Valerie Braithwaite and Margaret Levi. New York: Russell Sage Foundation.
Uslaner, Eric M. 2004. “Trust and Corruption.” In The New Institutional Economics of Corruption ed. Markus Taube Johann Graf Lambsdorff, and Matthias Schramm. London: Routledge.
Uslaner, Eric M. and Gabriel Badescu. 2003. “Making the Grade in Transition: Equality, Transparency, Trust, and Fairness.” Memo. University of Maryland.
Uslaner, Eric M. and Gabriel Badescu. 2004. “Honesty, Trust and the Legal Norms in the Tranistion Democracy: Why Bo Rothstein is Better Able to Explain Sweden than Romania.” In Creating Social Trust in Post-Socialist Transition ed. Janos Kornai, Bo Rothstein and Susan Rose-Ackerman. New York: Palgarve Macmillan.
Weber, James. 1992. “Scenarios in Business Ethics Research: Review, Critical Assessment, and Recommendations.” Business Ethics Quarterly 2 (2): 137-160.
Wei, Shang-Jin. 2000. “Natural Openness and Good Government.” National Bureau of Economic Research Working Paper 7765. Cambridge, MA.
32