causal discovery from mass cytometry data presenters: ioannis tsamardinos and sofia triantafillou...
TRANSCRIPT

Causal Discovery from Mass Cytometry DataPresenters: Ioannis Tsamardinos and Sofia Triantafillou
Institute of Computer Science, Foundation for Research and Technology, HellasComputer Science Department, University of Cretein collaboration with Computational Medicine Unit, Karolinska Institutet
1

2
The Measuring Technology
3
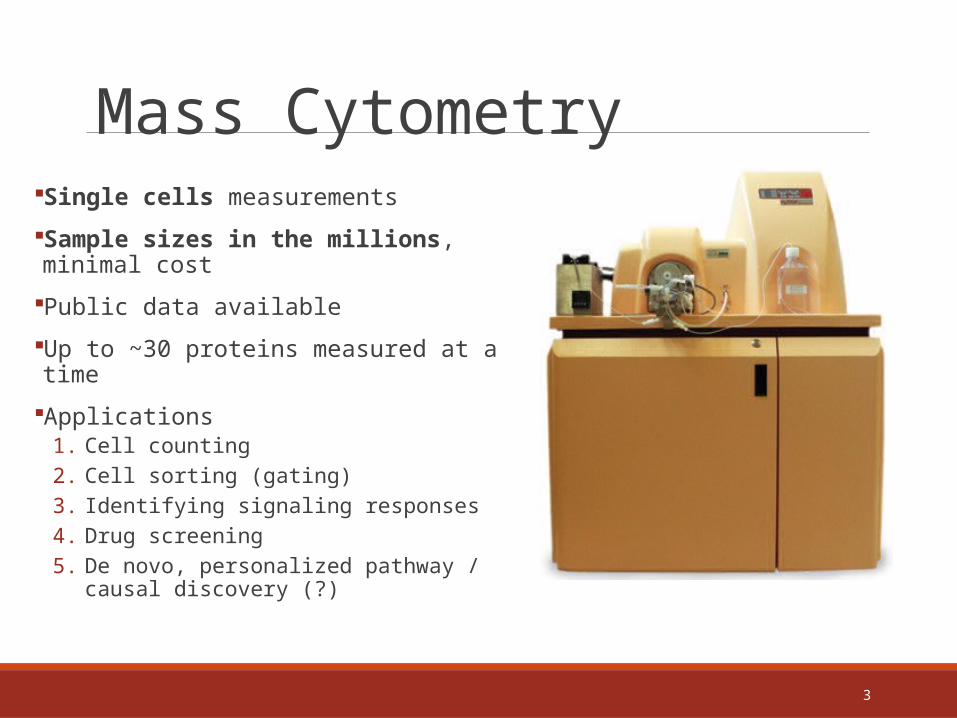
Mass CytometrySingle cells measurements
Sample sizes in the millions, minimal cost
Public data available
Up to ~30 proteins measured at a time
Applications1. Cell counting2. Cell sorting (gating)3. Identifying signaling responses4. Drug screening5. De novo, personalized pathway / causal
discovery (?)

4
Mass Cytometry
[Image by Bendall et al., Science 2011]
5
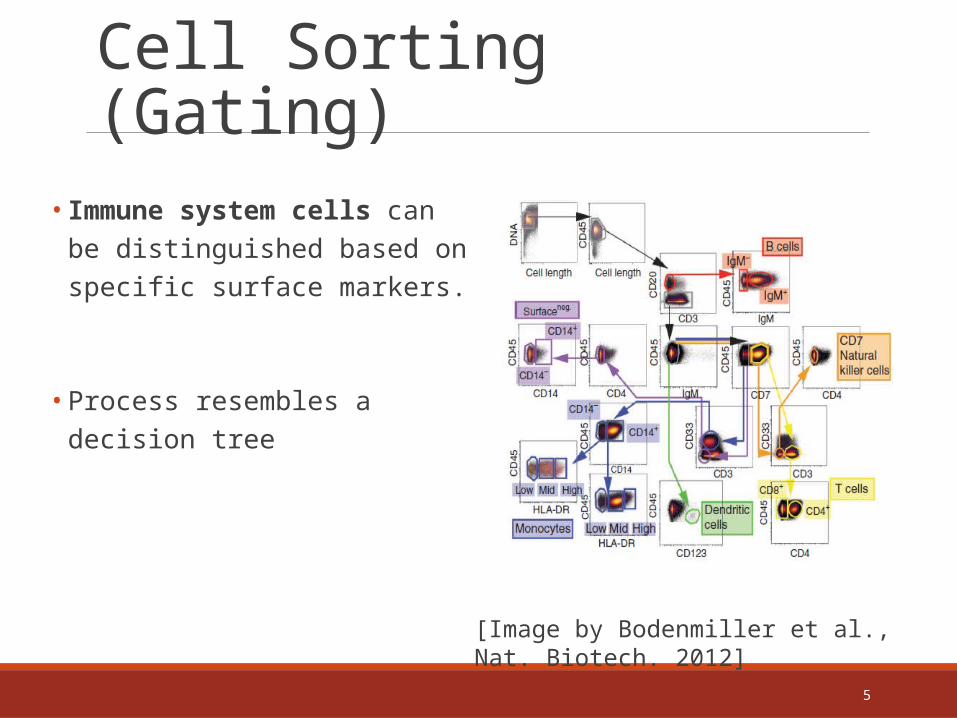
Cell Sorting (Gating)• Immune system cells can be
distinguished based on specific surface markers.
• Process resembles a decision tree
[Image by Bodenmiller et al., Nat. Biotech. 2012]

6
Identifying Signaling Responses
• Immune responses are triggered by specific activators
• Signaling responses are sub-population specific.
• Mass cytometry for identifying signaling effects:
1. Functional proteins (non-surface) are also marked (e.g., pSTAT3 and pSTAT5)
2. Activators are applied to stimulate a response to disease
3. Cells are sorted by sub-population
4. Changes in protein abundance/phosphorylation in each subpopulation are quantified
Columns correspond to Different subpopulations
Difference in log2 mean intensity of the stimulated condition compared with the unstimulated control
[Image by Bendall et al., Science 2011]

7
Drug Screening
• Unwanted signaling responses should be suppressed for disease treatment
• Mass cytometry for drug screening1. After stimulation, cells are treated with
potential drugs (inhibitors)
2. Cells are sorted by sub-population
3. Dose-response curves are identified◦ Per activator
◦ Per sub-population
◦ Per inhibitor
[Image by Bodenmiller et al., Nat. Biotech. 2012]

8
The Public Data
9
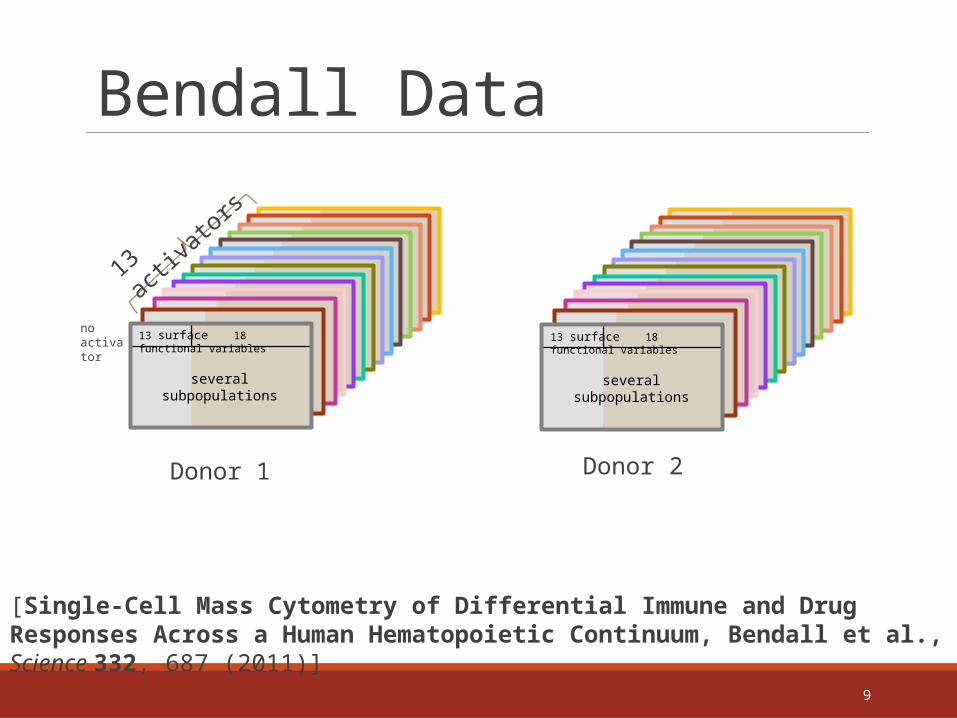
13 activators
Bendall Data
13 surface 18 functional variables
several subpopulations
Donor 1
13 surface 18 functional variables
several subpopulations
Donor 2
[Single-Cell Mass Cytometry of Differential Immune and Drug Responses Across a Human Hematopoietic Continuum, Bendall et al., Science 332, 687 (2011)]
no activator
10
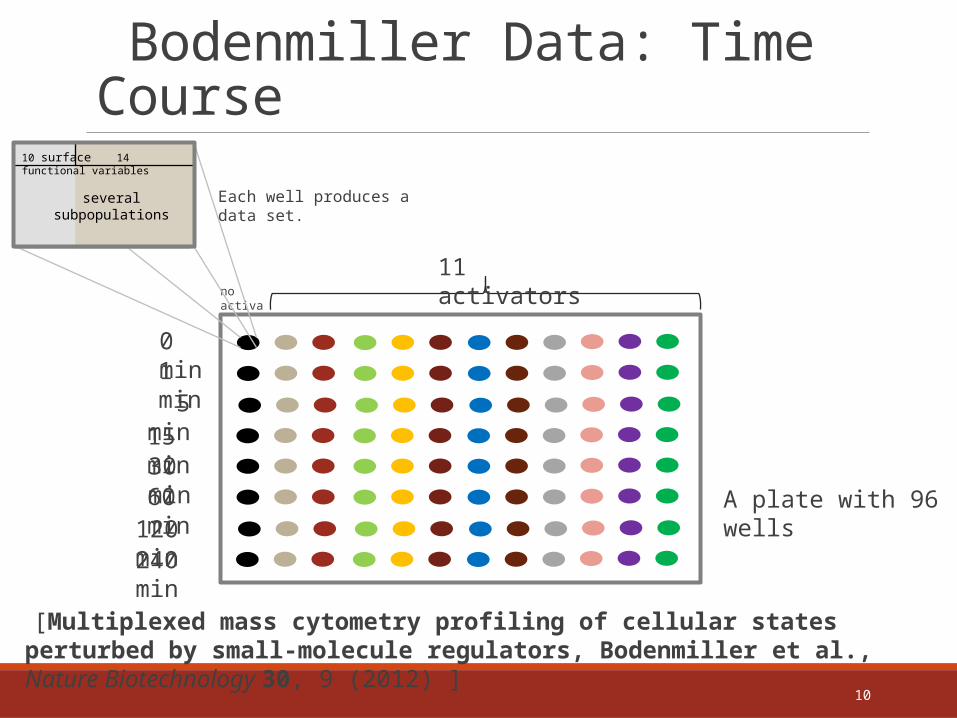
no activator
Bodenmiller Data: Time Course
10 surface 14 functional variables
0 min1 min
5 min15 min30 min60 min
120 min240 min
11 activators
Each well produces a data set.
10 surface 14 functional variables
several subpopulations
[Multiplexed mass cytometry profiling of cellular states perturbed by small-molecule regulators, Bodenmiller et al., Nature Biotechnology 30, 9 (2012) ]
A plate with 96 wells

11
no activator
Bodenmiller Data: 8 donors
8 donors
11 activators
A plate with 96 wells
Each well produces a data set.
10 surface 14 functional variables
several subpopulations
[Multiplexed mass cytometry profiling of cellular states perturbed by small-molecule regulators, Bodenmiller et al., Nature Biotechnology 30, 9 (2012) ]

12
Bodenmiller Data: Inhibitors
Inhibitor(drug) in 7 dosages
11 activators
27 inhibitors
10 surface 14 functional variables
several subpopulations
[Multiplexed mass cytometry profiling of cellular states perturbed by small-molecule regulators, Bodenmiller et al., Nature Biotechnology 30, 9 (2012) ]

13
Bodenmiller data Bendall data
Inhibitor data 8donor data Time course data
ActivatorsTimeDonorsInhibitorsSubpopulationsProteins
Collection of datasets with :All activators
1 time point (30’)1 donor
All InhibitorsAll Subpopulations
All 10+14 markers measured
Data summary

14
Data Summary BTK ERK HLADR IgM NFkB P38 PLCg2
S6 SHP2 SLP76 STAT3 STAT5 ZAP70 Creb CrkL CXCR4
H3 IkB a Ki67
MAPKAPK2 Src AKT LAT STAT1
BCR
GCSF
IFNa
LPS
PMA
PVO4
Flt3L
IL3
GMCSF
IL7
SCF
TNFα
TPO
IFN-g
IL-2
IL-3Bodenmiller
Bendall
ACTIVATORS
Functional Proteins
Both

Causal Discovery in Mass Cytometry
• Feedback loops• Latent variables• Non-linear relations• Unfaithfulness
A typical day in the cell
Image courtesy of Dr. Brad Marsh

16
A Basic Approach

17
Local Causal Discovery
Nothing causes X
X Y Z
Use stimulus as instrumental binary
variable
X Y Z
X Y Z
X Y Z
X Y Z
X Y Z
X Y Z
X Y Z
X Y Z
X Y Z
𝐼𝑛𝑑(𝑋 ,𝑍∨𝑌 )
Assumptions:1. Causal Markov Condition2. Reichenbach’s Common Cause
Principle3. No feedback cycles

18
Issue #1: Signaling is Sub-Population Specific
• Gate data◦ Data were gated by the initial researchers in Cytobank.org
• Analyze sub-populations independently
• Gated sub-populations differ between Bodenmiller and Bendall◦ cd4+, cd8+, nk sub-populations in common.
Bodenmiller Bendall
cd14+hladr-,cd14+hladrhighcd14+hladrmidcd14+surf-cd14-hladr-cd14-hladrhighcd14-hladrmid
cd14-surf-cd4+cd8+dendriticigm+igm-nk
Pre-B IIMature CD38lo BPre-B IMature CD38mid BImmature BPlasma cellnkMyelocyte
Mature CD4+ TNaive CD4+ TCMPNaive CD8+ TMature CD8+ TCD11b- MonocyteCD11bmid MonocyteCD11bhi Monocyte
MPPHSC Megakaryocyte Erythroblast PlateletMEPPlasmacytoid DCGMP

19
Issue #2:Dormant Relations
• Relations may appear only during signaling◦ Pool together unstimulated and stimulated data
• Different parts of the pathway maybe activated by different activators◦ Analyze data from different activators independently

20
Issue #3: Testing Independence
• Check (in)dependencies:
• Choosing a test of conditional independence◦ One binary, two continuous variables◦ Relations typically non-linear◦ Options:
1. Discretization BUT: does not preserve conditional independencies2. Rejected but promising candidates:
1. Maximal Information Coefficients (Reshef et al., Science 334, 2011)2. Kernel-based Conditional Independence test (Zhang et al., UAI 2011)
3. Fisher z-test of independence + logistic regression
S P1 P2

21
Issue #4Make Reliable Predictions
• Check ALL (in)dependencies:
1.
• Two thresholds, =0.05 for dependence, =0.15 for independence
S P1 P2
p-value
dependent𝑎
independent
𝑏0 1

22
Issue #5: Identify “Outlier” Experiments
Inhibitor(drug) in 7 dosages
27 inhibitors
11 stimuli
• Inhibitor data for “zero” dosage and 8 donor data should represent the same joint distribution
• Do they?

23
Distance
Issue #5: Identify “Outlier” Experiments
• Inhibitor data for “zero” dosage and 8 donor data should represent the same joint distribution
• Do they?
• Given a pair of plates:• For each activator, rank correlations (of markers), compute spearman correlation of ranking• Distance = 1-min correlation over activators

24
Time Course Data
First activation of occurs before first activation of
Inhibitor Data
For every inhibitor
dataset with zero inhibitor dosage and activator i +
dataset with zero inhibitor dosage and no activator
𝑇𝑟𝑖𝑝𝑙𝑒𝑡 𝑆𝑖 ,𝑃1 ,𝑃2
𝑂𝑆𝑖→𝑃1→𝑃 2++¿
is activated
All necessary dependencies
and independencies
hold
No
No
Yes
Yes
𝑆𝑐𝑜𝑟𝑒𝑆𝑖→ 𝑃1→𝑃2=𝑂𝑆𝑖→𝑃 1→ 𝑃2
𝑇 𝑃1
,
Yes𝑆𝑆𝑖→𝑃1→𝑃2=0
Return PREDICTIONS ranked by
Pipeline for making causal predictions
𝑇 𝑃1++¿
Yes
YesNo

25
Causal Postulates
• A list of predicted causal pairs, each “tagged” for a specific population and activator, ranked according to a score quantifying the frequency of appearance.
0.5482PVO pPlcg2 pSTAT3 0.875
0.5512PVO pPlcg2 pZap70 0.8125
0.7152PVO pSlp76 pSHP2 0.8125
0.6708PVO pSHP2 pSTAT3 0.7857
0.8526PVO pPlcg2 pP38 0.75
0.6166PVO pPlcg2 pZap70 0.75
0.5688PVO pSlp76 pZap70 0.75
0.4557PVO pSTAT3 pBtk 0.7059
0.5688PVO pSHP2 pZap70 0.7143
cd14-hladr-
cd14-hladrmid
cd14-hladrmid
dendritic
cd14+hladr-
cd14-hladr-
cd14-hladr-
cd14-hladrmid
cd14-hladr-0.4557
BCR pS6 pErk 0.7037 igm-
288 predictions in 14 sub-populations

26
Internal Validation
Activator Protein1 Protein2
Activator Protein3 Protein2
• 42% of the predicted triplets are also reported• Despite strict thresholds and multiple testing
• Theory+algorithms: [Tillman et. al. 2008, Triantafillou et. al 2010, Tsamardinos et. al 2012]
Check whether predicted triplet has also been reported
Activator Protein1 Protein3
Activator Protein3 Protein1
OR
Protein2
Protein2

27
Validation on Bendall Data
0.2411
PMA ERK STAT3
CD8+
0.4444
0.51850.3114
PMA P38 STAT3
0.2459
IFNa BTK SHP2 0.4231
0.1802
IFNa STAT5 ZAP70 0.5185
PMA ERK STAT3
NK
0.5185
0.4444PMA S6 NFKb
PMA S6 STAT3 0.4815
PMA ERK ZAP70 0.4074
0.3341
0.2502
0.5396
0.2236
• Run FCI with • Bootstrap for robustness• Report
• Conflicting structures: Structures where
• Confirming Structures: Structures where
Bendall Data
PMA S6 STAT3 0.4074
LPS SHP2 ZAP70 0.4444
CD4+ 0.1476
0.4352
!Measurements in Bendall data are taken 15 minutes after activation

Validation on Bendall Data
28
0.2411
PMA ERK STAT3
CD8+
0.4444
0.51850.3114
PMA P38 STAT3
0.2459
IFNa BTK SHP2 0.4231
0.1802
IFNa STAT5 ZAP70 0.5185
PMA S6 STAT3 0.4074
LPS SHP2 ZAP70 0.4444
PMA ERK STAT3
NK
0.5185
0.4444PMA S6 NFKb
PMA S6 STAT3 0.4815
PMA ERK ZAP70 0.4074
CD4+
0.010 0.3500.3341 0.1843
0.130 0.360 0.24980.2502
0.5396
0.2236
0.230 0.230 0.1891
0.050 0.450 0.1758
0.000 0.360 0.2936
0.130 0.490 0.1561
0.020 0.150 0.0793
0.050 0.020 0.0628
0.000 0.050 0.1113
0.000 0.240 0.2221
Conflicting Confirming Correlation
0.1476
0.4352

Results• Hundreds of predictions to-be-tested; Experiments under
way!
• Internal validation using non-trivial inferences
• Promising validation on another collection of dataset (Bendall)
• Evidence of batch effects and/or biological reasons of variability
• Method based on the most basic causal discovery assumptions
29

30
A Not So Basic Approach

32
Co-analyzing data sets from different experimental conditions with overlapping variable sets
Condition A Condition B
Condition C Condition D
• Different experimental conditions• Different variable sets
• Data can not be pulled together because they come from different distributions
• Principles of causality links them to the underlying causal graph

33
Co-analyzing data sets from different experimental conditions with overlapping variable sets
Condition A Condition B
Condition C Condition D
Identify a single causal graph that simultaneously fits all data

34
What type of causal graph?
• Semi-Markov causal models.
• : causes directly in the context of observed variables.
• : andshare a latent common cause.
• Under faithfulness, -separation entails all and only conditional independencies that stem from Causal Markov Condition.
• No learning algorithm.
A B DC

35
Manipulations in SMCMs
A B DC
Manipulated SMCM
• Values of are set solely by the manipulation procedure
• Graph surgery: Remove all edges into the manipulated node.
Graph (SMCM)

36
Reverse Engineering
A B DC
E
A B DC
E
A B DC
E
A B DC
E
𝑆
is latent
is latent
, is latent
Unknown True SMCM Observed (in) dependencies under manipulation and marginalization

37
Independencies as constraints
A
B
C
• Suppose you don’t know anything about the structure of the three variables.
• You find out that in :
• In path terms: path in that is m-connecting and given
• In SAT terms:
A-C does not exist
(A-B does not existOR
A-B is into B
B-C does not existOR
OR B-C is into B)
AND

38
Statistical errors• Constraints correspond to *
1. Dependencies 2. Independencies
◦ e.g.,
• Compare a dependence to an independence ◦ How?◦ Low p-value suggests dependence◦ High p-value suggests independence
(in the respective data set)What happens with statistical
errors?
Conflicts make SAT instance
unsatisfiable!
Sort constraints!
*well, not really

39
Comparing p-values
• , The proportion of p-values coming from
• If you know you can find the MAP ratio
• , E1 = 1/E0
◦ If , independence is more likely than dependence
• Sort p-values by max(E0, E1)
• Use (Storey and Tibshirani, 2003) to identify
• Minimize negative log likelihood of to identify
• Rank constraints according to MAP ratio and satisfy them if possible in the given order.

40
“COmbINE” Algorithm
Data sets measuring overlapping variables
under different experimental conditions
COmbINEAlgorithm that transforms
independence constrains to SAT instance
Summary of semi Markov Causal models that best fits all data sets
simultaneously
Eric Ellis

41
Similar Algorithms• SBCSD: [Hyttinen et al., UAI, 2013]
◦ Inherently less compact representation of path constraints.◦ Does not handle conflicts; non applicable to real data.◦ In addition, it admits cycles.◦ Scales up to 14 variables
• Lininf [Hyttinen et al., UAI 2012, JMLR 2012]◦ Linear relations only.◦ Scales up poorly (6 variables in total with overlapping variables, 10
without).◦ In addition, it admits cycles.
Execution Time in Seconds

Performance on Simulated Data
42

Application on Mass Cytometry data
43
cd4+ T-cells cd8+ T-cells
Response to PMA

Summary and Conclusions
• Mass Cytometry data a good domain for causal discovery
• Hundreds of robust causal postulates
• Approach:◦ Conservative: local discovery, performing all tests, independent analysis of populations◦ Opportunistic: using 2 thresholds for (in)dependency
• New algorithm that can handle ◦ different experimental conditions ◦ overlapping variable subsets ◦ deal with statistical errors
• Numerous directions open for future work on this collection of data◦ Experiments under way!
44

45
Acknowledgements and Credit
Ioannis Tsamardinos Associate Prof Lab Head
Sofia Triantafillou Ph.D. Candidate
Vincenzo Lagani Research Fellow
Jesper Tegnér Prof Unit Head
Angelika Schmidt Post-Doc
David Gomez-Cabrero, Project Leader
Funded by: STATegra EU project (stategra.eu)