causal analysis of the smallmouth bass decline in the ...files.dep.state.pa.us/water/drinking water...
TRANSCRIPT

Causal Analysis of the Smallmouth Bass decline in the
Susquehanna and Juniata Rivers
December 2015

Prepared by:
Dustin Shull & Molly Pulket
PA Department of Environmental Protection
Bureau of Point and Non-Point Source Management
11th Floor: Rachel Carson State Office Building
Harrisburg, PA 17105

3
Table of Contents Acknowledgments ...................................................................................................................... 4
Executive Summary ................................................................................................................... 6
Introduction ...............................................................................................................................11
Population Decline ............................................................................................................................... 11
Additional Concerns ............................................................................................................................. 13
Methods: The CADDIS Process ................................................................................................16
CADDIS Workshop 1 ........................................................................................................................... 17
CADDIS Workshop 2 ........................................................................................................................... 18
CADDIS Workshop 3 ........................................................................................................................... 19
Results ......................................................................................................................................20
The Case ............................................................................................................................................... 20
Candidate Causes ................................................................................................................................ 23
Candidate Cause 1: Increased late spring/early summer flow .................................................. 24
Candidate Cause 2: Increased intraspecific competition ........................................................... 26
Candidate Cause 3: Increased interspecific competition ........................................................... 27
Candidate Cause 4: Decreased food quality ............................................................................... 29
Candidate Cause 5: Decreased egg quality ................................................................................ 30
Candidate Cause 6: Decreased YOY habitat quality .................................................................. 32
Candidate Cause 7: Increased water temperatures ................................................................... 33
Candidate Cause 8: Increased pH or increased variability in pH ............................................. 36
Candidate Cause 9: Low dissolved oxygen concentrations ...................................................... 37
Candidate Cause 10: Ammonia Toxicity ...................................................................................... 39
Candidate Cause 11: Increased algal and cyanobacterial toxins ............................................. 41
Candidate Cause 12: Toxic chemicals .......................................................................................... 45
Candidate Cause 13: Increased Endocrine Disrupting Chemicals (EDCs) and Herbicides . 47
Candidate Cause 14: Increased pathogens and parasites ........................................................ 49
Conclusions ..............................................................................................................................53
General Discussion ...................................................................................................................56
A changing ecosystem ........................................................................................................................ 56
Recommendations and future work ................................................................................................... 61

4
Literature Cited .........................................................................................................................63
Appendix A: Conceptual Models ...............................................................................................76
Appendix B: Analysis Worksheets .............................................................................................83
Appendix C: Candidate Cause Scoring Tables..........................................................................84
Appendix D: Ongoing Studies in 2015 .......................................................................................87
Appendix E: Future Research Needs ........................................................................................90
Acknowledgments
We would like to recognize the time and effort that Sue Norton (USEPA), Gary Walters
(PADEP), and Geoff Smith (PFBC) provided in organizing and planning the three
CADDIS workshops. We would like to thank all workshop participants (listed below) for
their valuable input during the CADDIS progress.
Name Organization Email
1 Dr. Mel Zimmerman Lycoming College [email protected]
2 Mark Brickner PADEP [email protected]
3 Amy Williams PADEP [email protected]
4 Bill Brown PADEP [email protected]
5 Bonita Moore PADEP [email protected]
6 Charles McGarrell PADEP [email protected]
7 Dave Rebuck PADEP [email protected]
8 Dustin Shull PADEP [email protected]
9 Erica Bendick PADEP [email protected]
10 Gary Gocek PADEP [email protected]
11 Gary Walters PADEP [email protected]
12 Heidi Biggs PADEP [email protected]
13 Jared Dressler PADEP [email protected]
14 Jeff Butt PADEP [email protected]
15 Justin Lorson PADEP [email protected]
16 Kristen Bardell PADEP [email protected]
17 Kristen Schlauderaff PADEP [email protected]
18 Mark Hoger PADEP [email protected]
19 Megan Bradburn PADEP [email protected]
20 Michael Lookenbill PADEP [email protected]
22 Molly Pulket PADEP [email protected]
22 Rick Spear PADEP [email protected]
23 Rodney Kime PADEP [email protected]
24 Rodney McAllister PADEP [email protected]
25 Shawn Miller PADEP [email protected]
26 Thomas Barron PADEP [email protected]
27 Timothy Wertz PADEP [email protected]

5
28 Travis Stoe PADEP [email protected]
29 Walter Holtsmaster PADEP [email protected]
30 Dr. David Lieb PFBC [email protected]
31 Brian Niewinski PFBC [email protected]
32 Coja Yamashita PFBC [email protected]
33 Dave Spotts PFBC [email protected]
34 Geoff Smith PFBC [email protected]
35 Jason Detar PFBC [email protected]
36 Kristopher Kuhn PFBC [email protected]
37 Leroy Young PFBC [email protected]
38 Michael Kaufmann PFBC [email protected]
39 Robert Lorantas PFBC [email protected]
40 Robert Wnuk PFBC [email protected]
41 Aaron Henning SRBC [email protected]
42 Brianna Hutchinson SRBC [email protected]
43 Ellyn Campbell SRBC [email protected]
44 Luanne Steffy SRBC [email protected]
45 Dr. John Niles Susquehanna University [email protected]
46 Michael Bilger Susquehanna University [email protected]
47 Amy Bergdale USEPA [email protected]
48 Dr. Frank Borsuk USEPA [email protected]
49 Lou Reynolds USEPA [email protected]
50 Dr. Michael Griffith USEPA [email protected]
51 Michelle Knabb USEPA [email protected]
52 Dr. Susan Norton USEPA [email protected]
53 Dr. John Coll USFWS [email protected]
54 Dr. Charles Cravotta USGS [email protected]
55 Dr. Dale Honeyfield USGS [email protected]
56 Jeff Chaplin USGS [email protected]
57 Robin Brightbill USGS [email protected]
The participants listed above attended at least one of the three workshops and many
participants were present at all three workshops.
The following individuals were unable to attend the workshops; however, each gave
valuable presentations remotely during a workshop.
Jim Hedrick WVDNR District 2 1 Depot Street Romney, WV 26757

6
Brandon Keplinger WVDNR District 2 1 Depot Street Romney, WV 26757
Dr. Vicki Blazer USGS Leetown Science Center 11649 Leetown Road Kearneysville, WV 25430
Finally, we would like to thank the 12 independent peer reviewers for their valuable
comments and edits to this report.
Executive Summary
Beginning in 2005, large die offs of young-of-year (YOY) Smallmouth Bass (SMB) and
associated bacterial infections were observed throughout the Susquehanna Basin which
resulted in reduced abundance of adult SMB at the middle Susquehanna River
(Sunbury to York Haven) and lower Juniata River (Port Royal to the confluence with
Susquehanna River). Fish mortality due to disease, predation, angling injuries, and
senescence is common. However, prior to 2005, no substantial mortality events were
noted among YOY SMB at the Susquehanna River. Additionally, the population size
and age structure of adult SMB during pre-2005 surveys conducted by the Pennsylvania
Fish and Boat Commission (PFBC) were substantially different than post-2005 surveys,
suggesting a change in population characteristics resulting from reduced YOY
recruitment.
In 2014, the Pennsylvania Department of Environmental Protection (PADEP) requested
assistance from the United States Environmental Protection Agency (EPA) in identifying
the causes of the SMB declines on the Susquehanna River. EPA’s stressor
identification process, as described on the Causal Analysis/Diagnosis Decision
Information System website (CADDIS (www.epa.gov/caddis)) identifies the cause(s) of
an environmental problem by determining which of a set of alternative candidate causes
is best supported by the body of evidence. The CADDIS process was chosen because it
provides transparency and reduces bias without restricting the types of evidence used.
It provides a framework for engaging experts and different sources of data together in
order to identify one or more likely causes of an environmental problem. This process
will assist PADEP in developing appropriate programmatic strategies that will result in
an improved fishery. However, it is important to note that the CADDIS process and
subsequent report are not the Susquehanna River water quality assessment process for
determining impairments under section 303(d) of the Federal Clean Water Act.
In cooperation with the PFBC, PADEP and EPA scheduled three workshops that
included representatives from various State, Interstate, Federal, and academic

7
organizations including, the Susquehanna River Basin Commission (SRBC), United
States Geological Survey (USGS), United States Fish and Wildlife Service (USFWS),
and Susquehanna River Heartland Coalition for Environmental Studies (SRHCES).
These workshops were the framework used to make a preliminary determination for the
cause(s) of the case, detailed below.
The case was defined as a decrease in abundance of SMB as a result of poor
recruitment into the adult SMB population. The temporal frame of the effect was
established as 2005 to the present, since 2005 was the initial year that the decline was
recorded. However, some longer term trend data were reviewed in order to elucidate
the relationship between several candidate causes and the effect. The geographic
range or study area was identified as the Susquehanna River from Sunbury to York
Haven and the Juniata River from Port Royal to the mouth. These were the reaches
identified to have a decrease in SMB abundance. Comparison sites were selected to
represent streams with stable and sufficiently robust SMB populations without
documented instances of SMB population decline. Some examples include the
Allegheny River at Franklin, Delaware River at Morrisville, upper Juniata River, upper
Susquehanna River, lower West Branch Susquehanna River (Lewisburg), Pine Creek
(Lycoming Co.), and Loyalsock Creek. Although there have been confirmed instances of
disease at comparison sites, SMB populations have not declined in abundance or
experienced changes in length and age structure.
After the case is defined, the CADDIS process identifies “candidate causes” and “causal
pathways.” Candidate causes are in-stream stressors which may be directly responsible
for the observed biological effects. For example, high ammonia concentrations can be
toxic to fish and cause overt mortality. Other candidate causes, such as low dissolved
oxygen or high temperature can cause direct mortality, or stress leading to disease.
Causal pathways describe the interim steps by which human activities, sources and in-
stream ecological processes result in a candidate cause. For example, increased
nutrient loads are part of a multiple-step causal pathway that can produce stressors that
harm fish. Increased nutrient loading (nitrogen and phosphorus) associated with land
use and stormwater runoff can increase algal growth. The algae photosynthesize and
respire, increasing the range of daily swings in pH and dissolved oxygen levels. Very
high pH and low dissolved oxygen levels harm fish. In the CADDIS process, nutrient
loadings are considered as part of the causal pathway leading to the candidate causes
of low dissolved oxygen and high pH levels.
A total of 14 potential candidate causes were initially identified for the decline in SMB
recruitment during the first CADDIS workshop. Two mechanisms by which candidate
causes could decrease SMB recruitment were considered throughout the process:
direct mortality and increased susceptibility to disease (e.g., high water temperature
causing direct mortality vs high water temperature causing increased disease). As the

8
process continued and familiarity with the data improved, several of the candidate
causes were subdivided to address multiple mechanisms that were not originally
considered. Over 50 worksheets (data and associated analyses) consisting of almost
400 pages of information were used in this evaluation (Appendix B). Each worksheet
was evaluated and scored using data available at the time of the third workshop. Each
candidate cause was classified as whether it was Likely, Unlikely, or Uncertain that it
was contributing to the reduction in SMB recruitment. As more data are collected,
conclusions made in this report are understood to be dynamic.
List of candidate causes:
1. High Flows
2. Intraspecific Competition (Competition within the SMB species)
3. Interspecific Competition (Competition with other species, possibly invasive
species)
4. YOY Food quality
5. Egg Quality
6. YOY Habitat Degradation
7. High Temperature
8. High pH
9. Low Dissolved Oxygen
10. High Ammonia
11. Algal and Bacterial Toxins
12. Toxic Chemicals: Pesticides/ Polychlorinated Biphenyls (PCBs)/Metals
13. Toxic Chemicals: Herbicides/Endocrine Disrupting Compounds (EDCs)
14. Pathogens and Parasites
The CADDIS process narrowed the scope of concerns that may be affecting SMB
populations in the Susquehanna and Juniata Rivers. Based on all available evidence,
eight candidate causes were not supported by the data analysis and were considered
Unlikely for directly causing the decline of YOY SMB recruitment. The evidence for eight
additional candidate causes was judged to be Uncertain. The CADDIS process
identified two candidate causes as Likely for the decline in recruitment of YOY SMB into
the adult population. However, it is noted that the causal pathways are very important to
understanding the modifying effects of other factors not listed as candidate causes.
These pathways are analyzed and discussed in the report.
Candidate cause classifications:
Candidate
Cause # Candidate Cause Name

9
Likely Causes
13 EDCs and herbicides1
14 Pathogens & Parasites with other stressors2
Unlikely Causes
1 High Flows
2 Intraspecific Competition
4 YOY Food Quality: fatty acids
7 Temperature – direct mortality
8 pH
9 Dissolved Oxygen – direct mortality
10 Ammonia (NH3)
12 Toxic Chemicals: pesticides/PCBs/metals
Uncertain Causes
3 Interspecific Competition
4 YOY Food Quality: thiaminase
5 Egg Quality
6 YOY Habitat
7 Temperature – increased disease
9 Dissolved Oxygen – increased disease
11 Algal & Bacterial Toxins
14 Pathogens & Parasites alone2 1. The evidence available for herbicides was limited and future monitoring is planned to obtain
more data. 2. The workshop participants concluded that pathogens and parasites were likely interacting with
other candidate causes in order to produce the disease. It is uncertain whether they would be
capable of doing so alone.
It is critical to note that this report only serves to provide information on the current state
of data collection and conclusions related to the SMB decline. There are many data that
have yet to be analyzed and interpreted which may affect any final conclusions.
Consequently, many sub-lethal, complex interaction hypotheses were not fully
developed and analyzed in the CADDIS process. Research on this topic is on-going and
will continue for the foreseeable future.
Despite these challenges, this report represents a large amount of work from many
dedicated professionals across multiple agencies and organizations. It is the
compilation of the current understanding as it relates to the SMB population decline in
the Susquehanna and Juniata Rivers and will serve as the foundation for continued
research. This report also serves to provide greater transparency on what work has
been completed thus far.

10
One of the most important next steps is to identify factors contributing to
immunosuppression, and increased pathogen and parasite abundance. The possible
increase of intermediate hosts and other changes within the biological community are
critical factors that will be investigated. Potential interactions among physicochemical
parameters, nutrients, emerging contaminants and their relationship to SMB YOY need
to be clarified. The results of the CADDIS process will lead to more focused action with
the goal of increasing recruitment to restore abundance of SMB.

11
Introduction
Smallmouth Bass Micropterus dolomieu (SMB) were introduced to the Susquehanna
River watershed from the Potomac River watershed in 1869 (Milner 1874, cited in Bielo
1963) or 1870 (Bean 1892) and were well established within three years (Bean 1892,
Meehan 1893). Throughout the Susquehanna River and its larger tributaries SMB
angling has been a popular recreational activity, with 65% of angler catch comprised of
Smallmouth Bass in a survey of the lower Juniata and middle Susquehanna rivers in
2007 (Smucker et al. 2010). Estimates of economic contribution related to sport fishing
on these reaches exceeded $3.35 million in 2007, making the abundance of this
species important economically (Martin 2010). Growing concern over the health and
abundance of SMB has spurred an unprecedented amount of research and public
interest.
The Susquehanna River originates from Otsego Lake in Cooperstown, New York and
flows south through Pennsylvania and Maryland to the Chesapeake Bay. The
Susquehanna River drains approximately 71,000 km2 and is the largest source of fresh
water to the Chesapeake Bay (Brown et al. 2005). Most of the Chesapeake Bay and
tidal tributaries have been declared impaired by EPA and on December 29, 2010, EPA
established the Chesapeake Bay Total Maximum Daily Load (TMDL) for nitrogen,
phosphorus, and sediment that includes the Susquehanna River. Consequently, the
Susquehanna River has received a large amount of attention concerning nutrient and
sediment transport.
This report addresses numerous issues surrounding SMB in the Susquehanna River
watershed, and begins to refine the scope of future work. It is critical to note that this
report only serves to provide information on the current state of data collection and
conclusions related to the SMB decline and disease. There are many data that have yet
to be analyzed and interpreted that may affect any final conclusions. Research on this
topic is on-going and will continue for the foreseeable future.
Population Decline
Reproductive success of adult SMB and recruitment of young-of-year (YOY) to the adult
population vary annually throughout their range due to various environmental factors
(Blazer et al. 2007, 2010, Funk and Fleener 1974, Lukas and Orth 1995, Smith et al.
2005, Wrenn 1980). Natural causes such as disease, predation, and senescence are
components of total mortality, as well as mortality attributable to angling. Prior to 2005,
no substantial disease-related YOY SMB mortality events were documented in the
Susquehanna River, but beginning in 2005, dead and dying YOY SMB were observed
particularly in the middle Susquehanna (between Sunbury and York Haven,

12
Pennsylvania). Due to poor year classes ostensibly attributable to disease/mortality first
documented in 2005 and subsequent low recruitment to the adult population, Catch per
unit effort (CPUE) for both adult and YOY SMB have decreased during the post-2005
era (Figures 4 & 5). In addition, the size structure of the adult SMB population
documented during pre-2005 surveys was noticeably different than during post-2005
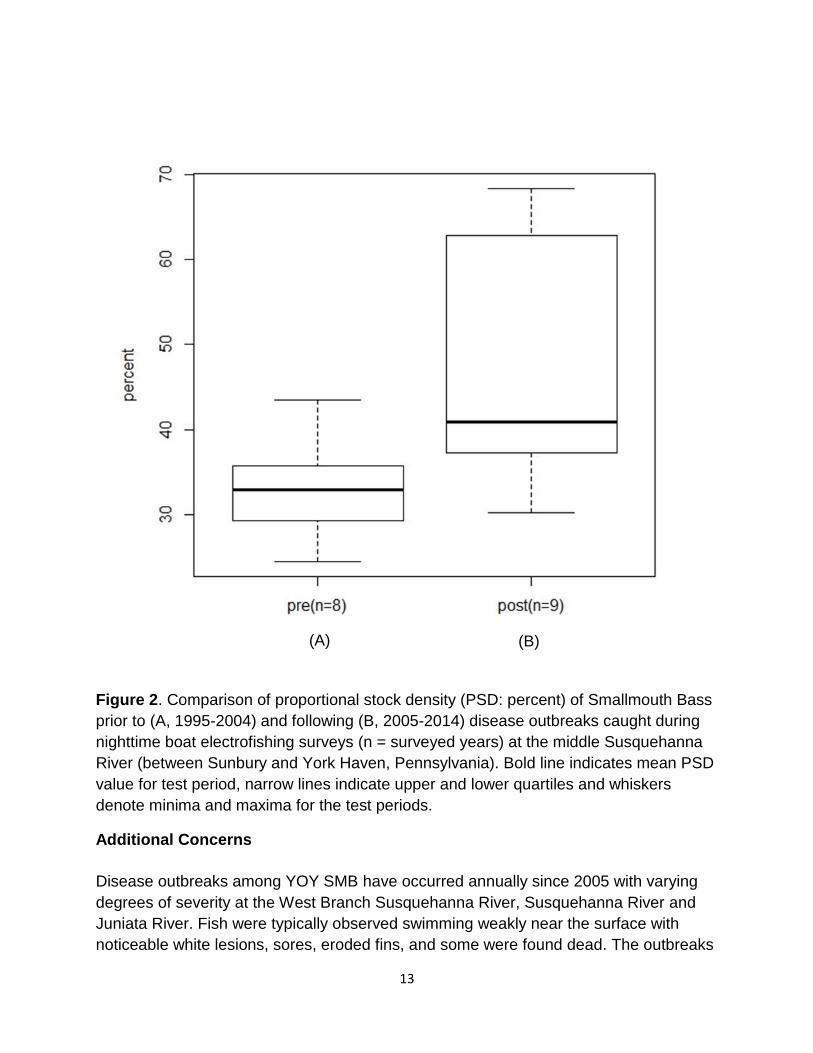
surveys (Figure 1). Specifically, the proportional stock density (PSD) of SMB, a
measure of balance in freshwater fish populations which compares the proportions of
larger, quality length fish (280 mm TL) to stock length fish (180 mm TL; Anderson and
Weithman 1978), increased in the post-2005 time period (Figure 2). Pre-2005 PSD
values for the middle Susquehanna River were considered optimal at approximately 30
– 40% (Weiss-Glanz and Stanley 1984); post-2005 PSD values for the middle
Susquehanna River increased to 35% - 65% (Smith et al. 2015). The post-2005 PSD
suggested that there were a limited number of smaller or younger fish in the population
and that rates of reproduction, growth, and mortality were no longer reflective of a
healthy and stable population.
Figure 1. Comparison of length-frequency distributions of adult (age-1 and older)
Smallmouth Bass caught during nighttime boat electrofishing surveys at the middle
Susquehanna River pre-2005 (i.e., from 1990-2004 filled circles) and post-2005 (i.e.,
2005-2014, open squares). Each marker indicated mean catch per unit effort (CPUE:
fish/h) for the time period with error bars indicating one standard deviation.
0
5
10
15
20
25
30
50 75 100 125 150 175 200 225 250 275 300 325 350 375 400 425 450 475 500
fis
h/ h
Total length (mm)
13
Figure 2. Comparison of proportional stock density (PSD: percent) of Smallmouth Bass
prior to (A, 1995-2004) and following (B, 2005-2014) disease outbreaks caught during
nighttime boat electrofishing surveys (n = surveyed years) at the middle Susquehanna
River (between Sunbury and York Haven, Pennsylvania). Bold line indicates mean PSD
value for test period, narrow lines indicate upper and lower quartiles and whiskers
denote minima and maxima for the test periods.
Additional Concerns
Disease outbreaks among YOY SMB have occurred annually since 2005 with varying
degrees of severity at the West Branch Susquehanna River, Susquehanna River and
Juniata River. Fish were typically observed swimming weakly near the surface with
noticeable white lesions, sores, eroded fins, and some were found dead. The outbreaks
(A) (B)
14
appeared to be limited to SMB; observations of disease of this severity were not (and
have not subsequently) reported for other species. Six public meetings have been held
to discuss this issue since 2006 and more restrictive fishing regulations have been
enacted to reduce fishing mortality.
In September 2007, the Susquehanna River Technical Committee (Committee);
composed of representatives from the PFBC, PADEP, USGS, USEPA, and SRBC was
formed and met for the first time. The Committee’s first order of business was to identify
existing data, determine what data were needed, and develop recommendations for
future action. Pathological analysis indicated that secondary bacterial infections by
opportunistic bacteria (Chaplin et al. 2009, Chaplin and Crawford 2012, Starliper et al.
2013, 2014, C. Yamashita, Pennsylvania Fish and Boat Commission, unpublished data)
were potentially responsible for observed lesions and mortality.
In 2007, a large scale filamentous algal bloom was observed during late summer. In
response, PFBC began taking around-the-clock discrete dissolved oxygen (DO)
measurements in select habitats on the Susquehanna River and noted low DO
concentrations during the early morning period (PFBC, unpublished data). As a result,
initial data needs that were identified included a better characterization of temperature
and DO concentrations in critical reaches of the Susquehanna River and a
determination of whether stressful conditions existed in near-shore YOY nursery areas.
Water quality investigations conducted by the USGS Pennsylvania Water Science
Center in 2008 documented stressful water quality conditions in critical near-shore
habitat (Chaplin et al. 2009). They determined that DO concentrations (DO), were
statistically different between near-shore locations and main-channel locations. Water
temperature of the Susquehanna and Juniata Rivers were also typically higher and
more varied when compared to Allegheny River or Delaware River locations (Chaplin
and Crawford 2012).
Further analysis of diseased YOY SMB has identified other pathogens including
myxozoan and trematode parasite infections. These parasite infections may have
resulted from external stressors but could also have directly contributed as a stressor
leading to bacterial infection and mortality. Largemouth Bass Virus (LMBV) has also
been detected in SMB from all major basins of Pennsylvania, but to a greater
prevalence in the Susquehanna Basin. Smallmouth Bass, like many other species, are
known carriers of LMBV but are not believed to be directly affected by the virus. It is
unknown if carriers of the virus experience additional stress that may weaken the
immune system (G. Smith, Pennsylvania Fish and Boat Commission, personal
communication).
15
In addition to conventional water quality parameters, recent studies have documented
effects believed to be caused by endocrine disrupting compounds (EDC) and emerging
contaminants (EC) in the Susquehanna River Basin (Reif et al. 2012, Blazer et al.
2014). These compounds are attributable to a number of sources including
pharmaceuticals, fertilizers, and household cleaning products and can have major
effects on aquatic environments (Hotchkiss et al. 2008, Diament-Kandarakis et al.
2009). The severity of these impacts is only now starting to be understood. EDCs and
ECs may cause various physiological imbalances in fish and other aquatic organisms
and have the potential to alter aquatic ecosystems. These chemicals can cause stress
or immunosuppression in organisms that predispose them to diseases; similar to what
has been observed in SMB (Milston et al. 2003, Liney et al. 2005, Vandenberg et al.
2012).
Analysis of adult SMB from the West Branch Susquehanna River (2009), Susquehanna
River (2008-2010), and Juniata River (2010) documented high rates of intersex; a
condition in which female egg precursor cells are found in the testes of males (Blazer et
al. 2014). Although the natural occurrence of intersex in fishes is unknown, observations
of this condition in SMB are widespread throughout the United States (Hinck et al.
2009). However, the proportion of SMB affected and the severity of the cases
documented in the Susquehanna River Basin are greater than other basins.
In addition to intersex among adult SMB, other issues have been noted over the course
of the investigation. During autumn 2011 and winter 2012, numerous adult SMB with
lesions were observed in the lower Susquehanna River between York Haven and Safe
Harbor dams; however, this appears to be an isolated incident. Also, since 2012, there
has been increased interest in melanistic areas observed on the body surface of adult
SMB from the Susquehanna River and a number of other locations in Pennsylvania.
Angler reports of a high incidence of adult SMB with large, dark markings throughout
the mainstem Susquehanna River began in March 2012. Initial pathological analysis by
USGS and USFWS diagnosed the condition as melanosis; an accumulation of the
pigment melanin in the dermis and epidermis of the fish. Although this condition has
been documented in Micropterus spp. throughout their range in North America, potential
causes and effects on individuals and populations remain unclear. Within Pennsylvania,
the condition has been reported from numerous locations, but most frequently from the
Susquehanna and Allegheny Rivers. The annual recurrence of the condition has led to
questions about pathology, causes or contributing factors and whether the condition
recedes on individual fish. Only a small number of fish have been analyzed
histologically; however, the pathology observed has been consistent with melanosis or
hyperpigmentation (V. Blazer, U.S. Geological Survey, unpublished data).

16
Sporadic observations of melanosis are not recent; informal investigations in
Pennsylvania and New York since the mid-1980s yielded similar results to those of
USGS and USFWS for Susquehanna River SMB. The spatial distribution of adult SMB
with melanistic characteristics in Pennsylvania rivers is currently unknown. The majority
of recent reports originated from anglers and have been largely restricted to the
Susquehanna River, presumably as a result of public awareness of on-going SMB
issues. However, reports from other portions of Pennsylvania have been received (G.
Smith, Pennsylvania Fish and Boat Commission, written correspondence). Due to the
need for more data, melanosis is not a topic covered under this report. However,
ongoing research is being conducted by several agencies to determine cause and
potential linkage to other SMB issues throughout Pennsylvania.
With the vast amount of research conducted since 2005 and multiple biological effects
being analyzed, there was a significant need to consolidate resources and data.
Agencies and academic institutions also needed to narrow down possible reasons for
SMB declines observed on the Susquehanna River and its tributaries. Hence, PADEP
requested assistance from the EPA to begin the stressor identification process. This
method is described on EPA Causal Analysis/Diagnosis Decision Information System
(CADDIS, www.epa.gov/caddis). In cooperation with the PFBC, three workshops were
scheduled that included representatives from various state, interstate/federal agencies
and academic institutions. These workshops sought to apply the CADDIS process,
using available data, to make a preliminary determination of the causes of poor SMB
recruitment at the Susquehanna River. This process will assist PADEP in developing
appropriate programmatic strategies that will result in an improved fishery. However, it
is important to note that the CADDIS process and subsequent report are not the
Susquehanna River water quality assessment process for determining impairments
under section 303(d) of the Federal Clean Water Act.
Methods: The CADDIS Process
The stressor identification process as described on the CADDIS website (hereafter
called the CADDIS process) identifies the cause(s) of a biological problem in the
environment by determining which among a set of alternate candidate causes is best
supported by the body of evidence. The CADDIS process was chosen because it
provides transparency and reduces inferential errors without restricting the types of
evidence used. This process also has a clearly defined framework (Figure 3) making it
ideal for multi-organizational cooperation and public understanding. Additional
information on CADDIS can be accessed at: http://www.epa.gov/caddis/index.html. The
CADDIS process began in October 2014 and was punctuated by three workshops
(described below).

17
Figure 3. The framework for USEPA’s stressor identification progress
CADDIS Workshop 1
The first CADDIS workshop was held in early October 2014 at Bald Eagle State Park, in
central Pennsylvania. The main focus of the workshop was to provide background on
the concerns for the SMB in the Susquehanna River watershed, define the case for
analysis, and identify potential candidate causes.
Presentations pertaining to the history of SMB in the Susquehanna River watershed and
the research and monitoring efforts pertaining to the SMB decline were given by four
agencies and one academic organization: PFBC, PADEP, USEPA, USGS, and
SRHCES.
Defining the case of interest (case) establishes the foundation for the rest of the
CADDIS process. Also referred to as the subject of the analysis, the case is established
by defining and specifying the effects that will be analyzed (e.g., species, age classes,
anomalies) and determining the geographical and temporal frame of the effect.
18
Comparison sites also need to be identified. Comparison sites do not exhibit the noted
effect; however, they do not have to be reference quality (U.S. EPA 2010). The details
of defining the case are discussed below.
The candidate causes are the stressors that may be responsible for the observed
biological effects. Listing these candidate causes further refines the scope of the causal
analysis and provides a framework for assembling available data and determining what
data are lacking for the causal analysis (U.S. EPA 2010). All participants were involved
in developing a robust initial list of candidate causes.
Causal hypotheses were developed into conceptual models by grouping candidate
causes together into logical pathways. These models were reviewed and finalized
during the second and third workshops. Conceptual models served to illustrate the
understanding that some aspects (i.e., candidate causes and modifying factors) of one
conceptual model may influence another. All conceptual models are detailed in
Appendix A.
In the four months spanning workshops 1 and 2, participants were charged with
identifying and organizing data related to the case. If possible, participants were to
begin developing analysis worksheets. These worksheets analyze and summarize the
different datasets pertaining to the case. Later in the CADDIS process, the worksheets
were used as evidence to either support or contradict the different candidate causes.
CADDIS Workshop 2
The second CADDIS workshop was held at the end of January 2015, at the PFBC office
in Harrisburg, PA. This workshop began with reviewing and refining the conceptual
models and the list of candidate causes. The majority of the workshop focused on
reviewing data and analyses compiled since workshop 1, identifying additional data sets
and data needs and developing analysis worksheets. All CADDIS participants were
encouraged to develop analysis worksheets based on data they collected, researched
or were familiar with. Completed worksheets were also vetted by groups comprised of
members with experience in the specific discipline (i.e., participants with fisheries
background reviewed fisheries-related worksheets, and participants with water quality
background reviewed water quality-related worksheets).
When creating an analysis worksheet, ideally the candidate causes and biological
response variables are measured at the same sites, during the same time period. The
timeframe should capture the most relevant exposure in question. The same variables
should be sampled at defined case (subject) and comparison sites. Various plots can be
utilized to graphically display the data. Participants were encouraged to not rely solely
on statistical differences, but rather a combination of statistical and biological
significance. When applicable, the datasets should be analyzed based on their temporal

19
and/or spatial component. Temporal analyses compare data collected before the
observed effect (pre-2005) to data collected after the observed effect (post-2005), at the
same site. Spatial analyses compare data collected at sites within the defined subject
reach to those collected at comparison sites during the same time period.
The next steps identified at the conclusion of Workshop 2 were to make revisions to
existing analysis worksheets, to create additional worksheets and to conduct a thorough
literature search.
CADDIS Workshop 3
The final CADDIS workshop was held at PADEP’s South Central Regional Office
located in Harrisburg, PA. The workshop occurred at the end of March/beginning of
April 2015, two months after Workshop 2. This workshop addressed the fifth and final
step in the stressor identification process: Identify Probable Cause. This was
accomplished by weighing the evidence for each candidate cause and comparing the
evidence across candidate causes.
Each analysis worksheet was assigned a type of evidence. Seven types of evidence
were used: spatial co-occurrence (spatial), temporal co-occurrence (temporal), stressor-
response (SR) from the case, stressor-response (SR) from elsewhere, evidence of
exposure, evidence of mechanism, and causal pathway (Table 1). A single worksheet
can represent multiple types of evidence. Other types of evidence categories are
discussed in EPA’s CADDIS process; however, only those with available data were
used in the Susquehanna and Juniata River CADDIS process.
Table 1. CADDIS types of evidence definitions. Table adapted from
http://www.epa.gov/caddis/si_step_evidence.html and Norton et al. 2014
Evidence Type Definition
Spatial Co-occurrence The biological effect is observed where the cause is observed, and
not where the cause is absent
Temporal Co-occurrence The biological effect is observed when the cause is observed, and
not when the cause is absent
Stressor-Response from
the Case
As exposure to the cause increases, intensity or frequency of the
biological effect increases and vice versa
Stressor-Response from
Elsewhere
At the affected sites, the cause must be at levels sufficient to cause
similar biological effects in laboratory or other field studies
Evidence of Exposure or
Evidence of Mechanism
Measurements of the biota show that relevant exposure to the
cause has occurred, or that other biological mechanisms linking
the cause to the effect have occurred

20
Causal Pathway Measurements or models demonstrate the occurrence of steps in
the causal pathway linking sources to the cause, increased
susceptibility of the organism(s), or conditions permitting
interaction of the cause and the organism(s).
To weigh the types of evidence, Workshop 3 participants broke out into random groups
(i.e. a single group contained members spanning multiple disciplines) based on the
types of evidence and assigned a score to each worksheet based on what type of
evidence the analyses covered (i.e. spatial, SR, temporal). If a worksheet addressed
multiple types of evidence, a score was given for each evidence type. Table 2 defines
the type of evidence scoring system with the classification agreed upon by participants
in workshop 3.
Table 2. CADDIS type of evidence scoring system.
Score Description
+++ convincingly supports
++ strongly supports
+ somewhat supports
0 neither supports nor weakens
- somewhat weakens
-- strongly weakens
--- convincingly weakens
R refutes
NE no evidence
By the end of this workshop, all analysis worksheets were reviewed and scored
(Appendix C). A consistency score for each candidate cause was agreed upon by all
participants, based on the analysis worksheet scores. Lastly, a classification of Likely,
Unlikely, or Uncertain was assigned to each candidate cause based on all of the
evidence.
Results
The Case
As defined by EPA, “Each causal assessment focuses on a specific impairment or
group of similar impairments collectively referred to as the case” (U.S. EPA 2010). The
case definition is framed to identify the cause(s) of an observed biological problem in

21
the environment. The temporal frame and geographic range of the observed effect also
need to be identified for the case.
Catch per unit effort (CPUE) for both adult and YOY SMB have decreased during the
post-2005 era when compared to the pre-2005 era (Figures 4 & 5). Additionally, the
SMB population comprised a greater abundance of smaller and younger fish during pre-
2005 surveys compared to post-2005 surveys, suggesting a change in population
resulting from reduced YOY recruitment (Smith et al. 2015). With this background
information in mind, the CADDIS participants defined the case of interest as a decrease
in abundance of SMB as a result of poor recruitment into the adult SMB
population.
Figure 4. Backpack electrofishing reach-wide composite catch per unit effort (CPUE:
fish/50 m) of YOY SMB at the middle Susquehanna River (between Sunbury and York
Haven, Pennsylvania)
0
5
10
15
20
25
30
35
19
90
19
91
19
92
19
93
19
94
19
95
19
96
19
97
19
98
19
99
20
00
20
01
20
02
20
03
20
04
20
05
20
06
20
07
20
08
20
09
20
10
20
11
20
12
20
13
20
14
Fish
/ 5
0 m
Year

22
Figure 5. Reach-wide composite CPUE (fish/h) of adult SMB (≥ age 1; white bars)
during nighttime boat electrofishing surveys at the middle Susquehanna River (between
Sunbury and York Haven, Pennsylvania). Dashed line indicates median CPUE of adult
SMB for the period of record at the middle Susquehanna River.
The case definition was agreed upon by all participants in Workshop 1 and confirmed by
participants in Workshop 2. The temporal frame of the effect was established as 2005 to
the present, since 2005 was the initial year that the decline was recorded. However,
some longer term trend data were reviewed in order to elucidate the relationship
between several candidate causes and the effect. The geographic range of the subject
reaches was identified as the Susquehanna River from Sunbury to York Haven and the
Juniata River from Port Royal to the mouth (Figure 6). These were the reaches
identified to have a decrease in SMB abundance1. Comparison sites were selected to
represent streams with stable and sufficiently robust SMB populations without
documented instances of SMB population decline. Some examples include the
Allegheny River at Franklin, Delaware River at Morrisville, upper Juniata River, upper
Susquehanna River, lower West Branch Susquehanna River (Lewisburg), Pine Creek
(Lycoming Co.), and Loyalsock Creek. Although there have been confirmed instances of
disease at comparison sites, SMB populations have not declined in abundance or
experienced changes in length and age structure.
1 The Susquehanna River at Marietta sampling location is located approximately 20 miles downstream of
York Haven. Although YOY SMB were not sampled here, environmental data were considered to be relevant to the subject reach.
0
50
100
150
200
250F
ish
/ h
Year

23
Figure 6. The defined area of concern (subject area) for which reduced SMB
recruitment is most prevalent.
Candidate Causes
A total of 14 candidate causes were identified for the decline in SMB recruitment during
the first CADDIS workshop. Each candidate cause was thought to be theoretically
capable of causing the decline in recruitment through two mechanisms: by directly
increasing mortality or indirectly by increasing susceptibility of the fish to disease2.
Below are the descriptions of each candidate cause, explanation of the data that were
analyzed and conclusions reached by the participants. Over 50 worksheets consisting
of almost 400 pages of information were used in this evaluation. It is important to note
that the following candidate causes were evaluated using data available at the time of
2 An exception is that Candidate Cause #13, endocrine disrupting chemicals and herbicides, were only considered
to be capable of reducing recruitment by increasing susceptibility to disease.
24
the third workshop. Consequently, as more data are collected, conclusions made in this
report are subject to change.
Candidate Cause 1: Increased late spring/early summer flow
1.1 Cause Description
The temporal pattern of streamflow fluctuation during the spawning period appears to
be the most important abiotic factor determining nesting success and failure of SMB in
perennial streams (Lukas and Orth 1995). It is well documented throughout the United
States that increased stream discharge can result in mechanical nest failure or
extrication of young fry from their habitat, increasing mortality and decreasing
recruitment (Reynolds and O’Bara 1991, Lukas and Orth 1995, Buynak and Mitchell
2002, Smith et al. 2005). In Pennsylvania rivers, low river discharge during select spring
periods tended to correspond with above average YOY catch rates (Lorantas and
Kristine 2004). The below average catch rates of YOY SMB in recent years, reductions
in catch rates of all sizes of SMB, and catches of SMB ≥ 300mm in the Susquehanna
River relative to reference periods have been uncharacteristic of flow related changes
evident in other rivers across the state (Lorantas et al. 2012). This candidate cause
examines the relationship between SMB abundance and stream discharge and whether
temporal and/or spatial changes in the relationship have occurred.
1.2 Evidence (Appendix B: Worksheets 1, 2, 4, and 6)
1.2.1 Temporal co-occurrence
If flows directly affect SMB recruitment, then flows should be different between pre and
post 2005. Continuous discharge data from the Harrisburg USGS gage station, from
1990-2014 (Worksheet 1), were analyzed to see if high spring or low summer
discharges occurred. There was no difference in discharge values when comparing the
earlier time period (Pre-2002) to the later period (Post-2002) (Score = -).
In Worksheet 2, YOY SMB catch rates were compared to pre and post 2005 mean June
flow. Regression analysis suggests that while high stream discharges in June still
negatively affects YOY SMB abundance, other factors are affecting abundance within
subject reaches during post-2005 years with low stream discharge in June (Score = -).
For Worksheet 4, CPUE data of age-1 SMB were compared to pre- and post-2005
mean June flow. Flow does not appear to be the only factor affecting age-1 CPUE
(Score = -).
25
1.2.2 Spatial co-occurrence
If flows directly affect SMB recruitment, then flows would be expected to be significantly
different between subject and comparison sites. Worksheets 2 and 4 were similar in that
CPUE data were compared to mean June discharges at the following USGS gaging
sites: Susquehanna River at Harrisburg (01570500) and Danville (01540500), Delaware
River at Trenton (01463500), Juniata River at Newport (0156700) and Mapleton Depot
(01563500), West Branch Susquehanna River at Lewisburg (01553500), and Allegheny
River at Franklin (03025500). The difference between the worksheets was that
Worksheet 2 analyzed back-pack electrofishing CPUE (fish/ 50 m) data for YOY SMB
and mean June discharge of the same year and Worksheet 4 evaluated boat
electrofishing CPUE (fish/h) data of age-1 SMB and mean June flow for the year that
the fish would have spawned (i.e., 2008 CPUE would relate to mean June discharge
during 2007).
When comparing subject sites to comparison sites in Worksheet 2, analyses suggest
the lower YOY SMB catch rates in subject areas are not being completely driven by
discharge, which typically controls YOY SMB mortality. Regression analysis suggests
that while high stream discharges in June still negatively affect YOY SMB abundance,
other factors are affecting abundance within subject reaches during years with low
stream discharge in June (Score = -).
The relationship between age-1 SMB CPUE and previous year mean June discharge
(Worksheet 4) has weakened in the post-2005 period for subject sites. In contrast, for
comparison sites, the relationship between age-1 SMB CPUE and flow has
strengthened for the post-2005 period. This evidence weakens the argument that flow is
the major factor influencing reduced recruitment in the subject areas (Score = -).
1.2.3 Causal Pathway
Continuous discharge, temperature, pH, and DO data from near-shore/micro-habitats
were plotted to determine the potential sequence of events for SMB pre- through post-
spawn and YOY dispersal. This analysis sought to elucidate combined effects between
discharge and other water quality parameters within YOY SMB habitats. Data analyzed
in Worksheet 6 suggest that discharge and water temperature variability in any given
year/season could dictate the magnitude of effect from any candidate cause in the form
of a modifying factor. Due to a lack of relevance to direct mortality caused by flow, this
worksheet was not scored. Modifying factors and combined effects are presented later
in the report.

26
1.3 Discussion
Both temporal and spatial evidence weaken the argument that increased late
spring/early summer flow is directly causing decreased recruitment of YOY SMB since
2005 (Consistency Score = --). This evidence is strong because it is based on
continuous discharge datasets. However, low discharges and lack of flushing flows may
contribute to stressful water quality conditions such as increased algal growth,
increased temperature, and low DO.
Candidate Cause 2: Increased intraspecific competition
2.1 Cause Description
Intraspecific competition is the competition among individuals of the same species for
resources (Polis 1981). It is hypothesized that the high density of SMB in the past may
have led to a “boom-and-bust” situation where the population was operating above
carrying capacity resulting in population crash.
Condition indices can be used to evaluate the effects of ecological interactions in fish
populations and communities (Murphy and Willis 1991). When combined with other
information, such as population density, condition data provide a more robust
understanding of population dynamics (recruitment, growth, and mortality) and
environmental influences (Pope and Kruse 2007). Wege and Anderson (1978) proposed
the use of relative weight (Wr) to evaluate fish condition. Relative weight is a
comparison of the weight of fish in a population to the standard weight (Ws) for that
species. Standard weight is a length-derived estimate of the weight of a fish based on
length-weight regressions from a number of different populations. Kolander et al. (1993)
developed the standard weight equation for SMB from 50 populations from 19 states,
including populations from the Susquehanna and Juniata Rivers. Relative weight of fish
in a population as a whole or in different components of the population (total length
groups in this instance) varies with resource availability. When Wr values are well below
100 for an individual or a component of the population, problems may exist in food or
feeding conditions; when Wr values are well above 100, fish may not be making the best
use of surplus prey (Anderson and Neumann 1996). A population or subpopulation with
an average Wr less than 80 is likely resource limited (Pope et al. 2010).
2.2 Evidence (Appendix B: Worksheet 3)
2.2.1 Evidence of Mechanism

27
If intraspecific competition was causing stress and subsequent decline of SMB, then
condition measurements should show Wr values less than 80 and/or a significant
change at sites or over time. In Worksheet 3, Wr values were generated using a revision
of the Ws equation for SMB (Kolander et al. 1993). These values were generated for all
adult SMB with individual length and weight data from each river reach. Relative
weights of the SMB were consistent over time and space. Subject sites demonstrate
that Wr during the study period was at or near the 100 “benchmark”, indicating good fish
condition. The Wr data from the middle Susquehanna River and lower Juniata River
suggest that SMB condition within subject reaches were not appreciably different than
those encountered in comparison reaches during the same time frame (Score = --).
2.3 Discussion
The combination of spatial, temporal and benchmark components weaken the argument
that SMB were over-populated and resource limited prior to the 2005 population decline
(Consistency Score = -). However, this was the only piece of evidence presented for this
candidate cause. Additionally, one limitation of the Wr data is that there are no data
between 1998 and 2005 for the subject sites. Therefore, there is no way to determine if
Wr decreased just prior to the increased mortality/population declines that were
observed starting in 2005.
Candidate Cause 3: Increased interspecific competition
3.1 Cause Description
The structure and function of a fish community is regulated by multiple biotic and abiotic
factors. The most influential of the biotic factors are typically thought to be predation and
competition (Sih et al. 1985, Persson, 1988). Interspecific competition, hereafter
referred to simply as competition, occurs when individuals from different species
compete for the same resources (Larkin 1956, MacArthur and Levins 1967, Abrams
1983).
The introduction and spread of aquatic invasive species can have multiple effects on
ecosystems and can lead to habitat degradation, loss of native flora and fauna
(D’Antonio 2001, King 1984, Arim et al. 2006) and disease vectoring and proliferation
(Andow et al.1990). Invasive species have been identified as the second leading cause,
next to habitat degradation, of imperiled fishes in the United States (Wilcove et al.1998)
and this conclusion is similar worldwide (Clavero and Garcia-Berthou 2005).
The rapid population density increases brought about by the exponential growth rates of
an invasive species (Arim et al. 2006) provide the pathway for increased competition

28
with native fauna. This competition with invasive species has been identified as a major
source, albeit not the only pathway, for native species declines and ecological
disturbance (Gurevitch and Padilla 2004, Winfield 2012). One example studied is the
competition between the introduced SMB and the invasive Mimic Shiner, Notropis
volucellus (MS) within the Susquehanna River watershed, which could result in reduced
recruitment of YOY SMB. Smallmouth Bass are most likely to have increased
competition with MS in their early ontogeny due to both habitat overlap and SMB dietary
shift. During this time, the diets of the two species are similar, progressing from
phytoplankton and zooplankton to invertebrates before SMB begin the ontogenetic shift
to piscivory and a predator-prey relationship develops. This critical ontogenetic shift to
piscivory has been identified as a potential source of complex population dynamics for
bass (Turchin 2003, Aday et al. 2009).
3.2 Evidence (Appendix B: Worksheet 5)
3.2.1 Temporal Co-occurence
If interspecific competition is causing the decline of SMB, then there would be an
expected inverse relationship between SMB and the invasive species after 2005.
Worksheet 5 investigated abundance of MS in relation to SMB. The MS population
appears to be experiencing exponential growth; however, there is limited data between
1977 and the present within the subject reach (Score = 0).
3.2.2 Spatial Co-occurrence
If interspecific competition is causing the decline of SMB then there would be an
expected inverse relationship between SMB and the invasive species within subject
sites, but not comparison sites. Worksheet 5 evaluated the measured decline in SMB
populations to the exponential growth of MS. It also compared the MS population to
other Centrarcidae. The relationship of SMB and MS was inverse to the expected
relationship as demonstrated by regressions between MS and Rock Bass, Ambloplites
rupestris and MS and Redbreast Sunfish, Lepomis auritus. These data indicate some
correlation; however, they do not explain causality. Additionally, Worksheet 5 only
analyzed the potential competition of one invasive species. Worksheet 5 included many
community surveys in both wadeable and non-wadeable streams, but the group
recommended limiting analysis to only case study sites (i.e., subject and comparison
sites) (Score = 0).
3.3 Discussion
More community level data should be collected and a greater number of invasive
species relationships need to be analyzed before any conclusions can be reached on
this candidate cause (Consistency Score = 0).
29
Candidate Cause 4: Decreased food quality
4.1 Cause Description
Decreased food quality was addressed by focusing on two specific aspects: fatty acids
and thiamine content. An adequate supply of essential dietary nutrients is necessary for
survival and well-being (NRC 2011). Essential fatty acids are reported to be important to
immune function (Fenton et al. 2013). Arachidonic acid, in the omega-6 (ω6) family of
fatty acids, is a precursor for pro-inflammatory eicosanoid (Klurfeld 2008). Teleosts
possess many of the same antimicrobial mechanisms observed in mammals (Rieger et
al. 2011) indicating the presence of a robust innate immune system (Rieger et al. 2011,
Palti 2011, Purcell et al. 2006). When a pathogen invades an organism, the pro-
inflammatory response signals the immune system and a cascade of events kill and
eliminate the invading pathogen. In a healthy situation, a balance of omega-3 (ω3)
modulates or down regulates the inflammatory response. A healthy ratio of ω3 to ω6 is
approximately 1:1 to 1:2.5 (NRC 2011).
Another dietary component of interest is the essential nutrient vitamin B1 (thiamine).
Thiamine deficiency has been documented in several aquatic top predator species in
association with population declines (Hill and Nellbring 1999, Blazer and Brown 2005,
Honeyfield et al. 2008c). In these affected populations dietary thiaminase, an enzyme
that destroys thiamine has been involved. The diet of adult SMB is purported to be high
in crayfish within the Susquehanna Basin (PADEP unpublished data). A decline in the
Susquehanna SMB population may be related to an increase in non-native species
such as the Rusty Crayfish, Orconectes rusticus and MS. Although it is unknown if
these population changes sufficiently overlap temporally, crayfish have been reported to
contain thiaminase (Ying and Rutledge 1975) as have Notropis spp. (Tillitt et al. 2005).
Thus, an increase in SMB dietary prey items containing thiaminase could theoretically
lead to thiamine deficiency and population declines as cited in the above examples.
4.2 Evidence (Appendix B: Worksheets 5, 24, and 25)
4.2.1 Stressor-response from elsewhere
If decreased food quality is causing the decline of SMB then there would be nutritional
endpoints that meet or exceed levels of concern reported in other cases. Worksheet 24
analyzed the stomach contents of adult SMB to determine their diet and whether
potential prey species contained high levels of thiaminase. Adult SMB stomachs
contained crayfish (57.5%), fish (28.1%), and other macro-invertebrates (37.1%). Note
that total percentages are greater than 100% due to some adult SMB stomachs
containing more than one of the three major prey groups. The diet of Susquehanna

30
SMB is high in crayfish as predicted, but thiaminase activity in non-native and in native
crayfish was low and biologically unimportant with respect to causing thiamine
deficiency. Thiaminase activity greater than 2.5 μmol/g/min can result in thiamine
deficiency. Mean thiaminase in MS was 53.2 μmol/g/min. This high activity would lead
to thiamine deficiency assuming that the percentage of the diet reflected the percentage
of SMB with fish in their stomachs. However, YOY SMB consuming MS has not been
confirmed. Therefore, it was decided the evidence neither supported nor weakened the
candidate cause because more research is needed (Score = 0 for direct mortality and 0
for disease susceptibility).
For Worksheet 25, fatty acid ratios were taken from periphyton samples as an indicator
of the nutritional quality of the food chain. All fatty acid ratios in the case study were
within normal range (ratio of ω3 to ω6 at approximately 1:1 to 1:2.5) thus weakening the
argument that unbalanced ratios of fatty acids contributed to SMB declines (Score = --
for direct mortality and -- for disease susceptibility).
4.2.2 Causal Pathway
If thiaminase content of the YOY SMB diet was causing the declines in recruitment, then
MS (a species high in thiaminase) would be expected to be a large component of the
prey community. Fish community data were collected by PADEP, PFBC, and SRBC in
2008, 2009, 2013, and 2014 using a semi-quantitative sampling protocol for both
wadeable streams and non-wadeable rivers. Sites throughout the Susquehanna and
neighboring basins were selected based on proximity to the PFBC historic SMB
sampling areas (Worksheet 5). Mimic Shiner generally comprised the major percentage
of the insectivore guild, especially in the larger river systems. In addition, as the
percentage of MS contribution to the insectivore guild increased, the numbers of SMB
within their guild (invertivore/piscivore) decreased (r2 = 0.40) (Score = +).
4.3 Discussion
The fatty acid ratios of periphyton are within normal ranges, arguing against this
candidate cause (Consistency Score = -). Food sources containing significant
thiaminase activity merits continued investigation (Consistency Score = +). Mimic shiner
and SMB are thought to hatch at approximately the same time and same general
location. Additionally, the overlap of these two species and their inherent size differential
may provide opportunity for YOY SMB to consume YOY MS. However, further
investigation is needed.
Candidate Cause 5: Decreased egg quality
5.1 Cause Description

31
The nutritional status and supply of essential dietary nutrients plays an important role in
the survival and well-being of fishes (National Research Council 2011). Deficiency of
the essential nutrient vitamin B1 (thiamine) has been documented in several aquatic top
predator species in association with population declines (Hill and Nellbring 1999, Blazer
and Brown 2005, Honeyfield et al. 2008). Deficient (low) egg thiamine concentrations
have been shown to cause fry mortality after hatch in numerous salmonid species and
American Alligators, Alligator mississippiensis (McDonald et al. 1998, Brown et al. 2005,
Honeyfield et al. 2005, 2008). Furthermore, immune dysfunction (T-Cell activity) occurs
in fish hatched from eggs containing low thiamine or fish with low thiamine due to poor
diet. Dysfunctional T-Cell activity can result in an increase in disease-carrying
individuals thus subjecting the population to a greater risk of disease outbreaks and
mortality (Ottinger et al. 2012, 2014).
5.2 Evidence (Appendix B: Worksheet 26)
5.2.1 Spatial Co-occurrence
If decreased egg quality is causing the decline in SMB, then there would be a greater
prevalence of female SMB ovaries containing low thiamine concentrations at subject
sites than comparison sites. Thiamine levels were analyzed in egg tissue of 131 female
SMB, which were harvested from 14 sites during the spring of 2014 (Worksheet 26).
Within subject sites, 37% of females produced eggs containing less than desirable
thiamine levels (8 nmol/g). For comparison sites, only 14% of the females produced
eggs with less than 8 nmol/g. Mean egg total thiamine within subject sites was less (9.3
nmol/g) than comparison sites (11.2 nmol/g). However, due to the small sample size
and relatively similar mean values for each site, it was determined that more data need
to be collected (Score = 0).
5.2.2 Stressor-response from elsewhere
If decreased egg quality is causing the decline in SMB then egg thiamine levels should
be as low as or lower than reported levels of concern from other sources. Egg thiamine
values greater than 8 nmol/g are fully thiamine replete, thiamine values between 1.5
and 8.0 nmol/g result in fry that are susceptible to secondary effects such as immune
dysfunction and overt fry mortality occurs with thiamine levels less than 1.5 nmol/g
(McDonald et al. 1998, Brown et al. 2005, Honeyfield et al. 2005, 2008). Analysis of
individual SMB egg thiamine values revealed that 28% of the eggs contained
concentrations less than 8 nmol/g, but no egg thiamine concentrations were below 1.5
nmol/g. This suggests a potential for immune suppression in approximately 25% of YOY
spawned. However, egg thiamine level benchmarks were estimated from different
vertebrate species and true benchmarks for SMB are unknown. As a result, more
research is needed (Score = 0 for direct mortality and 0 for disease susceptibility).

32
5.2.3 Causal Pathway
If thiaminase content of adult SMB diets causes thiamine deficiencies in SMB eggs,
leading to declines in recruitment, then MS (a species high in thiaminase) would be
expected to be a large component of the fish community and the adult SMB diet. Based
on fish community analyses, MS generally comprised the major percentage of the
insectivore guild, especially in the larger river systems (see Section 4.2.3), and about
28% of adult SMB diet is fish (see Section 4.2.1). In addition, as the percentage of MS
contribution to the insectivore guild increased, the numbers of SMB within their guild
(invertivore/piscivore) decreased (see Section 4.2.3) (Score = +).
5.3 Discussion
There is potential for poor egg quality in the form of low egg thiamine to cause YOY
SMB immune suppression, eventually leading to mortality (Consistency Score = +). Yet,
more robust datasets and species-specific thiamine level benchmarks are required to
evaluate this cause. Additionally, more research (e.g., T-Cell dysfunction studies) is
needed to verify that thiamine deficiencies are leading to YOY SMB having suppressed
immune systems.
Candidate Cause 6: Decreased YOY habitat quality
6.1 Cause Description
During the first few months of life, a critical period for survival and development of SMB,
YOY occupy near-shore riverine microhabitats characterized by relatively slow-moving
and shallow water (Chaplin and Crawford 2012). Decreased quality and quantity of YOY
habitat from factors such as high flow, increased algal growth, low DO concentration,
high concentration of suspended solids, and high temperatures could result in direct
mortality or increased susceptibility of YOY to disease (Smith et al. 2015).
Increased algal growth is commonly associated with increased water temperature and
photosynthetic activity. This results in elevated diel variation in DO and pH, and more
extreme values of these parameters (e.g., minimum DO and maximum pH values). Due
to the lack of quantifiable YOY habitat data and only anecdotal algal growth data, these
parameters were used as surrogates for evidence evaluation.
6.2 Evidence (Appendix B: Worksheet 34 and 35)
6.2.1 Temporal Co-occurrence

33
If decreased YOY habitat quality is causing the decline in SMB recruitment, then
surrogate measures for a highly productive environment should be temporally linked to
low YOY CPUE years. In Worksheet 35, certain high YOY CPUE years (1991-1994)
and low YOY CPUE years (2005-2011) were selected to avoid the confounding factor of
high June discharge. These CPUE data were then compared to water temperature, total
phosphorus and pH as surrogates for predicting algal growth. Comparisons using
nitrogen were also considered; however, data were lacking between the two temporal
periods to make conclusions. There was no difference in water temperature, total
phosphorus, or pH conditions between high and low CPUE years at the subject sites
analyzed (Score = -).
6.2.2 Causal Pathway
Algal blooms may lead to degraded YOY habitat quality by decreasing DO and
increasing pH, obscuring substrate and outcompeting macrophytes. Algae blooms were
documented in the subject reach using aerial photographs in October 2007 and July
2012 following low flow periods (Worksheet 34, see also Section 11.2.3). The surface
blooms were concentrated along shoreline habitats and between islands that would be
expected to provide YOY habitat. Additional photographs of a filamentous algae bloom
on the Susquehanna River at Rockville were taken by Geoff Smith from the PFBC on
August 12, 2012 coinciding with a fish pathology survey where YOY SMB with
abnormalities were identified. This evidence suggests a possible link (Score = +);
however, there were only two years of documented algal blooms post-2005, and poor
recruitment years have been recorded without documented algal blooms. Additionally,
there are no baseline data to compare to 2007 and 2012 observations.
6.3 Discussion
Although algal blooms have been observed coinciding with diseased SMB, there were
no differences in water temperature, total phosphorus, or pH between low and high
CPUE years (Consistency Score = -). However, these conclusions have high
uncertainty due to the use of surrogate measurements and anecdotal data. More data
that are spatially and temporally related to YOY habitats need to be collected. More
importantly, YOY habitat quantity and quality need to be documented in order to
properly evaluate this candidate cause.
Candidate Cause 7: Increased water temperatures
7.1 Cause Description
High water temperatures may directly or indirectly affect recruitment of YOY SMB into
age class 1+ by stress resulting from an inability to acclimate to warming water
temperatures, lower solubility of DO, greater abundance of pathogens, and magnified

34
physiological responses to other stressors (Chaplin et al. 2009, Chaplin and Crawford
2012, Cipriano and Austin 2011, Starliper and Schill 2011).
Juvenile SMB are considered to be more tolerant to high water temperature than adults
(Recsetar et al. 2012). Wrenn (1980) suggested that the upper lethal limit of YOY SMB
is approximately 37°C; however, water temperatures around 29°C during this life stage
may be beneficial for rapid growth and development (Zweifel et al. 1999). Water
temperatures during the first summer are positively correlated with year class strength,
because energy reserves used to survive the first winter are increased in the summer
when food is abundant and the water temperature is most suitable for growth (Horning
and Pearson 1973, Clady 1975, Shuter et al. 1980).
Landsman et al. (2011) suggest that egg hatching and YOY larval success is unaffected
when water temperatures rapidly (within one hour) fluctuate between -7 to +8°C beyond
baseline conditions; however, significant mortality did occur when eggs were rapidly
exposed to water temperatures 13°C above baseline conditions. It was also noted that
young SMB were slightly more resilient to decreasing temperature changes than
increasing temperature changes. Although SMB eggs and larvae may tolerate variable
water temperatures, sudden drops in temperature below 14°C during the spring can be
lethal due to male nest abandonment (MacLean et al. 1981, Armour 1993).
7.2 Evidence (Appendix B: Worksheets 7, 8, 9, 10, 11, and 12)
7.2.1 Temporal Co-occurrence
If increased water temperature directly affects SMB recruitment, then water
temperatures would be expected to be higher for the post-2005 time period than the
pre-2005 time period. In Worksheet 7, continuous temperature data were evaluated for
one site within the subject area. Analysis suggested no apparent difference in annual
high temperatures or variation between the pre-2005 and post-2005 periods. However,
the time period for pre-2005 contained only one year (Score = -).
For Worksheet 12, data were analyzed at three subject sites and four comparison sites
for long term and short term trends. There were no clear increasing trends within
subject sites, but this dataset contained only discrete samples, which are not as robust
as continuous data (Score = -).
7.2.2 Spatial Co-occurrence
If increased water temperature directly affects SMB recruitment, then subject sites
should experience higher water temperatures than comparison sites. Continuous water
temperature data collected by SRBC were graphed for three sites (Worksheets 7-9).

35
The average temperature was slightly higher at Rockville (subject site) than at Columbia
and Danville (in-basin comparison sites) (Score = +).
Discrete transect data were plotted for each site to visually compare bank (or YOY)
habitats to main channel habitats (Worksheet 10). Results suggest that water
temperatures were not drastically different between the habitat types at each site. Bank
habitats did not always have higher water temperatures than main channel habitats, but
were variable with slight consistency toward cooler temperatures. However, this
worksheet focused on YOY habitat and main channel comparisons. Comparisons of
water temperatures between subject and comparison sites were difficult to evaluate with
these data (Score = 0).
Long term discrete water temperature data were analyzed at three subject sites and
four comparison sites (Worksheet 12). Due to the focus on evaluating long term
datasets in this Worksheet, it was difficult to evaluate these data in a spatial context
(Score = 0).
7.2.3 Stressor-response from elsewhere
In Worksheet 11, continuous water temperature data were analyzed at several subject
and comparison sites to determine the maximum observation, maximum daily ranges,
and potential drops below 14°C after the spawn. Daily ranges were a surrogate
measure for rapid fluctuations. If daily ranges exceeded 7°C, then further investigation
into the magnitude and direction of that fluctuation would be necessary. The maximum
daily water temperature was 33.7°C (observed at the Juniata River at Newport) during
the two years of continuous record, which was well below the lethal temperature of 37°C
suggested by Wrenn (1980). Further, maximum daily ranges did not exceed 7°C at any
sites during the two year data record. There were insufficient data to confidently
determine if water temperatures dropped below 14°C during or just after spawning.
However, no sites had recorded temperatures below 14°C by late May/early June.
These data suggest water temperature did not exceed thresholds for thermal stress
(Score = -- for direct mortality and - for disease susceptibility).
7.3 Discussion
The evidence weakens the argument that increasing temperatures are causing the SMB
recruitment declines. There is no clear trend when comparing water temperature over
time at any of the subject stations and the largest increasing trend was observed at a
comparison site. There is also no clear evidence to suggest that water temperatures
have been exceedingly stressful for the recruitment of SMB. However, much of the
continuous data collected were during higher than average to average discharge years
and there is a lack of confidence when dealing with discrete datasets. It is important to

36
note that subject sites may be warmer than comparison sites simply because of the
physical nature of the Susquehanna River in that section (more wide and shallow than
other major drainages, allowing for greater thermal absorption from solar radiation)
(Consistency Score = -).
Candidate Cause 8: Increased pH or increased variability in pH
8.1 Cause Description
There is no absolute pH range where all freshwater fishes are unharmed; yet, it is
generally understood that there is a gradual decline in tolerance as pH deviates from
neutrality (EIFAC 1969, AFS 1979, Alabaster and Lloyd 1980). The acceptable range of
pH depends on many other factors, including water temperature, previous pH
acclimatization, DO concentration and various ions in the water (McKee and Wolf 1963).
The physiological effects on aquatic life induced by high pH have been studied less than
those at low pH (Doudoroff and Katz 1950, Alabaster and Lloyd 1980). It is suggested
that the toxic mode of action of high pH is hypertrophy of mucus cells at the base of the
gill filaments and destruction of gill and skin epithelium, with possible effects to the eye
lens and cornea (Alabaster and Lloyd 1980, Boyd 1990). Due to the effects on gill
structure and function, fishes are less able to excrete ammonia (NH3) through the gills,
leading to increased toxicity, even in the absence of high ambient NH3 (Schaperclaus
1991). The majority of freshwater fishes studied experience harmful effects (lethal or
sublethal) at sustained pH values between 9 and 10 (Weibe 1931, AFS 1979, Alabaster
and Lloyd 1980).
Rivers frequently exhibit diel fluctuations in pH resulting from photosynthesis, and
temporary exceedances of 9.0 pH units occur naturally in shallow and biologically
productive waters (Boyd 1990). It is suggested that no harmful effects would be
expected in fish experiencing rapid pH changes provided that variations remain within
normal ranges (6-9 pH units) (Witschi and Ziebell 1979). Additionally, Wiebe (1931)
reported that sunfish, Lepomis spp. and Goldfish, Carassius auratus survived rapid
changes from pH 7.2 to 9.6 (2.4 units); Largemouth Bass, Micropterus salmoides from
pH 6.1 to 9.6 (3.5 units); and SMB from pH 6.6 to 9.3 (2.7 units).
It is important to note that this section of the report discusses the direct effects of pH.
Topics such as the influence of pH on the toxicity of NH3, dissolved CO2 and the ratio of
dissolved inorganic phosphorous are discussed elsewhere.
8.2 Evidence (Appendix B: Worksheets 13 and 14)
8.2.1 Temporal co-occurrence

37
If high pH directly affects SMB recruitment, then pH would be expected to be higher
during the post-2005 time period than the pre-2005 time period. Discrete samples for
pH from PADEP’s Water Quality Network (WQN) and EPA’s STORET Database were
plotted for the years 1990-2014 and a slightly narrower time window of 1995-2014. At
the subject sites, a weakly increasing temporal trend in pH was observed (Worksheet
14, Score = +).
8.2.2 Spatial co-occurrence
If high pH directly affects SMB recruitment, then subject sites should experience a
greater magnitude, duration, and frequency of high pH compared to comparison sites.
PADEP and USGS collected continuous pH data during the spring and summer of 2012
and 2013 (Worksheet 13).There was little difference between subject and comparison
sites in the mean duration of pH values above 8.0 and above 9.0. In particular, in 2012
the Delaware River comparison site experienced slightly longer periods with pH values
above 9.0 than the subject sites (Score = -).
8.2.3 Stressor-response from elsewhere
Reviews published by the European Inland Fisheries Advisory Commission (EIFAC)
suggest that a range of 6.5 to 9.0 pH is likely to be harmless to aquatic life. Excursions
above 9.0 pH were observed at both subject and comparison sites (Worksheet 13).
However, very little data exist on how SMB are affected by high pH and at which age
tolerance may or may not change. For this reason, evidence based on stressor-
response relationships was not developed. The influence of pH on ammonia toxicity
was considered when evaluating Candidate Cause 10 (NH3).
8.3 Discussion
The occurrence of high pH values at the comparison sites, which do not exhibit poor
SMB recruitment (especially at the Delaware at Morrisville in 2012) weakens the
argument that high pH is the cause of low YOY recruitment in the middle Susquehanna
River and lower Juniata River (Consistency Score = -). This evidence was based on
data from continuous data samplers, which increases confidence. However, the
evidence was based on two years of data only, and both years had average or higher
than average discharge. Different conditions may occur in lower flow years. In addition,
the samplers were deployed in the main channel, and may not represent SMB YOY
habitat.
Candidate Cause 9: Low dissolved oxygen concentrations
9.1 Cause Description

38
Low DO levels can directly kill fish through asphyxiation. Many studies provide evidence
that juvenile centrarchids may be among the most sensitive of all warm-water fishes to
low DO concentrations. Smallmouth Bass hatchling and larvae survival was observed to
be significantly reduced at or below DO concentrations of 4.5 mg/L, (Siefert et al. 1974,
Spoor 1984). In laboratory experiments, lethal and sub-lethal effects of reduced DO
(i.e., less than 5 mg/L) were, in general, directly related to exposure times, which
ranged from hours to days (Mount 1964; Doudoroff and Shumway 1970, Siefert et al.
1974, Spoor 1984).
Like pH, rivers exhibit diel fluctuations in DO because of photosynthesis. As plants,
algae and bacteria photosynthesize during the day, they release oxygen. At night
photosynthesis ceases but respiration continues to consume oxygen, reducing
concentrations. Concentrations of DO are typically lowest just before dawn. In lakes and
rivers with high productivity, diel swings can be pronounced (Allan and Castillo 2007).
9.2 Evidence (Appendix B: Worksheets 18, 19, and 51)
9.2.1 Temporal co-occurrence
If low DO directly affects SMB recruitment, then DO concentrations should be lower
post-2005 than pre-2005. The SRBC collected discrete DO measurements using a
handheld field meter at several areas across the channel, with the median
measurement presented. Most data from 1985-2008 were taken in June through
September in a time ranging from the mid-morning through early afternoon. Data from
2011 and 2012 were collected in October and November (Worksheet 51). Values before
and after 2005 are difficult to compare because of data gaps, but overall are within a
reasonable range of each other (Score = 0).
9.2.2 Spatial co-occurrence
If low DO directly affects SMB recruitment, then DO should be lower at subject sites
than comparison sites. PADEP and USGS collected continuous DO data from June 1 to
July 31 in 2012 and 2013 (Worksheet 18). Data were collected within the main channel
at each site and consequently do not capture possible extremes that may exist along
the banks. Subject sites tended to have lower minimum DO levels than comparison
sites (Delaware River at Morrisville and Susquehanna at Danville). Differences were
most conspicuous during 2012 (Score = +).
9.2.3 Stressor-response from elsewhere
If low DO directly affects SMB recruitment, then DO observations within subject sites
should be as low as or lower than concentrations of concern reported elsewhere. The
continuous data discussed in Section 9.2.2 were compared against a benchmark of 5

39
mg/L, below which lethal and sublethal effects would be expected (Worksheet 19).
Dissolved oxygen did not fall below 4.5 mg/L at any of the subject sites. There were no
excursions below 5.0 at any of the Susquehanna River at Harrisburg sites. Dissolved
oxygen fell below 5 mg/L only at the Juniata River site and only during 2012 (six events
ranging between approximately 0.5 to 3.5 hours). (Score = - for direct mortality and 0 for
disease susceptibility)
9.3 Discussion
The lower DO daily minima observed at the subject sites provides evidence that lower
DO co-occurs with the low YOY recruitment in the middle Susquehanna River and lower
Juniata River. However, the DO levels were not sufficiently low to have produced direct
mortality (Consistency Score = -). It is not known whether levels are low enough to
increase susceptibility to disease, so this possibility remains (Consistency Score = +).
This evidence was based on data from continuous data samplers, which increases
confidence. However, the evidence was based on two years of data only, and both
years had average to higher than average discharge. Lower DO levels are expected to
occur in lower discharge years. In addition, the samplers were deployed in the main
channel, and may not represent SMB YOY habitats which have the potential to be
different.
Candidate Cause 10: Ammonia Toxicity
10.1 Cause Description
Exposure to elevated concentrations of ammonia is toxic to fish, causing mortality and
increase susceptibility to disease (Schaperclaus 1991). Ammonia toxicity increases with
increasing pH and water temperature (Ip et al. 2001), which can decrease YOY SMB
survival and recruitment to the adult population. Stressful summer conditions,
specifically water temperatures exceeding 30°C and pH exceeding 9.0 have been
recorded at several locations in the Susquehanna and Juniata Rivers since 2008
(Chaplin et al. 2009, Chaplin and Crawford 2012).
Laboratory methods for surface water samples measure both the un-ionized form
(ammonia, NH3) and the ionized form (ammonium, NH4+). The un-ionized NH3 is much
more toxic to aquatic organisms. As temperature and pH increase in the aquatic
environment, the proportion of NH3 to NH4+ also increases (Ip et al. 2001). With this
understanding, formulas and laboratory measurements can be used to evaluate NH3
toxicity. Broderius et al. (1985) evaluated the toxicity of NH3 to early life stages of SMB
at varying pH levels. These data provide insight as to whether YOY SMB are generally
more or less susceptible to the toxic effects of ammonia.
10.2 Evidence (Appendix B: Worksheet 20, 21, 22, and 52)
40
10.2.1 Temporal co-occurrence
If ammonia directly affects SMB recruitment, then ammonia concentrations should be
higher post-2005 than pre-2005. SRBC collected discrete ammonia samples at the
Juniata River at Newport from 1984-2013 (Worksheet 52). No temporal trend was
discernable; however, there were too many data gaps to make a confident conclusion
(Score = 0).
All NH3 data collected by the SRBC anywhere within the Susquehanna River Basin
were pooled and separated by major subbasins (Chemung River, upper, West Branch,
middle, lower Susquehanna River, and Juniata River) and into two time periods, pre-
2005 and post-2005. Only data collected from May to September were included. Data
were plotted using box plots and analyzed for differences using a non-parametric test
(Worksheet 22). Results suggest ammonia values were either significantly higher during
the pre-2005 time period or not significantly different; however, this evidence was not
scored because it covered basin wide analyses which go outside the case study.
10.2.2 Spatial co-occurrence
If NH3 directly affects SMB recruitment, then NH3 should be higher at subject sites than
the comparison sites. Discrete total ammonia (NH3 plus NH4+) samples were collected
by PADEP and USGS during the spring and summer of 2012 and 2013 at several
subject and comparison sites where continuous water temperature and pH sensors
were deployed. The discrete total ammonia samples were grouped together at each site
and descriptive statistics were calculated (Worksheet 20). Concentrations were similar
at subject and comparison sites.
It could be that even at similar total ammonia values, toxicity could be occurring at the
subject sites if pH and water temperature increased the proportion of NH3. This potential
was evaluated by comparing the discrete total ammonia measurements against PA
chronic ammonia criteria values adjusted for pH and water temperature using the
continuous data (Worksheet 20). Discrete measurements were lower than the
continuous chronic criteria at both subject and comparison sites (Score = --, see also
discussion in section 10.2.3 below).
10.2.3 Stressor-response from elsewhere
If NH3 toxicity directly affects SMB recruitment, then NH3 concentrations within subject
sites should be as high as or higher than concentrations of concern. Broderius and
others (1985) developed total ammonia chronic no-observed-effect levels for SMB at
various pH levels. Temperature was held constant throughout the study (at 22°C). For
comparison purpose, PA chronic NH3 toxicity criteria values were derived from formulas
in Table 3 of 25 Pa. Code §93.7(a) (Table 3, Worksheet 21).
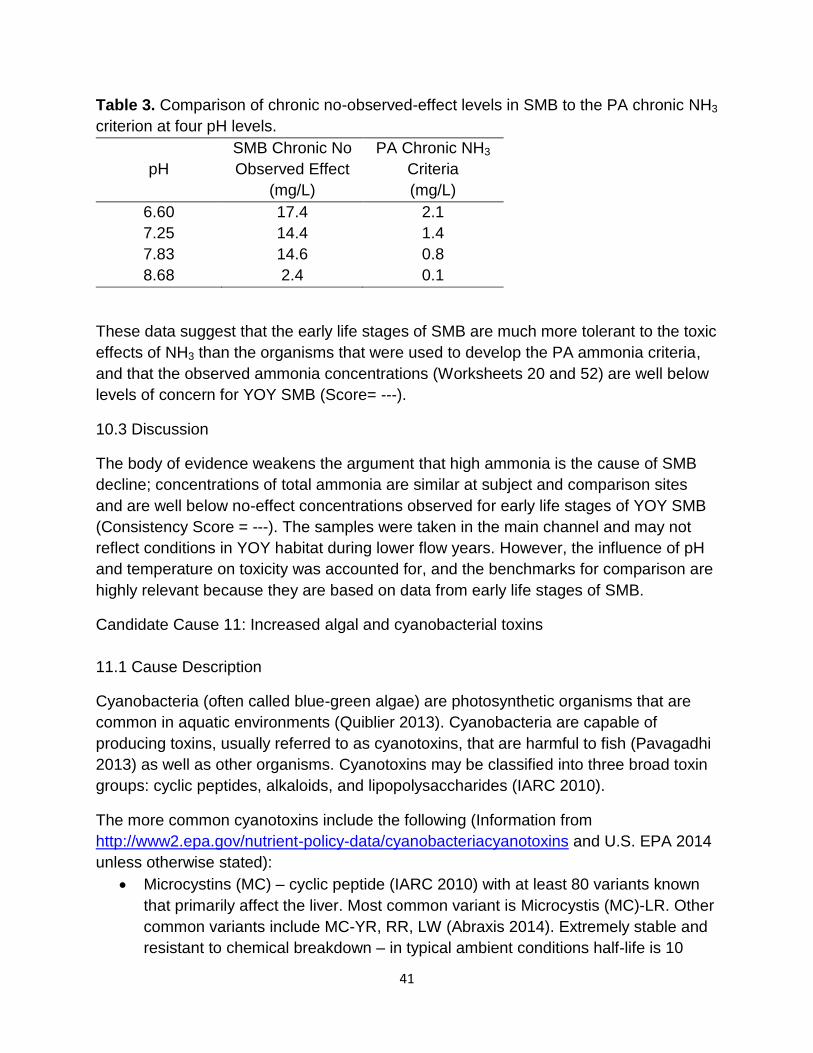
41
Table 3. Comparison of chronic no-observed-effect levels in SMB to the PA chronic NH3
criterion at four pH levels.
pH
SMB Chronic No
Observed Effect
(mg/L)
PA Chronic NH3
Criteria
(mg/L)
6.60 17.4 2.1
7.25 14.4 1.4
7.83 14.6 0.8
8.68 2.4 0.1
These data suggest that the early life stages of SMB are much more tolerant to the toxic
effects of NH3 than the organisms that were used to develop the PA ammonia criteria,
and that the observed ammonia concentrations (Worksheets 20 and 52) are well below
levels of concern for YOY SMB (Score= ---).
10.3 Discussion
The body of evidence weakens the argument that high ammonia is the cause of SMB
decline; concentrations of total ammonia are similar at subject and comparison sites
and are well below no-effect concentrations observed for early life stages of YOY SMB
(Consistency Score = ---). The samples were taken in the main channel and may not
reflect conditions in YOY habitat during lower flow years. However, the influence of pH
and temperature on toxicity was accounted for, and the benchmarks for comparison are
highly relevant because they are based on data from early life stages of SMB.
Candidate Cause 11: Increased algal and cyanobacterial toxins
11.1 Cause Description
Cyanobacteria (often called blue-green algae) are photosynthetic organisms that are
common in aquatic environments (Quiblier 2013). Cyanobacteria are capable of
producing toxins, usually referred to as cyanotoxins, that are harmful to fish (Pavagadhi
2013) as well as other organisms. Cyanotoxins may be classified into three broad toxin
groups: cyclic peptides, alkaloids, and lipopolysaccharides (IARC 2010).
The more common cyanotoxins include the following (Information from
http://www2.epa.gov/nutrient-policy-data/cyanobacteriacyanotoxins and U.S. EPA 2014
unless otherwise stated):
Microcystins (MC) – cyclic peptide (IARC 2010) with at least 80 variants known
that primarily affect the liver. Most common variant is Microcystis (MC)-LR. Other
common variants include MC-YR, RR, LW (Abraxis 2014). Extremely stable and
resistant to chemical breakdown – in typical ambient conditions half-life is 10
42
weeks (Butler 2009). Chronic exposure to MCs can cause serious health
problems in animals and humans such as hepatic, gastric and epidermic
diseases; neurological impairment; and death (Babica et al., 2006; Leao et al.,
2009; Sivonen and Jones, 1999). There is also potential for a negative
relationship between condition factor and increasing MC concentrations (Acuna
et al. 2012).
Anatoxin – alkaloid toxin (IARC 2010) with 2 to 6 variants. Typical variants
include Anatoxin-a and homoanatoxin-a. Primarily a neurotoxin.
Cylindrospermopsons – alkaloid toxin (IARC 2010). With 3 known variants.
Primarily a liver toxin.
Saxitoxin – alkaloid toxin (IARC 2010). Commonly associated with marine based
Paralytic Shellfish Poisoning (PSP) in humans. However, toxins are also
produced in freshwater systems.
11.2 Evidence (Appendix B: Worksheets 15, 23, 32, 33, 34, and 50)
11.2.1 Spatial co-occurrence
If cyanotoxins affect SMB recruitment, then taxa that produce toxins should be more
prevalent at subject sites than comparison sites.
PADEP and USGS collected cyanobacterial samples in 2005, 2012, and 2013 from
multiple sites throughout the Susquehanna Basin. Identified taxa were associated with
cyanotoxin production based on Quiblier (2010). Sites corresponding to 2014 PADEP
cyanotoxin fish tissue collection were evaluated for the potential that cyanotoxin
producing cyanobacteria may have been present at those sites (Worksheet 32). The
analysis suggested that cyanobacteria genera known to produce toxins were observed
at both subject and comparison sites at the Susquehanna, Delaware, and Allegheny
rivers (Score = -).
This evidence has a degree of uncertainty because the presence of toxin producing
cyanobacteria does not necessarily imply that toxins are being produced. Only certain
strains within a taxa group possess the genotype necessary for toxin production. Also
the environmental factors that stimulate algal toxin production are not well understood
for benthic cyanobacteria.
11.2.2 Exposure
Microcystin is known to bioaccumulate in fish (Martin and Vasconcelos 2009). If MC is
affecting recruitment of SMB into age class 1+, then MC should be detected in fish
livers, and there should be a greater frequency of positive detections or higher MC
values in livers at the subject sites than the comparison sites.

43
PADEP collected liver tissue from adult female SMB during the spring of 2014. Liver
samples were analyzed using the enzyme-linked immunosorbent assay (ELISA) method
at the PADEP laboratory (Worksheet 33). All sites had at least some positive detection
for MC in SMB liver tissue. Liver samples from subject sites were typically similar or
lower in MC than all comparison sites. Owing to the limited sampling (only adults in one
year), it was difficult to make a determination using this evidence (Score = 0). There
was also no exposure evidence available for other algal toxins.
11.2.3 Causal Pathway
Cyanobacteria blooms are often associated with eutrophic or nutrient rich conditions.
The evidence described in this section discusses the potential for nutrients and low flow
conditions to create the necessary antecedent conditions for blooms. The relationship
between nutrients and cyanobacteria blooms is incompletely understood. For example,
many cyanobacteria genera are highly competitive at low dissolved inorganic
phosphorus (DIP; i.e., orthophosphate) concentrations and have novel ways to acquire
organic phosphorus compounds (O’Neil 2012). Additionally, many genera also “display
great flexibility in the nitrogen (N) sources they exploit to form blooms” (O’Neil 2012). As
discussed above, the presence of toxin producing cyanobacteria does not necessarily
mean that toxins are being produced. Toxin production is likely a function of genotype
and environmental conditions, and is currently an area of active research. Still, there
was evidence of at least some steps in the causal pathway leading to cyanotoxins
(Overall score = +).
Increase in Phosphorus
Discrete orthophosphate measurements were downloaded from PADEP’s Sample
Information System (SIS) and analyzed by USGS to calculate loads and evaluate trends
using the ESTIMATOR and WRTDS regression models. There was a large spike in
orthophosphate loads at many locations during 2003 and 2004 (Worksheet 15, also
reviewed in Worksheet 23). Orthophosphate trends have increased in the last 20 years
in the Susquehanna River basin. However, between 2003 and 2012 orthophosphate
trends have significantly decreased (Worksheet 15, Score = +).
Increase in Nitrogen
In analyses conducted during Workshop 3 (C. McGarrell, PADEP, personal
communication), total nitrogen (TN) levels at the Juniata River at Newport were higher
than at the Susquehanna River at Harrisburg and Delaware River at Morrisville.
However, the TN levels were just as high in low SMB CPUE years as they were in high
SMB CPUE years (Score = 0).
Dissolved Inorganic Nitrogen (DIN):DIP ratios

44
DIN:DIP ratios were calculated based on discrete data from 2012 and 2013 for two
subject sites and one comparison site. The algal taxa lists discussed in Section 11.2.1
were compared to DIN:DIP ratios that have been reported to be associated with
cyanotoxin production (Pawlik-Skowronska et al. 2013). The microcystin toxin producing
taxa of Phormidium spp. and Microcystis spp. are present in the subject area and the
DIN:DIP ratios are usually above the 23:1 threshold suggested by Pawlik-Skowronska
et al. (2013) to favor the production of microcystin. Though Phormidium spp. was also
identified at the comparison site (Delaware River at Morrisville) the DIN:DIP ratio
threshold suggested by Pawlik-Skowronska et al. (2013) is likely met less often there
(Worksheet 50, Score = +, with recommendations for continued research).
Decrease in Late Summer Flow
Discharge data from the Harrisburg gage from 1980 to 2014 were used to visually
evaluate whether discharge patterns have changed over time and if patterns coincided
with the SMB declines (Worksheet 23). The period of 1999 through 2004 is marked by a
lack of major elevated discharge events (> 275,000 cfs) coupled with the presence of
low discharge events (< 4,000 cfs). From 2005 to the present, elevated discharge
events have occurred more frequently. Although the period of low discharge preceded
the initial observations of recruitment declines, low recruitment has continued despite
frequent extreme discharge events from 2005 to the present (Score = -).
Algal blooms (which may or may not include cyanobacteria) were documented in the
subject reach using aerial photographs in October 2007 and July 2012 following low
flow periods (Worksheet 34). The surface blooms were concentrated along shoreline
habitats and between islands on the river. Additional photographs of a filamentous
algae bloom on the Susquehanna River at Rockville were taken by Geoff Smith of the
PFBC on August 12, 2012 coinciding with a fish pathology survey where YOY SMB with
abnormalities were identified (Score = +).
Increase or Change in Algal Productivity Surrogates
High algal productivity and photosynthetic activity is typically associated with large diel
swings in DO and pH, and high temperatures. Values of these surrogates for algal
productivity were data collected during years with mean June discharge values below
the long-term mean flow (to control for effects of flow on CPUE) (Worksheet 35). There
was no difference between periods of time with low YOY CPUE values and high YOY
CPUE (Score = -).
11.3 Discussion
The body of evidence for cyanotoxins as the cause of SMB recruitment declines was
inconclusive and more research is recommended. Taxa that are capable of producing
45
cyanotoxins were observed at subject sites, and cyanotoxins were measured in livers of
adult SMB. However, both of these conditions were also observed at the comparison
sites. Additionally, presence of taxa does not necessarily mean cyanotoxins will be
produced.
Other evidence comes from evaluating whether conditions that promote cyanobacterial
blooms occur at the subject sites. A peak in DIP loads was observed in 2003 and 2004
at subject sites suggesting a possible causal pathway, yet similar spikes were seen at
comparison sites as well. DIN:DIP ratios consistent with cyanotoxin production were
more frequently observed at subject sites than comparison sites, and algal blooms have
been documented during low flow conditions in two separate years. However, neither
low flow conditions nor water temperatures expected to promote algal blooms were
associated with YOY CPUE. Similarly, diel swings of pH and DO typically associated
with algal blooms also were not associated with YOY CPUE (Consistency Score for
microcystins = -, other algal toxins = +).
Additional monitoring to document the cyanobacteria species present, determining
whether cyanotoxins are present in YOY SMB microhabitats and whether there is
evidence of YOY SMB exposure to these toxins is necessary to fully understand the role
it may play in the Susquehanna River system.
Candidate Cause 12: Toxic chemicals
12.1 Cause Description
Virtually all anthropogenic chemicals have pathways to the environment. Most
chemicals enter aquatic ecosystems through sources including, but not limited to
agriculture (Halling-Sorensen et al. 1998), combined sewer overflows (Philips and
Chalmers 2009), and wastewater disposal systems (Carrara et at. 2008, Sellin et at.
2009, Phillips et at. 2010).
Toxic chemicals and their degradates can have variable persistence in the aquatic
environment and may have stronger affinities to water or sediment (Reif et al. 2012). In
recent years, technological advancements have made it possible to quantify most toxic
chemicals even at minute concentrations (Snyder et at. 2009). Studies have
documented the occurrence of many toxic chemicals in aquatic environments (Kolpin et
at. 2002, Loper et al 2007, Blazer et al. 2010, Reif et al. 2012, PADEP 2014a), but the
spatial distribution and the complete understanding of their effects on aquatic life
generally and SMB specifically, are still in review (Daughton and Ternes 1999,
Jorgensen and Halling-Sorensen 2000, Blazer et al. 2014, PADEP 2014a).
12.2 Evidence (Appendix B: Worksheets 37.1, 38, 39, 40, 42, 45, and 46)
46
12.2.1 Spatial co-occurrence
If metals, polychlorinated biphenyls (PCBs) or other organic chemicals were causing the
declines in SMB recruitment, higher concentrations of these chemicals would be
expected at subject areas than comparison sites.
Metals
The PA DEP collected discrete sediment and water samples to be tested for metals
from both subject sites and comparison sites in 2013 and 2014 (Worksheets 40 and 46).
In sediment, the Youghiogheny River at Sutersville, Juniata River at Lewistown, and
Conodoguinet Creek at Good Hope had the highest concentrations of metals. In water
samples, concentrations were frequently highest at the Youghiogheny comparison site.
There is no consistent pattern between prevalence of metals and low recruitment of
YOY SMB (Score = -).
Organic toxicants
PADEP collected sediment samples from both subject and comparison sites in 2013
and 2014 (Worksheets 37.1, 38 and 39). Historical pesticides detected were 4,4’-DDD,
4,4’-DDE, chloroneb, cis-permethrin, trans-permethrin, hexachlorobenzene, and
trifluralin. There were few discernable patterns in the data; historically used pesticides
were detected at many sites, with one or two detections per site per sample when
detected. PCBs were detected a total of six times, at very low concentrations. PADEP
also sampled for wastewater compounds (samples analyzed by USGS). Compounds
were detected at many sites in no discernable pattern. Currently used pesticides were
also sampled for (analyzed by USGS) and most were infrequently encountered (Score =
-).
PADEP deployed passive water samplers at both subject and comparison sites in 2013
to be tested for a variety of different compounds (organochlorine & currently used
pesticides, PCBs, Polybrominated diphenyl ethers (PBDEs, flame retardants),
hormones, wastewater compounds, and polycyclic aromatic hydrocarbons (PAHs)), all
analyzed by USGS (Worksheets 42 and 37.1). Due to the possible immunosuppression
and endocrine disrupting effects, results for hormones and herbicides are discussed
under Candidate Cause 13. Pharmaceutical data is currently pending. Results for other
toxic substances are presented here.
A large number of compounds were tested and many results were combined by
chemical class and mapped to aid evaluation (Worksheet 37.1). PAHs were ubiquitous.
Total PBDE concentrations were highest at the Delaware River (comparison site) and
47
Juniata River (subject site). Concentrations of Dichlorodiphenyltrichloroethane (DDT)
and its metabolites were highest at comparison sites. Bromoform was only detected at
one subject site (Juniata River at Lewistown). However, due to a limited sample size and
lack of striking differences between subject and comparison sites, the evidence for
organic toxicants was given a score of 0.
12.2.2 Stressor-response from elsewhere
Chemical concentrations in water quality grab samples were compared to readily available Ambient Water Quality Criteria (AWQC) (i.e., for metals. Criteria for organic chemicals were not available at the time of the workshop). Two sets of samples were compared; the first set drew from PADEP’s water quality network for the years 2006-2013 for the Susquehanna River at Marietta and upstream sites (Worksheet 45). The second set of samples encompassed data from 121 sites collected during 2013 and 2014, and included subject sites, nearby tributaries, and comparison sites (Worksheet 46). Aluminum, lead and iron concentrations showed concentration spikes that exceeded chronic AWQC. The evidence was not scored because it is not known how these levels affect SMB. However, given the pH observed in the water column, aluminum and iron would be expected to occur as floc or other particles, rather than as the toxic free ion form.
12.3 Discussion
Concentrations of metals and organic toxicants were not clearly higher at subject sites,
arguing against this Candidate Cause (Consistency Score = -). However, the evidence
is weak owing to the scarcity of data for organic toxic substances, the low number of
samples and sampling years, and the lack of pre-2004 datasets or stressor-response
relationships that could be used to derive additional evidence.
Candidate Cause 13: Increased Endocrine Disrupting Chemicals (EDCs) and
Herbicides
13.1 Cause Description
EDCs are environmental contaminants that interfere with hormonal regulation.
Historically, concern over EDCs has focused on reproductive effects (e.g., Fatima et al.
2007, Kidd et al, 2007, Scholz and Kluver 2009, Kloas et al. 2009, Blazer et al. 2012).
Due to the mode of action, EDCs were judged to be unlikely to directly kill YOY SMB.
Similarly, herbicides were judged to be unlikely to be directly causing mortality of YOY
SMB. However, each of these two chemical categories (including their degradates) has
been linked to immune suppression in fish (Ahmed 2000, Kreutz et al. 2010, Rohr and
McCoy 2010, Casanova et al. 2011, Milla et al. 2011, Shelley et al. 2012, Rogers et al.
2013). For this reason, the categories were combined. Suppressed immune functionality

48
could lead to mortality and decreased recruitment of YOY SMB by increasing the
frequency and severity of disease (see discussion under Candidate Cause 14).
13.2 Evidence (Appendix B, Worksheets 37.1, 38, 39, 42, 43, 44, 48, and 49)
13.2.1 Spatial co-occurrence
If EDCs or herbicides are causing the declines in SMB recruitment, higher
concentrations of these chemicals would be expected at subject sites than at
comparison sites.
PADEP deployed passive water samplers at 12 sites within and out of the Susquehanna
basin in 2013 to be tested for a variety of different compounds (Worksheet 42 and 43:
PAHs, wastewater compounds and pesticides were discussed under Candidate Cause
12). Samples were analyzed by USGS. Many results were combined by chemical class
and mapped to aid evaluation (Worksheet 37.1). Highest total estrogenicity levels and
higher concentrations of hormones were found in samplers deployed in the Juniata
River at Newport, and Susquehanna River at Sunbury, Harrisburg and Marietta3 sites
(Worksheet 37.1) (Score = +). The highest concentrations of triazine herbicides were
found at the Juniata River at Lewistown and Susquehanna at Marietta sites (Score = +).
In a separate study; however (Worksheet 48, Blazer et al. 2014), USGS found higher
levels of atrazine in one passive sampler deployed at the Allegheny River at Kittanning
than one deployed at Juniata River at Newport, but this evidence was not scored
because of the limited sample size.
USGS and SRBC collected discrete water samples under baseflow and stormwater
conditions at four subject sites and one comparison site from March through August
2013 and 2014 (Worksheet 44). Atrazine and metolachlor were found at higher
concentrations or frequencies of detection at the subject sites (particularly the Juniata
River at Newport and Susquehanna at Marietta) compared to the Delaware River
comparison site (Score = +).
USGS collected discrete water samples from 12 sites in 2010 (Worksheet 48). There
was no consistent pattern in the frequency of hormone detection between subject and
comparison sites. In addition, PADEP collected discrete water samples from 29 tributary
sites (2013) and tested them for total estrogenicity (Worksheet 49). Samples were
3 The Susquehanna River at Marietta sampling location is located approximately 20 miles downstream of York Haven. Although outside of the subject reach, environmental data were considered to be sufficiently relevant to be included.
49
analyzed by USGS. Estrogenicity was detected with low frequency, but all five sites with
detected estrogenicity were in tributaries to the subject reach (Score = 0).
PADEP collected sediment samples from both subject and comparison sites in 2013
and 2014 (Worksheets 38, 39, and 47). Samples were analyzed by USGS. There was
no clear pattern in the frequency of detection of herbicides or hormones detected (Score
= 0).
13.2.2 Evidence of Exposure
If YOY SMB were exposed to EDCs, then biomarkers of estrogenic exposure should be
higher at subject sites than comparison sites. However, the use of measures of
reproductive endocrine disruption to assess the condition of YOY SMB is not effective
as the fish are not yet mature. Measurements of these biomarkers in adult SMB are
used here as surrogates to evaluate whether exposure of YOY to EDCs is occurring.
USGS collected SMB at 16 locations in the basin and outside of the basin from 2007 to
2010 to evaluate reproductive endocrine disruption in adult SMB using plasma
vitellogenin and prevalence and severity of testicular oocyte formation in male fish
(Worksheet 48, Blazer et al., 2014). Plasma vitellogenin levels were variable within
similar bounds in fish collected at the Susquehanna River, Juniata River and Allegheny
River at Kittanning sites. However, more male SMB were found to have testicular
oocytes (intersex) in the Susquehanna River and Juniata River subject sites, and
Swatara Creek, a tributary to the middle Susquehanna River than the Allegheny River at
Kittanning (Score = +).
13.3 Discussion
Evidence that water concentrations of potential EDCs and herbicides are higher at the
Susquehanna River and Juniata River subject sites than comparison sites supports the
argument for this candidate cause. The higher frequency of testicular oocyte formation
in adult SMB from the Susquehanna and Juniata rivers lends further support that
exposure to EDCs is at biologically meaningful concentrations (Consistency Score = +).
However, the evidence is weak due to the low number of samples and sampling years,
the lack of pre-2004 datasets and a lack of stressor-response relationships that could
be used to derive additional evidence. For this reason, additional research is
recommended.
Candidate Cause 14: Increased pathogens and parasites
14.1 Cause Description

50
As described in the introduction, a high frequency of disease associated with pathogen
and parasite infections has been noted in YOY SMB since 2005 (Figure 7). Pathological
analysis indicated that the disease was caused by secondary infections by opportunistic
bacteria (e.g., Flavobacterium columnare, Aeromonas hydrophila) (Smith et al. 2015).
As secondary pathogens, these organisms do not typically kill fish directly but manifest
as a result of another factor affecting immune function.
Figure 7. The number of years YOY SMB were collected with obvious signs of disease
(lesions, fin erosions, or dead individuals) during backpack electrofishing surveys at
major river and warm-water stream locations in Pennsylvania.
Additional pathogens and parasites have been associated with the disease outbreaks
(Walsh et al. 2012; Smith et al. 2015). Largemouth Bass Virus (LMBV) has been
consistently isolated from moribund SMB specimens collected from the Susquehanna
Basin. Clinically diseased fish and apparently healthy fish from the same location have
yielded LMBV during past cell culture analysis. Despite testing positive for LMBV, fish
did not exhibit the clinical signs of LMBV infection described by Plumb et al. (1996). The
repeated detection of LMBV in juvenile SMB specimens from diseased populations and
51
the coincident onset of disease and discovery of LMBV in the Susquehanna River Basin
in 2005 (USFWS, National Wild Fish Health Database) necessitates a closer
investigation into the potential role of LMBV in causing these annual mortality episodes
in juvenile SMB.
An additional concern that is currently being investigated is the presence of the
myxozoan parasite Myxobolus inornatus (Walsh et al. 2012) within muscle and
connective tissue of YOY SMB. Myxozoan parasite infections can be responsible for
important economic losses in fisheries and aquaculture industries (Sitjà-Bobadilla 2008,
Nehring and Walker 1996, Koel et al. 2006, Hanson et al. 2008, Holzer et al. 2013).
Internal and external signs of parasite infections, both trematodes and myxozoans, are
commonly observed in the diseased YOY SMB. However, the role that the myxozoan
parasites play in YOY SMB mortalities remains unclear. Parasites in general may
compromise YOY SMB in a number of ways: high parasite loads may contribute to
general stress, as well as immune suppression, resulting in increased susceptibility to
opportunistic bacteria; or sites of parasite entry or exit may cause wounds allowing for
bacterial entry.
While habitat selection based on higher temperature may benefit YOY SMB
metabolically, it also potentially increases the risk of exposure to pathogens. Grant et al.
(2003) found that temperatures above 30oC increased the viral replication rate of LMBV
and that Largemouth Bass infected with LMBV had higher rates of mortality and higher
viral loads at 30oC than at 25oC in laboratory experiments. Similarly, some common
bacterial pathogens such as Flavobacterium columnare (20 – 25oC, Starliper and Schill
2010) and Aeromonas hydrophila (25-35oC, Cipriano and Austin 2011) share optimal
temperature ranges to that of YOY SMB. Therefore, a complex relationship between
pathogen and parasite virulence and environmental factors potentially exists.
14.2 Evidence (Appendix B: Worksheets 27, 29, 30, and 31)
14.2.1 Spatial Co-occurrence
If pathogens and parasites affect SMB recruitment then they should be more prevalent
at subject sites than comparison sites. Largemouth Bass Virus infected SMB were
found at both subject and comparison sites (Worksheet 29). Yet, the sample size
available for this analysis was limited and more data are needed (Score = 0). The
incidence of the myxozoan parasite infections from histological data of YOY SMB was
reviewed for 2013 and 2014 (Worksheet 30). Similarly, it was determined that this
parasite occurred at both subject and comparison sites. Although the data demonstrate
SMB are exposed to LMBV and the myxozoan parasite, more data are needed to
determine if prevalence is greater in subject sites than comparison sites (Score = 0 for
LMBV, 0 for Myxozoans, and 0 for other pathogens).

52
14.2.2 Evidence of Mechanism
If pathogens and parasites were causing the decline in SMB population, then there
should be a negative relationship between prevalence and CPUE. The association
between prevalence and the next year’s age-1 CPUE was calculated using Spearman’s
rank correlation (Worksheet 31). Although the data used in this worksheet were limited,
they demonstrated a strong negative correlation between disease and the following
year’s age class CPUE (Figure 8, r = -0.90) (Score = + for LMBV, + for Myxozoans, and
+ for other pathogens).
Figure 8. Disease prevalence of YOY SMB during backpack electrofishing surveys
compared to age-1 SMB catch per unit effort during night boat electrofishing surveys
during the following year at the middle Susquehanna River (Sunbury to York Haven).
Line added to aid visualization.
14.2.3 Causal Pathway
If pathogens and parasites are causing the decline in SMB recruitment, then other
environmental factors should be allowing for increased prevalence of these organisms,
or increasing YOY SMB susceptibility to them. Continuous, physicochemical data (water
temperature, pH, and DO) from subject reaches were overlain with results from YOY

53
SMB surveys (Worksheet 27). There is evidence of stressful water quality conditions
occurring prior to the onset of disease at some reaches during some years, but it does
not occur consistently. For example, there are incidences where stressful
physicochemical conditions occur where no disease is noted as well as instances when
physicochemical conditions are not particularly stressful, yet signs of disease were
found (Score = 0).
14.3 Discussion
More data on specific pathogens and their virulence are needed. However, there is a
considerable linkage between observed disease of YOY SMB and recruitment into the
adult population as demonstrated by a high correlation (Consistency Score = +).
Currently, there are no consistent patterns in physicochemical data that precede
disease onset among reaches and years. Other factors or interactive effects may
influence the impact of pathogens and parasites, but more research is needed.
Conclusions
The CADDIS process narrowed the scope of concerns that may be affecting SMB
populations in the Susquehanna and Juniata rivers. A summary of each candidate
cause score and consistency score is provided in Appendix C. Based on all of the
evidence, a classification of Likely, Uncertain, or Unlikely was assigned to each
candidate cause (Table 4). Eight candidate causes were not supported by the data
analysis and were considered unlikely for directly causing the decline of YOY SMB
recruitment. The evidence for eight additional candidate causes was judged to be
uncertain. With more data and analysis, these factors could be directly or indirectly
implicated in the declines in SMB recruitment (see the section below on
Recommendations and Future Research).
Given the current state of available information, the CADDIS process identified EDCs
and herbicides (Candidate Cause 13) and pathogens and parasites (Candidate Cause
14) as likely causes for the decline in recruitment of YOY SMB into the adult population
(Table 4; Figure 9). It is critical to note that this report only serves to provide information
on the current state of data collection and conclusions related to the SMB decline and
disease. There are many data that have yet to be analyzed and interpreted which may
affect any final conclusions.

54
Table 4. Candidate cause classifications
Candidate
Cause # Candidate Cause Name
Likely Causes
13 EDCs and herbicides1
14 Pathogens & Parasites with other stressors2
Unlikely Causes
1 High Flows
2 Intraspecific Competition
4 YOY Food Quality: fatty acids
7 Temperature – direct mortality
8 pH
9 Dissolved Oxygen – direct mortality
10 Ammonia (NH3)
12 Toxic Chemicals: pesticides/PCBs/metals
Uncertain Causes
3 Interspecific Competition
4 YOY Food Quality: thiaminase
5 Egg Quality
6 YOY Habitat
7 Temperature – increased disease
9 Dissolved Oxygen – increased disease
11 Algal & Bacterial Toxins
14 Pathogens & Parasites alone2 1. The evidence available for herbicides was limited and future monitoring is planned to obtain
more data. 2. The workshop participants concluded that pathogens and parasites were likely interacting with
other candidate causes in order to produce the disease. It is uncertain whether they would be
capable of doing so alone.
The data used to derive evidence for this report had many good qualities that increase
overall confidence in conclusions. Many datasets were collected at both subject sites
and comparison sites using the same methods, sampling designs and during the same
timeframe. Data that were used to temporally contrast conditions pre- and post- 2005
were particularly valuable. Data for many candidate causes were measured from
continuous and passive monitoring systems, increasing confidence that intermittent
events were captured. However, much of the intensive and passive sampling was
conducted in 2013 and 2014. In these years, the Susquehanna and Juniata Rivers
experienced average to above average discharge and data would not necessarily
represent conditions during low-flow years. Environmental conditions in years with low

55
flow are of particular interest because low flows in late spring were historically (i.e., pre-
2005) associated with strong recruitment of YOY into adult age classes.
A final conceptual model diagram was created to illustrate the overall conclusions of the
CADDIS process (Figure 9). The final diagram demonstrates the understanding that
uncertain candidate causes may still be playing a role in the decline of the SMB. As
more data are collected these candidate causes will be revisited to determine their
contribution to the overall SMB population decline.
Figure 9. Final conceptual model diagram depicting likely (bold font) and uncertain
(gray font) causes in the blue boxes. Further explanation of the legend can be found in
Appendix A.
56
General Discussion
This report represents a large amount of work from many dedicated professionals
across multiple agencies and organizations. It is the compilation of the current
understanding as it relates to the SMB population decline in the Susquehanna River
and will clarify needs for continued research. This report also provides greater
transparency on what work has been completed thus far.
Even with these accomplishments, limited time and resources were available for the
CADDIS process. Considerable amounts of data were not included because they were
still being processed or collected in the field. Consequently, many sub-lethal, complex
interaction hypotheses were not fully developed or analyzed. In addition, the process
focused on identifying the proximate stressors causing the effects, with less attention
paid to sources of those stressors. Many topics including but not limited to water
temperature, pH, DO, orthophosphate, and other nutrients were discussed at great
length during the CADDIS process, but were not prominently covered by the worksheets
or this report. Some of these ideas are discussed in greater detail below.
A changing ecosystem
There is little doubt that the Susquehanna River has experienced water quality changes
over the past 20-30 years. Even after the reduction in likelihood of several candidate
causes, some parameters are still speculated to affect the health and survivorship of
SMB (Chaplin et al. 2009, Chaplin and Crawford 2012, Blazer et al. 2014). However,
tracking these effects can be difficult due to variable environmental conditions such as
annual discharge (PADEP 2014a) and lack of long-term continuous datasets.
Growing concern over a warming climate and its effect on the landscape and to aquatic
life is justifiable (Peterson and Kwak 1999, Najjar et al. 2000). As it relates to this report,
increasing water temperatures are not just associated with SMB thermal tolerances, but
also with the thermal preferences of pathogens and parasites that inhabit this system
(Smith et al. 2015). The projections of increasing temperatures have even more
profound implications such as increased precipitation and subsequent changes to
stream flow (Najjar et al. 2000). Changes in the magnitude and duration of streamflow
are known to cause physical habitat alterations and fluctuations in sediment transport
(Poff et al. 1997, Maloney and Shull 2015), and these variations can affect aquatic life
(Barbour et al. 1995, Davies and Jackson 2006). Even slight increases in water
temperature can affect how chemicals interact with each other. A few relevant examples
include an increased proportion of toxic ammonia and increased availability of
orthophosphate (Cravotta et al. 2013, Cravotta, unpublished data). Water temperatures
in the Susquehanna near Harrisburg, PA have increased between the 1970s and
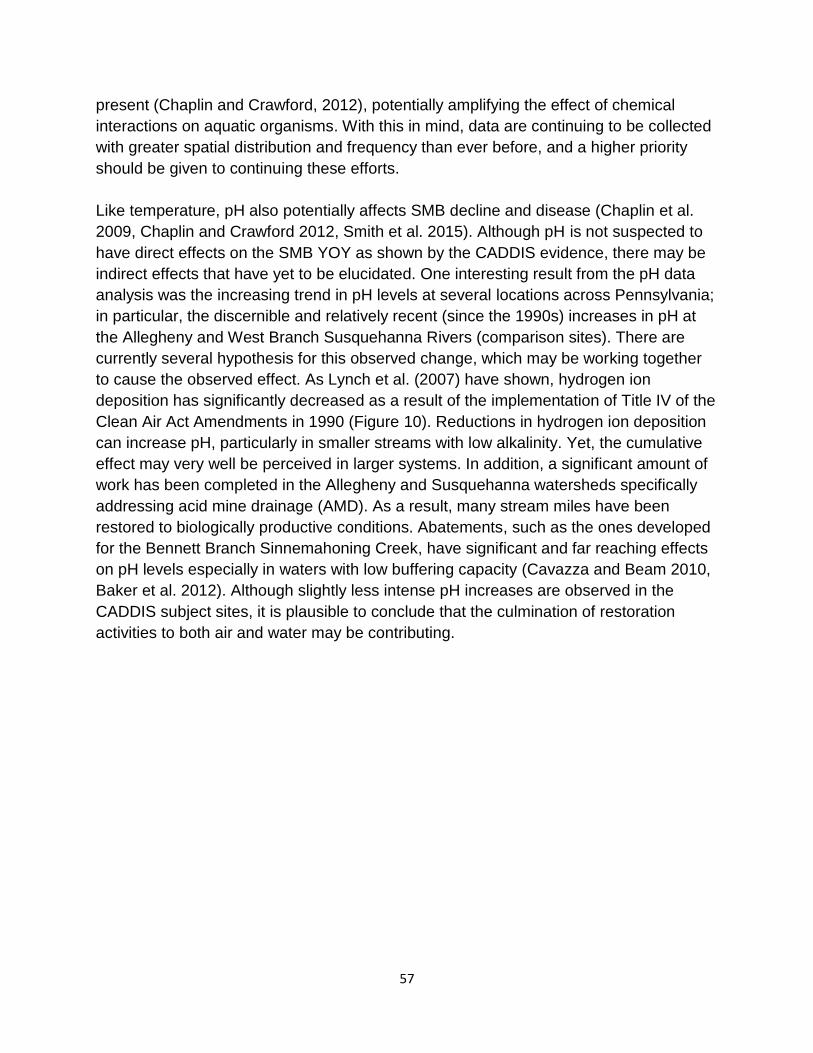
57
present (Chaplin and Crawford, 2012), potentially amplifying the effect of chemical
interactions on aquatic organisms. With this in mind, data are continuing to be collected
with greater spatial distribution and frequency than ever before, and a higher priority
should be given to continuing these efforts.
Like temperature, pH also potentially affects SMB decline and disease (Chaplin et al.
2009, Chaplin and Crawford 2012, Smith et al. 2015). Although pH is not suspected to
have direct effects on the SMB YOY as shown by the CADDIS evidence, there may be
indirect effects that have yet to be elucidated. One interesting result from the pH data
analysis was the increasing trend in pH levels at several locations across Pennsylvania;
in particular, the discernible and relatively recent (since the 1990s) increases in pH at
the Allegheny and West Branch Susquehanna Rivers (comparison sites). There are
currently several hypothesis for this observed change, which may be working together
to cause the observed effect. As Lynch et al. (2007) have shown, hydrogen ion
deposition has significantly decreased as a result of the implementation of Title IV of the
Clean Air Act Amendments in 1990 (Figure 10). Reductions in hydrogen ion deposition
can increase pH, particularly in smaller streams with low alkalinity. Yet, the cumulative
effect may very well be perceived in larger systems. In addition, a significant amount of
work has been completed in the Allegheny and Susquehanna watersheds specifically
addressing acid mine drainage (AMD). As a result, many stream miles have been
restored to biologically productive conditions. Abatements, such as the ones developed
for the Bennett Branch Sinnemahoning Creek, have significant and far reaching effects
on pH levels especially in waters with low buffering capacity (Cavazza and Beam 2010,
Baker et al. 2012). Although slightly less intense pH increases are observed in the
CADDIS subject sites, it is plausible to conclude that the culmination of restoration
activities to both air and water may be contributing.
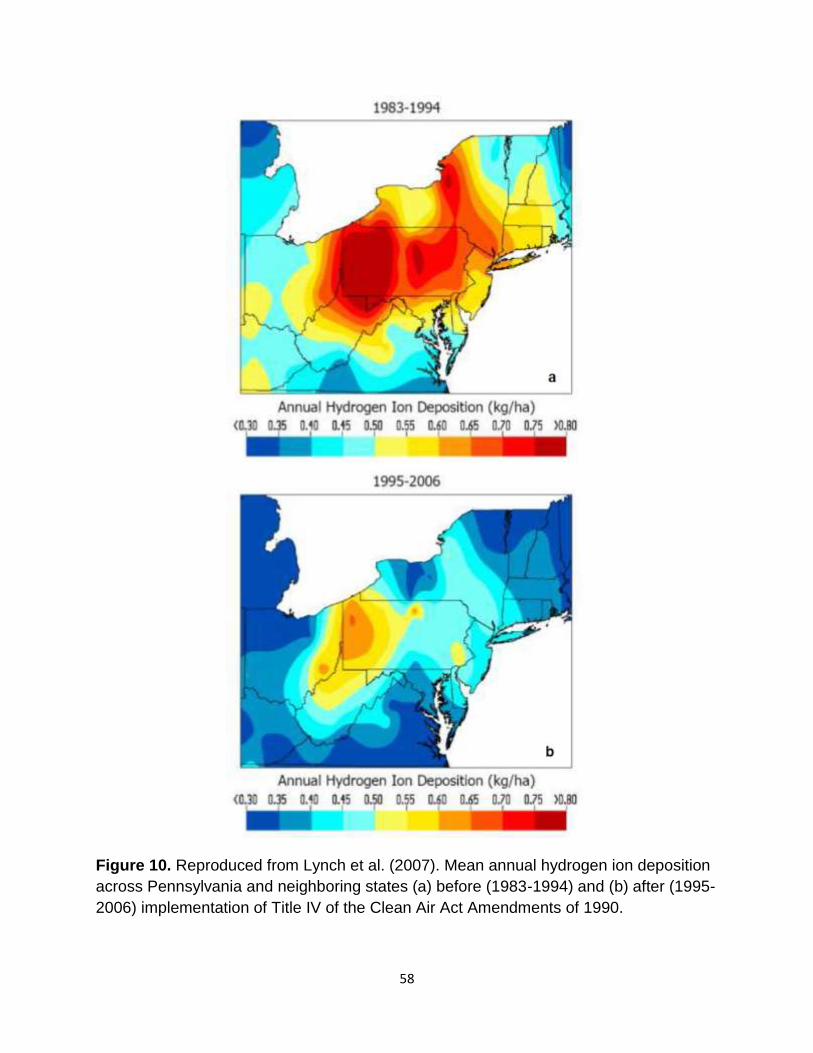
58
Figure 10. Reproduced from Lynch et al. (2007). Mean annual hydrogen ion deposition
across Pennsylvania and neighboring states (a) before (1983-1994) and (b) after (1995-
2006) implementation of Title IV of the Clean Air Act Amendments of 1990.

59
Other sources of concern surrounding the SMB decline include changes in nutrients and
sediment loads over time. During the CADDIS workshops, trend analysis on certain
nutrient parameters was completed, but not for every constituent. Again, this was
primarily due to the limited time and resources available. However, trends in nutrient
and sediment loads from the Susquehanna River are available from USGS and SRBC.
The two regression models used are the traditional 7-parameter multi-coefficient
regression (ESTIMATOR) and the recently developed Weighted Regression on Time,
Discharge, and Season (WRTDS) model. Both regression models are similar except for
an important distinction in how daily mean discharge is normalized. Comparisons
between these two models suggest that WRTDS may be more appropriate for tracking
changes in the Susquehanna River (Moyer et al, 2012). For the lower Susquehanna
River just below the Conowingo Dam, WRTDS results indicate mostly decreasing
nutrient trends with the exception of suspended sediment and total phosphorous (Table
5). Reasons for the increase in suspended sediment and total phosphorous yields from
the lower Susquehanna River (impounded sections) are likely due to the loss of dam
storage capacity, a decrease in sediment settling, and decreased scour threshold of
substrate (Langland 2015, Hirsch 2012).
Unfortunately, published WRTDS flow-normalized trends have not yet been created for
sites within the CADDIS subject areas (e.g., Juniata River at Newport, PA), but some
statistically significant (p < 0.05) ESTIMATOR nutrient trends for the subject sites do
exist. While the ESTIMATOR trends suggest that most nutrient and sediment loads from
two sites within the subject areas are decreasing (Table 6), there are significantly
increasing trends seen with orthophosphate in the Juniata River at Newport and other
sites throughout Pennsylvania (PADEP 2014b). However, these substantial increasing
trends depicted by ESTIMATOR are likely overestimations at least for orthophosphate.
For example, ESTIMATOR trends for the Susquehanna River at Marietta show
approximately 35% increase in orthophosphate, whereas WRTDS trends show
approximately 2% increase for the same period of record (Langland, unpublished data).
Increasing trends in orthophosphate may be due to several factors including increased
pH and temperature (Cravotta, unpublished data), increased runoff of phosphorus-
saturated soils associated with non-point sources (Langland 2015), and a greater
percentage of no-till farming (Langland, unpublished data).

60
Table 5. Nutrient and suspended sediment trends from WRTDS flow-normalized yields
at the Susquehanna River Input Monitoring (RIM) station (just downstream from the
Conowingo reservoir) for the time periods 1985 to 2010 and 2001 to 2010. Table
modified from Moyer et al. (2012).
Parameter
WRTDS flow-normalized yield
1985 to 2010 2001 to 2010
Total Change
(%)
Slope
(%/yr)
Total Change
(%)
Slope
(%/yr)
Total Nitrogen -20.8 -0.8 -5.8 -0.6
Nitrate -14.9 -0.6 -11.5 -1.3
Total Phosphorus 1.9 0.1 18.4 2.0
Orthophosphate -17.1 -0.7 -2.2 -0.2
Suspended Sediment 86.5 3.5 71.1 7.9
Table 6. Approximate percent change in flow-adjusted trends derived from
ESTIMATOR over long term (1992 to 2012) and short term (2003 to 2012) periods. NA
indicates either there was no statistically significant trend or there were not enough data
to run analysis. Table modified from PADEP (2014b).
Station Name Trend
Period
Total
Nitrogen Nitrate
Total
Phosphorous Orthophosphate
Suspended
Sediment
Susquehanna
River at
Sunbury
Long Term -87 -69 -36 NA -86
Short Term -25 NA NA -61 NA
Juniata River at
Newport
Long Term NA NA NA 207 NA
Short Term -22 NA -49 -65 NA
Even more complex changes to the Susquehanna River ecosystem have been the
increased abundance and variability of emerging contaminants. These constituents are
often challenging to track and understand due to the lack of biologically meaningful
endpoints and environmental data. Many of these chemicals are thought to have
endocrine disrupting and immunosuppressant effects on aquatic organisms (McMaster
2001, Pal et al. 2010). Emerging contaminants include pharmaceutical compounds,
hormones, pesticides, flame retardants, and other organic waste water compounds
(Hotchkiss et al. 2008, Diament-Kandarakis et al. 2009). Recent research suggests that
even legacy contaminants such as polychlorinated biphenyls (PCBs) and heavy metals

61
may be having estrogenic and immunosuppression effects (Klaper et al. 2006, Datta et
al. 2009, Orton et al. 2011).
A greater understanding of these chemicals and their effect(s) on SMB is needed.
Mixtures of these chemicals in an aquatic environment can have unpredictable (Sárria
et al. 2011) or even additive (Brian et al. 2005) effects. Exposures at low concentrations
during critical life stages are suggested to have both lasting immune system and
reproductive consequences (Milston et al. 2003, Liney et al. 2005, Vandenberg et al.
2012). Some studies regarding the amount and number of emerging contaminants
found in surface waters of Pennsylvania and their effects have been completed (Loper
et al. 2007, Reif et al. 2012, Blazer et al. 2014). However, emerging contaminants
should be at the forefront of continued research.
Recommendations and future work
The results of the CADDIS process indicate that EDCs and herbicides, as well as
pathogens and parasites are likely causes of the SMB decline, but further research is
needed. One of the most important next steps is to determine whether the SMB have
suppressed immune systems, and identify factors that contribute to
immunosuppression. The possible increase of intermediate hosts and other changes
within the biological community are critical factors that should not be overlooked.
Potential interactions between physicochemical parameters, nutrients, and emerging
contaminants, and their relationship to SMB YOY need to be clarified.
A substantial amount of research on these topics is currently being conducted by
PADEP, PFBC, USGS, USFWS, Penn State University, and SRBC. Several ongoing
studies that were unable to be included in the current effort include egg contaminant
analysis, adult and YOY SMB histopathology, evaluation of immune function in wild and
laboratory raised SMB, population genetics, movement and habitat selection studies,
myxozoan life cycle research, and intense water and sediment collections (V. Blazer,
USGS, written correspondence). All of the studies mentioned above currently have
results pending and could not be included in this CADDIS process. There are also many
studies that have continued to progress during and after the current effort. Those
studies include analyzing the susceptibility of SMB to LMBV, determining cyanotoxin
levels in YOY habitats, and determining if YOY SMB have diets high in thiaminase. A
more extensive list of continuing research may be found in Appendix D.
The CADDIS process provided a chance to consolidate research plans and coordinate
future studies. Questions still left unanswered were discussed during the final workshop.
These discussions provided many future data needs (Appendix E) such as a greater
understanding of conditions within YOY SMB microhabitats, biological endpoints for

62
emerging contaminants, and intermediate host relationships. As future research is
concluded, the results will inform resource management decisions for the SMB fishery.

63
Literature Cited
Abrams, P. 1983. The theory of limiting similarity. Annual Review of Ecology and
Systematics 14: 359-376.
Abraxis. 2014. Microcystins Strip Test. Test kit literature for product number 520023.
Acuna, S., D. Baxa and S. Teh. 2012. Sublethal dietary effects of microcystin producing
Microcystis on threadfin shad, Dorosoma petenense. Toxicon 60:1191-1202
Aday, D.D., J.J. Parkos III, and D.H. Wahl. 2009. Population and community ecology
of Centrachidae. pp. 134-164. In: Centrarchid Fishes: Diversity, Biology, and
conservation. Chichester, United Kingdom, Wiley–Blackwell.
Ahmed, S.A. 2000. The immune system as a potential target for environmental
estrogens endocrine disrupters: a new emerging field. Toxicology 150(1):191-
206.
Alabaster, J. S. and R. Lloyd. 1980. Water quality criteria for freshwater fish. European
Inland Fisheries Advisory Commission Report (FAO). Buttersworth, London-
Boston. 297 pp.
Allan, J.D. and M.M. Castillo. 2007. Stream ecology: structure and function of running
waters. Springer Science & Business Media.
American Fisheries Society (AFS). 1979. A review of the EPA Red Book: quality criteria
for water. R. V. Thurston, R. C. Russo, C.M. Fetterolf, Jr., T.A. Edsall, and Y.M.
Barber, Jr. eds. American Fisheries Society, Water Quality Section. Bethesda,
Maryland. 305 pp.
Anderson, R.O. and A.S. Weithman. 1978. The concept of balance for coolwater fish
populations. pp 371-381. In selected coolwater fishes of North America.
Bethesda Maryland, American Fisheries Society, Special Publication 11.
Anderson, R.O. and R.M. Neumann. 1996. Length, weight, and associated structural
indices. pp 447-482 In Fisheries Techniques, 2nd ed. American Fisheries
Society, Bethesda, Maryland.
Andow, D.A., P.M. Kareiva, S.A. Levin and A. Okubo. 1990. Spread of invading
organisms. Landscape Ecololgy 4:177-188.
Arim, M., S.R. Abades, P.E. Neil, M. Lima and P.A. Marquet. 2006. Spread dynamics of
invasive species. Proceedings of the National Academy of Sciences of the United
States of America 103(2):374-378.
Armour, C.L. 1993. Evaluating temperature regimes for protection of Smallmouth Bass.
United States Department of the lnterior Fish and Wildlife Service Resource
Publication 191, Washington, D.C.
Babica, P., L. Blaha and B. Marsalek. 2006. Exploring the natural role of microcystins: a
review of effects on photoautotropic organisms. Journal of Phycology 42:9-20.
Baker, D., R.L. Beam, E.E. Cavazza and T. Malesky. 2012. The Dents Run AML/AMD ecosystem restoration project. Presented at the 34th National Association of Abandoned Mine Land Conference, Des Moines, Iowa. September 23-26, 2012.

64
Barbour, M.T., B.D. Snyder and J.B.Stribling. 1999. Rapid bioassessment protocols for
use in streams and wadable rivers: Periphyton, Benthic Macroinvertebrates and
fish, 2nd ed. EPA 841-B-99-002. U.S. Environmental Protection Agency; Office of
Water. Washington D.C.
Barbour, M.T., J.B. Stribling and J.R. Karr. 1995. Multimetric approach for establishing biocriteria and measuring biological condition. pp. 63-77. In Biological assessment and criteria: tools for water resource planning and decision making.
CRC Press, Boca Raton, Florida. Bean, T.H. 1892. The fishes of Pennsylvania, with description of the species and notes
on their common names, distribution, habits, reproduction, rate of growth, and mode of capture. E.K. Meyers, Harrisburg, PA,
Bielo, R.J. 1963. A fishery investigation of the Susquehanna River in Pennsylvania.
Master’s thesis, University of Delaware, Newark.
Blazer, V.S. and L.L. Brown. 2005. Special Issue: Early mortality syndrome in Great
Lakes salmonines. Journal of Aquatic Animal Health, 17:1-124.
Blazer, V. S., L.R. Iwanowicz, D.D. Iwanowicz, D.R. Smith, J.A. Young, J.D. Hedrick,
S.W. Foster and S.J. Reeser. 2007. Intersex (testicular oocytes) in Smallmouth
Bass from the Potomac River and selected nearby drainages. Journal of Aquatic
Animal Health 19:242-253.
Blazer, V. S., L.R. Iwanowicz, C.E. Starliper, D.D. Iwanowicz, P. Barbash, J.D.
Hendrick, S.J. Reeser, J.E. Mullican, S.D. Zaugg, M.R. Burkhardt and J. Keble.
2010. Mortality of centrarchid fishes in the Potomac drainage: survey results and
overview of potential contributing factors. Journal of Aquatic Animal Health
22:190-218.
Blazer, V. S., L.R. Iwanowicz, H. Henderson, P.M. Mazik, J.A. Jenkins, D.A. Alvarez
and J.A. Young. 2012. Reproductive endocrine disruption in Smallmouth Bass
(Micropterus dolomieu) in the Potomac River basin: spatial and temporal
comparisons of biological effects. Environmental Monitoring and
Assessment, 184(7):4309-4334.
Blazer, V.S., D.D. Iwanowicz, H.L. Walsh, A.J. Sperry, L.R. Iwanowicz, D.A. Alvarez,
R.A. Brightbill, G. Smith, W.T. Foreman and R. Manning. 2014. Reproductive
health indicators of fishes from Pennsylvania watersheds: association with
chemicals of emerging concern. Environmental Monitoring and Assessment
186(10):6471-91.
Boyd, C.E. 1990. Water quality in ponds for aquaculture. Alabama Agricultural
Experiment Station, Auburn University, Auburn, Alabama. Birmingham Publishing
Co., Birmingham, Alabama. 482 pp.
Brian, J.V., C.A. Harris, M. Scholze, T. Backhaus, P. Booy, M. Lamoree, G. Pojana, N.
Jonkers, T. Runnalls, A. Bonfa, A. Marcomini, and J.P. Sumpter. 2005. Accurate
prediction of the response of freshwater fish to a mixture of estrogenic chemicals.
Environmental Health Perspectives 113:721-728.

65
Broderius, S., R. Drummond, J. Fiandt, and C. Russom. 1985. Toxicity of ammonia to
early life stages of the Smallmouth Bass at four pH values. Environmental
Toxicology and Chemistry 4:87-96.
Brown, J.J., J. Perillo, T.J. Kwak, and R.J. Horowitz. 2005. Implications of Pylodictis
olivaris (Flathead Catfish) introduction into the Delaware and Susquehanna
drainages. Northeastern Naturalist 12:473-484.
Brown, S. B., J. D. Fitzsimons, D.C. Honeyfield, and D. E. Tillitt. 2005. Implications of
Thiamine Deficiency in Great Lakes Salmonines. Journal of Aquatic Animal
Health 17:113-124.
Butler, N., J. C. Carlisle, R. Linville and B. Washburn. 2009. Microcystins: a brief
overview of their toxicity and effects, with special reference to fish, wildlife and
livestock.
Buynak, G.L. and B. Mitchell. 2002. Response of Smallmouth Bass to regulatory and
environmental changes in Elkhorn Creek, Kentucky. North American Journal of
Fisheries Management 22:500-508.
Carrara, C, P, C.J., W.D. Robertson, D.W. Blowes, M.C. Moncur, E. Sverko and S.
Backus. 2008. Fate of pharmaceutical and trace organic compounds in three
septic system plumes, Ontario, Canada. Environmental Science and Technology
42(8):2805-2811.
Casanova-Nakayama, A., M. Wenger, R. Burki, E. Eppler, A. Krasnov and H. Segner.
2011. Endocrine disrupting compounds: can they target the immune system of
fish? Marine Pollution Bulletin 63(5):412-416.
Cavazza, E. and R.L. Beam. 2010. Restoring the Bennett Branch Sinnemahoning Creek, Clearfield and Elk Counties, Pennsylvania. Presented at the 2010 National Meeting of the American Society of Mining and Reclamation, Pittsburg PA. June 5-11 2010. R.I. Barnhisel (Ed.) Published by ASMR, 3134 Montavesta Rd., Lexington, Kentucky.
Chaplin, J.J., J.K. Crawford and R.A. Brightbill. 2009. Water quality monitoring in
response to young-of-the-year Smallmouth Bass (Micropterus dolomieu)
mortality in the Susquehanna River and major tributaries, Pennsylvania: 2008.
U.S. Geological Survey Open-File Report, 2009-1216, 59 p.
Chaplin, J.J. and J. K. Crawford. 2012. Streamflow and water-quality monitoring in
response to young-of-year Smallmouth Bass (Micropterus dolomieu) mortality in
the Susquehanna River and major tributaries, with comparisons to the Delaware
and Allegheny Rivers, Pennsylvania, 2008–10. U.S. Geological Survey Open-File
Report, 2012-1019, 39 p.
Cipriano, R.C. and B. Austin. 2011. Furunculosis and other aeromonad diseases. Pages
424-484 in P.T.K. Woo and D.W. Bruno, editors. Fish Diseases and Disorders,
Volume 3: Viral, Bacterial, and Fungal Infections, 2nd edition. CAB International,
New York.
66
Clady, M.D. 1977. Early survival and recruitment of Smallmouth Bass in northern
Michigan. Journal of Wildlife Management 39:194-200.
Clavero, M. and E. Garcia-Berthou. 2005. Invasive species are a leading cause of animal extinctions. Trends in Ecology and Evolution 20(3):110.
Cravotta, C.A. III, J.J. Chaplin, B. Vinci, G. Smith, J.A. Arway, C.H. Gammons and P.A.
Raymond. 2013. Water temperature, streamflow, and dissolved gas dynamics
relating to ecology, distress, and disease of Smallmouth Bass in Susquehanna
River. Susquehanna River Basin Commission Water Science Forum. Presented
on October 7-8, 2013.
D’Antonio, C., L.A. Meyerson and J. Denslow. 2001. Exotic species and conservation.
pp. 59-80. In Conservation Biology: Research Priorities for the Next Decade.
Island Press, Washington, DC.
Davies, S.P. and S.K. Jackson. 2006. The biological condition gradient: a descriptive model for interpreting change in aquatic ecosystems. Ecological Applications 16(4):1251-1266.
Daughton, C.G., and T.A. Ternes. 1999. Pharmaceuticals and personal care products in
the environment: agents of subtle change? Environmental Health Perspectives
107, supplement 6:907-938.
Datta, S., D. Ghosh, D.R. Saha, S. Bhattacharya and S. Mazumder. 2009. Chronic
exposure to low concentrations of arsenic in immunotoxic to fish: role of head
kidney macrophages as biomarkers of arsenic toxicity to (Clarias batrachus.)
Aquatic Toxicology 92:86-94.
Diamanti-Kandarakis, E., J.P. Bourguignon, L.C. Giudice, R. Hauser, G.S. Prins, A.M.
Soto, R.T. Zoeller and A.C. Gore. 2009. Endocrine-disrupting chemicals: an
endocrine society scientific statement. Endocrine Reviews 30:293-342.
Doudoroff, P., and M. Katz. 1950. Critical review of literature on the toxicity of industrial
wastes and their components to fish. I. alkalies, acids, and inorganic gases.
Sewage Ind. Wastes 22:1432-1458.
Doudoroff, P. and D. L. Shumway. 1970. Dissolved oxygen requirements of freshwater
fishes. Food and Agriculture Organization of the United Nations, Fisheries
Technical Paper 86.
EIFAC (European Inland Fisheries Advisory Commission). 1969. Water quality criteria
for European freshwater fish: Report on extreme pH values and inland fisheries.
Prepared by EIFAC Working Party on Water Quality Criteria for European
Freshwater Fish. Water Research 3(8):593-611.
Fatima, M., S. N. M. Mandiki, J. Douxfils, F. Silvestre, P. Coppe and P. Kestemont.
2007. Combined effects of herbicides on biomarkers reflecting immune–
endocrine interactions in goldfish: immune and antioxidant effects. Aquatic
Toxicology 81(2):159-167.

67
Fenton, J. I., N. G. Hord, S. Ghosh, and E. A. Gurzell. 2013. Immunomodulation by
dietary long chain omega-3 fatty acids and the potential for adverse health
outcomes. Prostaglandins Leukotrines Essential Fatty Acids 89(6):379-90.
Funk, J.L. and G.G. Fleener. 1974. The fishery of a Missouri Ozark stream, Big Piney
River, and the effects of stocking fingerling Smallmouth Bass. Transactions of the
American Fisheries Society 103:757-771.
Grant, E.C., D.P. Philipp, K.R. Inendino and T.L. Goldberg. 2003. Effects of temperature
on the susceptibility of Largemouth Bass to Largemouth Bass Virus. Journal of
Aquatic Animal Health 15(3):215-220.
Gurevitch, J., and D.K. Padilla. 2004. Are invasive species a major cause of
extinctions? Trends in Ecology and Evolution 19:470-474.
Halling-Sorensen, B., S. Nors Nielsen, P.F. Lansky, F. Ingerslev, H.C. Holten Lutzhoft
and S.E. Jorgensen. 1998. Occurrence, fate, and effects of pharmaceutical
substances in the environment—A review: Chemosphere 36(2):357-393.
Hanson, T.R., S. Shaik, K.H. Coble, S. Edwards and J.C. Miller. 2008. Identifying risk
factors affecting weather- and disease-related losses in the U.S. Farm-Raised
Catfish Industry. Agricultural and Resource Economics Review 37(1): 27-40.
Hill, C., and S. Nellbring. 1999. Reproductive disturbances in Baltic fish. Ambio Special
Publication 28:2-106.
Hinck, J.E., V.S. Blazer, C.J. Schmitt, D.M. Papoulias, D.E. Tillitt. 2009. Widespread
occurrence of intersex in black basses (Micropterus spp.) from U.S. rivers, 1995-
2004. Aquatic Toxicology 95:60-70.
Hirsch, R.M. 2012. Flux of nitrogen, phosphorus, and suspended sediment from the
Susquehanna River Basin to the Chesapeake Bay during Tropical Storm Lee,
September 2011, as an indicator of the effects of reservoir sedimentation on
water quality. Scientific Investigations Report 2012-5185. U.S. Department of the
Interior, U.S. Geological Survey, Reston, Virginia.
Holzer, A.S., H. Pecková, S. Patra, N.P. Brennan, C. Yanes-Roca, and K.L. Main. 2013.
Severe glomerular disease in juvenile grey snapper Lutjanus griseus L. in the
Gulf of Mexico caused by the myxozoan Sphaerospora motemarini n. sp..
International Journal for Parasitology: Parasites and Wildlife 2:124-130
Honeyfield, D. C., J. P. Hinterkopf, J. D. Fitzsimons, D. E. Tillitt, J. L. Zajicek and S. B.
Brown. 2005. Development of Thiamine deficiencies and Early Mortality
Syndrome in Lake Trout by feeding experimental and feral fish diets containing
Thiaminase. Journal of Aquatic Animal Health 17:4-12.
Honeyfield, D.C., J.P. Ross, D.A. Carbonneau, S.P. Terrell, A.R. Woodward, T.R.
Schoeb, H.F. Perceval, and J.P. Hinterkopf. 2008. Pathology, physiologic
parameters, tissue contaminants, and tissue thiamine in morbid and healthy
central Florida adult American alligators (Alligator mississippiensis). Journal of
Wildlife Diseases 44:280-294.

68
Horning, W.B. II and R.E. Pearson. 1973. Growth temperature requirements and lower
lethal temperatures for juvenile Smallmouth Bass (Micropterus dolomieu).
Journal of the Fisheries Research Board of Canada 30:1226-1230.
Hotchkiss, A.K., C.V. Rider, C.R. Blystone, V.S. Wilson, P.C. Hartig, G.T. Ankley, P.M.
Foster, C.L. Gray and L.E. Gray. 2008. Fifteen years after Wingspread –
environmental endocrine disrupters and human and wildlife health: where we are
today and where we need to go. Toxicological Sciences 105:235:259.
IARC (International Agency for Research on Cancer). 2010. Monographs on the
evaluation of carcinogenic risks to humans. Ingested Nitrate and Nitrite, and
Cyanobacterial Peptide Toxins 94.
Ip, Y.K., S.F. Chew, and D.J. Randall. 2001. Ammonia toxicity, tolerance, and
excretion. Fish Physiology 20:109-148.
Jorgensen, S.E., and B. Halling-Sorensen. 2000. Drugs in the environment.
Chemosphere 40(7):691-699.
Kidd, K. A., P.J. Blanchfield, K.H. Mills, V.P. Palace, R.E. Evans, J.M. Lazorchak and
R.W. Flick. 2007. Collapse of a fish population after exposure to a synthetic
estrogen. Proceedings of the National Academy of Sciences 104(21): 8897-8901.
King C. 1984. Immigrant Killers. Oxford University Press, Oxford.
Klaper, R., C.B. Rees, P. Drevnick, D. Weber, M. Sandheinrich, and M.J. Carvan. 2006.
Gene expression changes related to endocrine function and decline in
reproduction in fathead minnow (Pimephales promelas) after dietary
methymercury exposure. Environmental Health Perspectives 114:1337-1343.
Kloas W, R. Urbatzka, R. Opitz, S. Wurtz, T. Behrends, B. Hermelink, F. Hofmann, O.
Jagnytsch, H. Kroupova, C. Lorenz, N. Neumann, C. Pietsch, A. Trubiroha, C.
Van Ballegooy, C. Wiedemann and I. Lutz. 2009. Endocrine disruption in aquatic
vertebrates. Annals of the New York Academy of Sciences 1163:187-200.
Klurfeld, D. M. 2008. Dietary fats, eicosanoids and immune system. pp 539-549. In
Food Lipids; Chemistry, Nutrition and Biotechnology. Boca Raton, CRC Press.
Koel, T.M., D.L. Mahony, K.L. Kinnan, C. Rasmussen, C.J. Hudson, S. Murcia, and B.L.
Kerans. 2006. Myxobolus cerebralis in Native Cutthroat Trout of the Yellowstone
Lake Ecosystem. Journal of Aquatic Animal Health 18:157-175.
Kolander, T.D., D.W. Willis and B.R. Murphy. 1993. Proposed revision of the standard
weight (Ws) equation for Smallmouth Bass. North American Journal of Fisheries
Management 13:398-400.
Kolpin, D.W., E.T. Furlong, M.T. Meyer, E.M. Thurman, S.D. Zaugg, L.B. Barber and
H.T. Buxton. 2002. Pharmaceuticals, hormones, and other organic wastewater
contaminants in U.S. streams, 1999-2000-A national reconnaissance.
Environmental Science and Technology 36:1202-1211.
Kreutz, L. C., L.J.G. Barcellos, A. Marteninghe, E.D. Dos Santos and R. Zanatta. 2010.
Exposure to sublethal concentration of Glyphosate or Atrazine-based herbicides

69
alters the phagocytic function and increases the susceptibility of silver catfish
fingerlings (Rhamdia quelen) to Aeromonas hydrophila challenge. Fish &
shellfish immunology 29(4):694-697.
Landsman, S. J., A. J. Gingerich, D. P. Philipp and C. D. Suski. 2011. The effects of
temperature change on the hatching success and larval survival of Largemouth
Bass (Micropterus salmoides) and Smallmouth Bass (Micropterus dolomieu).
Journal of Fish Biology 78:1200-1212.
Langland, M.J. 2015. Sediment transport and capacity change in three reservoirs,
Lower Susquehanna River Basin, Pennsylvania and Maryland, 1900–2012: U.S.
Geological Survey Open-File Report 2014-1235 18p
Larkin, P.A. 1956. Interspecific competition and population control in freshwater fish.
Journal of the Fisheries Board of Canada, 13(3):327-342.
Leao, P.N., M. Vasconcelos, S.D. Teresa, and, M. Vitor. 2009. Allelopathy in freshwater
cyanobacteria. Critical Reviews in Microbiology 35:271-282.
Liney, K.E., S. Jobling, J.A. Shears, R. Simpson and C.R. Tyler. 2005. Assessing the
sensitivity of different life stages for sexual disruption in roach (Rutilus rutilus)
exposed to effluents from wastewater treatment works. Environmental Health
Perspectives 114:81-89.
Loper, C.A., J.K. Crawford, K.L. Otto, R.L. Manning, M.T. Meyer, and E.T. Furlong.
2007. Concentrations of selected pharmaceuticals and antibiotics in south-central
Pennsylvania waters, March through September 2006. U.S. Geological Survey
Data Services 300:101
Lorantas, R.M., and D.P. Kristine. 2004. Annual monitoring of young-of-year abundance
of Smallmouth Bass in rivers in Pennsylvania; relationships between abundance,
river characteristics, and spring fishing. Pennsylvania Fish and Boat
Commission, Bureau of Fisheries, Fisheries Management Division, Bellefonte,
Pennsylvania.
Lorantas, R.M., T. Wagner, D. Arnold, J. Detar, M. Kaufmann, K. Kuhn, R. Lorson, R.
Wnuk and A. Woomer. 2012. Smallmouth Bass electrofishing catch rate in large
Pennsylvania rivers and examination of Smallmouth Bass recruitment indices.
Pennsylvania Fish and Boat Commission, Bureau of Fisheries, Fisheries
Management Division, Bellefonte, Pennsylvania.
Lukas, J.A., and D.J. Orth. 1995. Factors affecting nesting success of Smallmouth Bass
in a regulated Virginia stream. Transactions of the American Fisheries Society
124:726-735.
Lynch, J.A., K.S. Horner, J.W. Grimm, E. Boyer, and H. Carrick. 2007. Reductions in Acidic Wet Deposition in Pennsylvania Following Implementation of the Clean Air Act Amendments of 1990: 1995-2006. Penn State Institutes of Energy and the Environment – The Pennsylvania State University. University Park, Pennsylvania.

70
MacArthur, R.H. and R. Levins. 1967. The limiting similarity, convergence, and
divergence of coexisting species. American Naturalist 101:377-385.
Maclean, J.A., B. J. Shuter, H. A. Regier, and J. C. MacLeod. 1981. Temperature and
yearclass strength of Smallmouth Bass. Proceedings of the symposium on early
life history of fish. International Council for the Exploration of the Sea. Denmark.
178:30-40.
Maloney, K.O. and D.R. Shull. 2015. Sediment and discharge yield within a minimally
disturbed headwater watershed in North Central Pennsylvania, USA, with an
emphasis on Superstorm Sandy. Water and Environment Journal 29(3):402-411.
Martin, J.C., and V.M. Vasconcelos. 2009. Microcystin dynamics in aquatic organisms.
Journal of Toxicology and Environmental Health, Part B: Critical Reviews 12:65-
82.
McDonald, G., J. Fitzsimons and D.C. Honeyfield. 1998. Early life stage mortality
syndrome in fishes of the Great Lakes and Baltic Sea. Symposium 21. American
Fisheries Society, Bethesda, Maryland.
McKee, J.E. and H.W. Wolf. 1963. Water quality criteria (second edition). Pub. No. 3-A.
State Water Quality Control Board, Sacramento, California.
McMaster, M.E. 2001. A review of the evidence for endocrine disruption in Canadian
aquatic ecosystems. Water Quality Research Journal of Canada 36:215-231.
Milla, S., S. Depiereux, and P. Kestemont, 2011. The effects of estrogenic and
androgenic endocrine disruptors on the immune system of fish: a review.
Ecotoxicology 20(2):305-319.
Milner, J.W. 1874. The progress of fish culture in the United States. pp 523-558. In
United States Commission of Fish and Fisheries report of the commissioner for
1872 and 1873. Government Printing Office, Washington, D.C.
Milston, R.H., M.S. Fitzpatrick, A.T. Vella, S. Clements, D. Gunderson, G. Feist, T.L.
Crippen, J.L. Leong and C.B. Schreck. 2003. Short-term exposure of Chinook
salmon (Oncoryhnchus tshawytscha) to o,p’-DDE or DMSO during early life-
stage causes long-term humoral immunosuppression. Environmental Health
Perspectives 111:1601-1607.
Moyer, D.L., R.M. Hirsch, and K.E. Hyer. 2012. Comparison of two regression-based
approaches for determining nutrient and sediment fluxes and trends in the
Chesapeake Bay watershed: U.S. Geological Survey Scientific Investigations
Report 2012-5244:118.
Mount, D.I. 1964. Development of a system for controlling dissolved-oxygen content of
water.
Murphy, B.R., and D.W. Willis. 1991. Application of relative weight (Wr) to western
warmwater fisheries. pp 243-248. In Warmwater fisheries symposium I. U.S.
Forest Service General Technical Report. Fort Collins, CO.
Najjar R.G., H.A. Walker, P.J. Anderson, E.J. Barron, R.J. Bord, J.R. Gibson, V.S.

71
Kennedy, C.G. Knight, J.P. Megonigal, R.E. O’Connor, C.D. Polsky, N.P. Psuty, B.A. Richards, L.G. Sorenson, E.M. Steele and R.S. Swanson. 2000. The potential impacts of climate change on the mid-Atlantic coastal region. Climate Research 14:219-233.
National Research Council (NRC). 2011. Nutrient requirements of fish and shrimp.
National Academies Press, Washington, D.C.
Nehring, R.B. and P.G. Walker. 1996. Whirling disease in the wild: the new reality in the Intermountain West. Fisheries 21(6):28-30.
Norton, S.B., S.M. Cormier and G. W. Suter II. 2014. Ecological Causal Assessment.
CRC Press, Boca Raton, Florida
O’Neil, J.M., T.W. Davis, M.A. Burford and C.J. Gobler. 2012. The rise of harmful
cyanobacteria blooms: the potential roles of eutrophication and climate change.
Harmful Algae 14:313-334.
Orton, F., E. Rosivatz, M. Scholze and A Kortenkamp. 2011. Widely used pesticides
with previously unknown endocrine activity revealed as in vitro anti-androgens.
Environmental Health Perspectives 119:794-800.
Ottinger, C. A., D. C. Honeyfield, C. L. Densmore and L. R. Iwanowicz. 2012. Impact of
thiamine deficiency on T-cell dependent and T-cell independent antibody
production in post-yearling Lake Trout (Salvelinus namaycush). Journal of
Aquatic Animal Health 24:258-273.
Ottinger, C. A., D. C. Honeyfield, C.L. Densmore and L.R. Iwanowicz. 2014. In vitro
immune functions in thiamine-replete and -depleted Lake Trout (Salvelinus
namaycush). Fish & Shellfish Immunology 38:211-220.
PADEP. 2014a. 2012-13 Susquehanna River Sampling and assessment report. (Available online at http://www.portal.state.pa.us/portal/server.pt/community/water_quality_standards /10556/susquehanna_river_study_updates/1449797) PADEP. 2014b. 2014 Pennsylvania Integrated Water Quality Monitoring and Assessment Report. (Available online at http://www.portal.state.pa.us/portal/server.pt/community/water_quality_standards /10556/integrated_water_quality_report_-_2014/1702856) Pal, A., K. Gin. A. Lin and M. Reinhard. 2010. Impacts of emerging organic
contaminants on freshwater resources: review of recent occurrences, sources,
fate and effects. Science of the Total Environment 408:6062-6069.
Palti Y. 2011. Toll-like receptors in bony fish: from genomics to function. Developmental
& Comparative Immunology 35:1263-1272.
Pavagadhi, S. and R. Balasuramanian. 2013. Toxicological evaluation of microcystins in
aquatic fish species: Current knowledge and future directions. Aquatic Toxicology
142:1-16.
Pawlik-Skowronska, B., R. Kalinowska and T. Skowronski. 2013. Cyanotoxin diversity
and food web bioaccumulation in a reservoir with decreasing phosphorus
concentrations and perennial cyanobacterial blooms. Harmful Algae 28:118-125.

72
Persson, L. 1988. Asymetries in competitive and predatory interactions in fish populations. pp. 203-18. In Size structured populations: ecology and evolution.
Springer-Verlag. New York
Peterson, J.T., T.J. Kwak. 1999. Modeling the effects of land use and climate change on
riverine Smallmouth Bass. Ecological Applications 9(4):1391-1404.
Phillips, P., and A. Chalmers. 2009. Wastewater effluent, combined sewer overflows,
and other sources of organic compounds to Lake Champlain: Journal of the
American Water Resources Association (JAWRA) 45(1):45-47.
Phillips, P.J., S.G. Smith, D.W. Kolpin, S.D. Zaugg, H.T. Buxton, E.T. Furlong, K.
Esposito and B. Stinson. 2010. Pharmaceutical formulation facilities as sources
of opioids and other pharmaceuticals to wastewater treatment plant effluents.
Environmental Science and Technology 44:4910–4916.
Plumb, J.A., J.M. Grizzle, H.E. Young, A.D. Noyes and S. Lamprecht. 1996. An
iridovirus isolated from wild largemouth bass. Journal of Aquatic Animal Health
8(4): 265-270.
Poff, N.L., J.D. Allan, M.B. Bain, J.R. Karr, K.L. Prestegaard, B.D. Richter, R.E. Sparks and J.C. Stromberg. 1997. The natural flow regime: a paradigm for river conservation and restoration. Bioscience 47(11):769-784. Polis, G.A. 1981. The evolution and dynamics of intraspecific predation. Annual Review
of Ecology and Systematics 12:225-251. Pope, K.L., and C.G. Kruse. 2007. Condition. pp 423-472. In analysis and interpretation
of freshwater fisheries data. Bethesda, Maryland, American Fisheries Society.
Pope, K.L., S.E. Lochman, and M.K. Young. 2010. Methods for assessing fish
populations. pp 325-351 In Inland fisheries management in North America, 3rd
ed., American Fisheries Society, Bethesda, Maryland.
Purcell, M.K., KD Smith, L. Hood, J.R. Winton, and J.C. Roach. 2006. Conservation of
Toll-like receptor signaling pathways in teleost fish. Comparative Biochemistry
and Physiology - Part D: Genomics and Proteomics 1:77-88.
Quiblier, C., S. Wood, I. Echenique-Subiabre, M. Heath, A. Villeneuve and Jean-
François. 2013. A review of current knowledge on toxic benthic freshwater
cyanobacteria – Ecology, toxin production and risk management. Water
Research 47:5464-5479.
Recsetar, M.S., M.P. Zeigler, D.L. Ward, S.A. Bonar, and C.A. Caldwell. 2012.
Relationship between fish size and upper thermal tolerance. Transactions of the
American Fisheries Society 141:1433-1438.
Reif, A.G., J.K. Crawford, C.A. Loper, A. Proctor, R. Manning and R. Titler. 2012.
Occurrence of pharmaceuticals, hormones, and organic wastewater compounds
in Pennsylvania water, 2006-09. U.S. Geological Survey Scientific Investigations
Report. 2012-5106, 99p.
Reynolds, C.R., and C.J. O’Bara. 1991. Reproductive ecology and spawning habitat of
Smallmouth Bass in two small streams of the Tennessee River system. pp 61-65.
73
In Proceedings of the First International Smallmouth Bass Symposium.
Mississippi Agricultural and Forestry Experiment Station, Mississippi State
University, Starkville, Mississippi.
Rieger A.M. and D.R. Barreda. 2011. Antimicrobial mechanisms of fish leukocytes.
Developmental & Comparative Immunology 35:1238-1245.
Rogers, J. A., L. Metz and V.W. Yong. 2013. Review: Endocrine disrupting chemicals
and immune responses: a focus on bisphenol-A and its potential mechanisms.
Molecular immunology 53(4):421-430.
Rohr, J. R. and K.A. McCoy. 2010. A qualitative meta-analysis reveals consistent
effects of atrazine on freshwater fish and amphibians. Environmental Health
Perspectives 118(1): 20-32.
Sárria, M.P., M.M. Santos, M.A. Reis-Henriques, N.M. Vieira and N.M. Monteiro. 2011.
The unpredictable effects of mixtures of androgenic and estrogenic chemicals on
fish early life. Environment International 37:418-424.
Sitjà-Bobadilla, A. 2008. Fish immune response to Myxozoan parasites. Parasite
15:420-425.
Sivonen, K. and G. Jones, G., 1999. Toxic cyanobacterial toxins. Pages 41-111 in:
Chorus, I. and J. Bartram. (Eds.), Toxic Cyanobacteria in Water: A Guide to Their
Public Health Consequences, Monitoring and Management. E & FN Spon,
London.
Schäperclaus, W. 1991. Fish diseases. New Delhi, Amerind Publishing Co. Pvt. Ltd 2.
Scholz, S. and N. Klüver. 2009. Effects of endocrine disrupters on sexual, gonadal
development in fish. Sexual Development 3(2-3):136-151.
Sellin, M.K., D.D. Snow, D.L. Akerly and A.S. Kolok. 2009. Estrogenic compounds
downstream from three small cities in eastern Nebraska: occurrence and
biological effect. Journal of the American Water Resources Association 45(1):14-
21.
Shelley, L. K., P.S Ross, K.M. Miller, K.H. Kaukinen and C.J. Kennedy. 2012. Toxicity of
atrazine and nonylphenol in juvenile rainbow trout (Oncorhynchus mykiss):
effects on general health, disease susceptibility and gene expression. Aquatic
Toxicology 124:217-226.
Shuter, B. J., J. A. MacLean, F. J. Fry and H. A. Regier. 1980. Stochastic simulation of
temperature effects of first year survival of Smallmouth Bass. Transactions of the
American Fisheries Society 109:1-34.
Siefert, R.E., A.R. Carlson, and L.J. Herman. 1974. Effects of reduced oxygen
concentrations on the early life stages of Mountain Whitefish, Smallmouth Bass,
and White Bass. The Progressive Fish Culturist 36(4):186-190.
Sih, A., P. Crowley, M. McPeck, J. Petraaka and K. Strohmeier. 1985. Predation,
competition, and prey communities: a review of field experiments. Annual
Review of Ecology and Systematics 16:269-311.

74
Smith, S.M., J.S. Odenkirk and S.J. Reeser. 2005. Smallmouth Bass recruitment
variability and its relation to stream discharge in three Virginia rivers. North
American Journal of Fisheries management 25:1112-1121.
Smith, G.D., V.S. Blazer, H.L. Walsh, L.R. Iwanowicz, C. Strarliper and A.J. Sperry.
2015. The effects of disease-related mortality of young-of-year Smallmouth Bass
on population characteristics in the Susquehanna River Basin, Pennsylvania and
potential implications to conservation of Black Bass diversity. American Fisheries
Society Symposium 82:319-332.
Smucker, B, J. Rosenberger, and D. Shumway. 2010. Susquehanna/Juniata River
Creel Survey 2007. The Pennsylvania State University Statistical Consulting
Center; Final Report prepared for R. Lorantas, Pennsylvania Fish and Boat
Commission. Bellefonte. Pennsylvania. USA. 416 p.
Snyder, S.A., R.A. Trenholm, E.M. Snyder, G.M. Bruce, R.C. Pleus and J.D.C.
Hemming. 2009, Toxicological relevance of EDCs and pharmaceuticals in
drinking water: London, IWA Publishing, AWWA Research Foundation Report
91238, 146 p.
Spoor, W.A. 1984. Oxygen requirements of larvae of smallmouth bass, Micropterus
dolomieui (Lacépède). Journal of Fish Biology 25:587-592.
Starliper, C.E., and W.B. Schill. 2011. Flavobacterial diseases: columnaris disease,
coldwater disease and bacterial gill disease. Pages 606–631 in P.T.K. Woo and
D.W. Bruno, editors. Fish Diseases and Disorders, Volume 3: Viral, Bacterial,
and Fungal Infections, 2nd edition. CAB International, New York.
Tillitt, D.E., J.L. Zajicek, S.B. Brown, L.R. Brown, J.D. Fitzsimons, D.C. Honeyfield, M.E.
Holey and G.M. Wright. 2005. Thiamine and Thiaminase status in forage fish of
Salmonines from Lake Michigan. Journal of Aquatic Animal Health 17:13-25.
Turchin, P. 2003. Complex population dynamics: A theoretical/empirical synthesis.
Princeton University Press, Princeton, NJ.
U.S. EPA (Environmental Protection Agency). 2010. Causal Analysis/Diagnosis
Decision Information System (CADDIS). Office of Research and Development,
Washington, DC. Available at www.epa.gov/caddis Updated September 23,
2010.
U.S. EPA (Environmental Protection Agency). 2014. Cyanobacteria and Cyanotoxins:
Information for Drinking Water Systems. Office of Water.
Vandenberg, L.N., T. Colburn, T.B. Hayes, J.J. Heindel, D.R. Jacobs Jr., D.H. Lee, T.
Shiola, A.M. Soto, F.S. vomSaal, W.V. Welshons, R.T. Zoeller and J.P Myers.
2012. Hormones and endocrine-disrupting chemicals: low-dose effects and
nonmonotonic dose responses. Endocrine Reviews 33:378-455.
Walsh, H.L., V.S. Blazer, L.R. Iwanowicz and G. Smith. 2012. A redescription of
Myxobolus inornatus from young-of-the-year Smallmouth Bass (Micropterus
dolomieu). Journal of Parasitology 98:1236-1242.
75
Wege, G.J. and R.O. Anderson. 1978. Relative weight (Wr): a new index of condition for
Largemouth Bass. pp 79-91. In New approaches to the management of small
impoundments. American Fisheries Society, North Central Division, Special
Publication 5, Bethesda, Maryland.
Weiss-Glanz, L.S. and J.G. Stanley. 1984. Population structure indices of Largemouth
bass and Smallmouth Bass determined from angler catches. North American
Journal of Fisheries Management 4:89-98.
Wiebe, A.H. 1931. Note on the exposure of several species of pond fishes to sudden
changes in pH. Transactions of the American Microscopical Society 50:380-393.
Wilcove, D.S., D. Rothstein, J. Dubow, A. Phillips and E. Losos. 1998. Quantifying
threats to imperiled species in the United States. Bioscience 48:607-615.
Winfield, I., and J.S. Nelson. 2012. Cyprinid fishes: systematics, biology and
exploitation. Springer Science & Business Media 3:538-540.
Witschi, W.A. and C.D. Ziebell. 1979. Evaluation of pH shock on hatchery-reared
rainbow trout. The Progressive Fish-Culturist 41:3-5.
Wood, S.A., M.W. Heath, J. Kukajek and K.G. Ryan. 2010. Fine-scale spatial variability
in anatoxin-a and homoanatoxin-a concentrations in benthic cyanobacterial mats:
implication for monitoring and management. Journal of Applied Microbiology
109:2011-2018.
Wood, S.A., P.T., Holland and L. MacKenzie. 2011. Development of solid phase
adsorption toxin tracking (SPATT) for monitoring anatoxin-a and homoanatoxin-a
in river water. Chemosphere 82:888-894.
Wrenn, W.B. 1980. Effects of elevated temperature on growth and survival of
Smallmouth Bass. Transactions of the American Fisheries Society 109:617-625.
Ying, L.C., and J.E. Rutledge. 1975. Some biochemical properties of the
hepatopancreatic tissue from red crayfish (Procambarus clarkii). Freshwater
Crayfish 2:173.
Zweifel, R.D., R.S. Hayward and C.F. Rabeni. 1999. Bioenergetics insight into black
bass distribution shifts in Ozark border region streams. North American Journal
of Fisheries Management 19:192-197.

76
Appendix A: Conceptual Models
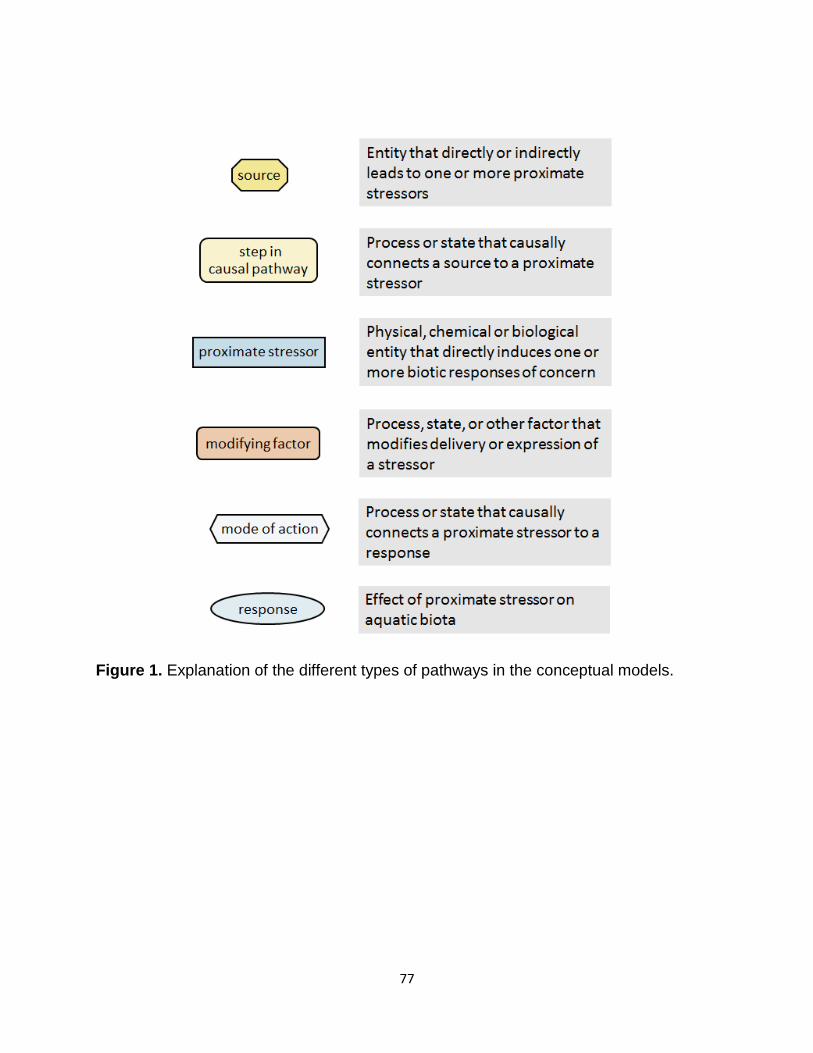
77
Figure 1. Explanation of the different types of pathways in the conceptual models.

78
Figure 2. Flow and competition conceptual model for candidate causes 1-3 (Increased
flow, intraspecific competition and interspecific competition)

79
Figure 3. Abiotic conceptual model for candidate causes 7-10 (increased temperature,
increased pH and/or increase pH variability, decreased dissolved oxygen and/or
increased dissolved oxygen variability and increased ammonia toxicity).

80
Figure 4. Food quality with pathogens and parasites conceptual model for candidate
causes 4, 5 and 14 (decreased food quality, decreased egg quality and increased
pathogens and parasites)

81
Figure 5. Algal and habitat conceptual model for candidate causes 6 and 11 (decreased
late summer YOY habitat and increased algae and cyanobacterial toxins).

82
Figure 6. Toxic substances conceptual model for candidate causes 12 and 13
(increased toxic chemicals and increased endocrine disrupting compounds).

83
Appendix B: Analysis Worksheets

84
Appendix C: Candidate Cause Scoring Tables

85
Table 1. Candidate Cause scores based on type of evidence. * indicates that more data are needed to make a confident decision.
Type of Evidence
Candidate Cause
1 2 3 4 5 6 7 8 9 10 11 12 13 14
High Flows
Intra. Competition
Inter. Competition
YOY food quality
Egg quality
YOY habitat
Temp pH DO NH3 Algal &
bacterial toxins
Toxic chemicals
EDCs Pathogens
& Parasites
Spatial Co-occurrence -
0* - 0
+ - + - -
Microcystins: - Others: 0
+ +*
LMBV: 0 Myxozoan: 0 Other: 0
Temporal Co-
occurrence -
0
- - + 0 0
SR from Case - -
SR from Elsewhere
Mortality: Thiamine: 0, Fatty Acids: -- Disease: 0*
Mortality: 0 Disease: 0
Mortality: -- Disease: -
Mortality: - Disease: 0
Mortality: --- Disease: ---
Mortality: Pest/PCBs: NE, Metals: -, Triazines: NE Disease: NE
Evidence of Exposure
Microcystin: 0, Other: NE +
LMBV: +, Myxozoan: +
Evidence of Mechanism --
+ +
Causal Pathway
+ + + + +

86
Table 2. Final large group consistency scores based off results from evidence scoring (Table 1). * indicates that more data are needed
to make a confident decision.
Candidate Cause
1 2 3 4 5 6 7 8 9 10 11 12 13 14
High Flows
Intrasp. Competition
Intersp. Competition
YOY food quality
Egg quality
YOY habitat
Temp pH DO NH3 Algal &
bacterial toxins
Toxic chemicals
EDCs Pathogens
& Parasites
Large Group Consistency Final Scores
-- -- 0*
Thiaminase: +, Fatty Acids: -
+ - - -
Mortality: - Susceptibility: +
---
Microcystin: -, Other: +
Pest/PCBs: -, Metals mortality: --, immune suppression: -, Triazines: +
+
LMBV: ++, Myxozoan: ++, Other: ++

87
Appendix D: Ongoing Studies in 2015

88
Geoff Smith (PFBC)
Investigate the role that parasites are playing. Determine whether they are
causing the damage (inflammation) observed in the SMB cells or whether it’s
related to bacteria. This will be a follow-up to Vicki Blazer’s work (the in-situ
hybridization they were showing).
Largemouth Bass Virus Study to determine the susceptibility of SMB to the
LMBV.
YOY and adult microcystin concentration (liver tissue).
YOY habitat and Anatoxin-a.
Population genetics study in SMB
Tim Wertz (PADEP)
YOY Thiaminase: PADEP along with Dale Honeyfield (USGS) will be collecting
YOY to see if the Thiaminase circuit is complete. Consider thiaminase activity in
YOY as evidence that they are feeding on a thiaminase-positive prey.
Egg Thiamine
Investigate additional fish communities and get samples for thiaminase activity
among all fish to understand how competition depresses the amount of available
thiaminase activity within the system.
Habitat partitioning of fish communities – seasonal responses in different species
for functional group that partition habitat resources
Dale Honeyfield (USGS)
Immune function study – SMB in the laboratory. It will include thiamine replete
and thiamine deficient SMB and then examine immune function in terms of
macrophages and bacteria
Josh Lookenbill (PADEP)
2015 Sample Collections focused on YOY habitat
o Water: Herbicides/pesticides, hormones, EDCs, and passive sampler
deployments
o Sediment samples
o Analyze microcystin in periphyton
o Study algal communities
Jeff Butt (PADEP)
Anatoxin-a studies with PFBC
Seasonal changes in the algal cyanobacteria community

89
Resolve algal taxonomy issues between laboratories

90
Appendix E: Future Research Needs

91
Egg Thiamine – Out of basin studies and places with large populations of mimic
shiners
YOY Habitat: water quality data collection to compare these habitats to other
areas with incidence of disease
Effects of fallfish on the fish community
More EDC work. Target new areas.
Diet studies – YOY SMB and others
Literature reviews for algal toxin work
Telemetry studies to document fish movements
EDC testing on YOY
Parasite/Host relationships
Precisely characterize SMB spawning dynamics (when they spawn and the life
cycle dynamics of the YOY)
Literature review of Atrazine (Stressor response)
Research on YOY response to parasites (myxozoans, etc.)
Testing of zooplankton for algal toxin content in the YOY SMB spawning areas
Fish health monitoring across multiple species at sites with confirmed disease
incidence (whole community) and in controls
Fish health in individual fish - Co-occurrence of disease (with pathogen
identification) along with thiamine levels, EDCs, and microcystin in individual fish
A basin-wide delineation of potential sources of EDCs (point and nonpoint)
Estimation of the antioxidant pool in diseased and healthy fish
Biological endpoints and effects of atrazine and other herbicides/pesticides.
Biological effects.
Measurement of immune suppression in the field (YOY and adults)
Differential cyanotoxin response in SMB versus other species
Re-evaluation of the data considering the modifying factors (synergistic effects.)
Identify, map, and characterize YOY habitats
Identify the intermediate host of myxozoan