cats: a color and thermal stereo...
TRANSCRIPT

CATS: A Color and Thermal Stereo Benchmark
Wayne Treible1 Philip Saponaro1 Scott Sorensen1,** Abhishek Kolagunda1
Michael O’Neal1 Brian Phelan2 Kelly Sherbondy2 Chandra Kambhamettu1
1University of Delaware, Newark, DE2U.S. Army Research Laboratory, Adelphi, MD
1{wtreible,saponaro,sorensen,abhi,oneal,chandrak}@udel.edu2{brian.r.phelan.civ,kelly.d.sherbondy.civ}@mail.mil
Abstract
Stereo matching is a well researched area using visible-
band color cameras. Thermal images are typically lower
resolution, have less texture, and are noisier compared
to their visible-band counterparts and are more challeng-
ing for stereo matching algorithms. Previous benchmarks
for stereo matching either focus entirely on visible-band
cameras or contain only a single thermal camera. We
present the Color And Thermal Stereo (CATS) benchmark,
a dataset consisting of stereo thermal, stereo color, and
cross-modality image pairs with high accuracy ground truth
(< 2mm) generated from a LiDAR. We scanned 100 clut-
tered indoor and 80 outdoor scenes featuring challenging
environments and conditions. CATS contains approximately
1400 images of pedestrians, vehicles, electronics, and other
thermally interesting objects in different environmental con-
ditions, including nighttime, daytime, and foggy scenes.
Ground truth was projected to each of the four cameras to
generate color-color, thermal-thermal, and cross-modality
disparity maps. A semi-automatic LiDAR to camera align-
ment procedure was developed that does not require a cal-
ibration target. We compare state-of-the-art algorithms to
baseline the dataset and show that in the thermal and cross
modalities there is still much room for improvement. We
expect our dataset to provide researchers with a more di-
verse set of imaged locations, objects, and modalities than
previous benchmarks for stereo matching.
1. Introduction
Recent works in robotic vision [4, 40], material classi-
fication [27], fault line detection [16], and pedestrian de-
tection [33, 17, 8, 22] show that using multiple modalities
**Now with Vision Systems Incorporated, Providence RI
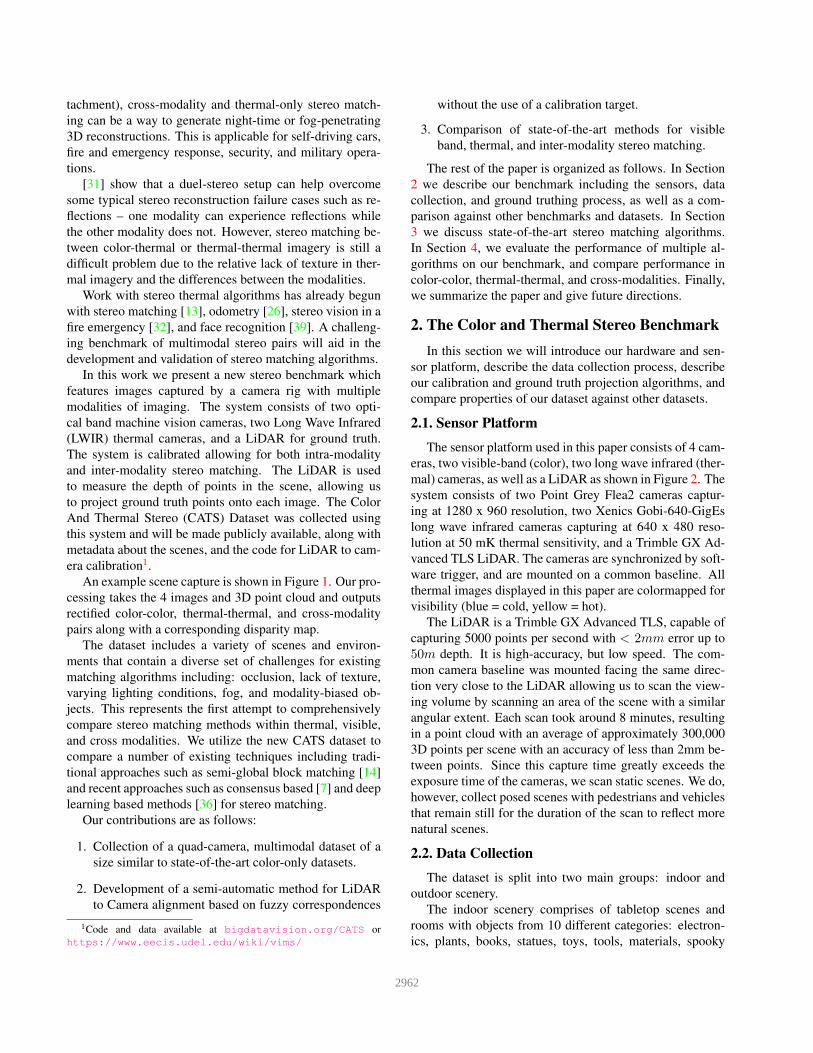
Figure 1. Sample CATS data consisting of optical stereo images
(top), thermal stereo images (center) and the ground truth LiDAR
point cloud
can improve results and capabilities over single sensor sys-
tems. Moreover, as thermal sensors become cheaper and
more accessible (e.g. the FLIR One thermal smartphone at-
12961
tachment), cross-modality and thermal-only stereo match-
ing can be a way to generate night-time or fog-penetrating
3D reconstructions. This is applicable for self-driving cars,
fire and emergency response, security, and military opera-
tions.
[31] show that a duel-stereo setup can help overcome
some typical stereo reconstruction failure cases such as re-
flections – one modality can experience reflections while
the other modality does not. However, stereo matching be-
tween color-thermal or thermal-thermal imagery is still a
difficult problem due to the relative lack of texture in ther-
mal imagery and the differences between the modalities.
Work with stereo thermal algorithms has already begun
with stereo matching [13], odometry [26], stereo vision in a
fire emergency [32], and face recognition [39]. A challeng-
ing benchmark of multimodal stereo pairs will aid in the
development and validation of stereo matching algorithms.
In this work we present a new stereo benchmark which
features images captured by a camera rig with multiple
modalities of imaging. The system consists of two opti-
cal band machine vision cameras, two Long Wave Infrared
(LWIR) thermal cameras, and a LiDAR for ground truth.
The system is calibrated allowing for both intra-modality
and inter-modality stereo matching. The LiDAR is used
to measure the depth of points in the scene, allowing us
to project ground truth points onto each image. The Color
And Thermal Stereo (CATS) Dataset was collected using
this system and will be made publicly available, along with
metadata about the scenes, and the code for LiDAR to cam-
era calibration1.
An example scene capture is shown in Figure 1. Our pro-
cessing takes the 4 images and 3D point cloud and outputs
rectified color-color, thermal-thermal, and cross-modality
pairs along with a corresponding disparity map.
The dataset includes a variety of scenes and environ-
ments that contain a diverse set of challenges for existing
matching algorithms including: occlusion, lack of texture,
varying lighting conditions, fog, and modality-biased ob-
jects. This represents the first attempt to comprehensively
compare stereo matching methods within thermal, visible,
and cross modalities. We utilize the new CATS dataset to
compare a number of existing techniques including tradi-
tional approaches such as semi-global block matching [14]
and recent approaches such as consensus based [7] and deep
learning based methods [36] for stereo matching.
Our contributions are as follows:
1. Collection of a quad-camera, multimodal dataset of a
size similar to state-of-the-art color-only datasets.
2. Development of a semi-automatic method for LiDAR
to Camera alignment based on fuzzy correspondences
1Code and data available at bigdatavision.org/CATS or
https://www.eecis.udel.edu/wiki/vims/
without the use of a calibration target.
3. Comparison of state-of-the-art methods for visible
band, thermal, and inter-modality stereo matching.
The rest of the paper is organized as follows. In Section
2 we describe our benchmark including the sensors, data
collection, and ground truthing process, as well as a com-
parison against other benchmarks and datasets. In Section
3 we discuss state-of-the-art stereo matching algorithms.
In Section 4, we evaluate the performance of multiple al-
gorithms on our benchmark, and compare performance in
color-color, thermal-thermal, and cross-modalities. Finally,
we summarize the paper and give future directions.
2. The Color and Thermal Stereo Benchmark
In this section we will introduce our hardware and sen-
sor platform, describe the data collection process, describe
our calibration and ground truth projection algorithms, and
compare properties of our dataset against other datasets.
2.1. Sensor Platform
The sensor platform used in this paper consists of 4 cam-
eras, two visible-band (color), two long wave infrared (ther-
mal) cameras, as well as a LiDAR as shown in Figure 2. The
system consists of two Point Grey Flea2 cameras captur-
ing at 1280 x 960 resolution, two Xenics Gobi-640-GigEs
long wave infrared cameras capturing at 640 x 480 reso-
lution at 50 mK thermal sensitivity, and a Trimble GX Ad-
vanced TLS LiDAR. The cameras are synchronized by soft-
ware trigger, and are mounted on a common baseline. All
thermal images displayed in this paper are colormapped for
visibility (blue = cold, yellow = hot).
The LiDAR is a Trimble GX Advanced TLS, capable of
capturing 5000 points per second with < 2mm error up to
50m depth. It is high-accuracy, but low speed. The com-
mon camera baseline was mounted facing the same direc-
tion very close to the LiDAR allowing us to scan the view-
ing volume by scanning an area of the scene with a similar
angular extent. Each scan took around 8 minutes, resulting
in a point cloud with an average of approximately 300,000
3D points per scene with an accuracy of less than 2mm be-
tween points. Since this capture time greatly exceeds the
exposure time of the cameras, we scan static scenes. We do,
however, collect posed scenes with pedestrians and vehicles
that remain still for the duration of the scan to reflect more
natural scenes.
2.2. Data Collection
The dataset is split into two main groups: indoor and
outdoor scenery.
The indoor scenery comprises of tabletop scenes and
rooms with objects from 10 different categories: electron-
ics, plants, books, statues, toys, tools, materials, spooky
2962
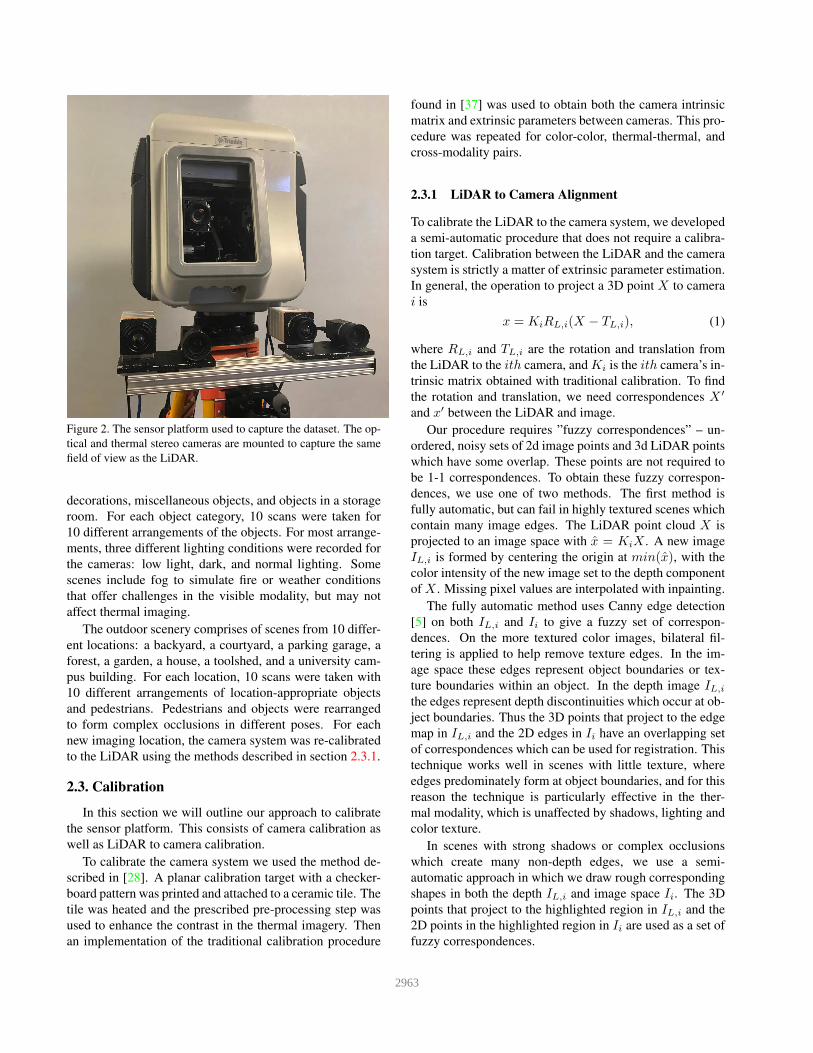
Figure 2. The sensor platform used to capture the dataset. The op-
tical and thermal stereo cameras are mounted to capture the same
field of view as the LiDAR.
decorations, miscellaneous objects, and objects in a storage
room. For each object category, 10 scans were taken for
10 different arrangements of the objects. For most arrange-
ments, three different lighting conditions were recorded for
the cameras: low light, dark, and normal lighting. Some
scenes include fog to simulate fire or weather conditions
that offer challenges in the visible modality, but may not
affect thermal imaging.
The outdoor scenery comprises of scenes from 10 differ-
ent locations: a backyard, a courtyard, a parking garage, a
forest, a garden, a house, a toolshed, and a university cam-
pus building. For each location, 10 scans were taken with
10 different arrangements of location-appropriate objects
and pedestrians. Pedestrians and objects were rearranged
to form complex occlusions in different poses. For each
new imaging location, the camera system was re-calibrated
to the LiDAR using the methods described in section 2.3.1.
2.3. Calibration
In this section we will outline our approach to calibrate
the sensor platform. This consists of camera calibration as
well as LiDAR to camera calibration.
To calibrate the camera system we used the method de-
scribed in [28]. A planar calibration target with a checker-
board pattern was printed and attached to a ceramic tile. The
tile was heated and the prescribed pre-processing step was
used to enhance the contrast in the thermal imagery. Then
an implementation of the traditional calibration procedure
found in [37] was used to obtain both the camera intrinsic
matrix and extrinsic parameters between cameras. This pro-
cedure was repeated for color-color, thermal-thermal, and
cross-modality pairs.
2.3.1 LiDAR to Camera Alignment
To calibrate the LiDAR to the camera system, we developed
a semi-automatic procedure that does not require a calibra-
tion target. Calibration between the LiDAR and the camera
system is strictly a matter of extrinsic parameter estimation.
In general, the operation to project a 3D point X to camera
i is
x = KiRL,i(X − TL,i), (1)
where RL,i and TL,i are the rotation and translation from
the LiDAR to the ith camera, and Ki is the ith camera’s in-
trinsic matrix obtained with traditional calibration. To find
the rotation and translation, we need correspondences X ′
and x′ between the LiDAR and image.
Our procedure requires ”fuzzy correspondences” – un-
ordered, noisy sets of 2d image points and 3d LiDAR points
which have some overlap. These points are not required to
be 1-1 correspondences. To obtain these fuzzy correspon-
dences, we use one of two methods. The first method is
fully automatic, but can fail in highly textured scenes which
contain many image edges. The LiDAR point cloud X is
projected to an image space with x = KiX . A new image
IL,i is formed by centering the origin at min(x), with the
color intensity of the new image set to the depth component
of X . Missing pixel values are interpolated with inpainting.
The fully automatic method uses Canny edge detection
[5] on both IL,i and Ii to give a fuzzy set of correspon-
dences. On the more textured color images, bilateral fil-
tering is applied to help remove texture edges. In the im-
age space these edges represent object boundaries or tex-
ture boundaries within an object. In the depth image IL,i
the edges represent depth discontinuities which occur at ob-
ject boundaries. Thus the 3D points that project to the edge
map in IL,i and the 2D edges in Ii have an overlapping set
of correspondences which can be used for registration. This
technique works well in scenes with little texture, where
edges predominately form at object boundaries, and for this
reason the technique is particularly effective in the ther-
mal modality, which is unaffected by shadows, lighting and
color texture.
In scenes with strong shadows or complex occlusions
which create many non-depth edges, we use a semi-
automatic approach in which we draw rough corresponding
shapes in both the depth IL,i and image space Ii. The 3D
points that project to the highlighted region in IL,i and the
2D points in the highlighted region in Ii are used as a set of
fuzzy correspondences.
2963

Once we have a set of fuzzy correspondences, alignment
is done by a ray-point registration method outlined in [18].
This technique handles noisy, non-uniform alignment by
minimizing the distance of the source shape to the target
shape while maximizing matched area on target shape. This
aligns the rays from the camera center through the 2D points
on the image plane to the 3D points from the depth image.
The result of this method is a transformation from the Li-
DAR to the camera coordinate system which allows us to
project points.
2.4. Dataset Comparison
Table 1 gives a summary comparison between recent
datasets involving either stereo matching or multimodal
color/thermal imagery.
In recent years, there has been an increase in the num-
ber color/thermal multimodal datasets, most of which are
pedestrian detection benchmarks. In particular, there is the
multispectral pedestrian dataset [15], the LITIV [2], the
Thermal Infrared Video (TIV) benchmark [34], the ther-
mal object tracking benchmark [1], the OSU color-thermal
benchmark [9], the Alcorn State University MultiSpectral
Stereo (ASUMSS) dataset [38], and the Stereo Thermal
benchmark [20]. Of these, only the LITIV has ground
truth disparity information and only for color-thermal cross
modality pairs. Their ground truth was manually annotated
for 25819 total ground truth pixels. Our dataset, on the
other hand, has automated ground truth with a LiDAR for an
average of approximately 300,000 ground truth points per
pair. This includes not only color-thermal, but also thermal-
thermal and color-color stereo pairs.
Stereo matching benchmarks have a longer history with
color-only imagery. There exists the EISATS sets [25],
the Middlebury dataset [30], the Make3D dataset [29], the
Ladicky dataset [21], the HCI Robust Vision Challenge
Dataset [23], and the KITTI dataset [12, 11, 10, 24], to
name a few. The largest among these is KITTI dataset,
a comprehensive autonomous driving color stereo dataset
that includes dense disparity, odometry, object detection,
and scene flow ground truth data. Unlike KITTI, CATS has
the thermal modality as well as more diverse non-road im-
agery. Sample rectified color and thermal images are shown
in figure 3.
KITTI has been developed for autonomous driving appli-
cations, and the nature of the data reflects this, with stereo
pairs containing various scenes of roads, buildings, cars,
and pedestrians. As a result, many of the algorithms devel-
oped for and tested on KITTI leverage assumptions about
this type of data. Machine learning techniques such as [36]
have used KITTI training data, and have the potential to
over-fit their model on roadway scenes. The CATS dataset
has been developed to reflect a variety of environments,
objects, lighting, and environmental conditions to help de-
Figure 3. Sample rectified images and corresponding inpainted
ground truth disparity in color and thermal modalities
velop robust algorithms in both standard color stereo match-
ing, thermal stereo matching, and cross-modality stereo.
We apply lighting and environmental modifiers to the scene
in the form of various lighting and fog levels. Information
about the number of images with modifiers applied is pre-
sented in Table 2. CATS contains 48 scenes with people,
including scenes with person-person occlusion, and foggy
scenes of a simulated fire, showing potential applications of
thermal imaging for rescue and firefighting operations.
3. Experimental Setup
In this section we will outline our experimental setting
and describe how we have tested existing stereo matching
techniques. Since CATS features different image modalities
as well as varying lighting and environmental conditions,
the experiments have been built to highlight these aspects.
We have used uncalibrated rectification [3] to create a
series of rectified color-color, thermal-thermal, and color-
thermal stereo images. For the cross-modality pairs, manual
correspondences were used for rectification. We have used
the projection technique discussed in section 2.3.1 to project
3D points to each image, the points are then transformed
according to the rectified images, allowing us to generate
disparity maps by taking the horizontal difference between
individual points. We compare these ground truth disparity
masks with disparity estimates obtained by the algorithms
discussed in the following subsection.
3.1. Algorithm Comparisons
We have compared 6 different stereo disparity algo-
rithms of varying complexity, ranging from simple block
matching to modern convolutional neural networks based
methods. This is by no means an exhaustive list of disparity
algorithms, but we have made an effort to test top perform-
ing methods from the KITTI benchmark for which code was
made available. Here we will outline and briefly summarize
the disparity methods tested.
– Block Matching (BM) [19] matches patches in a range
2964
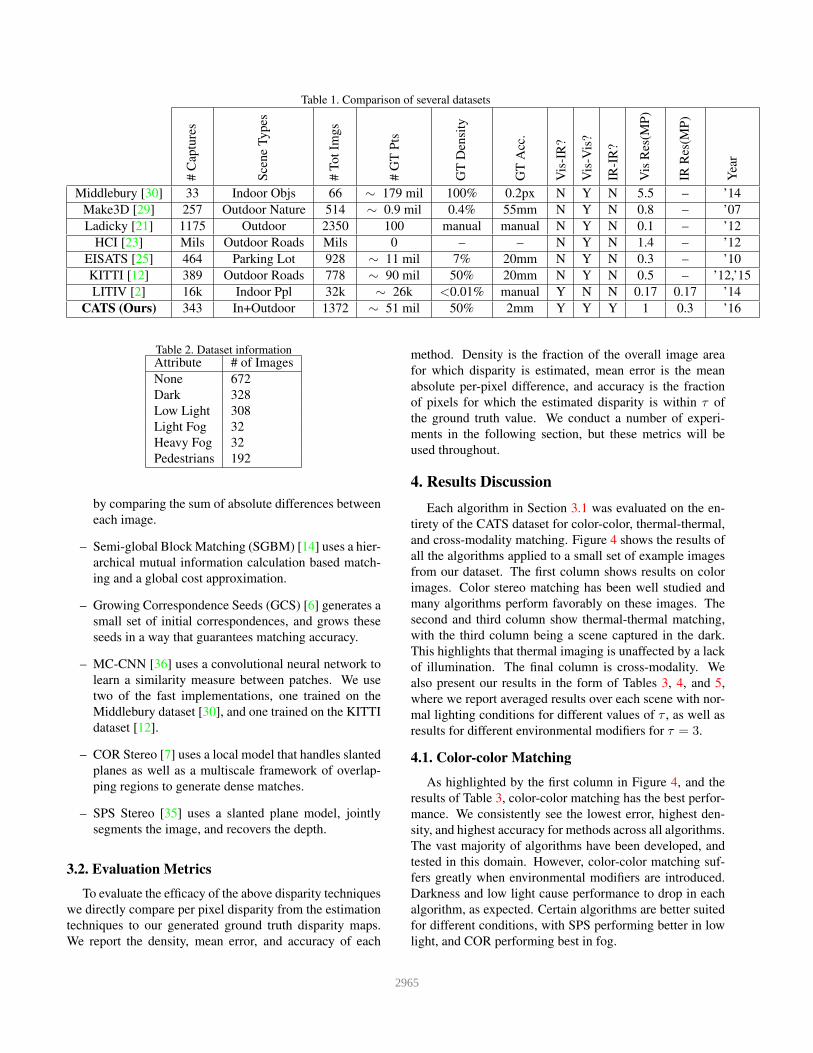
Table 1. Comparison of several datasets
#C
aptu
res
Sce
ne
Ty
pes
#T
ot
Img
s
#G
TP
ts
GT
Den
sity
GT
Acc
.
Vis
-IR
?
Vis
-Vis
?
IR-I
R?
Vis
Res
(MP
)
IRR
es(M
P)
Yea
r
Middlebury [30] 33 Indoor Objs 66 ∼ 179 mil 100% 0.2px N Y N 5.5 – ’14
Make3D [29] 257 Outdoor Nature 514 ∼ 0.9 mil 0.4% 55mm N Y N 0.8 – ’07
Ladicky [21] 1175 Outdoor 2350 100 manual manual N Y N 0.1 – ’12
HCI [23] Mils Outdoor Roads Mils 0 – – N Y N 1.4 – ’12
EISATS [25] 464 Parking Lot 928 ∼ 11 mil 7% 20mm N Y N 0.3 – ’10
KITTI [12] 389 Outdoor Roads 778 ∼ 90 mil 50% 20mm N Y N 0.5 – ’12,’15
LITIV [2] 16k Indoor Ppl 32k ∼ 26k <0.01% manual Y N N 0.17 0.17 ’14
CATS (Ours) 343 In+Outdoor 1372 ∼ 51 mil 50% 2mm Y Y Y 1 0.3 ’16
Table 2. Dataset informationAttribute # of Images
None 672
Dark 328
Low Light 308
Light Fog 32
Heavy Fog 32
Pedestrians 192
by comparing the sum of absolute differences between
each image.
– Semi-global Block Matching (SGBM) [14] uses a hier-
archical mutual information calculation based match-
ing and a global cost approximation.
– Growing Correspondence Seeds (GCS) [6] generates a
small set of initial correspondences, and grows these
seeds in a way that guarantees matching accuracy.
– MC-CNN [36] uses a convolutional neural network to
learn a similarity measure between patches. We use
two of the fast implementations, one trained on the
Middlebury dataset [30], and one trained on the KITTI
dataset [12].
– COR Stereo [7] uses a local model that handles slanted
planes as well as a multiscale framework of overlap-
ping regions to generate dense matches.
– SPS Stereo [35] uses a slanted plane model, jointly
segments the image, and recovers the depth.
3.2. Evaluation Metrics
To evaluate the efficacy of the above disparity techniques
we directly compare per pixel disparity from the estimation
techniques to our generated ground truth disparity maps.
We report the density, mean error, and accuracy of each
method. Density is the fraction of the overall image area
for which disparity is estimated, mean error is the mean
absolute per-pixel difference, and accuracy is the fraction
of pixels for which the estimated disparity is within τ of
the ground truth value. We conduct a number of experi-
ments in the following section, but these metrics will be
used throughout.
4. Results Discussion
Each algorithm in Section 3.1 was evaluated on the en-
tirety of the CATS dataset for color-color, thermal-thermal,
and cross-modality matching. Figure 4 shows the results of
all the algorithms applied to a small set of example images
from our dataset. The first column shows results on color
images. Color stereo matching has been well studied and
many algorithms perform favorably on these images. The
second and third column show thermal-thermal matching,
with the third column being a scene captured in the dark.
This highlights that thermal imaging is unaffected by a lack
of illumination. The final column is cross-modality. We
also present our results in the form of Tables 3, 4, and 5,
where we report averaged results over each scene with nor-
mal lighting conditions for different values of τ , as well as
results for different environmental modifiers for τ = 3.
4.1. Colorcolor Matching
As highlighted by the first column in Figure 4, and the
results of Table 3, color-color matching has the best perfor-
mance. We consistently see the lowest error, highest den-
sity, and highest accuracy for methods across all algorithms.
The vast majority of algorithms have been developed, and
tested in this domain. However, color-color matching suf-
fers greatly when environmental modifiers are introduced.
Darkness and low light cause performance to drop in each
algorithm, as expected. Certain algorithms are better suited
for different conditions, with SPS performing better in low
light, and COR performing best in fog.
2965
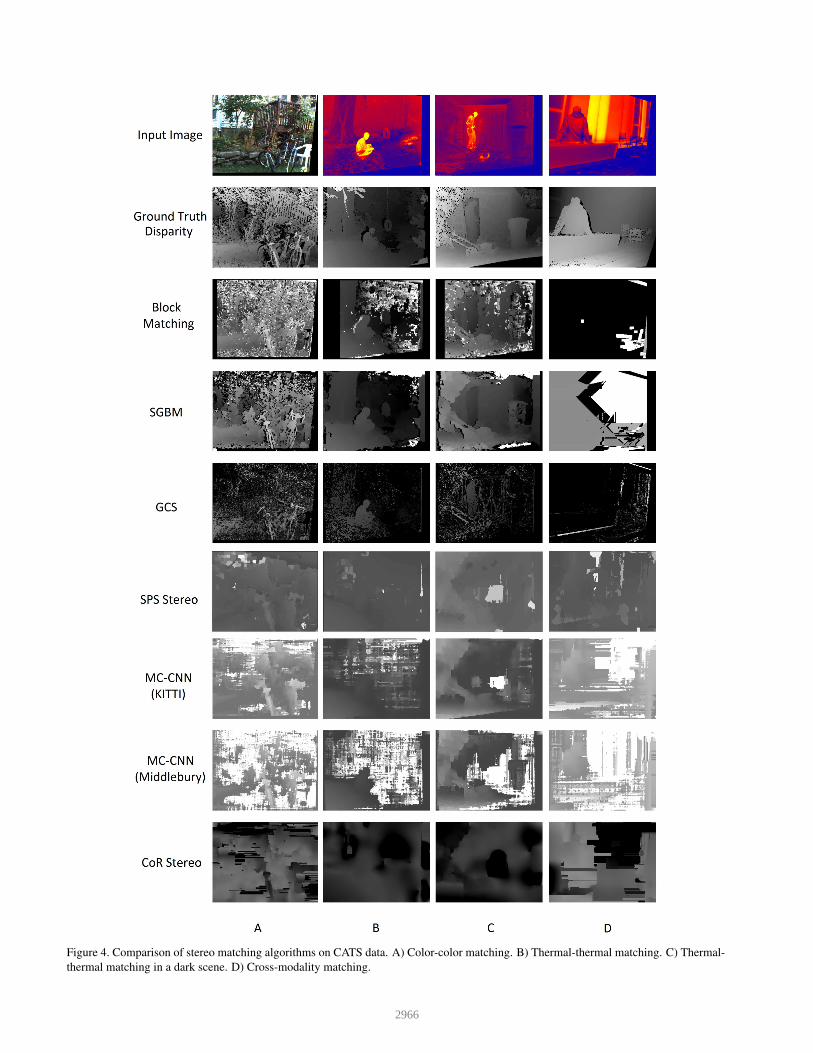
Figure 4. Comparison of stereo matching algorithms on CATS data. A) Color-color matching. B) Thermal-thermal matching. C) Thermal-
thermal matching in a dark scene. D) Cross-modality matching.
2966

Table 3. Color-color stereo matchingAccuracy Accuracy with modifiers
density mean error (px) τ =3 τ =5 τ =10 τ =20 τ =3 dark τ =3 low light τ =3 low fog τ =3 high fog
Block Matching 0.8382 25.4811 0.1343 0.2199 0.4189 0.6048 0.0504 0.0694 0.0489 0.0479
SGBM 0.8239 16.334 0.1597 0.2741 0.6015 0.8183 0.0685 0.0895 0.0512 0.0475
GCS 0.1975 44.29 0.1974 0.3246 0.5741 0.7714 0.0293 0.0762 0.054 0.0287
SPS 1 20.0361 0.1362 0.2159 0.385 0.6081 0.0831 0.1078 0.0427 0.0466
COR 1 37.6084 0.1032 0.1752 0.3439 0.5643 0.0646 0.0779 0.1027 0.0963
MC-CNN (KITTI) 1 28.2421 0.1354 0.2169 0.3931 0.5908 0.0507 0.0882 0.0497 0.044
MC-CNN (Middlebury) 1 53.2755 0.1133 0.1816 0.3297 0.4716 0.027 0.0553 0.0329 0.0282
Table 4. Thermal-thermal stereo matchingAccuracy Accuracy with modifiers
density mean error (px) τ =3 τ =5 τ =10 τ =20 τ =3 dark τ =3 low light τ =3 low fog τ =3 high fog
Block Matching 0.82 25.4016 0.1542 0.2553 0.4152 0.5692 0.1234 0.1131 0.1257 0.1234
SGBM 0.7972 25.7898 0.2072 0.3418 0.5225 0.6585 0.1912 0.1892 0.2005 0.207
GCS 0.1401 43.3571 0.2436 0.3796 0.5765 0.7188 0.2452 0.2686 0.2228 0.1942
SPS 1 15.5543 0.2 0.3044 0.5021 0.76 0.1977 0.1826 0.1809 0.1966
COR 1 33.4988 0.0944 0.1592 0.2989 0.4773 0.1061 0.1078 0 0
MC-CNN (KITTI) 1 21.0059 0.1975 0.3057 0.4948 0.7018 0.1957 0.1818 0.2136 0.2119
MC-CNN (Middlebury) 1 36.6651 0.1619 0.2499 0.3983 0.5613 0.1504 0.14 0.1885 0.187
4.2. Thermalthermal Matching
Thermal-thermal matching is more challenging, and we
see this with decreases in density and increases in mean
pixel error. The accuracy numbers seem to increase, but this
is in part due to lower resolution, meaning a smaller dispar-
ity range, and small errors in disparity have a larger effect
on estimated depth. We also see a far less pronounced effect
from environmental modifiers as expected. Thermal images
are unaffected by lighting; however, outdoor scenes with
sunlight also have dynamic changes in temperature which
adds texture in the thermal modality. We observed better
results for outdoor scenes than indoor scenes with thermal-
thermal matching. We do see a small decrease in perfor-
mance when fog is added, however this may be due to the
fact that our foggy scenes are all indoors (to facilitate the
use of a fog machine), and therefore most objects are room
temperature and have little contrast. The thermal images
themselves do not show the fog and remain unaffected by
it.
4.3. Cross Modality Matching
Our results show that there is significant work needed for
any real applications of cross modality matching. The last
column of Figure 4 sometimes looks arbitrary or random,
but a few of the algorithms show promise. Both MC-CNN
algorithms show the outline of the person sitting on bench
and portions of the bench itself. The SPS algorithm gives
the lowest mean error and has some of the higher accuracy
values. Because SPS computes segmentation and boundary
labels, it is able to more effectively identify entire objects
between the modalities. Since the objects do not share tex-
ture information across modalities, object boundaries can
be a useful identifier they do share.
Cross modality gives the worst results overall. Most ex-
isting cross-modality datasets target pedestrians detection
and not stereo matching. By providing ground truth match-
ing regions in both modalities, our dataset can be leveraged
to train and test new feature descriptors that are modality
invariant.
4.4. Analysis of Results
Existing disparity estimation techniques have been tai-
lored for color imagery and are often ill suited for other
modalities. Thermal-thermal disparity matching suffers
greatly from the lack of texture, meaning that objects with
texture in the color images often appear uniform in thermal
modality. This makes thermal-thermal matching more dif-
ficult with methods that do not handle textureless regions.
Cross-modality matching is exceptionally challenging due
to the lack of mutual information across the modalities.
Furthermore many of the state-of-the-art disparity tech-
niques have been tailored to the specific datasets on which
they have been tested. The KITTI dataset, for example,
contains mostly planar road surfaces, planar buildings, and
cars. COR stereo and SPS both use a slanted plane model
which accurately models the scenes in KITTI, but do not
handle many of scenes in CATS in the color modality. Ad-
ditionally, MC-CNN shows that a deep learning approach
that works well on KITTI does not necessarily translate to
CATS due to the differences in the scenes.
We find that semi-global block matching is consistently
among the top performing algorithms for color-color and
thermal-thermal matching, but is ill-suited for cross modal-
ity matching. GCS typically obtains accurate results, but
has very low density and contains a number of large outliers
in thermal-thermal matching. COR stereo under-performed
on our dataset, particularly in thermal-thermal and cross
modality matching. Both variants of MC-CNN perform
similarly, with the version trained on KITTI outperforming
the version trained using the Middlebury dataset. SPS per-
forms well in thermal-thermal and cross-modality in terms
of mean error.
2967

Table 5. Cross modality stereo matchingAccuracy Accuracy with modifiers
density mean error (px) τ =3 τ =5 τ =10 τ =20 τ =3 dark τ =3 low light τ =3 low fog τ =3 high fog
Block Matching 0.7989 31.5529 0.0637 0.1084 0.221 0.4317 0.0593 0.0562 0.0605 0.0606
SGBM 0.7932 31.1338 0.0806 0.1347 0.2724 0.5069 0.08 0.0814 0.0735 0.0719
GCS 0.1313 50.6428 0.0952 0.1576 0.3088 0.5635 0.1055 0.1196 0.0817 0.0562
SPS 1 24.4966 0.0914 0.147 0.2782 0.5575 0.0875 0.0943 0.1202 0.1131
COR 1 34.5943 0.0563 0.0931 0.189 0.4032 0.0702 0.0584 0.018 0.0191
MC-CNN (KITTI) 1 31.4504 0.073 0.1214 0.2364 0.4817 0.0674 0.0719 0.0774 0.0817
MC-CNN (Middlebury) 1 44.0422 0.0632 0.1065 0.2059 0.4115 0.0563 0.0606 0.0899 0.0916
5. Conclusion
In this work we have introduced a new benchmark
dataset for stereo matching which includes color-color,
thermal-thermal, and cross-modality stereo pairs. The
CATS dataset offers a new testbed for evaluating stereo
matching with high accuracy ground truth across a diverse
set of scenes. This work represents the first attempt to com-
prehensively evaluate stereo matching in thermal and be-
tween modalities, and shows that current approaches are ill-
suited for this problem. We have developed a method for
LiDAR to camera alignment that does not need a calibra-
tion board or exact correspondences. We hope to inspire
new stereo algorithms that can handle both cross-modality
and thermal matching in a more general set of scenes. We
have released the dataset and LiDAR to camera calibration
code publicly so that the community can work with data
of this nature without needing access to expensive LiDARs
or thermal cameras. As thermal cameras become more af-
fordable and higher quality, robust algorithms and compre-
hensive evaluation of their capabilities will become increas-
ingly important.
In the future, we will be building on this dataset to in-
clude semantic labels and bounding boxes in each modal-
ity, to enable novel segmentation, detection and classifica-
tion work in both two and three dimensions across modali-
ties. We are developing algorithms to more robustly handle
thermal and cross-modality matching, and we will use the
ground truth disparity we have generated to train machine
learning methods for disparity estimation.
6. Acknowledgements
This work is funded by Cooperative Agreement
W911NF-11-2-0046 (ARO Proposal No. 59537-EL-PIR).
References
[1] A. Berg, J. Ahlberg, and M. Felsberg. A thermal object
tracking benchmark. In Advanced Video and Signal Based
Surveillance (AVSS), 2015 12th IEEE International Confer-
ence on, pages 1–6, Aug 2015. 4
[2] G.-A. Bilodeau, A. Torabi, P.-L. St-Charles, and D. Riahi.
Thermalvisible registration of human silhouettes: A similar-
ity measure performance evaluation. Infrared Physics and
Technology, 64:79 – 86, 2014. 4, 5
[3] G. R. Bradski and A. Kaehler. Learning OpenCV - computer
vision with the OpenCV library: software that sees. O’Reilly,
2008. 4
[4] F. Burian, P. Kocmanova, and L. Zalud. Robot mapping with
range camera, ccd cameras and thermal imagers. In Methods
and Models in Automation and Robotics (MMAR), 2014 19th
International Conference On, pages 200–205, Sept 2014. 1
[5] J. Canny. A computational approach to edge detection. IEEE
Transactions on Pattern Analysis and Machine Intelligence,
PAMI-8(6):679–698, Nov 1986. 3
[6] J. Cech and R. Sara. Efficient sampling of disparity space for
fast and accurate matching. In BenCOS 2007: CVPR Work-
shop Towards Benchmarking Automated Calibration, Orien-
tation and Surface Reconstruction from Images. IEEE, 2007.
Software GCS 2.0. 5
[7] A. Chakrabarti, Y. Xiong, S. J. Gortler, and T. Zickler. Low-
level vision by consensus in a spatial hierarchy of regions. In
CVPR, 2015. 2, 5
[8] Y. Chen and C. Han. Night-time pedestrian detection by
visual-infrared video fusion. In Intelligent Control and Au-
tomation, 2008. WCICA 2008. 7th World Congress on, pages
5079–5084, June 2008. 1
[9] J. W. Davis and V. Sharma. Background-subtraction using
contour-based fusion of thermal and visible imagery. Com-
puter Vision and Image Understanding, 106(23):162 – 182,
2007. Special issue on Advances in Vision Algorithms and
Systems beyond the Visible Spectrum. 4
[10] J. Fritsch, T. Kuehnl, and A. Geiger. A new performance
measure and evaluation benchmark for road detection algo-
rithms. In International Conference on Intelligent Trans-
portation Systems (ITSC), 2013. 4
[11] A. Geiger, P. Lenz, C. Stiller, and R. Urtasun. Vision meets
robotics: The kitti dataset. International Journal of Robotics
Research (IJRR), 2013. 4
[12] A. Geiger, P. Lenz, and R. Urtasun. Are we ready for au-
tonomous driving? the kitti vision benchmark suite. In Com-
puter Vision and Pattern Recognition (CVPR), 2012 IEEE
Conference on, pages 3354–3361, June 2012. 4, 5
[13] K. Hajebi and J. S. Zelek. Structure from infrared stereo im-
ages. In Computer and Robot Vision, 2008. CRV ’08. Cana-
dian Conference on, pages 105–112, May 2008. 2
[14] H. Hirschmller. Accurate and efficient stereo processing by
semi-global matching and mutual information. In CVPR (2),
pages 807–814. IEEE Computer Society, 2005. 2, 5
[15] S. Hwang, J. Park, N. Kim, Y. Choi, and I. S. Kweon. Mul-
tispectral pedestrian detection: Benchmark dataset and base-
line. In 2015 IEEE Conference on Computer Vision and Pat-
tern Recognition (CVPR), pages 1037–1045, June 2015. 4
2968

[16] H. H. Jung and J. Lyou. Matching of thermal and color im-
ages with application to power distribution line fault detec-
tion. In Control, Automation and Systems (ICCAS), 2015
15th International Conference on, pages 1389–1392, Oct
2015. 1
[17] B. C. Ko, J. Y. Kwak, and J. Y. Nam. Online learning
based multiple pedestrians tracking in thermal imagery for
safe driving at night. In 2016 IEEE Intelligent Vehicles Sym-
posium (IV), pages 78–79, June 2016. 1
[18] A. Kolagunda, S. Sorensen, P. Saponaro, W. Treible, and
C. Kambhamettu. Robust shape registration using fuzzy cor-
respondences. arXiv preprint arXiv:1702.05664, 2017. 4
[19] K. Konolige. Small Vision Systems: Hardware and Imple-
mentation, pages 203–212. Springer London, London, 1998.
4
[20] M. S. Kristoffersen, J. V. Dueholm, R. Gade, and T. B. Moes-
lund. Pedestrian counting with occlusion handling using
stereo thermal cameras. Sensors (Basel), 16(1):62, Jan 2016.
sensors-16-00062[PII]. 4
[21] L. Ladicky, P. Sturgess, C. Russell, S. Sengupta, Y. Bastan-
lar, W. Clocksin, and P. H. S. Torr. Joint optimization for
object class segmentation and dense stereo reconstruction.
International Journal of Computer Vision, 100(2):122–133,
2012. 4, 5
[22] A. Leykin, Y. Ran, and R. Hammoud. Thermal-visible video
fusion for moving target tracking and pedestrian classifica-
tion. In 2007 IEEE Conference on Computer Vision and Pat-
tern Recognition, pages 1–8, June 2007. 1
[23] S. Meister, B. Jahne, and D. Kondermann. Outdoor stereo
camera system for the generation of real-world benchmark
data sets. Optical Engineering, 51(02):021107, 2012. 4, 5
[24] M. Menze and A. Geiger. Object scene flow for autonomous
vehicles. In Conference on Computer Vision and Pattern
Recognition (CVPR), 2015. 4
[25] S. Morales and R. Klette. Ground truth evaluation of stereo
algorithms for real world applications. In Proceedings of the
2010 International Conference on Computer Vision - Volume
Part II, ACCV’10, pages 152–162, Berlin, Heidelberg, 2011.
Springer-Verlag. 4, 5
[26] T. Mouats, N. Aouf, L. Chermak, and M. A. Richardson.
Thermal stereo odometry for UAVs. IEEE Sensors Journal,
15(11):6335–6347, Nov 2015. 2
[27] P. Saponaro, S. Sorensen, A. Kolagunda, and C. Kamb-
hamettu. Material classification with thermal imagery. In
2015 IEEE Conference on Computer Vision and Pattern
Recognition (CVPR), pages 4649–4656, June 2015. 1
[28] P. Saponaro, S. Sorensen, S. Rhein, and C. Kambhamettu.
Improving calibration of thermal stereo cameras using
heated calibration board. In Image Processing (ICIP), 2015
IEEE International Conference on, pages 4718–4722, Sept
2015. 3
[29] A. Saxena, J. Schulte, and A. Y. Ng. Depth estimation us-
ing monocular and stereo cues. In Proceedings of the 20th
International Joint Conference on Artifical Intelligence, IJ-
CAI’07, pages 2197–2203, San Francisco, CA, USA, 2007.
Morgan Kaufmann Publishers Inc. 4, 5
[30] D. Scharstein, H. Hirschmuller, Y. Kitajima, G. Krathwohl,
N. Nesic, X. Wang, and P. Westling. High-Resolution Stereo
Datasets with Subpixel-Accurate Ground Truth, pages 31–
42. Springer International Publishing, Cham, 2014. 4, 5
[31] S. Sorensen, P. Saponaro, S. Rhein, and C. Kambhamettu.
Multimodal stereo vision for reconstruction in the presence
of reflection. In M. W. J. Xianghua Xie and G. K. L. Tam,
editors, Proceedings of the British Machine Vision Confer-
ence (BMVC), pages 112.1–112.12. BMVA Press, Septem-
ber 2015. 2
[32] J. W. Starr and B. Y. Lattimer. A comparison of ir stereo
vision and lidar for use in fire environments. In Sensors,
2012 IEEE, pages 1–4, Oct 2012. 2
[33] A. Torabi, G. Mass, and G.-A. Bilodeau. An iterative in-
tegrated framework for thermalvisible image registration,
sensor fusion, and people tracking for video surveillance
applications. Computer Vision and Image Understanding,
116(2):210 – 221, 2012. 1
[34] Z. Wu, N. Fuller, D. Theriault, and M. Betke. A ther-
mal infrared video benchmark for visual analysis. In 2014
IEEE Conference on Computer Vision and Pattern Recogni-
tion Workshops, pages 201–208, June 2014. 4
[35] K. Yamaguchi, D. McAllester, and R. Urtasun. Efficient joint
segmentation, occlusion labeling, stereo and flow estimation.
In ECCV, 2014. 5
[36] J. Zbontar and Y. LeCun. Stereo matching by training a con-
volutional neural network to compare image patches. CoRR,
abs/1510.05970, 2015. 2, 4, 5
[37] Z. Zhang. A flexible new technique for camera calibration.
IEEE Trans. Pattern Anal. Mach. Intell., 22(11):1330–1334,
Nov. 2000. 3
[38] Y. Zheng. Orientation-based face recognition using mul-
tispectral imagery and score fusion. Optical Engineering,
50(11):117202–117202–9, 2011. 4
[39] Y. Zheng, A. S. Elmaghraby, and K. Reese. Performance
improvement of face recognition using multispectral images
and stereo images. In 2012 IEEE International Symposium
on Signal Processing and Information Technology (ISSPIT),
pages 000280–000285, Dec 2012. 2
[40] S. Zhiwei, W. Yiyan, Z. Changjiu, and Z. Yi. A new sensor
fusion framework to deal with false detections for low-cost
service robot localization. In 2013 IEEE International Con-
ference on Robotics and Biomimetics (ROBIO), pages 197–
202, Dec 2013. 1
2969