cation dependent surface charge regulation in gated nano … · cation dependent gating behavior....
TRANSCRIPT
Cation Dependent Surface Charge Regulation in Gated NanofluidicDevicesMarie Fuest, Kaushik K. Rangharajan, Caitlin Boone, A. T. Conlisk, and Shaurya Prakash*
Department of Mechanical and Aerospace Engineering, The Ohio State University, Columbus, Ohio 43210, United States
*S Supporting Information
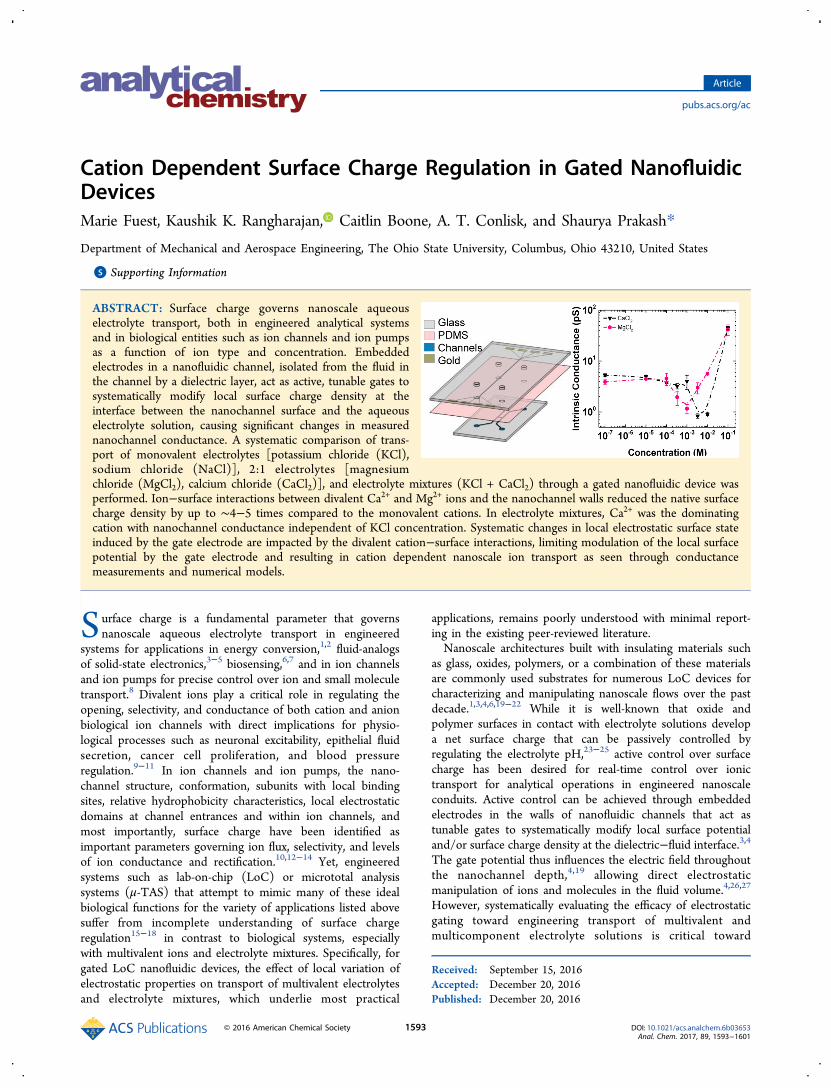
ABSTRACT: Surface charge governs nanoscale aqueouselectrolyte transport, both in engineered analytical systemsand in biological entities such as ion channels and ion pumpsas a function of ion type and concentration. Embeddedelectrodes in a nanofluidic channel, isolated from the fluid inthe channel by a dielectric layer, act as active, tunable gates tosystematically modify local surface charge density at theinterface between the nanochannel surface and the aqueouselectrolyte solution, causing significant changes in measurednanochannel conductance. A systematic comparison of trans-port of monovalent electrolytes [potassium chloride (KCl),sodium chloride (NaCl)], 2:1 electrolytes [magnesiumchloride (MgCl2), calcium chloride (CaCl2)], and electrolyte mixtures (KCl + CaCl2) through a gated nanofluidic device wasperformed. Ion−surface interactions between divalent Ca2+ and Mg2+ ions and the nanochannel walls reduced the native surfacecharge density by up to ∼4−5 times compared to the monovalent cations. In electrolyte mixtures, Ca2+ was the dominatingcation with nanochannel conductance independent of KCl concentration. Systematic changes in local electrostatic surface stateinduced by the gate electrode are impacted by the divalent cation−surface interactions, limiting modulation of the local surfacepotential by the gate electrode and resulting in cation dependent nanoscale ion transport as seen through conductancemeasurements and numerical models.
Surface charge is a fundamental parameter that governsnanoscale aqueous electrolyte transport in engineered
systems for applications in energy conversion,1,2 fluid-analogsof solid-state electronics,3−5 biosensing,6,7 and in ion channelsand ion pumps for precise control over ion and small moleculetransport.8 Divalent ions play a critical role in regulating theopening, selectivity, and conductance of both cation and anionbiological ion channels with direct implications for physio-logical processes such as neuronal excitability, epithelial fluidsecretion, cancer cell proliferation, and blood pressureregulation.9−11 In ion channels and ion pumps, the nano-channel structure, conformation, subunits with local bindingsites, relative hydrophobicity characteristics, local electrostaticdomains at channel entrances and within ion channels, andmost importantly, surface charge have been identified asimportant parameters governing ion flux, selectivity, and levelsof ion conductance and rectification.10,12−14 Yet, engineeredsystems such as lab-on-chip (LoC) or micrototal analysissystems (μ-TAS) that attempt to mimic many of these idealbiological functions for the variety of applications listed abovesuffer from incomplete understanding of surface chargeregulation15−18 in contrast to biological systems, especiallywith multivalent ions and electrolyte mixtures. Specifically, forgated LoC nanofluidic devices, the effect of local variation ofelectrostatic properties on transport of multivalent electrolytesand electrolyte mixtures, which underlie most practical
applications, remains poorly understood with minimal report-ing in the existing peer-reviewed literature.Nanoscale architectures built with insulating materials such
as glass, oxides, polymers, or a combination of these materialsare commonly used substrates for numerous LoC devices forcharacterizing and manipulating nanoscale flows over the pastdecade.1,3,4,6,19−22 While it is well-known that oxide andpolymer surfaces in contact with electrolyte solutions developa net surface charge that can be passively controlled byregulating the electrolyte pH,23−25 active control over surfacecharge has been desired for real-time control over ionictransport for analytical operations in engineered nanoscaleconduits. Active control can be achieved through embeddedelectrodes in the walls of nanofluidic channels that act astunable gates to systematically modify local surface potentialand/or surface charge density at the dielectric−fluid interface.3,4The gate potential thus influences the electric field throughoutthe nanochannel depth,4,19 allowing direct electrostaticmanipulation of ions and molecules in the fluid volume.4,26,27
However, systematically evaluating the efficacy of electrostaticgating toward engineering transport of multivalent andmulticomponent electrolyte solutions is critical toward
Received: September 15, 2016Accepted: December 20, 2016Published: December 20, 2016
Article
pubs.acs.org/ac
© 2016 American Chemical Society 1593 DOI: 10.1021/acs.analchem.6b03653Anal. Chem. 2017, 89, 1593−1601

advancing nanofluidics for highly functional LoC or μ-TASdevices.Basic transport phenomena in gated or field-effect nano-
fluidic devices remain an open area of research.28,29
Consequently, nearly all reports to date on gated nanofluidicdevices have focused on transport of potassium chloride(KCl),3,4,22,28,30−36 with limited evaluation of hydrochloric acid(HCl)37,38 and glycine based buffers.39 In the case of multi- orpolyvalent electrolyte solutions, including mixtures, fundamen-tal research for ungated nanofluidic devices shows that ion−surface and/or ion−ion interactions must be considereddepending on the electrolyte type and composition alongwith ion concentration and surface charge density.15,17,40
Systematic comparison of gated transport for monovalent, 2:1electrolytes, and simple electrolyte mixtures is furthercomplicated by device to device variation, specifically byobserved inconsistency of the surface charge density acrossfabricated devices.4,41
In this report, a systematic comparison of transport ofmonovalent electrolytes [KCl, sodium chloride (NaCl)], 2:1electrolytes [magnesium chloride (MgCl2), calcium chloride(CaCl2)], and electrolyte mixtures (KCl + CaCl2) through agated nanofluidic device is demonstrated for the first time.Ion−surface interactions regulate the nanochannel surfacecharge density as a function of cation type, resulting in distinctcation dependent gating behavior. The glass-polydimethylsilox-ane (PDMS) based devices here are cation selective underconditions of interacting electric double layers (EDLs);therefore, the cation was varied across electrolyte solutionsfor a fixed anion.The purpose of this paper is to demonstrate that systematic
changes in local electrostatic surface state induced by a gateelectrode are impacted by ion−surface interactions leading tosurface charge regulation, and consequently, the resultingnanoscale ion transport is strongly affected by cation type ingated nanofluidic devices. In particular, divalent cation−surfaceinteractions reduce the surface charge density and limit thecurrent modulation under some of the tested gating conditions.A multi-species numerical model confirmed that ion−surfaceinteractions had a significant impact on the surface charge
density at pH ≥ 6 for CaCl2. Ion−surface interactions betweenthe charged walls and the divalent cations in the electrolyteregulate the surface charge density and consequently limit theability of the gate electrode to alter the net surface chargedensity and modulate nanochannel conductance.
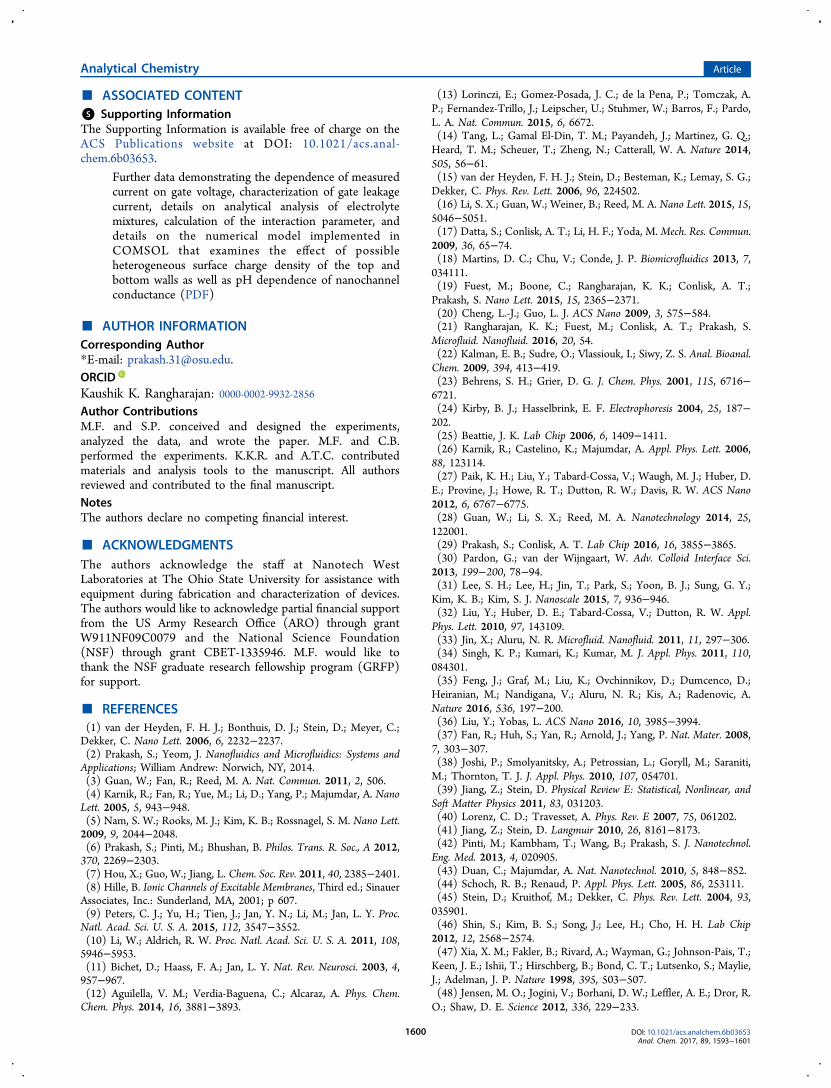
■ EXPERIMENTAL PROCEDURESThe gated nanofluidic device consisted of two microfluidicchannels (8 μm deep × 50 μm wide × 3 cm long) which servedas fluidic reservoirs to a bank of three nanofluidic channels (16nm deep × 30 μm wide × 2.5 mm long). Four individuallyaddressable gold (Au) gate electrodes were embedded in theroof of the nanofluidic channels and separated from theelectrolyte in the nanochannel by a polydimethylsiloxane(PDMS) dielectric layer (PDMS thickness ∼0.7 μm).19,42
Only one active gate electrode was used for this work. Themicro- and nanofluidic network was patterned on a borosilicateglass substrate using UV lithography and wet etchingtechniques. Individually addressable Au gate electrodes werepatterned onto a second glass substrate. A PDMS dielectriclayer was spun onto the glass cover containing the electrodearray. The cover with embedded electrodes and the glasssubstrate with the patterned channel network were bonded viaO2 plasma bonding to form sealed channels. Details on devicefabrication and basic device operation and characterization havebeen reported previously.19,42
The device testing setup included two power supplies(Keithley 3390 function generators) used to supply independ-ent axial (Va) and gate (Vg) potentials. The axial potential usedhere was Va = 3 V and Va = 5 V, as discussed below, and thegate potential was in the range of −3 V ≤ Vg ≤ 3 V. Current (I)through the nanochannels was monitored using a Keithley 6485picoammeter (Figure 1b). Devices were first tested with thegate electrodes floating at each respective concentration, pH, orelectrolyte composition in order to measure the intrinsic (i.e.,Vg = 0 V) nanochannel conductance. All electrical measure-ments were conducted in an earth-grounded Faraday cage.Dedicated devices for each type of electrolyte were used toavoid contamination, with the obvious exception of devicesused for electrolyte mixtures. Electrolyte solutions were
Figure 1. Device layout along with scanning electron microscope (SEM) images. (a) Schematic showing the different functional layers of thenanofluidic device. Two microchannels (8 μm deep × 50 μm wide × 3 cm long) served as reservoirs to a bank of three nanochannels (16 nm deep ×30 μm wide × 2.5 mm long). The micro- and nanochannel network was fabricated on a borosilicate glass substrate with individually addressable gold(Au) gate electrodes patterned on the glass cover. A polydimethylsiloxane (PDMS) dielectric layer supported on the glass cover isolated the gateelectrodes from the aqueous electrolytes in the nanochannels. (b) Side-view schematic of the nanochannel, showing the active gate electrode for thedata reported. Electrical connections are shown with yellow lines. (c) Scanning electron microscope (SEM) image of an open nanochannel crosssection. The slit-like channel cross section lies between the arrows. The dashed red lines denote the locations on the physical device where the SEMswere taken. The channel height was ∼16 nm, as expected from previous reports on device fabrication and characterization.19,42 (d) SEM image ofPDMS bonded to glass in regions where no channel is expected.
Analytical Chemistry Article
DOI: 10.1021/acs.analchem.6b03653Anal. Chem. 2017, 89, 1593−1601
1594

prepared for concentrations ranging from 0.01 to 100 mM atpH 7 ± 0.2. Each device was initially tested with deionizedwater (18 MΩ, 10−7 M salt) to provide the same baseline forcomparison between devices. Only devices with an initialdeionized (DI) conductance within 4.4 ± 0.5 pS were used forcomparison of results across devices as a function of cationtype. The gate was located at Lg = 0.43 ± 0.02L for all devices,where L is the length of the nanochannel, as dependence ofdevice operation on gate location has been reportedpreviously.19
After initial conductance measurements with deionizedwater, electrolyte concentrations were tested in ascendingorder of concentration. After the electrolyte concentration wasincreased, the device was thoroughly rinsed with the nexthighest concentration, similar to previously reported proce-dures.43 Monovalent electrolytes (KCl and NaCl) were testedat 6 concentrations including DI water and concentrationsranging from 0.01 to 100 mM in order of magnitudeincrements. Divalent electrolytes (CaCl2 and MgCl2) weretested at those concentrations with the addition of 0.33 and3.33 mM to match the ionic strength for KCl and NaCl at 1and 10 mM, respectively. Overall data trends were verified overmultiple devices with data for each experimental conditioncomprising several data runs over multiple days.
■ RESULTS AND DISCUSSIONThree nanofluidic channels with one active embedded gateelectrode connect two microchannel reservoirs (Figure 1). Theaxial potential, Va, drives ionic transport through the nano-channel. An independently controlled potential applied to thegate electrode, Vg, modified the local surface charge density(and electric field) at the dielectric−electrolyte interfaceenabling field-effect control over ionic transport, quantified bychanges in the measured current.Cation Dependence. The intrinsic nanochannel device
conductance (Ga = I/Va) was first measured with Vg = 0 V as afunction of cation type (Figure 2a,b) at pH = 7 ± 0.2. Inagreement with previous results for KCl4,44,45 and anomaloustransport of NaCl with respect to KCl,43 the two monovalentcations showed similar intrinsic (i.e., Vg = 0 V) conductance(Ga). Ga for both KCl and NaCl followed known surface chargegoverned (SCG) transport at cbulk < ∼1 mM and had a linear
dependence on concentration at cbulk > ∼1 mM indicating bulktransport behavior.To satisfy electroneutrality, the total space charge within the
nanochannel volume must balance the total surface charge onthe nanochannel walls. Ga is thus the summation of the surfacecharge governed and the bulk conductance,16,44
∑μ σ
μ= + =| |
++
=
G G Gw
LFwh
Lz c
2a SCG bulk
i
m
i i ibulk
1
2
(1)
where σ is the surface charge density (negative for both PDMSand glass) on the nanochannel walls, μi is the mobility ofspecies i, ci
bulk is the bulk electrolyte concentration, and w, L,and h are the channel width, length, and height, respectively.28
The dominant term in eq 1 (GSCG or Gbulk) depends on the bulkelectrolyte concentration.28,44 At the transition concentration,ct, the bulk and SCG conductances are similar.Three of the nanochannel walls in our device are borosilicate
glass, and one is PDMS supported on borosilicate glass. It isworth noting that the surface charge governed transport of KCldemonstrated in our PDMS−glass device has been reported fora wide variety of nanofluidic devices4,44−46 showing that thebaseline data trends for the most commonly studied electrolytefor these types of devices match those reported previously.In contrast to NaCl and KCl, CaCl2 and MgCl2 showed
cation dependent intrinsic conductance behavior as a functionof electrolyte concentration that deviated from the well-knownKCl intrinsic conductance profile. Ga for CaCl2 and MgCl2(Figure 2b) was independent of bulk concentration at cbulk ≤∼0.1 mM, also suggesting SCG transport for divalent cations.Intrinsic conductance of MgCl2 showed a marked decreasefrom 4.5 pS at cbulk = 0.1 mM to 1.2 pS at cbulk = 1 mM. CaCl2conductance decreased from 4.0 pS for cbulk = 1 mM to 0.8 pSfor cbulk = 3.33 mM showing a change in conductance per unitconcentration of 1.37 pS/mM for CaCl2 and 3.67 pS/mM forMgCl2 before transitioning to linear concentration dependencein the bulk transport regime.Since, Ga is proportional to σ for dilute electrolyte solutions
(i.e, in the surface charge governed regime),3,4,28,43−45 thedecrease in Ga for divalent ions corresponds to ∼3.75×reduction in σ for MgCl2 between cbulk = 0.1 mM and cbulk = 1mM and ∼5× reduction in σ for CaCl2 between cbulk = 1 mMand cbulk = 3.33 mM. As shown in Figure 2b, two distincttransition concentrations were observed for intrinsic con-ductance of divalent cations: (i) sharp reduction in intrinsicconductance at concentrations that would typically correspondto SCG behavior for monovalent cations with ca ≈ 0.1 mM forMgCl2 and ca ≈ 1 mM for CaCl2 and (ii) the subsequenttransition from this reduced conductance to bulk transportbehavior with increasing concentration observed at ct ≈ 1 mMfor MgCl2 and ct ≈ 3.33 mM for CaCl2. We hypothesize thatthe observed reduction in measured intrinsic conductance isdue to reduction of σ caused by ion−surface interactions,providing further support of this claim below.
Conductance of Gated Nanochannels. Changes in thelocal surface charge density and electric field were induced bythe gate electrode to modulate ionic transport and, therefore,the measured current.3,4,32,33 To our knowledge, this is the firstsystematic comparison of gating across electrolyte types and,further, the first presentation of gating data for NaCl, MgCl2,and CaCl2. It is worth noting that gating of ionic transport isessential to numerous analytical applications as discussed in theintroduction. The current was monitored at electrolyte
Figure 2. Cation depedent intrinsic nanochannel conductance,measured with the gate electrode floating (Vg = 0 V). (a) The twomonovalent cations showed similar intrinsic conductance in agreementwith previous results for anomalous transport of NaCl with respect toKCl.43 (b) The decrease in conductance from expected surface chargegoverned behavior at ca ≈ 0.1 mM for MgCl2 and ca ≈ 1 mM for CaCl2is caused by a decrease in the magnitude of the surface charge density,due to ion−surface interactions between divalent cations and thenegatively charged walls as discussed in the main text. The dashed linesare intended as eye-guides.
Analytical Chemistry Article
DOI: 10.1021/acs.analchem.6b03653Anal. Chem. 2017, 89, 1593−1601
1595

concentrations between 0.01 and 100 mM for +3 V ≤ Vg ≤−3 V at a fixed axial potential (Va).
19 A representative plot ofmeasured current as a function of gate voltage for variouscations is shown in Figure S1.Following previously reported analysis for gated devices,5,37
the total measured current arises from two components and canbe written as I = GaVa + GgVg. Here, Ga is the intrinsicnanochannel conductance (Vg = 0) and Gg is the trans-conductance (dI/dVg).
5,19,37 To further verify that the twocomponents of the current were independent, transconduc-tance data was taken at Va = 3 V and Va = 5 V for all data sets.The dimensionless conductance ratio, Gg/Ga, compares the
transconductance to the intrinsic nanochannel conductance(Figure 3). For the monovalent cations, the maximum value of
Gg/Ga was observed at the transition concentration, ct ≈ 1 mM(i.e., the transition between surface charge governed and bulktransport). Limited gating was observed for KCl and NaCl atconcentrations that correspond to bulk intrinsic conductancebehavior (that is, 10 and 100 mM here). The data trendsreported here for Gg/Ga (and for Ga as noted above) for KClare consistent with previously reported results for KCl in TiO2nanopores and HCl in silica nanopores.5,37 Similar to theintrinsic conductance (Figure 2), no significant cation depend-ence was observed between KCl and NaCl within experimentalerror as shown in Figure 3a. Our results show that NaCl followsthe same concentration dependent gating behavior as the othermonovalent symmetric electrolytes reported previously,5,37 withthe maximum conductance ratio (Gg/Ga) at the transitionconcentration to bulk electrolyte transport.As with intrinsic conductance, cation dependent behavior
was observed for Gg/Ga for CaCl2 and MgCl2. For MgCl2,Gg/Ga at cbulk = 0.1 mM was 0.2 compared to ∼0.6 formonovalent ions even though KCl, NaCl, and MgCl2 havecomparable Ga at 0.1 mM. Starting at 0.1 mM, gate modulationincreased with concentration for MgCl2, with the maximumvalue of Gg/Ga at 1 mM, which is the transition concentrationto bulk transport behavior for MgCl2.For CaCl2, Gg/Ga showed a local maxima at 3.33 mM, which
is the transition concentration to bulk transport behavior.Gg/Ga for Ca
2+ decreased from 0.9 at 0.33 mM to ∼0.3 at 1mM (which was transition from SCG to the reducedconductance, ca). Consequently, the gate electrode showedreduced modulation for both divalent ions at their respectivevalues of ca (0.1 mM for MgCl2 and 1 mM for CaCl2). Near thisconcentration (ca), ion−surface interactions reduce the surface
charge density, as discussed above, and appear to limit thecurrent modulation under gating conditions (Figure 3b).In contrast to Mg2+, a second maxima was observed for
CaCl2 at 0.33 mM. This second maxima was observed forCaCl2 and not MgCl2 likely since all concentrations used in thegating experiments fall within the concentration range whereion−surface interactions regulate the surface charge density forMgCl2 (ca = 0.1 mM for MgCl2) but not for CaCl2 (ca = 1 mMfor CaCl2). At concentrations c > ct, bulk transport behavior isknown to dominate; thus, modulation of the surface chargedensity will have a limited impact on nanochannel conductance,and ion−surface interactions are expected to effect themagnitude of Gg/Ga in the range of ca−ct.
Electrolyte Mixtures. Most practical applications and realbiological systems contain electrolyte solutions comprisingmultiple ionic species. However, systematic study of trans-conductance for electrolyte mixtures has not yet been reported.KCl and CaCl2 were selected for comparison given the broaderset of knowledge existing for these two electrolytes and the vitalrole of calcium ions in many biological systems with nanoscalecritical length scales.10,47,48 Electrolyte mixtures of KCl andCaCl2 were evaluated at pH = 7 ± 0.2 at a fixed ionic strengthto ensure a consistent Debye length across experiments. Therelative composition of the electrolyte solution was altered from0% CaCl2 (i.e., 1 mM KCl) to 100% CaCl2 (0.33 mM CaCl2)with a complete summary of the prepared electrolytecompositions in Table S1. The highest measured Ga (Figure4a) was at 0% CaCl2. As CaCl2 percentage was increased from
0% to 25%, the intrinsic conductance decreased from ∼2.8 to1.4 pS. Further increasing the CaCl2 percentage from 25% to50% caused the intrinsic conductance to decrease from 1.4 to1.2 pS, with no measured change beyond 50% CaCl2.Therefore, starting at 25% Ca2+ in the solution, Ga wasindependent of K+ concentration.With 0% CaCl2 as the baseline, Ga was estimated as a
function of electrolyte composition by assuming a constantsurface charge density across electrolyte compositions43−45 andthat the proportion of K+ to Ca2+ in the bulk was preserved inthe nanochannel18 (Supporting Information). The estimatedvalues for Ga did not match experimentally measured Ga as
Figure 3. Conductance ratio as a function of cation type for (a)monovalent cations and (b) divalent cations. The conductance ratioGg/Ga is a nondimensional parameter that compares the trans-conductance, Gg, to the intrinsic nanochannel conductance, Ga. Thedashed lines are intended as an eye-guide.
Figure 4. Intrinsic nanochannel conductance and deduced surfacecharge density for electrolyte mixtures. (a) The measured intrinsicnanochannel conductance as a function of electrolyte composition fora fixed ionic strength of 1 mM. The estimated values for intrinsicconductance were calculated using 0% CaCl2 as a baseline case andassuming a constant surface charge density. (b) The deduced surfacecharge density as a function of electrolyte composition calculated fromthe measured intrinsic nanochannel conductance at each electrolytecomposition and eqs S3, S5, S6, and S8. The surface charge density foreach electrolyte composition (σEC) is shown relative to the surfacecharge density for the 0% CaCl2, or 1 mM KCl, case (σ0).
Analytical Chemistry Article
DOI: 10.1021/acs.analchem.6b03653Anal. Chem. 2017, 89, 1593−1601
1596

shown in Figure 4a, indicating that one or both of the mainassumptions (i.e., constant surface charge density acrosselectrolyte compositions or the relative concentrations of K+
to Ca2+ in the nanochannel match the relative concentration inthe bulk) may be problematic for matching theoreticalestimates to the experimental measurements. The differencebetween the measured and estimated values is not explained bythe ratio of K+ to Ca2+ in the nanochannel alone, as theestimated and measured intrinsic conductances for 100% CaCl2also did not match. Therefore, the constant surface chargedensity and, consequently, the constant space charge densityassumption fails for Ga in the case of KCl + CaCl2 mixtures.Instead, using the measured Ga at each electrolyte
composition, the surface charge density was estimated as afunction of electrolyte composition relative to the 0% CaCl2case (Supporting Information). The estimated relative σ (TableS2) showed that the magnitude of σ decreased by more than1/2 as CaCl2 composition goes from 0% to 25% (Figure 4b).As the relative concentration was increased beyond 25% CaCl2,σ remained constant indicating Ca2+ is the dominating ion inthe mixture and regulates the surface charge.Similar to the trends in Figure 4a, introduction of Ca2+
suppressed transconductance (Gg) (Figure 5a). The highest Gg
was observed at 0% CaCl2 with approximately equivalenttransconductance for electrolyte compositions greater than 25%CaCl2. The decrease in Gg between 0% CaCl2 and 25% CaCl2was 43% compared to 68% for Ga. Considering Gg/Ga (Figure5b) and the above observations about the ability of the gate tomodulate conductance, it is likely that the effect of the gateelectrode is reduced at electrolyte compositions greater than25% CaCl2 because the gate is unable to manipulate the surfacepotential due to interactions between Ca2+ and the chargedwall. Electrostatic gating is known to alter the surfacepotential,4,19,41 which influences the local electrostatic andchemical interactions (including ion adsorption), and thus thenet surface charge density in the gated region.19,41
Electrolyte pH Manipulation. In addition to local controlover the surface charge density enabled by the gate electrode, itis well-known that σ can be manipulated by altering theelectrolyte pH. In order to further evaluate the surface chargeregulation hypothesis, the intrinsic nanochannel conductancewas measured as a function of pH for a representative 1 mMKCl and 0.33 mM CaCl2.
A detailed, multi-species numerical model was developed andimplemented using COMSOL Multiphysics for each electrolytesolution to estimate the surface charge density from themeasured conductance of the nanochannels as a function ofpH. The Poisson-Nernst-Planck equations for nanofluidictransport of four ions (H+, OH−, K+, Cl− or H+, OH−, Ca2+,Cl−) were solved, where σ was the fit parameter used to matchthe experimentally measured and simulated intrinsic con-ductances. A complete description of the modeling method-ology, which is consistent with several previous reports, is givenin the Supporting Information.21,49
As noted above, the nanofluidic device here comprises threeglass and one PDMS wall. Given that nanoscale transport isdirectly controlled by surface charge,4,44,45 especially at diluteelectrolyte concentrations (larger Debye lengths) in the surfacecharge governed regime, it is reasonable to expect that differentnanochannel walls could add another layer of complexity tonanofluidic transport. Moreover, it is known that theelectroosmotic velocity is different for PDMS microchannelscompared to glass microchannels.50,51 Capillary electrophoresisexperiments in microchannels have shown that the magnitudeof the zeta (ζ) potential for PDMS is between 0.25× and 0.75×the magnitude of the ζ potential for glass.51 For theexperimental conditions here, this difference in the magnitudeof the ζ potential corresponds to a ∼0.25−0.75× difference inthe magnitude of the surface charge density. On the other hand,some other previous reports have indicated that silica andPDMS have similar pK values and thus approximately the samechange in surface charge density as a function of pH.24,52
Therefore, we systematically evaluate the effect of heteroge-neous wall charge on intrinsic nanochannel conductancethrough a detailed, parametric numerical calculation.Two numerical models were implemented using COMSOL
for each electrolyte as a function of pH to determine the effectof likely unequal surface charge density of PDMS and glass.The first COMSOL model considered a homogeneous surfacecharge distribution (σPDMS = σglass) and the second consideredthe most extreme expected difference in surface charge densitybetween the top and bottom walls, with a 4× higher surfacecharge density on the bottom (glass) wall compared to thesurface charge density of the top (PDMS) wall (4σPDMS = σglass).For both cases, the total surface charge was held constant as afunction of pH (i.e., (wL)σPDMS + (wL)σglass = constant). Inagreement with past results,21,49 the transport mechanism ofions in the present system was dominated by electromigration,with convection contributing to less than 7% of the totalconductance. As a result, the impact on measured conductancedue to induced variation in electroosmotic flow arising from thehybrid glass−PDMS system is likely negligible.Notably, for a fixed total surface charge, the intrinsic
conductance in the case of a homogeneous charge distributionand in the case of heterogeneous charge distribution betweenthe top (PDMS) and bottom (glass) walls differed by less than2% (Figure S4) showing that the intrinsic conductance isindependent of likely unequal surface charge density on the topand bottom walls. The intrinsic conductance, therefore, isdetermined by the total surface charge of all nanochannel wallsand the resulting space charge in the nanochannel volume as afunction of pH. Our observation that experimentally measuredGa and Gg/Ga for KCl match previously reported trends forhomogeneous nanochannels (discussed above) is supported bythe modeling results which indicate that the transport is
Figure 5. Transconductance and conductance ratio (Gg/Ga) as afunction of electrolyte composition at a fixed ionic strength of 1 mM.(a) The transconductance decreases as % CaCl2 was increased from0% to 25%, consistent with the trend for intrinsic conductance as afunction of electrolyte composition. (b) The conductance ratio (Gg/Ga) showed that gate modulation decreased with greater than 25%CaCl2, with an approximately constant value of Gg/Ga beyond 25%CaCl2.
Analytical Chemistry Article
DOI: 10.1021/acs.analchem.6b03653Anal. Chem. 2017, 89, 1593−1601
1597

governed by the total surface charge and the total change insurface charge.More work is needed to develop a strong understanding of
the impact of heterogeneous walls; however, the glass−PDMSheterogeneity does not appear to be a major factor for theintrinsic conductance reported here. Our data and modelsindicate that the transport is strongly (and as expected)dominated by the space charge in the nanochannel volume,which in turn is impacted by the total surface charge, i.e., aneffective charge density from all four walls enclosing the fluidvolume. In the case of transconductance, the gate electrodealters the local surface potential and/or surface charge densitywhich influences both electrostatic and chemical ion−surfaceinteractions. Ion−surface interactions in turn determine theeffective surface charge density and subsequently the spacecharge in the nanochannel volume. Quantification of specificion−surface interactions will require detailed information onsurface reactions and is further complicated by the lack ofexplicitly known surface reactions between ions and PDMS orions and borosilicate glass.17 Comprehensive studies evaluatinginfluence of heterogeneous nanochannel walls on nanochanneltransport are beyond the scope of this work and form topics forfuture investigations.The experimentally measured intrinsic nanochannel con-
ductance for 1 mM KCl and 0.33 mM CaCl2 as a function ofpH is plotted with the numerically computed intrinsicconductance in Figure 6a. The corresponding computed value
of the effective surface charge density for all four walls at eachpH is shown in Figure 6b. It is worth noting for practicalapplications that the average surface charge density reportedhere, which governs the nanoscale ion transport at diluteelectrolyte concentrations, for PDMS−glass devices falls withinthe lower range for silica [∼−0.001 to −0.1 C/m2],4 which isknown to vary based on fabrication methods. The exper-imentally measured intrinsic conductance was independent ofpH for both electrolytes between pH 10 and pH 8 with similarintrinsic conductance measured for KCl at pH 10 and pH 8 andCaCl2 at pH 10 and pH 8, consistent with experimentalmeasurements for 1 mM KNO3 in microchannels.17 The nearlyconstant intrinsic conductance corresponds to a nearly constantvalue of the surface charge density for each electrolyte. This isin contrast with the classical behavior (see SupportingInformation), which predicts the surface charge density should
decrease with pH for both silica and PDMS between pH 8 andpH 1023,41,53 but does not consider ion−surface interactions.Notably, at pH 10, the computed value of the surface chargedensity for KCl filled nanochannels was ∼2.8× higher than thesurface charge density for CaCl2 filled nanochannels.Multi-valent and even monovalent ions in solution are
known to reduce the magnitude of the surface charge density ofungated micro- and nanofluidic channels as a function of ionvalence, electrolyte concentration, and the bare surface chargedensity (and thus pH).15,17,40 In the devices considered here,the magnitude of the bare surface charge density is highest atpH 10 and the magnitude of the surface charge density is likelyregulated by cation−surface interactions for both the 2:1 and1:1 electrolytes at pH 10, causing the experimentally observedplateau in the intrinsic conductance for KCl and CaCl2 betweenpH 10 and pH 8.As expected, the magnitude of the surface charge density
(derived from the intrinsic conductance data) decreased forboth KCl and CaCl2 filled channels from pH 8 to pH 7 andfrom pH 7 to pH 6, but with a lower magnitude of the surfacecharge density for CaCl2 filled nanochannels compared to KClfilled nanochannels. In contrast to KCl filled channels, theCaCl2 filled nanochannels were isoelectric at pH 6, indicatingdivalent cation−surface interactions reduce the magnitude ofthe surface charge density for pH ≥ 6.From the COMSOL model of the intrinsic conductance data,
the nanochannel surface was isoelectric for both KCl and CaCl2filled channels at pH ≤ 4 consistent with previous reportswhich indicate the isolectric point is pH 2−3 for glass20 and pH2−4 for PDMS.24,25 However, at pH 2, the numericallymodeled intrinsic conductance did not match the experimen-tally measured intrinsic nanochannel conductance. The increasein the computed conductance from the 4 species numericalmodel from pH 4 to pH 2 is due to the higher concentration ofH+ ions and the significantly higher mobility of H+ compared toK+ and Ca2+ (μH+ ≈ 5μK+ or μH+ ≈ 12μCa2+) since, at such lowpH, bulk transport behavior for HCl is expected.43
Interestingly, the increase in conductance due to H+ ions wasobserved experimentally for CaCl2 but not for KCl, though thecomputed conductance for CaCl2 at pH 2 was still ∼2.4× theexperimentally measured value. While the anomalous exper-imental result for KCl at pH 2 is in agreement with pastobservations of Duan and Majumdar,43 the discrepancybetween theory and experiments was attributed to an activeproton−cation exchange process56 and lack of incorporatingsize and layering effects in models for nanochannels withmultiple ionic species.57 Given that this anomalous transportbehavior for nanofluidic channels is a recent finding beginningwith the work of Duan and Majumdar,43 the discrepanciesbetween theory and experiments remains an active area ofresearch with little consensus in existing literature.57
The COMSOL model for the surface charge densityconfirmed that, at 0.33 mM CaCl2 and pH ≥ 6, Ca2+ regulatesthe value of the surface charge density, as discussed above. Inthe case of multi-valent ions, interactions between counterions(i.e., those with opposite polarity to the wall charge) in theelectrolyte with the charged wall and/or with each other areknown to cause charge inversion or the reversal of the polarityof the effective surface charge density at sufficiently highelectrolyte concentration.15,16,40 Charge inversion is generallyattributed to either transverse correlations between ions andcharged surface sites, including electrostatic interactions andchemical binding, or lateral ion−ion correlations (as in strongly
Figure 6. Use of solution pH to modify surface charge density. (a)Experimentally measured and numerically calculated intrinsic nano-channel conductance as a function of pH. (b) The average surfacecharge density computed with the numerical model. The surfacecharge density, σ, was the fit parameter used to match theexperimentally measured and simulated intrinsic conductances basedon well-established ion transport theory in nanochannels.49,54,55
Dashed lines are intended as eye-guides.
Analytical Chemistry Article
DOI: 10.1021/acs.analchem.6b03653Anal. Chem. 2017, 89, 1593−1601
1598

correlated liquid theory).16,40,58,59 Advanced numerical meth-ods60 such as molecular dynamics simulations61−63 includeeffects of the discrete nature of charged surface sites,40,59,64
ions,40,64 water molecules,40,64 and size effects.40,64,65 However,no consensus exists with regard to the actual mechanism bywhich charge inversion occurs for divalent ions or the criticalelectrolyte concentration for charge inversion. Past reports fornanochannels indicate that the critical concentration for 2:1electrolytes is 350 mM or higher15,40,66 while one recent workreported charge inversion for 10 mM MgCl2 in agreement withthe predicted critical concentration for strongly correlatedliquid (SCL) theory.16
Notably, the applicability of SCL theory is determined by themagnitude of ion−ion correlations, which is quantified by theinteraction parameter.15,59,67,68 The interaction parameterdepends on the magnitude of the bare surface charge densityand the ion valence. Considering the value of the interactionparameter for the system reported here (see SupportingInformation) and the concentration range used in this work(pH data for 0.33 mM CaCl2 with relevant transitions observedwell below even 10 mM), neither lateral correlations (i.e., ion−ion interactions) nor charge inversion are expected in oursystem and have therefore not been considered in theCOMSOL model. The surface charge regulation at pH ≥ 6evident from the pH dependent intrinsic conductance of CaCl2is therefore attributed to transverse ion−surface correla-tions.40,59,67
As now expected, transconductance of the divalent cation(Figure 7) Ca2+ as a function of pH showed significantly
different behavior than the monovalent K+ ion. Ga for K+
between pH 8 and pH 10 was nearly independent of pH(Figure 6a), with a similar trend for Ca2+ filled nanochannels.However, Gg for K
+filled channels increased from pH 6 to pH
8, before sharply decreasing at pH 10. Interestingly, as pH wasincreased from pH 6 to pH 10, the Ca2+ followed similar trendsas K+ with the Gg
CaCl2 < GgKCl at pH 8, further suggesting that
Ca2+ limits modulation of the surface potential at thedielectric−fluid interface by the gate electrode. Ca2+ fillednanochannels showed the highest measured Gg at pH 2, in-linewith Ga trends, which likely indicate increased concentration ofH+ in the diffuse layer for CaCl2 at pH 2. In contrast, Gg (andGa) remains nearly unchanged between pH 2 and pH 6 forKCl.
■ SUMMARY AND CONCLUSIONS
This paper presented for the first time a systematic comparisonof cation dependent transconductance as a function ofmonovalent, divalent, and polyvalent mixtures for gatednanochannels, where local change in the surface potential atthe dielectric−fluid interface was induced by an embedded gateelectrode. A broad parametric study with 16 nm deepnanochannels for a large range of evaluated electrolyteconcentrations (10−7−10−1 M), one of the widest reportedpH ranges (pH 2−10), and electrolyte mixtures, with firstreported transconductance for NaCl, CaCl2, and MgCl2,demonstrated that systematic changes in local electrostaticsurface state are impacted by ion−surface interactions fordivalent cations at pH ≥ 6, and the resulting nanoscale iontransport is strongly affected by cation type in a gatednanofluidic device. Results for KCl were in agreement withprevious reports on gated nanofluidic transport of KCl and HClestablishing a viable baseline for the devices reported here, yetseveral new and unexpected observations were noted alongwith critical implications for nanofluidic transport andsubsequent use of these devices in analytical systems.Conductance decreased for MgCl2 and CaCl2 at concen-
trations typically associated with surface charge governedtransport for monovalent electrolytes, suggesting a decreasein the total surface charge density due to divalent cation−surface interactions. Consequently, addition of divalent ions canbe used to regulate the effective surface charge density andthereby directly affect the nanochannel conductance.A multi-species numerical model used to compute the surface
charge density confirmed that ion−surface interactions had asignificant impact on the surface charge density at pH ≥ 6 forCaCl2. Data from KCl and CaCl2 electrolyte mixtures clearlyindicated that Ca2+ in the mixture is the dominating ion asdetermined by a decrease in surface charge density when CaCl2was added (between 0% CaCl2 composition and 25% CaCl2composition) and a surface charge density that wasindependent of KCl concentration for % CaCl2 > 25%. Thetransconductance data further suggests the surface chargeregulation by Ca2+ at % CaCl2 > 25% limits the ability of thegate electrode to modulate the potential at the dielectric−fluidinterface. Ion−surface interactions between the charged wallsand the divalent cations in the electrolyte regulate the surfacecharge density and consequently limit the ability of the gateelectrode to alter the net surface charge density and modulatenanochannel conductance.Our several new experimental observations, supporting
models, and detailed discussion of data trends includingmatching with existing data show evidence of surface chargeregulation by divalent cations for negatively charged nano-channel walls with potentially significant impact on how suchdevices can be used to construct analytical devices performinglogic operations at the nanoscale.19 Further quantification ofspecific ion−surface interactions will require detailed informa-tion on surface reactions and is further complicated by the lackof explicitly known surface reactions between ions and PDMSor ions and borosilicate glass.17 Therefore, conductance modelsof gated nanofluidic channels that include effects of bothelectrostatic and chemical ion−surface interactions continue tobe a challenge.
Figure 7. Transconductance as a function of pH for 1 mM KCl and0.33 mM CaCl2 with equivalent ionic strength for both solutions. Alocal maximum for the transconductance was observed at pH = 8. Thetransconductance increased between pH 4 and pH 2 for CaCl2 inagreement with observed trends for intrinsic nanochannel conductanceas a function of pH. The dashed lines are intended as eye-guides only.
Analytical Chemistry Article
DOI: 10.1021/acs.analchem.6b03653Anal. Chem. 2017, 89, 1593−1601
1599
■ ASSOCIATED CONTENT*S Supporting InformationThe Supporting Information is available free of charge on theACS Publications website at DOI: 10.1021/acs.anal-chem.6b03653.
Further data demonstrating the dependence of measuredcurrent on gate voltage, characterization of gate leakagecurrent, details on analytical analysis of electrolytemixtures, calculation of the interaction parameter, anddetails on the numerical model implemented inCOMSOL that examines the effect of possibleheterogeneous surface charge density of the top andbottom walls as well as pH dependence of nanochannelconductance (PDF)
■ AUTHOR INFORMATIONCorresponding Author*E-mail: [email protected] K. Rangharajan: 0000-0002-9932-2856Author ContributionsM.F. and S.P. conceived and designed the experiments,analyzed the data, and wrote the paper. M.F. and C.B.performed the experiments. K.K.R. and A.T.C. contributedmaterials and analysis tools to the manuscript. All authorsreviewed and contributed to the final manuscript.NotesThe authors declare no competing financial interest.
■ ACKNOWLEDGMENTSThe authors acknowledge the staff at Nanotech WestLaboratories at The Ohio State University for assistance withequipment during fabrication and characterization of devices.The authors would like to acknowledge partial financial supportfrom the US Army Research Office (ARO) through grantW911NF09C0079 and the National Science Foundation(NSF) through grant CBET-1335946. M.F. would like tothank the NSF graduate research fellowship program (GRFP)for support.
■ REFERENCES(1) van der Heyden, F. H. J.; Bonthuis, D. J.; Stein, D.; Meyer, C.;Dekker, C. Nano Lett. 2006, 6, 2232−2237.(2) Prakash, S.; Yeom, J. Nanofluidics and Microfluidics: Systems andApplications; William Andrew: Norwich, NY, 2014.(3) Guan, W.; Fan, R.; Reed, M. A. Nat. Commun. 2011, 2, 506.(4) Karnik, R.; Fan, R.; Yue, M.; Li, D.; Yang, P.; Majumdar, A. NanoLett. 2005, 5, 943−948.(5) Nam, S. W.; Rooks, M. J.; Kim, K. B.; Rossnagel, S. M. Nano Lett.2009, 9, 2044−2048.(6) Prakash, S.; Pinti, M.; Bhushan, B. Philos. Trans. R. Soc., A 2012,370, 2269−2303.(7) Hou, X.; Guo, W.; Jiang, L. Chem. Soc. Rev. 2011, 40, 2385−2401.(8) Hille, B. Ionic Channels of Excitable Membranes, Third ed.; SinauerAssociates, Inc.: Sunderland, MA, 2001; p 607.(9) Peters, C. J.; Yu, H.; Tien, J.; Jan, Y. N.; Li, M.; Jan, L. Y. Proc.Natl. Acad. Sci. U. S. A. 2015, 112, 3547−3552.(10) Li, W.; Aldrich, R. W. Proc. Natl. Acad. Sci. U. S. A. 2011, 108,5946−5953.(11) Bichet, D.; Haass, F. A.; Jan, L. Y. Nat. Rev. Neurosci. 2003, 4,957−967.(12) Aguilella, V. M.; Verdia-Baguena, C.; Alcaraz, A. Phys. Chem.Chem. Phys. 2014, 16, 3881−3893.
(13) Lorinczi, E.; Gomez-Posada, J. C.; de la Pena, P.; Tomczak, A.P.; Fernandez-Trillo, J.; Leipscher, U.; Stuhmer, W.; Barros, F.; Pardo,L. A. Nat. Commun. 2015, 6, 6672.(14) Tang, L.; Gamal El-Din, T. M.; Payandeh, J.; Martinez, G. Q.;Heard, T. M.; Scheuer, T.; Zheng, N.; Catterall, W. A. Nature 2014,505, 56−61.(15) van der Heyden, F. H. J.; Stein, D.; Besteman, K.; Lemay, S. G.;Dekker, C. Phys. Rev. Lett. 2006, 96, 224502.(16) Li, S. X.; Guan, W.; Weiner, B.; Reed, M. A. Nano Lett. 2015, 15,5046−5051.(17) Datta, S.; Conlisk, A. T.; Li, H. F.; Yoda, M. Mech. Res. Commun.2009, 36, 65−74.(18) Martins, D. C.; Chu, V.; Conde, J. P. Biomicrofluidics 2013, 7,034111.(19) Fuest, M.; Boone, C.; Rangharajan, K. K.; Conlisk, A. T.;Prakash, S. Nano Lett. 2015, 15, 2365−2371.(20) Cheng, L.-J.; Guo, L. J. ACS Nano 2009, 3, 575−584.(21) Rangharajan, K. K.; Fuest, M.; Conlisk, A. T.; Prakash, S.Microfluid. Nanofluid. 2016, 20, 54.(22) Kalman, E. B.; Sudre, O.; Vlassiouk, I.; Siwy, Z. S. Anal. Bioanal.Chem. 2009, 394, 413−419.(23) Behrens, S. H.; Grier, D. G. J. Chem. Phys. 2001, 115, 6716−6721.(24) Kirby, B. J.; Hasselbrink, E. F. Electrophoresis 2004, 25, 187−202.(25) Beattie, J. K. Lab Chip 2006, 6, 1409−1411.(26) Karnik, R.; Castelino, K.; Majumdar, A. Appl. Phys. Lett. 2006,88, 123114.(27) Paik, K. H.; Liu, Y.; Tabard-Cossa, V.; Waugh, M. J.; Huber, D.E.; Provine, J.; Howe, R. T.; Dutton, R. W.; Davis, R. W. ACS Nano2012, 6, 6767−6775.(28) Guan, W.; Li, S. X.; Reed, M. A. Nanotechnology 2014, 25,122001.(29) Prakash, S.; Conlisk, A. T. Lab Chip 2016, 16, 3855−3865.(30) Pardon, G.; van der Wijngaart, W. Adv. Colloid Interface Sci.2013, 199−200, 78−94.(31) Lee, S. H.; Lee, H.; Jin, T.; Park, S.; Yoon, B. J.; Sung, G. Y.;Kim, K. B.; Kim, S. J. Nanoscale 2015, 7, 936−946.(32) Liu, Y.; Huber, D. E.; Tabard-Cossa, V.; Dutton, R. W. Appl.Phys. Lett. 2010, 97, 143109.(33) Jin, X.; Aluru, N. R. Microfluid. Nanofluid. 2011, 11, 297−306.(34) Singh, K. P.; Kumari, K.; Kumar, M. J. Appl. Phys. 2011, 110,084301.(35) Feng, J.; Graf, M.; Liu, K.; Ovchinnikov, D.; Dumcenco, D.;Heiranian, M.; Nandigana, V.; Aluru, N. R.; Kis, A.; Radenovic, A.Nature 2016, 536, 197−200.(36) Liu, Y.; Yobas, L. ACS Nano 2016, 10, 3985−3994.(37) Fan, R.; Huh, S.; Yan, R.; Arnold, J.; Yang, P. Nat. Mater. 2008,7, 303−307.(38) Joshi, P.; Smolyanitsky, A.; Petrossian, L.; Goryll, M.; Saraniti,M.; Thornton, T. J. J. Appl. Phys. 2010, 107, 054701.(39) Jiang, Z.; Stein, D. Physical Review E: Statistical, Nonlinear, andSoft Matter Physics 2011, 83, 031203.(40) Lorenz, C. D.; Travesset, A. Phys. Rev. E 2007, 75, 061202.(41) Jiang, Z.; Stein, D. Langmuir 2010, 26, 8161−8173.(42) Pinti, M.; Kambham, T.; Wang, B.; Prakash, S. J. Nanotechnol.Eng. Med. 2013, 4, 020905.(43) Duan, C.; Majumdar, A. Nat. Nanotechnol. 2010, 5, 848−852.(44) Schoch, R. B.; Renaud, P. Appl. Phys. Lett. 2005, 86, 253111.(45) Stein, D.; Kruithof, M.; Dekker, C. Phys. Rev. Lett. 2004, 93,035901.(46) Shin, S.; Kim, B. S.; Song, J.; Lee, H.; Cho, H. H. Lab Chip2012, 12, 2568−2574.(47) Xia, X. M.; Fakler, B.; Rivard, A.; Wayman, G.; Johnson-Pais, T.;Keen, J. E.; Ishii, T.; Hirschberg, B.; Bond, C. T.; Lutsenko, S.; Maylie,J.; Adelman, J. P. Nature 1998, 395, 503−507.(48) Jensen, M. O.; Jogini, V.; Borhani, D. W.; Leffler, A. E.; Dror, R.O.; Shaw, D. E. Science 2012, 336, 229−233.
Analytical Chemistry Article
DOI: 10.1021/acs.analchem.6b03653Anal. Chem. 2017, 89, 1593−1601
1600

(49) Vlassiouk, I.; Smirnov, S.; Siwy, Z. Nano Lett. 2008, 8, 1978−1985.(50) Cellar, N. A.; Kennedy, R. T. Lab Chip 2006, 6, 1205−1212.(51) Roman, G. T.; Hlaus, T.; Bass, K. J.; Seelhammer, T. G.;Culbertson, C. T. Anal. Chem. 2005, 77, 1414−1422.(52) Ocvirk, G.; Munroe, M.; Tang, T.; Oleschuk, R.; Westra, K.;Harrison, D. J. Electrophoresis 2000, 21, 107−115.(53) Ma, Y.; Yeh, L.-H.; Lin, C.-Y.; Mei, L.; Qian, S. Anal. Chem.2015, 87, 4508−4514.(54) Daiguji, H.; Yang, P.; Majumdar, A. Nano Lett. 2004, 4, 137−142.(55) Jin, X.; Joseph, S.; Gatimu, E. N.; Bohn, P. W.; Aluru, N. R.Langmuir 2007, 23, 13209−13222.(56) Raider, S. I.; Gregor, L. V.; Flitsch, R. J. Electrochem. Soc. 1973,120, 425−431.(57) Gillespie, D. Microfluid. Nanofluid. 2015, 18, 717−738.(58) Besteman, K.; Zevenbergen, M. A. G.; Heering, H. A.; Lemay, S.G. Phys. Rev. Lett. 2004, 93, 170802.(59) Faraudo, J.; Travesset, A. J. Phys. Chem. C 2007, 111, 987−994.(60) Conlisk, A. T. Essentials of Micro- and Nanofluidics, 1st ed.;Cambridge University Press: New York, 2013; p 552.(61) Prakash, S.; Zambrano, H. A.; Rangharajan, K. K.; Rosenthal-Kim, E.; Vasquez, N.; Conlisk, A. T. Microfluid. Nanofluid. 2016, 20, 8.(62) Prakash, S.; Zambrano, H. A.; Fuest, M.; Boone, C.; Rosenthal-Kim, E.; Vasquez, N.; Conlisk, A. T. Microfluid. Nanofluid. 2015, 19,1455−1464.(63) Zambrano, H. A.; Pinti, M.; Conlisk, A. T.; Prakash, S.Microfluid. Nanofluid. 2012, 13, 735−747.(64) Qiao, R.; Aluru, N. R. Phys. Rev. Lett. 2004, 92, 198301.(65) Greberg, H.; Kjellander, R. J. Chem. Phys. 1998, 108, 2940−2953.(66) He, Y.; Gillespie, D.; Boda, D.; Vlassiouk, I.; Eisenberg, R. S.;Siwy, Z. S. J. Am. Chem. Soc. 2009, 131, 5194−5202.(67) Shklovskii, B. I. Phys. Rev. E: Stat. Phys., Plasmas, Fluids, Relat.Interdiscip. Top. 1999, 60, 5802−5811.(68) Grosberg, A. Y.; Nguyen, T. T.; Shklovskii, B. I. Rev. Mod. Phys.2002, 74, 329−345.
Analytical Chemistry Article
DOI: 10.1021/acs.analchem.6b03653Anal. Chem. 2017, 89, 1593−1601
1601