cathodic protection of steel framed masonry structures...
TRANSCRIPT

Cathodic protection of steel framed masonry structures - experimental and numerical studies
LAMBERT, Paul <http://orcid.org/0000-0002-2815-1674>, MANGAT, Pal <http://orcid.org/0000-0003-1736-8891>, O'FLAHERTY, Fin <http://orcid.org/0000-0003-3121-0492> and WU, You-Yo
Available from Sheffield Hallam University Research Archive (SHURA) at:
http://shura.shu.ac.uk/3049/
This document is the author deposited version. You are advised to consult the publisher's version if you wish to cite from it.
Published version
LAMBERT, Paul, MANGAT, Pal, O'FLAHERTY, Fin and WU, You-Yo (2008). Cathodic protection of steel framed masonry structures - experimental and numerical studies. Materials and structures, 41 (2), 301-310.
Copyright and re-use policy
See http://shura.shu.ac.uk/information.html
Sheffield Hallam University Research Archivehttp://shura.shu.ac.uk
Cathodic Protection of Steel Framed Structures P Lambert, P S Mangat & F J O’Flaherty, Centre for Infrastructure Management Y-Y Wu, Scott Wilson Sheffield Hallam University, Howard Street, Sheffield, S1 1WB, United Kingdom. Tel: +44 (0) 114 225 3525. Fax: +44 (0) 114 225 4546. E-Mail: [email protected]
1
Cathodic Protection of Steel Framed Masonry Structures - Experimental and Numerical Studies
P Lambert, P S Mangat & F J O’Flaherty
Centre for Infrastructure Management, Sheffield Hallam University, United Kingdom
Y-Y Wu
Scott Wilson, Royal Court, Basil Close, Chesterfield, United Kingdom
Abstract
Many high-profile steel-framed masonry buildings are susceptible to extensive damage as a result of
corrosion of the steel frame. This has resulted in serious consequences with respect to serviceability,
safety, aesthetics and heritage. Cathodic protection (CP) is a proven method for preventing and
protecting buried and submerged steel and reinforced concrete structures from corrosion. More
recently, the method has been introduced to prevent and control corrosion in steel-framed masonry
structures. However, despite several sizeable CP installations around the world, there are no formal
guidelines for the design, installation and operation of such systems and much of the knowledge is
based on empirical observations. This paper presents both experimental and numerical studies on the
cathodic protection of representative steel framed masonry structures. These studies are considered
essential in the understanding of the mechanisms of cathodic protection and the design of optimised
cathodic protection systems for such structures.
Keywords: corrosion, steel frame, cathodic protection, impressed current, numerical modelling.
INTRODUCTION
The identification of "Regent Street Disease" in the United Kingdom in the late 1970's first
highlighted the problems of the corrosion of iron and steel frames and other structural components
occurring on a significant number of the grand and often listed structures in many city centres [1]. This

2
form of steel-framed construction initially employed in Chicago and subsequently used in most US
and European cities in the first two decades of the 20th century, has resulted in problems with respect
to serviceability, safety, aesthetics and heritage. Cathodic protection, originally developed by
Humphry Davy [3] and later employed widely on buried and submerged structures, was first
considered for reinforced concrete in the late 1950's [4]. It was not until the development of improved
anode systems based on catalysed titanium and titanium oxide in the early 1980's [5] and the
considerable advances in digital operating systems that it became a viable commercial solution for
corrosion prevention. The transfer of CP to steel-framed buildings was somewhat slower and it was
not until 1997 that the first full structure was protected by electrochemical means [1]. Despite several
sizeable installations there are no formal guidelines for the design, installation and operation of such
systems and much of the knowledge is based on empirical observations [6].
Specific design standards for cathodic protection of steel-framed structures currently do not exist [2].
The existing standards such as NACE (2000), “Standard RP0290-2000, Impressed Current Cathodic
Protection of Reinforcing Steel in Atmospherically Exposed Concrete Structures” [7] and European
Standards (2000), “EN 12696:2000, Cathodic Protection of Steel in Concrete” [8] are not specific for
steel-framed masonry structures and are not directly applicable. In the absence of formal design
guidelines and standards specifically for the cathodic protection of steel-framed masonry structures, it
has become common practice for pilot schemes or trial installations to be employed in determining the
suitability and design of CP systems for such applications.
The finite element method and boundary element method have been used to analyse the protective
current and potential distribution of cathodically protected reinforced concrete structures [9] and
offshore or marine structures [10-13] respectively. More recently, the latter has been introduced to
analyse cathodic protection systems for steel-framed masonry structures [6], which is developed in this
paper. One of the major problems in understanding the mechanisms of cathodic protection in steel-
framed construction is the relatively complex geometry of the systems under consideration. No

3
information exists about current throw onto typical steel sections, yet this is fundamental to the design
of CP systems.
This paper presents both experimental and numerical studies on the distribution of protective current
and potential in representative cathodic protection systems for steel-framed masonry structures
whereby sand is employed to represent the masonry encasement. It is expected that the output from
this work, together with other studies to be published by the authors using masonry rather than sand,
will progress the development of this technology and contribute to the development of the formal
guidelines and standards for cathodic protection of steel framed masonry structures.
EXPERIMENTAL PROCEDURE
Model Impressed Current Cathodic Protection System
The principle and basic components of impressed current cathodic protection systems (ICCP) have
been well described [14]. Based on these, two ICCP systems for steel-framed masonry structures have
been constructed for analyzing the distribution of the protective potential and current. The main
components of the systems employed in this study are a manual power supply; discrete anodes based
on a titanium oxide ceramic; steel 'Ι' section specimens employed as the cathodes (see Figures 1 & 2)
and sandboxes fabricated from uPVC, 1 m square by 0.25 m in depth. Building sand was employed to
represent the masonry and was tamped in layers to ensure good compaction. The moisture content of
the sand was adjusted to achieve a resistivity within the range 10 to 50 kΩ.cm representing the range
commonly encountered in brick and stone masonry. Dependent upon the type of steel section, two
ICCP systems were constructed. For System A, where the cathode is steel section A representing a
stanchion, the test facility and its components are shown in Figures 3 and 4. System B, for which steel
section B was used as the cathode, was similar in set-up to System A but was buried horizontally to
represent a beam, as shown in Figure 5.
Each system was connected to a power supply and monitoring equipment and energised. There are two
common methods of controlling ICCP systems. One is to keep the output voltage constant and allow

4
the current to alter in order to maintain the set potential. The other method is to fix the current and
allow the potential to float. In this work, the former approach of fixed potential was employed. Once
the output current became stable, the distribution of protective potential was measured by means of a
standard copper/copper sulphate reference electrode suitable for use in direct contact with sand.
Measurements of Protective Potential
The potential distribution on a grid of sandbox free surface was measured under a range of test
conditions, including the various anode coordinates, sand resistivities and output currents, by moving a
hand-held copper/copper sulphate reference electrode over the surface. It should be noted that such
measured potentials do not represent the actual protective potential values on the surface of the steel
section. They incorporate a potential drop or IRΩ. In order to obtain the value of the IRΩ-free CP
protective potential on the surface of steel, the instant-off potential method is employed, whereby the
current is briefly interrupted (turned off) and a value of potential taken immediately afterwards whilst
no current is flowing and there is, therefore, no potential drop. The power is then reapplied. As the
steel section has a very complex geometry, it is not possible to accurately measure every point on the
steel surface. Due to this limitation, only the protective potential at selected points on the top surface
of the steel section was measured.
BOUNDARY ELEMENT METHOD
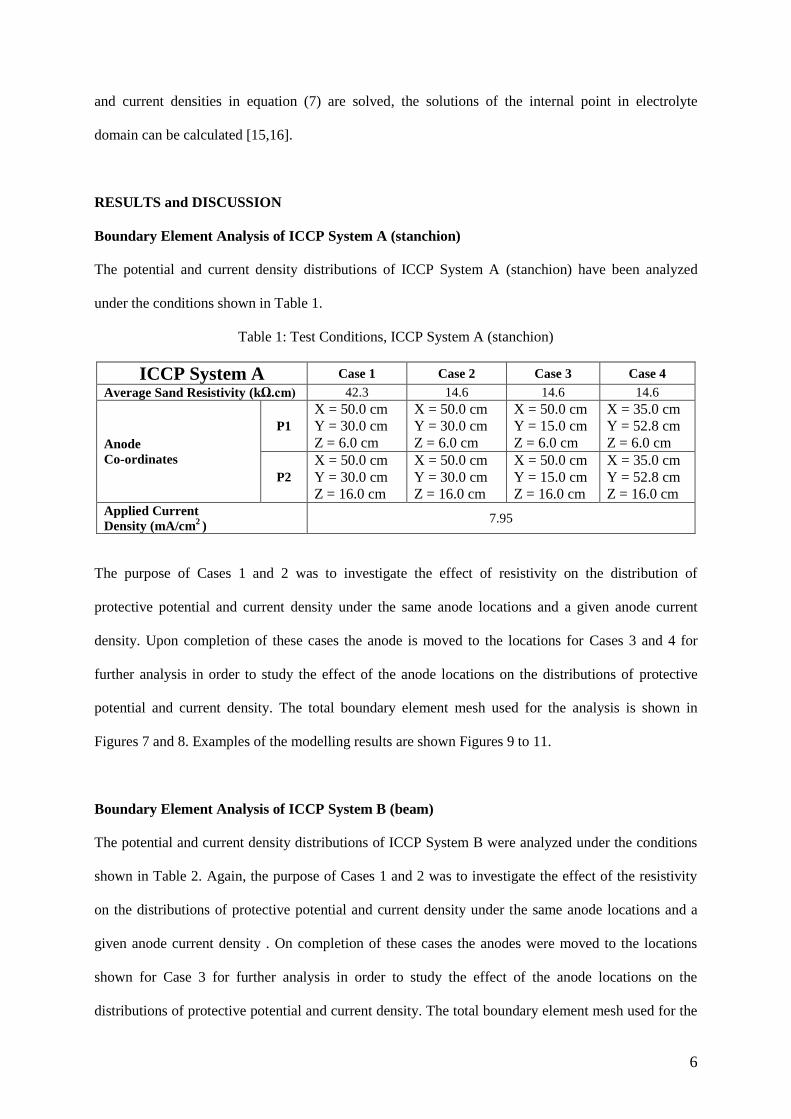
For a uniform isotropic electrolyte, the flow of current can be shown to obey the following Laplace
equation, as represented in Figure 6 [10 - 13]:
k 2E (p) = 0 p (1)
Where E is the potential at any p (x, y, z) of domain
k is the conductivity of electrolyte
is the problem domain

5
The problem in cathodic protection is to solve the above Laplace equation subject to the following
boundary conditions:
E = E0 on Γ1 (2)
i = kn
E
= i0 on Γ2 (3)
ia=-fa(Ea) on Γa (4)
ic=- fc(Ea) on Γc (5)
where Γ(=Γ1+ Γ2+ Γa + Γc ) is the surface of the electrolyte domain , E0 and i0 are the prescribed
values of potential and current density respectively. Equations (4) and (5) describe the relationship
between the potential E and current density i on the anode surface and cathode surface separately,
known as the polarisation curves, and are experimentally determined. A series of linear algebraic
equations are generated which may be written in matrix notation [15,16]:
HE=Gi (6)
where H and G are the (n x n) square matrices, called the influence matrices, and E and i contains the
nodal potential vectors and the nodal normal current density vectors separately. Rearranging equation
(6) to get all known values on the right-hand side and then multiplying out, and all unknown values on
the left-hand side, gives:
AX=F (7)
where A is the coefficient matrix, X is the vector of the unknown values of potential and current
density on the boundaries, and F is an independent vector. For the linear boundary conditions, the
above equation can be solved by Gauss Elimination or LU Decomposition. However, in practice the
boundary conditions on the anodes and cathodes are represented by the non-linear polarisation curves.
Equation (7) is, therefore, solved by an interactive procedure [12,17]. After all values of the potential
6
and current densities in equation (7) are solved, the solutions of the internal point in electrolyte
domain can be calculated [15,16].
RESULTS and DISCUSSION
Boundary Element Analysis of ICCP System A (stanchion)
The potential and current density distributions of ICCP System A (stanchion) have been analyzed
under the conditions shown in Table 1.
Table 1: Test Conditions, ICCP System A (stanchion)
ICCP System A Case 1 Case 2 Case 3 Case 4 Average Sand Resistivity (kΩ.cm) 42.3 14.6 14.6 14.6
Anode Co-ordinates
P1 X = 50.0 cm Y = 30.0 cm Z = 6.0 cm
X = 50.0 cm Y = 30.0 cm Z = 6.0 cm
X = 50.0 cm Y = 15.0 cm Z = 6.0 cm
X = 35.0 cm Y = 52.8 cm Z = 6.0 cm
P2 X = 50.0 cm Y = 30.0 cm Z = 16.0 cm
X = 50.0 cm Y = 30.0 cm Z = 16.0 cm
X = 50.0 cm Y = 15.0 cm Z = 16.0 cm
X = 35.0 cm Y = 52.8 cm Z = 16.0 cm
Applied Current Density (mA/cm2 )
7.95
The purpose of Cases 1 and 2 was to investigate the effect of resistivity on the distribution of
protective potential and current density under the same anode locations and a given anode current
density. Upon completion of these cases the anode is moved to the locations for Cases 3 and 4 for
further analysis in order to study the effect of the anode locations on the distributions of protective
potential and current density. The total boundary element mesh used for the analysis is shown in
Figures 7 and 8. Examples of the modelling results are shown Figures 9 to 11.
Boundary Element Analysis of ICCP System B (beam)
The potential and current density distributions of ICCP System B were analyzed under the conditions
shown in Table 2. Again, the purpose of Cases 1 and 2 was to investigate the effect of the resistivity
on the distributions of protective potential and current density under the same anode locations and a
given anode current density . On completion of these cases the anodes were moved to the locations
shown for Case 3 for further analysis in order to study the effect of the anode locations on the
distributions of protective potential and current density. The total boundary element mesh used for the

7
analysis is shown in Figures 12 and 13 and examples of the modelling results are shown Figures 14 to
16.
Table 2: Test Conditions, ICCP System B (beam)
ICCP System B Case 1 Case 2 Case 3 Average Sand Resistivity (kΩ.cm) 42.3 14.6 14.6
Anode Co-ordinates
Anode A
P1 X = 36.2 cm Y = 10.0 cm Z = 6.0 cm
X = 36.2 cm Y = 10.0 cm Z = 6.0 cm
X = 21.2 cm Y = 10.0 cm Z = 6.0 cm
P2 X = 36.2 cm Y = 10.0 cm Z = 16.0 cm
X = 36.2 cm Y = 10.0 cm Z = 16.0 cm
X = 21.2 cm Y = 10.0 cm Z = 16.0 cm
Anode B
P1 X = 63.8 cm Y = 90.0 cm Z = 6.0 cm
X = 63.8 cm Y = 90.0 cm Z = 6.0 cm
X = 78.8 cm Y = 90.0 cm Z = 6.0 cm
P2 X = 63.8 cm Y = 90.0 cm Z = 16.0 cm
X = 63.8 cm Y = 90.0 cm Z = 16.0 cm
X = 78.8 cm Y = 90.0 cm Z = 16.0 cm
Applied Current Density (mA/cm2 ) 1.6
Discussion
The modelling results on ICCP Systems A and B both show that there is a significant variation of
protective potential and current density in different regions of the steel surface. This variation is
related to the resistivity of the sand, the anode locations and the geometry of the steel section.
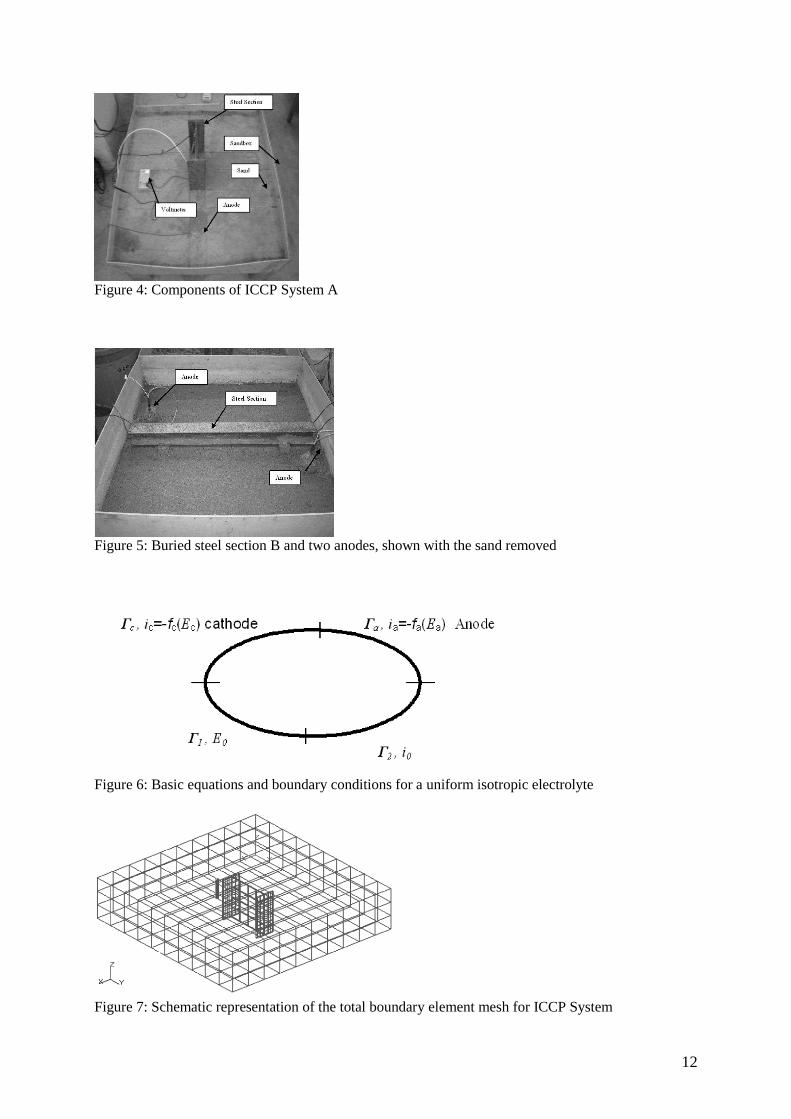
Under the conditions of the same applied current density and anode locations, the results in Cases 1
and 2 of both ICCP Systems A and B demonstrate that a higher electrolyte resistivity results in a less
uniform protective potential (Figures 10 and 15) while the distribution of the protective potential and
current is more uniform in a lower resistivity electrolyte. A higher resistivity electrolyte also results in
a lower protective current density on the surface of steel.
The anode locations have a significant influence on the potential and current distribution on the steel
surface (Figures 9, 11 and 14). Furthermore, it can be seen that the potential and current density
distribution along the surface of steel is more uniform as the anode distance increases (Figure 16).
This confirms the importance of the correct positioning of the anodes in a steel frame ICCP system in
achieving the optimum level of protection over the entire structure.

8
The potential values calculated by the boundary element modelling on the free surface of the sandbox
in Case 2 of both ICCP System A and B have been compared with experimental measurements. For
clarity, only values from representative points have been reported as shown in Figures 17 and 18. It
can be seen that there is good agreement between the experimental and calculated values by the
boundary element method. However, there are small differences between them due to one or more of
the following reasons:
i) For the boundary element modelling the sand resistivity has been assumed to be uniform, having a
constant value. In reality, the sand resistivity will not remain the same and there will be some variation
between different areas of the sandbox.
ii) The relationship between applied current and surface potential has been based on experimental
observation and is an important factor in the determination of the boundary condition. Any variation or
error in the polarisation characteristics would have a significant effect on the modelling results.
iii) It is possible that formation of a passive film on the cathodically protected steel surface has altered
its characteristics.
The results demonstrate that the boundary element method provides sufficiently accurate results to
make it an effective tool for the modelling and design of such systems.
CONCLUSIONS
The following conclusions are given by the experimental and numerical studies representing the
cathodic protection of steel framed masonry structures reported in this paper:
1. There is a significant variation of protective potential and current density in different regions of
the steel surface. This variation is related not only to the resistivity of sand and the anode
locations but also to the geometry of the steel section.

9
2. The distribution of CP potential and current density is directly related to the resistivity of
electrolyte. Under the same applied current density and anode location, the distribution of the
protective potential and current density is more uniform in a low resistivity electrolyte. A higher
resistivity electrolyte results in a lower protective current density on the surface of steel.
3. The anode position has a significant effect on the distribution of CP potential and current density.
The potential and current density distributions along the surface of steel section becomes more
uniform as the anode distance from the steel increases.
4. Boundary element modelling shows significant promise as a practical tool for designing,
analysing and optimising cathodic protection system for steel framed masonry structures.
ACKNOWLEDGEMENTS
The authors would like to gratefully acknowledge the financial support of The Royal Society, Mott
MacDonald Group Ltd and Sheffield Hallam University.
REFERENCES
1. Atkins C P, Lambert P and Coull, Z L (2002) Cathodic protection of steel framed heritage
structures. Proc. of 9th Int. Conf. on Durability of Building Materials and Components, Australia,
11pp.
2. Wu Y-Y (2005) Cathodic protection of steel framed masonry structures. PhD Thesis, Sheffield
Hallam University, UK.
3. Davy H (1825) On the corrosion of copper sheeting by seawater, and on methods of preventing
this effect, and on their application to ships of war and other ships. Proceedings of the Royal
Society, 114, pp.151-246, 1824 and 115, pp.328-346.
4. Heuze B (1965) Cathodic protection of steel in prestressed concrete. Materials Performance, 11,
pp.57-62.

10
5. Stratfull R F (1974) Experimental cathodic protection of a bridge deck, Transportation Research
Record 500, Transportation Research Board, Washington DC, USA.
6. Lambert P & Wu Y-Y (2005) Electrochemical methods for the preservation of masonry clad
structural frames, Maritime Heritage and Modern Ports, Proceedings of the Second International
Conference on Maritime Heritage, Barcelona, pp 219-228.
7. NACE Standard RP 0290-2000 (2000) Impressed current cathodic protection of reinforcing steel
in atmospherically exposed concrete structures.
8. European Standard EN 12696:2000 (2000) Cathodic protection of steel in concrete.
9. Hassanein A M, Glass G K & Buenfeld N R (2002) Potential current distribution in reinforced
concrete cathodic protection systems, Cement and Concrete Composites, 24, pp.159-167.
10. Gartland P O & Johnsen R (1985) COMCAPS-Computer modelling of cathodic protection
systems, NACE Corrosion ’85. Paper 319.
11. Adey R A, Niku S M, Brebbia C A & Finnegan J (1985) Computer aided design of cathodic
protection, Boundary Element Methods VII, Villa Olmo, Lake Como, Italy.
12. Zamani N G (1986) Boundary element simulation of cathodic protection system in prototype ship,
Applied Mathematics and Computation. 26, (2), pp.118-134.
13. Adey R A & Niku S M (1992) Computational modelling of corrosion using boundary element
methods, Computer Modelling In Corrosion, STP 1154, ASTM, Philadephia, USA, pp.248-263.
14. Broomfield J P (1997) Corrosion of steel in concrete: understanding, investigation and repair, E
& FN Spon, London.
15. Brebbia C A (1978) The boundary element method for engineers, Pentech Press, London.
16. Brebbia C A & Dominguez J (1989) The boundary elements - an introductory course, McGraw-
Hill, New York.
17. Press W H (1992) Numerical recipe in Fortran: the art of scientific computing. Cambridge
University Press.

11
LIST OF FIGURES
Figure 1: Steel Section A (unit: mm - not to scale)
Figure 2: Steel Section B (unit: mm - not to scale)
Figure 3: Schematic illustration of test facility (ICCP System A)
12
Figure 4: Components of ICCP System A
Figure 5: Buried steel section B and two anodes, shown with the sand removed
Figure 6: Basic equations and boundary conditions for a uniform isotropic electrolyte
Figure 7: Schematic representation of the total boundary element mesh for ICCP System

13
Figure 8: Schematic representation of the boundary element mesh on the surface of Steel Section A of
ICCP System A
Figure 9: Potential distribution at Z=11.0cm of ICCP System A (mV, vs CSE, Case 1)
Figure 10: Potential distribution on the surface of Steel Section A of ICCP System A (mV, vs CSE,
Case 1)

14
Figure 11: Current distribution on the surface of Steel Section A of ICCP System A (mA, Case 3)
Figure 12: Schematic representation of the total boundary element mesh for ICCP System B
Figure 13: Schematic representation of the boundary element mesh on the surface of Steel Section B of ICCP System B
Figure 14: Potential distribution at Z=11.0cm of ICCP System B (mV, vs CSE, Case 1)
15
Figure 15: Potential distribution on the surface of Steel Section B of ICCP System B (mV, vs CSE,
Case 1)
Figure 16: Current distribution on the surface of Steel Section B, ICCP System B (mA, Case 3)
Figure 17: Case 2, ICCP System A: Comparison of experimental potential with boundary element
solutions at grid reference Y=27.50cm, Z=22.00cm on the surface of the sandbox.

16
Figure 18: Case 2, ICCP System B: Comparison of experimental potential with boundary element
solutions at grid reference Y=12.50cm, Z=22.00cm on the surface of the sandbox.