catherine ventling aashto gis-t march 2018
TRANSCRIPT
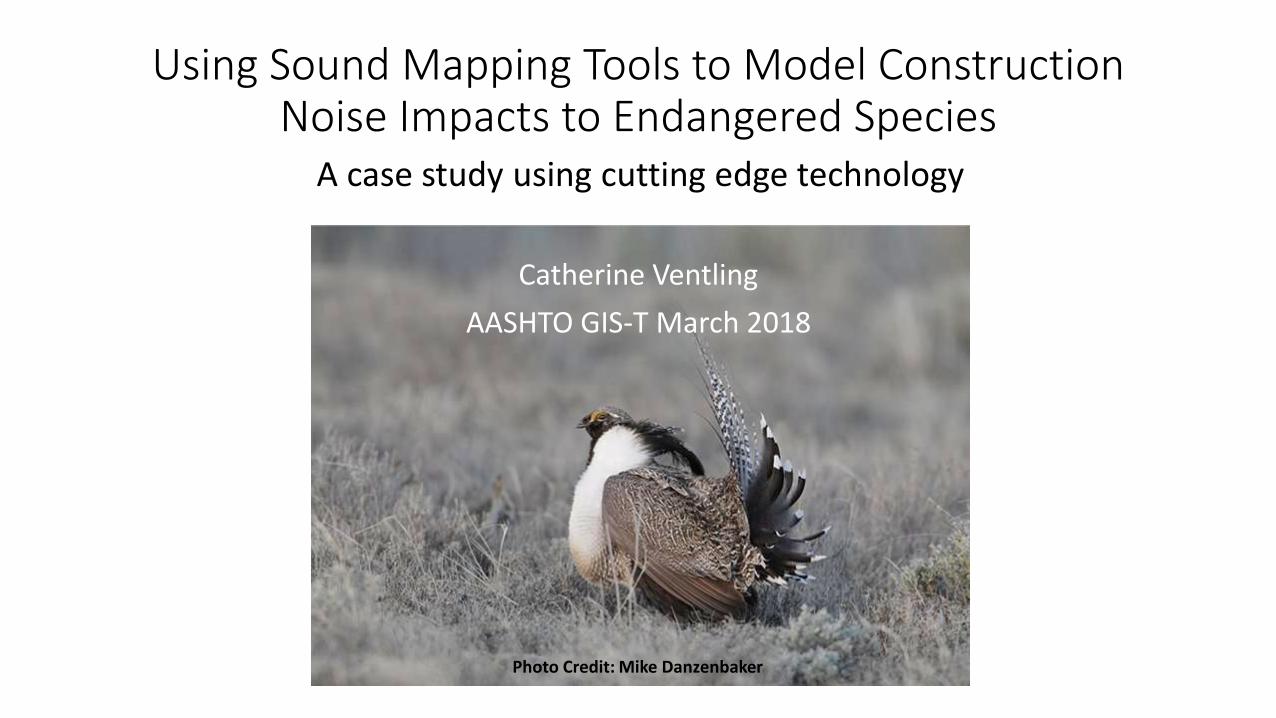
Using Sound Mapping Tools to Model Construction Noise Impacts to Endangered Species
Catherine Ventling
AASHTO GIS-T March 2018
Photo Credit: Mike Danzenbaker
A case study using cutting edge technology
Construction Noise Modeling
• Why we model construction noise
• What tool we used to model the noise
• How we used the model – customizations
• What was the outcome – graphic outputs and analysis
• Construction data and beyond
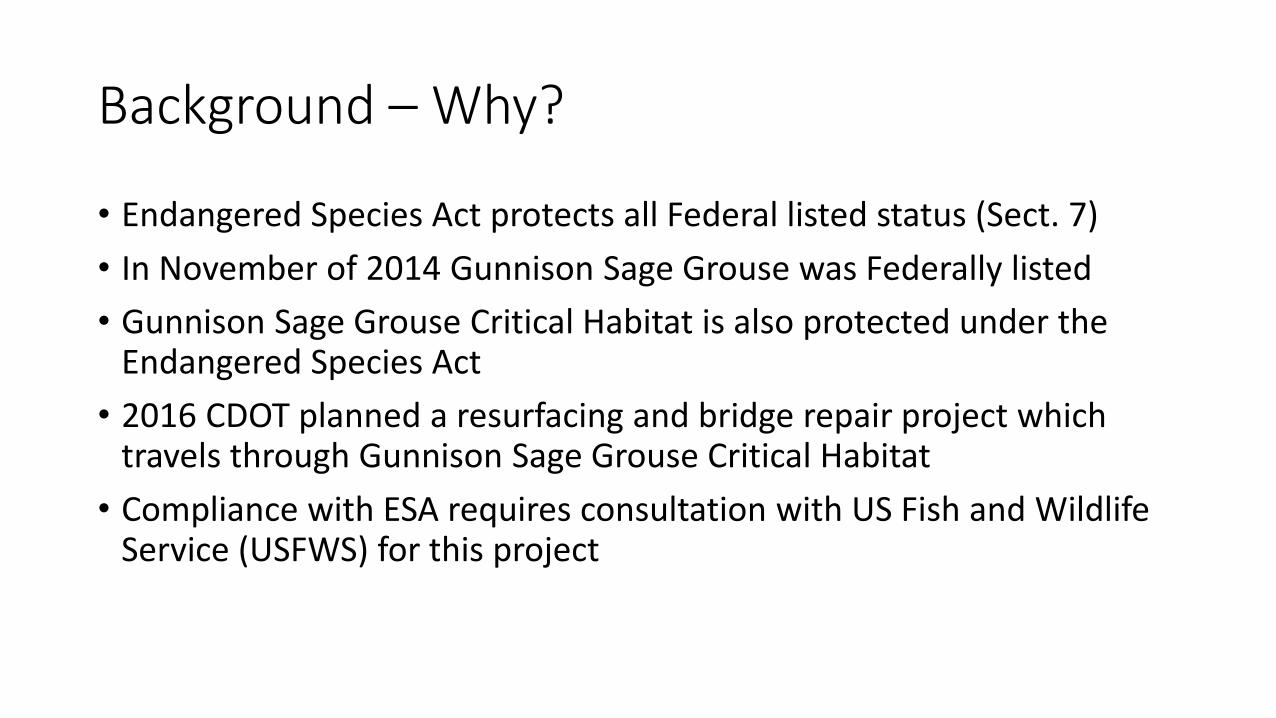
Background – Why?
• Endangered Species Act protects all Federal listed status (Sect. 7)
• In November of 2014 Gunnison Sage Grouse was Federally listed
• Gunnison Sage Grouse Critical Habitat is also protected under the Endangered Species Act
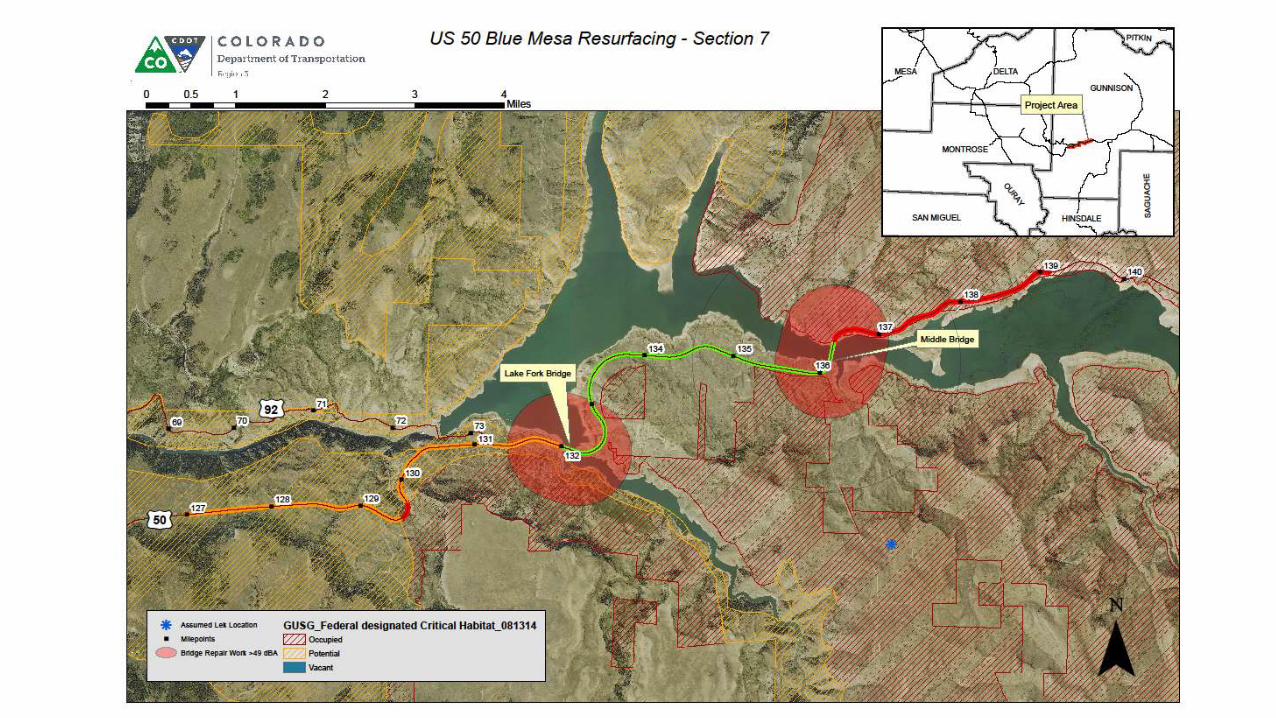
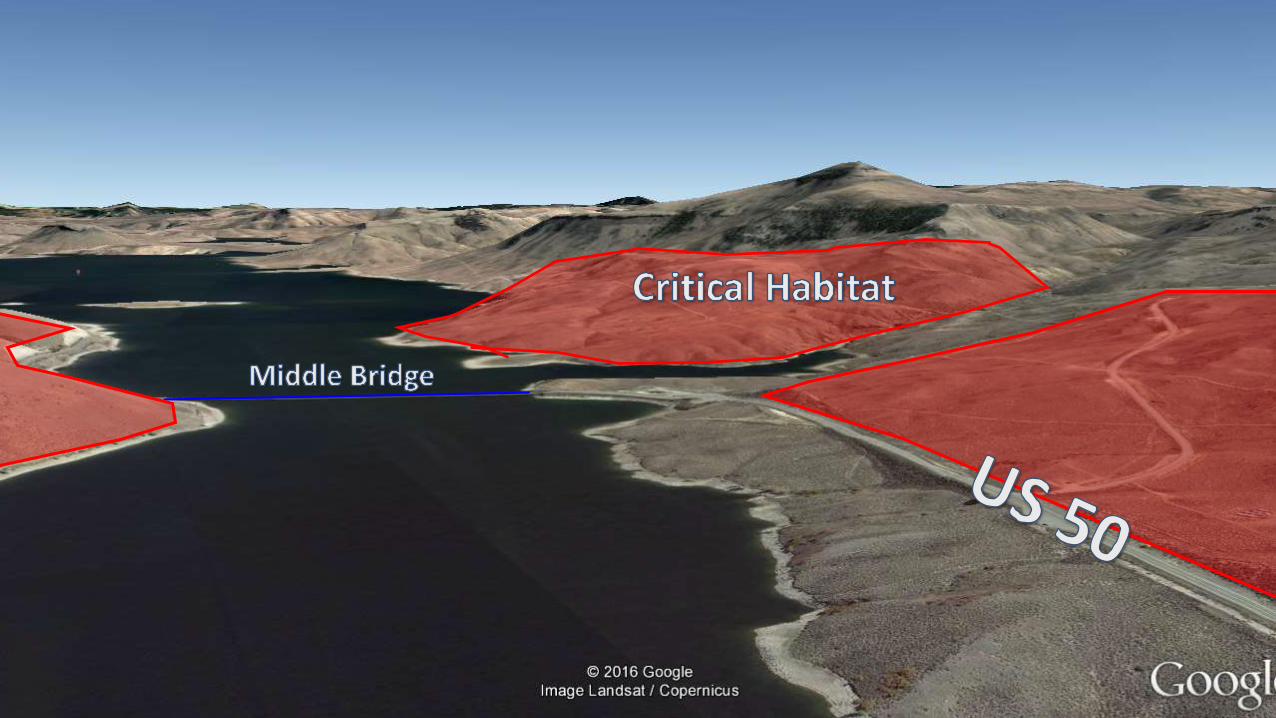
• 2016 CDOT planned a resurfacing and bridge repair project which travels through Gunnison Sage Grouse Critical Habitat
• Compliance with ESA requires consultation with US Fish and Wildlife Service (USFWS) for this project

Background – Why?
• USFWS was concerned that noise from the bridge work and resurfacing activities would disrupt subtle communications between hens and chicks in the nearby sage brush parks Designated Critical Habitat
• Noise travels in a predictable way, through a stable medium, over a smooth surface
• However, neither condition can describe the project area
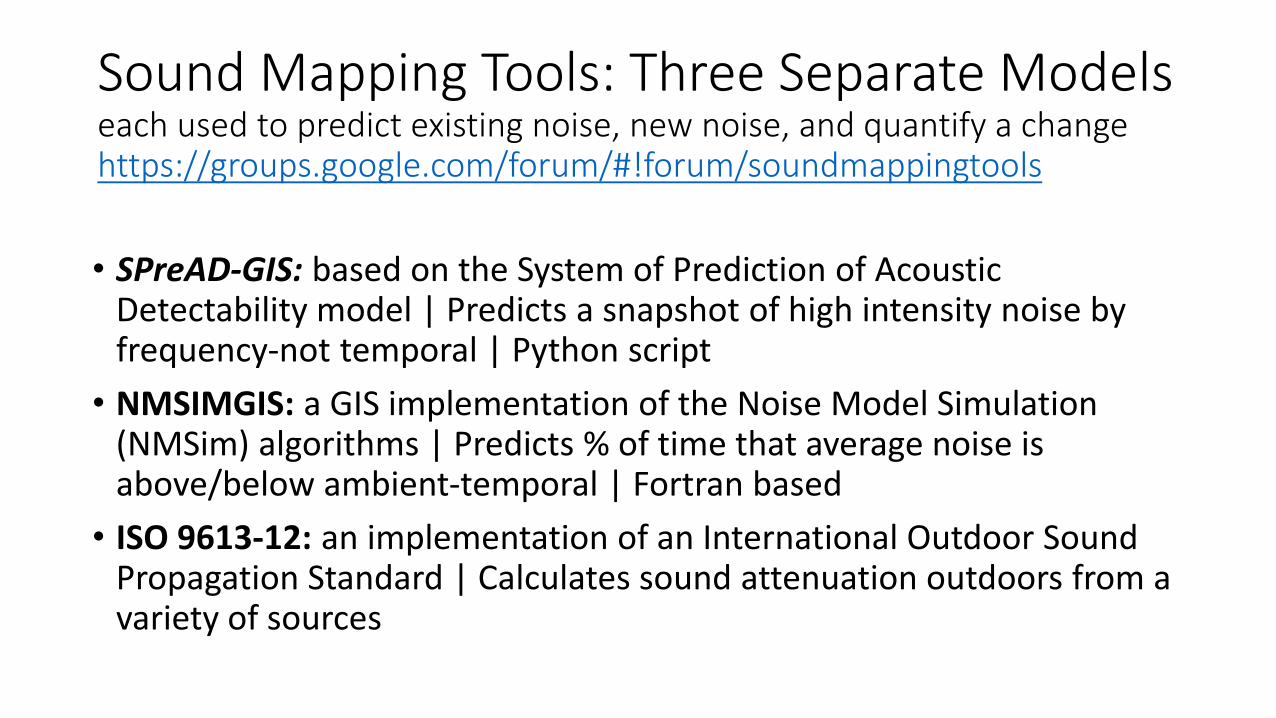
Sound Mapping Tools: Three Separate Models each used to predict existing noise, new noise, and quantify a change https://groups.google.com/forum/#!forum/soundmappingtools
• SPreAD-GIS: based on the System of Prediction of Acoustic Detectability model | Predicts a snapshot of high intensity noise by frequency-not temporal | Python script
• NMSIMGIS: a GIS implementation of the Noise Model Simulation (NMSim) algorithms | Predicts % of time that average noise is above/below ambient-temporal | Fortran based
• ISO 9613-12: an implementation of an International Outdoor Sound Propagation Standard | Calculates sound attenuation outdoors from a variety of sources

What We Used:SPreAD-GIS• SPreAD-GIS: a GIS tool for modeling anthropogenic noise propagation in
natural ecosystems. System for the Prediction of Acoustic Detectability (SPreAD) to a geographic information system (GIS) environment.
• 2010 & 2012 Sarah E. Reed, Jennifer L. Boggs and Jacob P. Mann
• GIS tool adapted from the USFS predictive acoustic detectability from 1980s
• Accounts for topography, vegetation types, atmospheric conditions (wind, temp, humidity), and noise source characteristics
• Designed for understanding wildlife impacts – predicts how various frequencies travel through the space | Animals detect different frequency ranges than humans
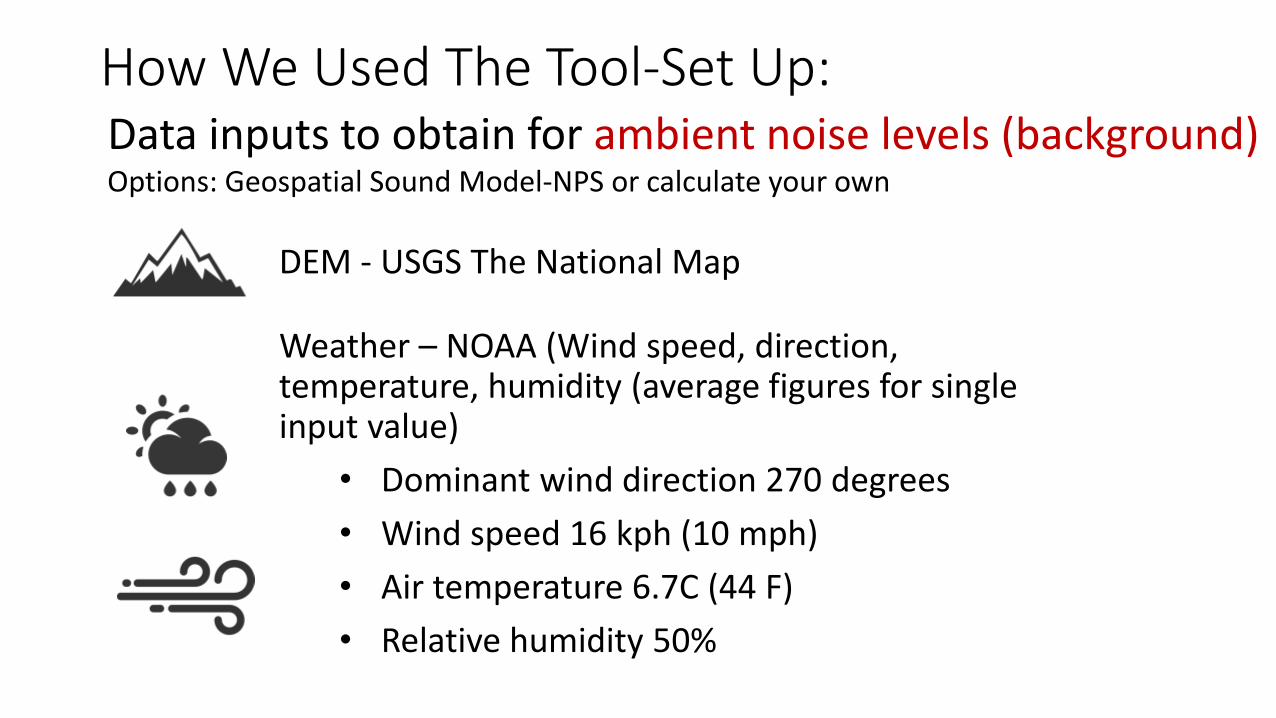
How We Used The Tool-Set Up:
DEM - USGS The National Map
Weather – NOAA (Wind speed, direction, temperature, humidity (average figures for single input value)
• Dominant wind direction 270 degrees
• Wind speed 16 kph (10 mph)
• Air temperature 6.7C (44 F)
• Relative humidity 50%
Data inputs to obtain for ambient noise levels (background)Options: Geospatial Sound Model-NPS or calculate your own
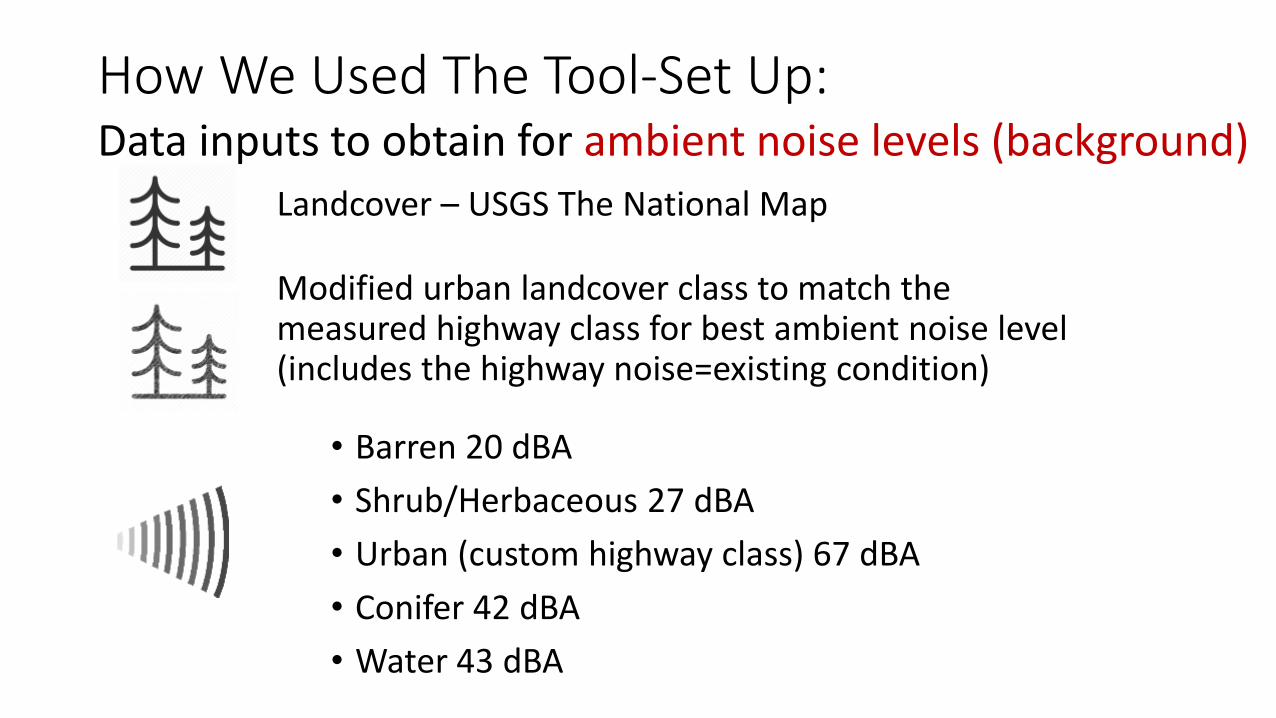
Landcover – USGS The National Map
Modified urban landcover class to match the measured highway class for best ambient noise level (includes the highway noise=existing condition)
• Barren 20 dBA
• Shrub/Herbaceous 27 dBA
• Urban (custom highway class) 67 dBA
• Conifer 42 dBA
• Water 43 dBA
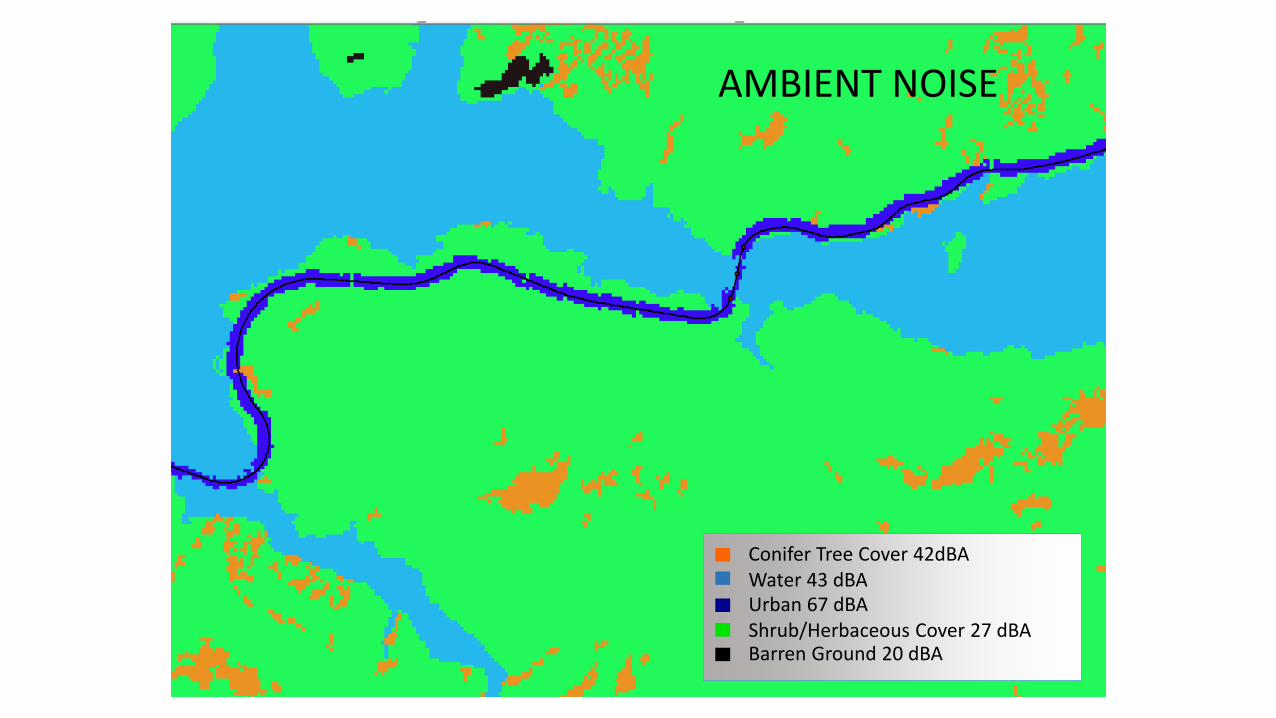
How We Used The Tool-Set Up:Data inputs to obtain for ambient noise levels (background)
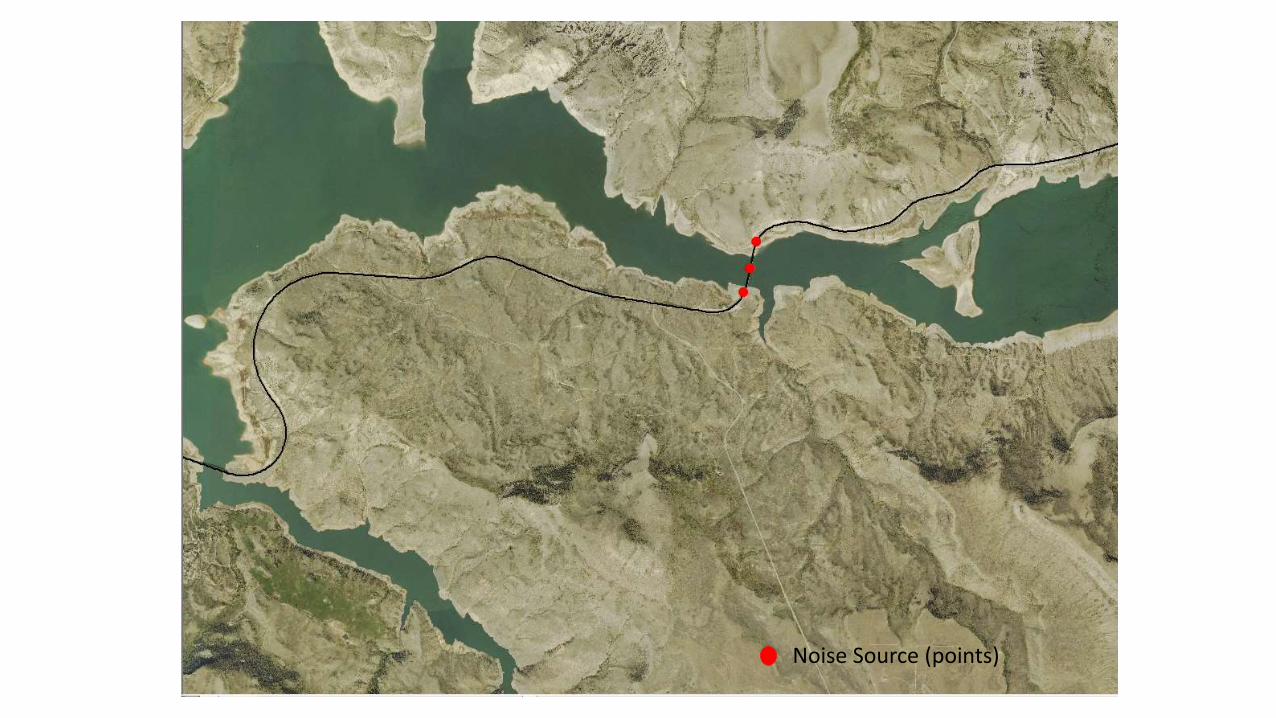
Noise Source (points)

Conifer Tree CoverWaterUrbanShrub/Herbaceous CoverBarren GroundWater
LAND COVER
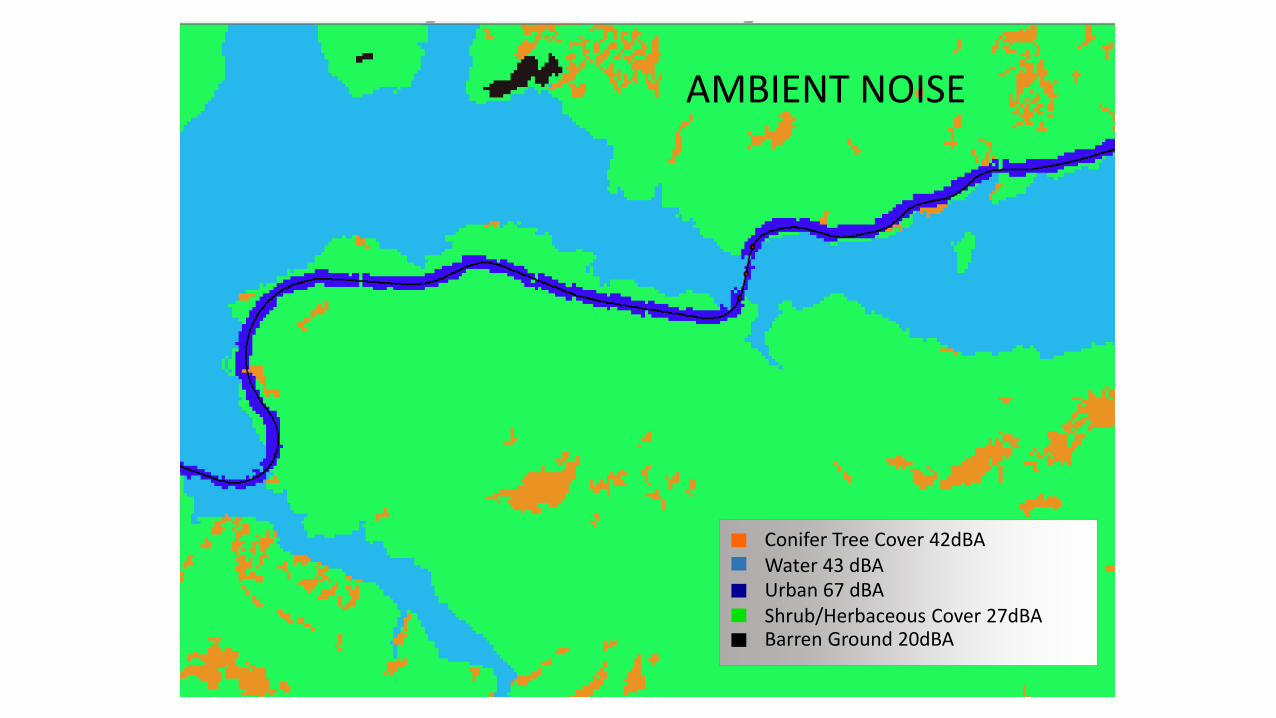
AMBIENT NOISE
Conifer Tree Cover 42dBAWater 43 dBAUrban 67 dBAShrub/Herbaceous Cover 27dBABarren Ground 20dBA
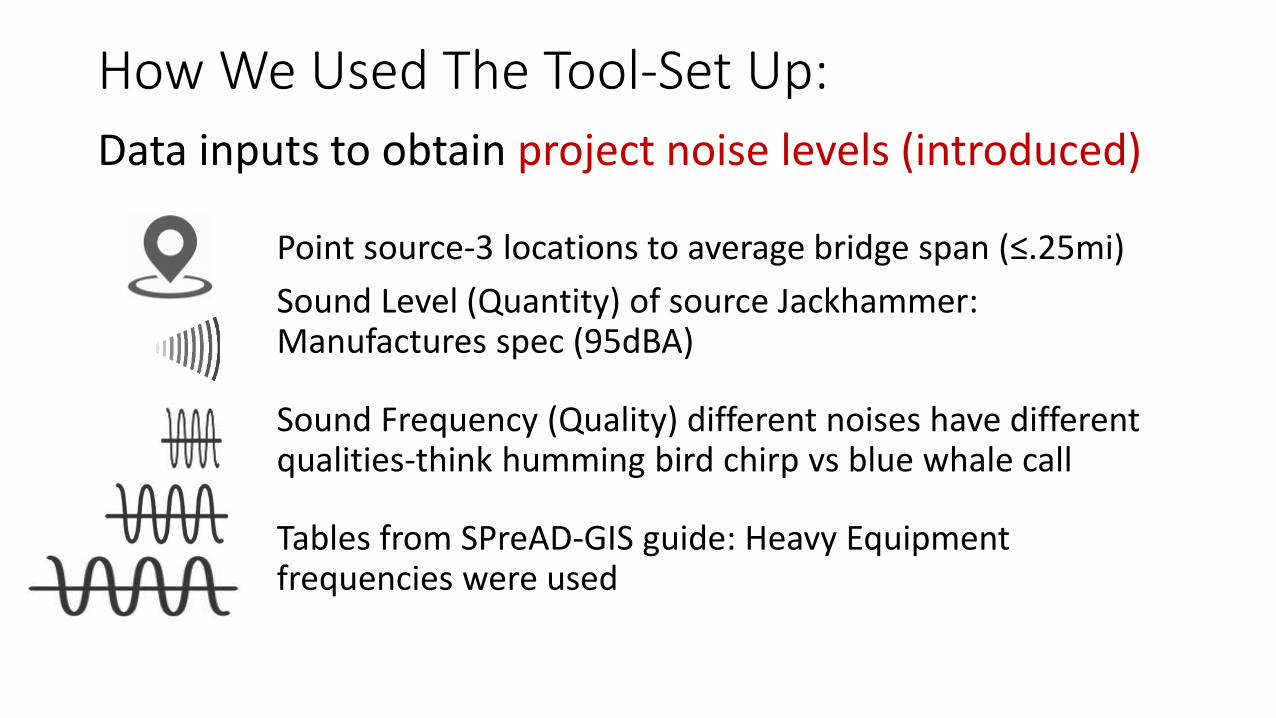
How We Used The Tool-Set Up:
Point source-3 locations to average bridge span (≤.25mi)
Sound Level (Quantity) of source Jackhammer: Manufactures spec (95dBA)
Sound Frequency (Quality) different noises have different qualities-think humming bird chirp vs blue whale call
Tables from SPreAD-GIS guide: Heavy Equipment frequencies were used
Data inputs to obtain project noise levels (introduced)

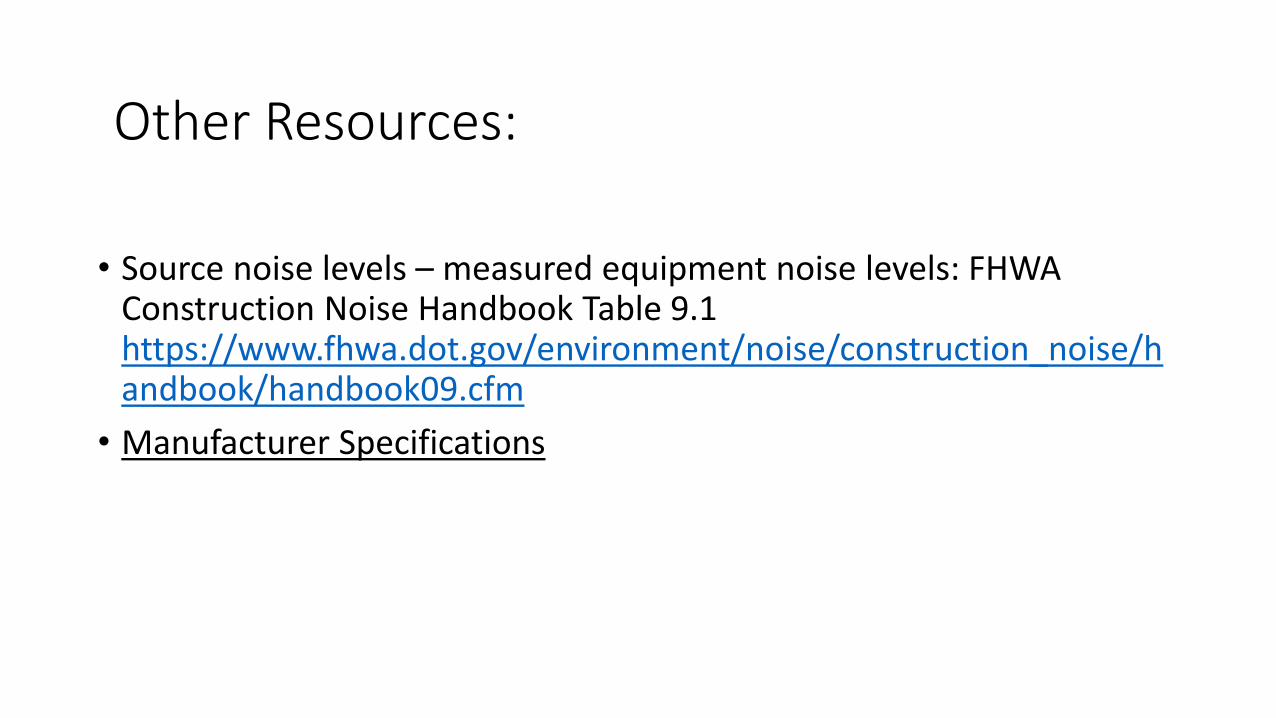
• Source noise levels – measured equipment noise levels: FHWA Construction Noise Handbook Table 9.1 https://www.fhwa.dot.gov/environment/noise/construction_noise/handbook/handbook09.cfm
• Manufacturer Specifications
Other Resources:

How We Used The Tool-Analysis:
• Identify analysis area | Smaller than input data sets for faster processing
• Output options in octaves and/or averaging | We used dBA weighted
• 1st run is the expected noise levels independent of ambient noise (Output)
• 2nd run is the change/comparison of ambient to output in dB (Excess) grouped in 1/3 octaves.
Conifer Tree Cover 42dBAWater 43 dBAUrban 67 dBAShrub/Herbaceous Cover 27 dBABarren Ground 20 dBA
AMBIENT NOISE
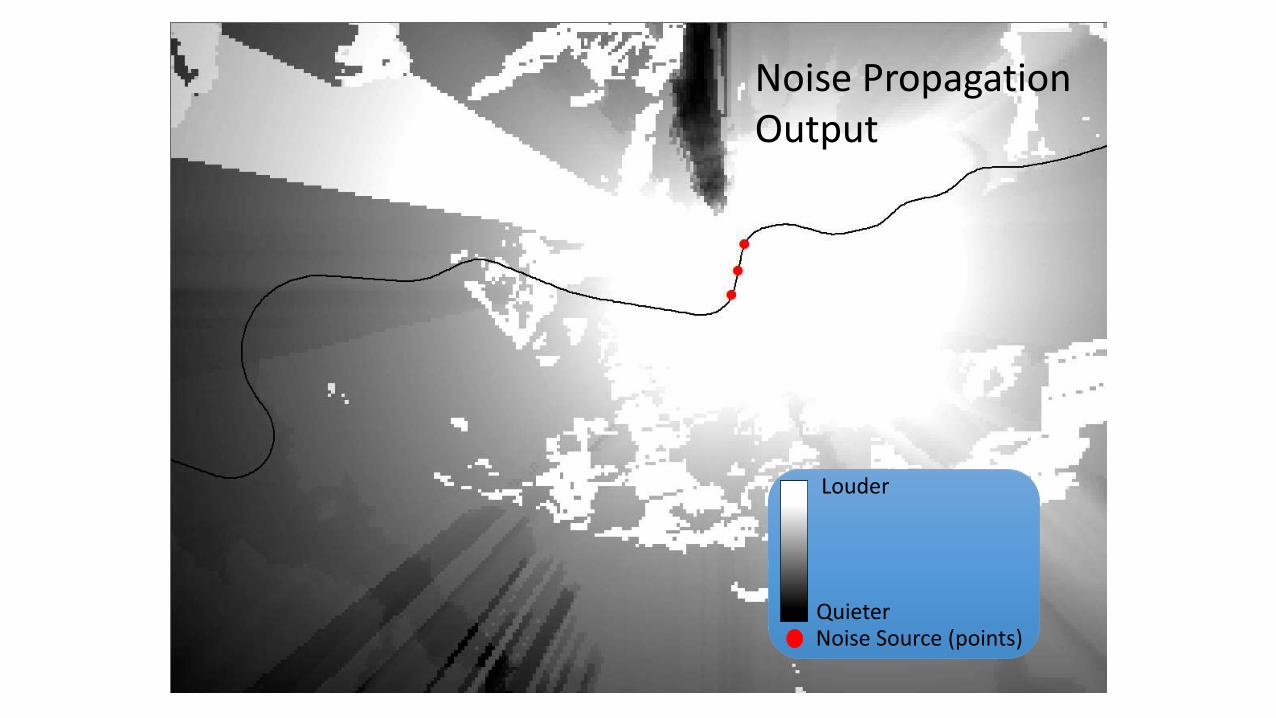
Noise Source (points)
Louder
Quieter
Noise PropagationOutput
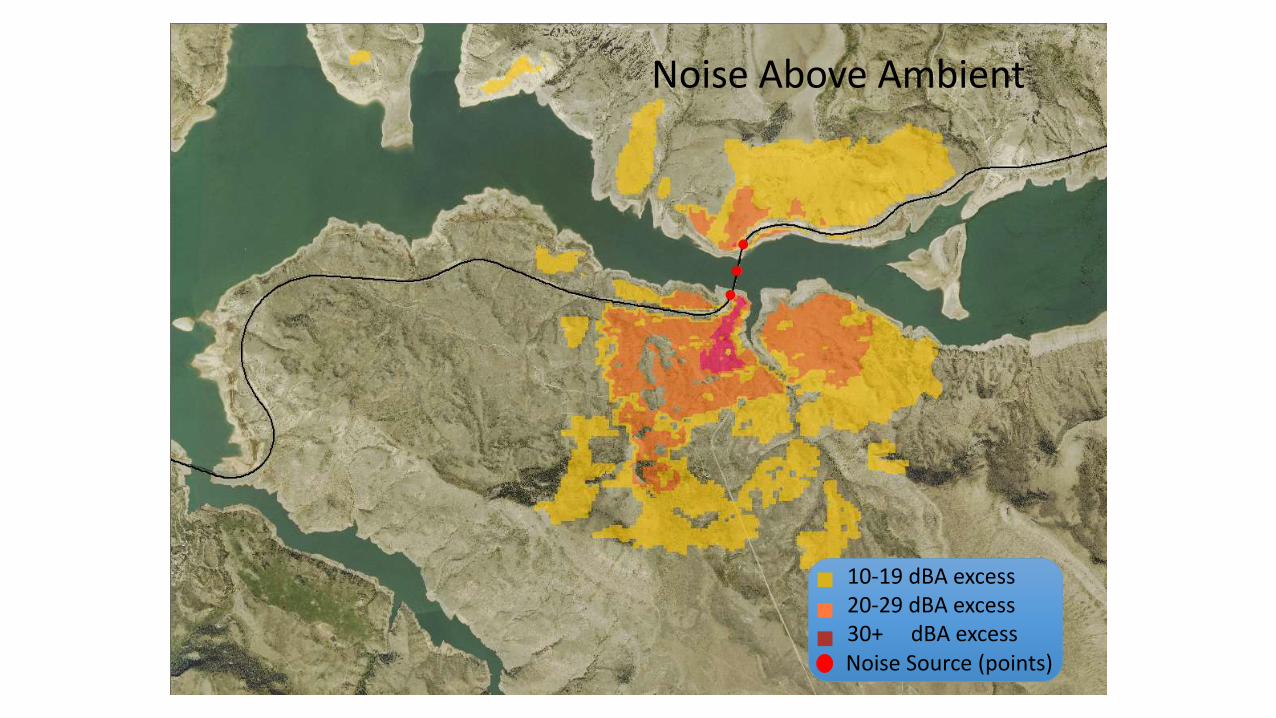
Noise Above Ambient
Noise Source (points)
10-19 dBA excess20-29 dBA excess30+ dBA excess
How We Used The Tool-Overlay Analysis:Quantify Potential Effects
• Output data is in raster format (pixels)
• Conversion to vector data is necessary for completing analysis with habitat comparison | Spatial Analyst: Contour tool
• Conversion of Contour (lines) to polygon = Feature to Polygon tool
• Overlay analysis | Identity tool | Calculate area based on overlay

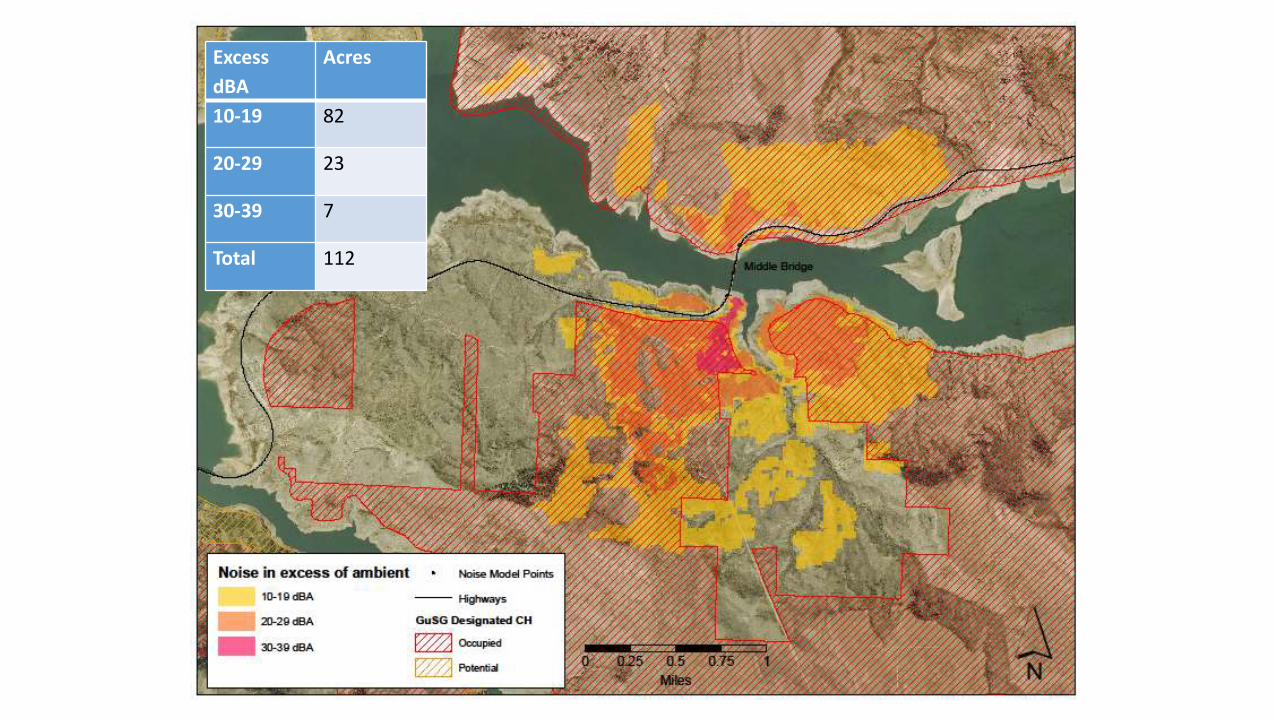
Excess
dBA
Acres
10-19 82
20-29 23
30-39 7
Total 112
Outcome of Using The Model:
• CDOT used new methods & available technology to reach conclusion in Section 7 consultation
• Identified the quantified area of potential affected Critical Habitat
• Used twilight timing limitations or project work during nesting/rearing season to minimize impacts - NLAA
• Larger area of impact than expected from non-model methods
• USFWS interested in this method, and requested model application for other projects
Measured Construction Noise• Opportunity to test the model during construction | Decibelmeter
readings of ambient and construction conditions
• Sample locations, collected ~70 data points for both ambient and construction noise & weather conditions | Analysis pending
• Incidental noise level collection recorded higher levels than expected for cold in-place recycle equipment on bridge (more than jackhammer)
• Wind had very large impact on noise level |During wind gusts, noise level was measured as high as jackhammer at 50ft
Sound Mapping Tools: Future
National Park Service, Natural Sounds and Night Skies Division now stewards of the tools – Kathryn Nuessly, Fort Collins, Colorado
• SPreAD-GIS likely to persist because it is written in Python
• NMSIMGIS not likely to persist because it is written in Fortran
