catherine boone and michael wahman rural bias in african...
TRANSCRIPT

Catherine Boone and Michael Wahman
Rural bias in African electoral systems: legacies of unequal representation in African democracies Article (Accepted version) (Refereed)
Original citation: Boone, Catherine and Wahman, Michael (2015) Rural bias in African electoral systems: legacies of unequal representation in African democracies. Electoral Studies . ISSN 0261-3794 DOI:
Reuse of this item is permitted through licensing under the Creative Commons: © 2015 The Authors CC BY-NC-ND This version available at: http://eprints.lse.ac.uk/64153/ Available in LSE Research Online: October 2015
LSE has developed LSE Research Online so that users may access research output of the School. Copyright © and Moral Rights for the papers on this site are retained by the individual authors and/or other copyright owners. You may freely distribute the URL (http://eprints.lse.ac.uk) of the LSE Research Online website.

Rural Bias in African Electoral Systems:
Legacies of Unequal Representation in African Democracies
Catherine Boone
Professor of Government and International Development
London School of Economics and Political Science
Houghton Street
London WC2AE
United Kingdom
Michael Wahman
Assistant Professor
University of Missouri
Department of Political Science
Abstract
Although electoral malapportionment is a recurrent theme in monitoring reports on
African elections, few researchers have tackled this issue. Here we theorize the meaning
and broader implications of malapportionment in eight African countries with Single
Member District (SMD) electoral systems. Using a new dataset on registered voters and
constituency level election results, we study malapportionment's magnitude, persistence
over time, and electoral consequences. The analysis reveals that patterns of
apportionment institutionalized in the pre-1990 era established a long-lasting bias in
favor of rural voters. This "rural bias" has been strikingly stable in the post-1990 era,
even where the ancien regime has been voted out of power. These findings underscore
the importance of the urban-rural distinction in explaining electoral outcomes in Africa.
Keywords: elections, malapportionment, Africa, rural, democracy, multipartism

2
Introduction
Although the problem of electoral malapportionment is a recurrent theme in
external monitoring missions' reports on African elections, few academic researchers
have tackled this issue. Election monitoring reports from around Africa have frequently
pointed out that unequal representation due to malapportionment violates the principle of
‘one person one vote,’1 and a seminal study by Barkan et al (2006) revealed the
importance of rural-favoring ("rural-biased") malapportionment for Kenyan elections in
the 1990s. Yet so far, scholars have lacked systematic comparative research on the
magnitude of electoral malapportionment in Africa, its origins and persistence over time,
and its consequences for electoral representation. This paper addresses these three gaps
in our understanding of African political systems.
This paper identifies rural-favoring malapportionment in Single Member District
(SMD) systems as a long-standing bias in electoral system design. We identify and
measure this phenomenon in eight countries in Anglophone Sub-Saharan Africa using an
original dataset. The analysis provides clear evidence of rural-favoring or rural-biased
malapportionment in our sample, showing that it pre-dates Africa's return to multipartism
of the 1990s and has persisted largely unmitigated throughout the multiparty era, even
where opposition parties have come to power. The results call for rethinking the oft
repeated claim that regimes of the one-party era represented a "core coalition of urban
interests” (Bates et al, 2007) while maintaining few links with the rural areas (Herbst
1 Some examples include the EU on Zambia 2011; the Commonwealth on Malawi 2009; the Carter Center
on Kenyan 2002.

3
2000), thus leaving rural peasantries "uncaptured by the state" (Hyden 1980). Mamdani
(1996; 295) summarized the prevailing scholarly wisdom of the mid-1990s: the rural
masses were viewed as an invisible, residual factor in politics, largely outside the
purview of state action and control. These ideas live on in recent work that invokes the
idea of the uncaptured or excluded rural masses as the historical baseline against which
current patterns of rural voting are understood. Our results "bring rural electorates back
in" to analyses of national politics by providing evidence of a long-established rural bias
in African electoral systems which have, for many decades, drawn rural voters into
national political systems as electoral bases for incumbents. Rural bias in electoral
systems is highly significant because it dilutes the electoral weight of the cities, which are
the locus of stronger opposition parties, more robust civil society organization, and more
robust electoral competition. The paper's findings thus have implications for
understanding both development and democracy in Africa.
The paper introduces a new dataset of constituency-level election data for eight
African countries since about 1990. There is a great paucity of such data, and it remains
difficult to gather subnational electoral results across African countries and over time.
The dataset we have created is unique and our analysis is one of the very first to compare
the structure and characteristics of constituency-level representation across African
countries. While the data are descriptive, they allow us to draw some significant
inferences about the origins, persistence, and effects of rural bias in electoral
representation. And although it is limited to only eight countries, we believe our data set
offers possibilities for significant new thinking about spatial and socio-economic
4
structure in national voting patterns in Africa, and about how these patterns have taken
shape and persisted over time.
Across our eight country cases, there is striking stability for 1990-2010 in both the
extent and direction of rural bias in electoral apportionment. This is the main finding and
empirical core of this paper. Four of the eight countries in our sample have experienced
electoral turnover since the 1990s, but even in these countries (two of which have
undertaken constituency demarcation exercises since the turnover), malapportionment
favored rural districts as much as it did in the 2000s as it did in the early 1990s.
The argument is presented in five steps. First, we discuss elections under the one-
party and one-party-dominant regimes of the pre-1990 era. The historical record and
secondary literatures provide clues to political rationales that help explain the rise and
persistence of rural bias in Africa's ancien regime (pre-1990) electoral systems. Second,
we introduce our data set, including our case-selection rationale. Third, for the eight
countries in our study, we document the extent of malapportionment in the early 1990s
and how it has evolved since then. Fourth, we demonstrate malapportionment in the bias
against the largest cities in our eight countries in the 2000s, and track change since 1990
in the extent to which incumbents have drawn disproportionately on rural voters to win
elections. Fifth, focusing on the period since 1990, we correlate electoral district size
with the constituency characteristics and voting patterns using fixed effect regression
models. Here the data offer insight into the effects of rural bias on electoral
representation. The conclusion returns to the question of political rationales that may
drive rural-bias in electoral systems in Africa and beyond. It also discusses broad
implications of these findings for the study African politics.

5
I. Elections under single- and dominant-party rule
Much political science work on Africa since the 1990s has conveyed the
impression that that before multipartism, rural populations were absent from the national
political stage. Although one-party and dominant-party regimes rested atop mass
political parties and held regular elections, scholars often dismissed these as relevant to
understanding dynamics in African countries. Many suggested that the mass parties
existed in name only (or to provide positions for urban elites) and that nation-wide
elections were empty rituals. In 1979 Naomi Chazan (1976: 136) wrote that the
conventional wisdom among political scientists concerned with Africa is that elections
were insignificant ("a non-phenomenon") on the Africa scene.
A wave of comparative politics research on elections and electoral institutions in
authoritarian regimes suggests important correctives to this view, and insights into how
and why legislatures, parties, and elections can matter for political stability and state-
building, even in the absence of multiparty competition. As Lust-Okar (2005), Brownlee
(2007), Gandhi (2008) and others show, even dictators invest scarce resources in
gathering and maintaining power -- they build political institutions, incorporate
populations into national political systems, and seek legitimacy. Successful non-
democratic rulers can use political parties and elections to incorporate constituencies into
stable ruling blocs or coalitions, gain information about subjects' demands and
capabilities, economize on use of coercion, lower the cost of side payments and pay offs,
impede the ability of opposition groups to coordinate against the center, and generate
legitimacy (Olson 2000) These strategies were employed by the authoritarian and
6
dominant party regimes in Africa, just as they were in the Middle East, Latin America
and 19th
century Europe.
In the first three decades after independence from colonial rule, almost all civilian
governments in Africa maintained elected legislatures. Chazan (1979:136) reported that
between mid-1974 and mid-1978, for example, 26 African countries held elections and
that voters went to the polls in these countries 47 times. Rulers organized elections and
sought to use and control them. Many African governments used competitive legislative
primaries as a device for elite monitoring, recruitment, and turnover (Zolberg et al. 1972;
Widner 2000). Party hierarchies organized relations of patronage and clientelism down to
the regional and local levels, rallied supportive constituencies, and allowed rulers to exert
control over the institutions of territorial administration. In countries in which rural
populations made up anywhere from 60 to 90% of the national total, political party
machines helped rulers secure rural acquiescence and compliance, and mobilized
constituencies to turn-out to vote for incumbents at election time. Large literatures from
the 1960s and 1970s show how non-democratic rulers used rural clientelism and local
party-state institutions to undercut the political solidarities and oppositional tendencies
that existed in peasant societies in Africa, and that could be turned against the center.
Bates’ (1981) analysis of machine politics in the rural areas of Kenya (a country with a
bitter history of rural insurgency in the 1950s) reinforced precisely this argument.
Research on the role of legislatures in contemporary multiparty Africa has been
inconclusive. Accounts on African democracy in the early 1990s highlighted the general
concentration of power around the president, an institutional order that is in accordance
with the political culture of “big man rule” (Bratton and van de Walle 1997). However,
7
more recent contributions have highlighted variations in the function and power of
African legislatures (Barkan 2008) and have illustrated how African presidents invest
considerable resources in order to manufacture parliamentary majorities (Young 2013;
Chaisty et al. 2014). As in the one-party era, parliaments offer an opportunity for
presidents to extend patronage networks and local control and incorporate local elites in
their national coalitions.
II. Constituency Level Electoral Data Set
A systematic analysis of African apportionment structures requires new detailed
election data. Lack of adequate data has long been a serious limitation for the field of
African election research. Whereas researchers on elections in Europe and North America
have benefitted from detailed disaggregated data in long time series, scholars interested
in African elections have often been confined to studying cross-national variation in
election behavior using national level aggregates (e.g. Kuenzi and Lambright 2007),
individual level survey data (e.g. Lindberg and Morrison 2005; Bratton et al. 2012), or
single case studies where more disaggregate information on actual voting is available
(e.g. Fridy 2007). A number of very useful data resources containing constituency level
election data have recently been made publically available (Kollman et al. 2013), but
these datasets do not offer good coverage and updated data for Sub-Saharan Africa.
In this paper we introduce a new dataset of constituency level lower-house
parliamentary election results, registered voters, and constituency characteristics over the
1991-2010 period in eight African countries, Botswana, the Gambia, Ghana, Kenya,

8
Malawi, Tanzania, Zambia and Zimbabwe. Most of the data was gathered on a country-
by-country basis from official accounts issued by the respective countries’ national
election commissions. In some cases data has also been found in election monitoring
reports or national media. To the best of our knowledge, the dataset represents the most
extensive account of constituency level election results in Anglophone African SMD
elections. The rationale for our case-selection is presented in the next section.
A limitation of our dataset is that malapportionment is calculated based on the
number of registered rather than eligible voters. Unfortunately, this is a problem we share
with most of the existing cross-national research on malapportionment (e.g. Samuels and
Snyder 2001; Broz and Maliniak 2010), as census data is rarely readily available at the
constituency level. If levels of registration in the countries in our sample are higher
among rural voters than they are among urban voters, as several studies on African
electoral systems do suggest, then our measure of rural bias in malapportionment would
actually underestimate the rural bias in apportionment.
In addition to electoral data on the partisan breakdown of the vote and the number
of registered voters per constituency, we coded constituencies as urban or rural.
Following Ishiyama et al. (2013), we coded all constituencies located within the
administrative boundaries of major cities as urban.2 National and regional capitals with
at least 20,000 citizens were considered "major cities," together with all other top 10-
cities that met a population threshold of 20,000.
III. Case selection and data limitations
2 We cannot use population density as a measure because of lack of information on constituency
geographical size for all the countries in our sample. Data on city population is taken from each country's
national bureau of statistics, available at www.citypopulation.de.

9
This is the first study researching African electoral malapportionment over time
and across countries. Our study focuses on eight countries in Anglophone Africa, and
although we cannot prove that our empirical results are representative of all the 17
African countries holding SMD elections in 2010 (for want of complete data),3 we are
confident that we have indentified a phenomenon of regional scope and indeed, as
discussed in the conclusion, one that is consistent with patterns observed in many
democracies outside of Africa that have large agrarian populations.
Case selection was determined on basis of competitiveness of elections, data
availability and institutional continuity. We limited our sample to eight countries with
SMD elections that exhibited at least a minimal degree of competitiveness (i.e.,
opposition parties received less than 10% of parliamentary seats) for two or more
consecutive elections, and for which we could obtain data for several elections.4
Following these criteria, we excluded from the analysis nine African countries holding
SMD elections: Ethiopia, Uganda and Swaziland (for lack of competitiveness), Nigeria
(due to missing data for several elections) and Comoros, Central African Republic,
Congo and Liberia (due to recent interruptions in their electoral cycles amid wars or coup
d’états). Sierra Leone was also excluded since it did not introduce SMD until 2009 and
was still in their first electoral cycle as of 2010. For the eight countries in our sample, we
did not include elections featuring boycotts from major opposition parties (i.e. the
3 As of 2010 (the last year of our sample) according to the Database of Political Institutions. See Beck et al.
2001. 4 Studying elections with major opposition boycotts or a practically non-existent opposition makes it hard
to capture incumbent favoring or disfavoring biases in apportionment structures. Although constituency
level election data for Ethiopia and Uganda does exist, we excluded these cases due to their low level of
competitiveness.

10
Gambia 2002, Ghana 1992 and Zimbabwe 1995).5 The Zimbabwean elections in the
1990s are excluded due to lack of competition.6 For five out of the eight countries
included, the dataset covers all non-boycotted relatively competitive elections in the
1990s and 2000s. For the other three countries sub-national data on registration and
election results was missing for one election. This data problem pertains to the elections
in Tanzania 1995, Zimbabwe 2000 and the Gambia 2002.
IV. Malapportionment in African SMD systems
Malapportionment is an unequal assignment of legislative seats so that that the
votes of some citizens weigh more than others. By definition, it runs counter to the
democratic principle of ‘one person one vote,' although it may offset other forms of
respresentational biases. Malapportionment can create strong biases in electoral systems
if it systematically favors some groups over others. The potential benefits are often
greater under SMD than in proportional respresentation systems.7 Besides the potential
benefits of increasing the electoral weight of loyal constituencies (and diluting that of
opponents), constituencies are local institutions that consist of government offices that
provide government offices to local elites, constitute channels for the distribution of
patronage resources, mobilize local voters, and monitor local political activity (Green
2010; Grossman and Lewis 2014; Hassan Forthcoming). A decade ago, Samuels and
Snyder (2001) used data from the 1990s (i.e. the beginning of Africa's multiparty era), to
study cross-national variation in levels of malapportionment. They found that some of the 5 We have, however, included the 1996 Zambia election despite the boycott of the United National
Independence Party (UNIP), although this was clearly an important boycott the opposition did receive
almost 40% of the parliamentary vote. 6 The opposition never received more than 2.5% of the seats in these elections.
7 Samuels and Snyder (2001 )show that malapportionment levels are significantly higher in countries with
SMD elections.

11
world’s most malapportioned electoral systems were on the African continent. To
measure malapportionment, we rely on their formula:
(1) MAL=(1/2)|si-vi|
where s-v denotes the absolute value of the difference between the percentage of seats
and percentage of registered voters for constituency i. The malapportionment index
shows the percentage of seats that is allocated to constituencies that would not receive
those seats if there were no malapportionment. A score of 0 would indicate perfectly
equal representation.8 Figure 1 shows the levels and development in malapportionment
for the countries in our sample.
Two conclusions can be drawn from the descriptive statistics in figure 1. First,
malapportionment remains a prominent feature of the SMD systems of Anglophone
Africa. The mean malapportionment in Samuel and Snyder’s sample of 78 countries
worldwide (plotted as the dotted line of figure 1) was .06. The mean malapportionment
for the eight countries in our sample (for the most recent election in the data set) is over
twice that level, at .17. Only one country in our data set, Zimbabwe, exhibits lower levels
of malapportionment than the mean in Samuel and Snyder’s global study. Botswana
displays levels of malapportionment relatively close to the global mean. The six
remaining countries have remarkably high levels of malapportionment by global
standards.
Tanzania had the highest level of malapportionment (.28) in its 2010 election,
followed by Gambia in 2007 (.24). The extreme level of malapportionment in Tanzania is
8 In practice this score would be unthinkable in electoral systems with more than one electoral district.

12
partly due to the constitutionally guaranteed representation for the islands of Zanzibar
and Pemba.9 If we exclude Zanzibar and Pemba, the Tanzania index is still high at .19
for the 2010 election. High levels of malapportionment in Africa are especially striking
given the fact that equal representation across constituencies is constitutionally demanded
in most of the countries under scrutiny10
The second important conclusion drawn from figure 1 is that high levels of
malapportionment have persisted over time. Patterns of change in country levels of
malapportionment in figure 1 can be considered in light of the information in Table 1,
which indicates the timing and extent of post-independence demarcation exercises for the
countries of our sample.
[Figure 1 about here]
What does this data allow us to say about the origins of these patterns of
malapportionment? On the eve of the return to multipartism in the 1990s, all countries in
our sample were divided into electoral constituencies that were established by ancien
regime parties in an era of one-party or dominant-party rule. Biases in ancien regime
levels apportionment must be attributed, at least in part, to rulers' preferences -- Africa's
post-independence autocrats were in a strong position to structure patterns of
malapportionment in ways that suited their interests.
9 According to the Zanzibar constitution of 1984 (Section 120(1)), Zanzibar should have no less than 40
and no more than 55 constituencies of approximately equal size. 10
Kenyan constitution of 1969 (Section 43:3), Botswana constitution of 1966 (Chapter 1 Section 64:1),
Malawi constitution of 1995 (Section 73:2a), Zambia constitution of 1991 (Section 77:1), Zimbabwe
constitution of 1979 (Section 60:3) and Ghana constitution of 1992 (Section 42:3).

13
Table 1 shows that in anticipation of increasingly competitive multiparty elections
in the 1990s, all of the governments in our sample expanded the number of electoral
constituencies. Figure 1 suggests that these demarcation exercises undertaken by the
longstanding incumbents (ancien regime incumbents) did little to reduce levels of
malapportionment. Instead, creation of new districts in Zambia, the Gambia, Ghana,
Kenya and Malawi on the eve of the return to multipartism accentuated the rural bias in
apportionment.
For instance, in the run up to the 1991 Zambia election, the electoral commission
allocated all the new 25 Zambian constituencies to rural areas rather than to the already
largely disadvantaged district of Lusaka, thereby reaffirming the already strong rural bias
in apportionment. Several of the incumbent ancien regimes used the creation of new
administrative units to force through the creation of new electoral constituencies. In the
late 1980s, Ghana's PNDC government split the highly loyal and rural Upper Region in
two and created 45 new administrative districts. The Independent National Election
Committee responded by creating 60 new constituencies for the 1992 elections (Aubynn
2002). After the introduction of multipartism in 1991, Kenya's President Moi created a
series of new administrative districts and in 1996, the Electoral commission responded by
creating 22 new rural constituencies to match. This is widely considered to have helped
the ruling party win a slim majority in the 1997 parliamentary elections (Institute for
Education in Democracy 1998).
[Table 1 about here]
V. Malapportionment and rural bias
14
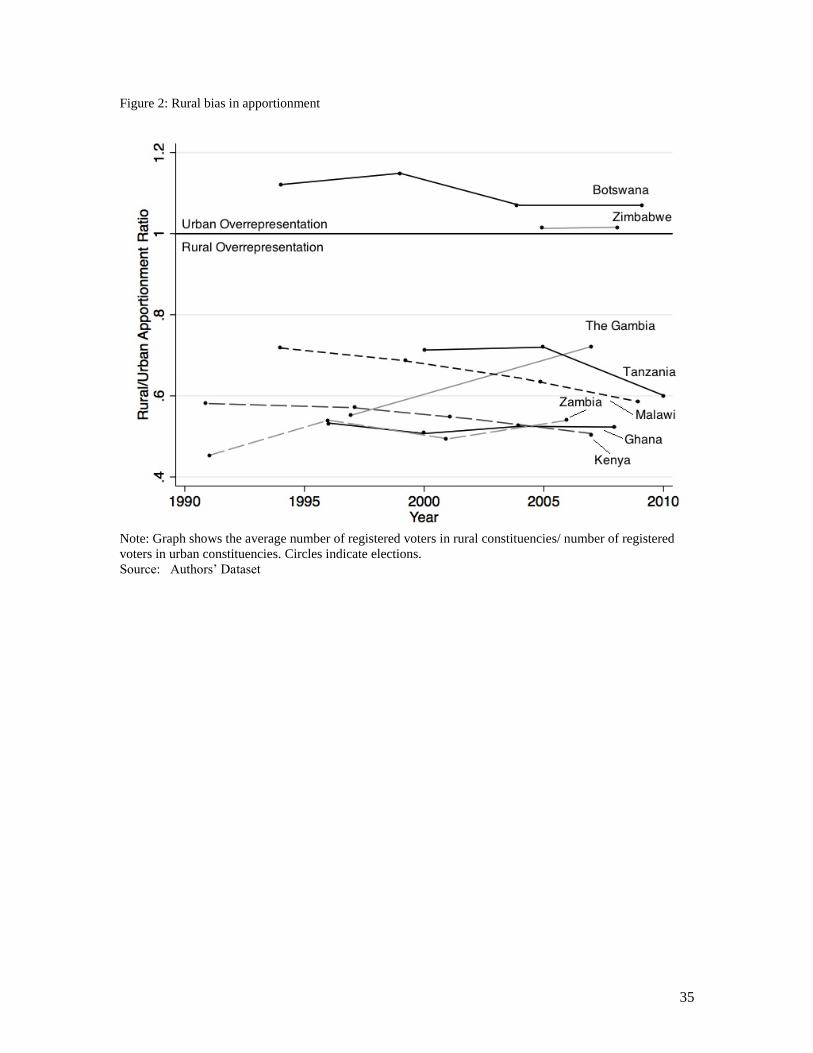
To give a systematic and comparable illustration of the electoral weight given to
urban and rural constituencies across our sample and over time, figure 2 shows the ratio
between the average number of registered voters in rural and urban constituencies. Ratios
above 1 indicate urban overrepresentation while ratios below 1 shows rural
overrepresentation. The figure shows a striking and largely persistent level of rural
overrepresentation in six out of the eight countries in our sample. Five of the eight
countries had a ratio of below 0.6 in at least one election. Kenya, Zambia, Ghana and to
an increasing extent Malawi stand out as countries with especially high levels of rural
overrepresentation. Table 4 of the appendix separates the average number of registered
voters for constituencies in each countries largest city, other urban areas and rural areas.
It shows how principal cities have been especially disadvantaged in some countries. The
average constituency in Nairobi in the 2007 election was 2.6 times the size of the average
Kenyan rural constituency, the corresponding number for urban constituencies in Lusaka
was 2.9 in 2006 and as high as 3.4 for Dar es Salaam in 2000. Figure 2 also shows a
relatively high level of persistence in rural overrepresentation, the only exceptions being
a small decrease in Zambia between 1991 and 1997 (although without demarcation) and a
more significant one in the Gambia between 1997 and 2007.
[Figure 2 about here]
As shown in figure 2, only two countries, Botswana and Zimbabwe, exhibit urban
overrepresentation. For Zimbabwe the difference in average constituency size between
urban and rural constituencies in negligible. Zimbabwe's constituencies probably carry
the markers of the country's history of revolutionary upheaval: they reflect both the
historical legacy of an electoral system once designed to favor the disproportionately-

15
urban white community, and recent attempts by the Mugabe regime to dilute the electoral
challenge mounted by urban voters by merging urban and pro-government rural
constituencies (Chigora and Nchizah 2007). The differences in Botswana are larger than
in Zimbabwe, although still relatively small. The Botswana Electoral Commission has
been successful in avoiding malapportionment by the strict use of the population quota
and frequent demarcations based on fresh censuses (Maundeni and Balule 2004).
Figure 3 shows the share of urban and rural constituencies won by the incumbent party in the first
multiparty election recorded in our dataset.11
Figure 3 shows that the incumbent party was significantly
more successful in rural areas than it was in urban constituencies in Zambia, Kenya, Ghana, Botswana, and
Zimbabwe. In Tanzania, where the highly dominant CCM party was able to win almost all constituencies in
both urban and rural locations, the average victory margin was larger in rural (16%) than urban
constituencies (10%). In Gambia, the incumbent party won a clear majority of the seats in both the urban
and rural areas. In Zimbabwe and Botswana, the tendency was very clear. Zanu-PF won over 80% of the
rural constituencies in the 2005 election. In Botswana, the BDP won 74% of the rural seats, but only a
minority of the urban constituencies. In Kenya and Ghana the incumbent parties would have lost their
parliamentary majorities if the entire country had voted like the urban areas (Throup and Hornsby 1998). In
Malawi, the incumbent MCP would have been much closer to getting reelected in 1994 if it had managed to
win as many urban as rural seats. Zambia's incumbent UNIP party only won 25 out of 150 seats in the
1991 election; of these, only one was urban. The pattern observed above is clear: the ancien regimes relied
heavily on rural areas, whereas the opposition parties entering into multipartism were more successful in
the cities. These voting-data results confirm the conclusions of earlier survey-based research (Conroy-
Krutz Forthcoming).12
[Figure 3 about here]
In the electoral turnovers in Zambia in 1991, Malawi 1994, Ghana 2000 and
Kenya 2002, long-time incumbents were ousted by parties with strong urban support
bases. Figure 4 shows patterns of urban/rural electoral support for incumbent regimes in
these countries over time. The full circle on the lines represents the first election after
turnover (i.e. when a newcomer regime presided over legislative elections); other
elections are indicated by a hollow circle. Figure 4 shows clearly that the newcomer
11
Table 5 of the appendix gives a more detailed overview of the share of urban and rural seats won by the
government and opposition party for each election of our dataset. 12
Figure 3 reveals differences in urban and rural voting patterns but does not address the question of how
votes were translated into legislative seats.
16
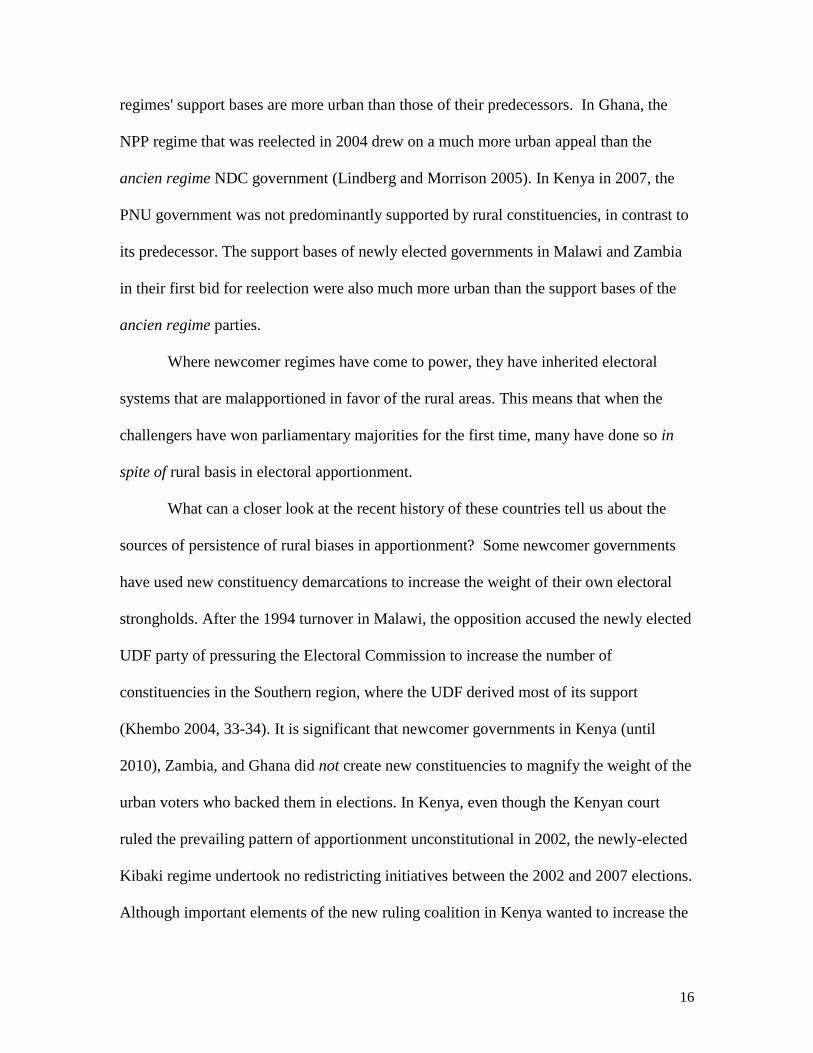
regimes' support bases are more urban than those of their predecessors. In Ghana, the
NPP regime that was reelected in 2004 drew on a much more urban appeal than the
ancien regime NDC government (Lindberg and Morrison 2005). In Kenya in 2007, the
PNU government was not predominantly supported by rural constituencies, in contrast to
its predecessor. The support bases of newly elected governments in Malawi and Zambia
in their first bid for reelection were also much more urban than the support bases of the
ancien regime parties.
Where newcomer regimes have come to power, they have inherited electoral
systems that are malapportioned in favor of the rural areas. This means that when the
challengers have won parliamentary majorities for the first time, many have done so in
spite of rural basis in electoral apportionment.
What can a closer look at the recent history of these countries tell us about the
sources of persistence of rural biases in apportionment? Some newcomer governments
have used new constituency demarcations to increase the weight of their own electoral
strongholds. After the 1994 turnover in Malawi, the opposition accused the newly elected
UDF party of pressuring the Electoral Commission to increase the number of
constituencies in the Southern region, where the UDF derived most of its support
(Khembo 2004, 33-34). It is significant that newcomer governments in Kenya (until
2010), Zambia, and Ghana did not create new constituencies to magnify the weight of the
urban voters who backed them in elections. In Kenya, even though the Kenyan court
ruled the prevailing pattern of apportionment unconstitutional in 2002, the newly-elected
Kibaki regime undertook no redistricting initiatives between the 2002 and 2007 elections.
Although important elements of the new ruling coalition in Kenya wanted to increase the

17
number of seats in parliament before the December 2007 election, parliament voted
against expanding the legislative assembly (The Standard 2007).13
In Zambia, a proposal
to increase the number of electoral constituencies was rejected in 2011, along with the
rest of a new draft constitution. In 2009, the fragmented Malawi parliament, with a split-
up of the UDF and the president's defection from the party, rejected a similar report.
Under the NPP government, which had come to power in a turnover election in 2000,
Ghana undertook a constituency demarcation exercise in 2003, but this did not mitigate
malapportionment or rural bias, and did not seem to have clearly benefited the NPP. The
Electoral Commission appeared be largely free from political pressure (Smith 2011).
Rural bias in apportionment structure has persisted in these countries, even where
electoral turnover brings newcomer regimes to power.14
Malapportionment may persist
because multipartism places new checks and balances on ruling party prerogatives,
constraining new rulers' ability to create new constituencies to magnify the weight of
those who voted them into power. Yet persistence of rural bias may also reflect the
electoral incentives of newcomer parties or their individual members, once they are in
power. After they have taken office, they may see advantages in the status quo
demarcations, or even in accentuating rural bias in apportionment. Although our data do
not allow us to resolve the question of determinants, existing work on elections in
African and other countries with substantial rural populations (discussed in the
conclusion) suggests that incumbent politicians often have incentives to overweight the
rural vote.
13
Kenya's new constitution, which was ratified by voters in 2010, doubled the number of parliamentary
seats allocated to Nairobi. 14
Earlier research on malapportionment in other parts of the world has shown persistence of pre-
democratic representational bias (e.g. Bruhn et al. 2010).

18
The latter possibility may hold for countries like Zambia and Ghana. These
governments saw their urban support bases erode over time (Figure 4). In Zambia's 2006
elections, the ruling MMD lost almost every urban parliamentary seat, and all seats in the
highly urbanized Copperbelt region. The opposition Patriotic Front won 25% of the
national vote, most urban seats, and every constituency in the Copperbelt (Larmer and
Fraser 2007; 312). Ghana's NPP had also lost some of its urban support by the time of the
2006 election. In Malawi, the incumbent UDF lost most of its urban support in 2004. A
very similar process played out in Senegal, a country outside our sample. Abdoulaye
Wade's PDS rode to power on a wave of urban support, but quickly lost this electoral
base. It was ousted by an urban-based opposition coalition in 2012.15
[Figure 4 about here]
VI. Malapportionment and incumbent bias: Multivariate analysis
In the theory sections above, we have theorized that rural-biased malapportionment
reflects the institutional preferences of ancien regimes that were largely dependent on
rural electorates to maintain power. So far, our analysis of malapportionment has been
confined to the system (national) level. In this section, we formulate testable hypotheses
consistent of our understanding of the extent and origin of malapportionment and ask
how electoral district size (electoral apportionment) has correlated with constituency-
level voting patterns over time. Here, we use our dataset of constituency-level electoral
15
In local elections in Senegal in 2009, all major cities (except Ziguinchor) elected opposition candidates.
The party quickly abandoned its advocacy for a more proportional electoral system (Mozaffar and Vengroff
2001).

19
results since the early 1990s to refine the analysis, examining subnational-level and over
time patterns in the data.
We have stipulated that both contemporary apportionment structures and those
found at the introduction to multipartyism reflect the political interest of anciens regimes.
Empirically, the last section showed a strong rural bias in apportionment and a striking
tendency for anciens regimes to rely predominantly on the support from rural
constituencies. However, as shown in figure 2, all rural constituencies did not support the
ancien regimes (and all urban constituencies did not support the opposition). If political
calculations of ancien regimes have affected patterns of apportionment, then we should
also see variations across rural constituencies (ie., even in controlling for urbanness) that
reveal bias favoring the ancien regime, both at the time of introduction of multipartism
and in subsequent contests. Our multivariate analysis allows us to analyze these patterns.
The dependent variable for this analysis is inspired by the work of Ansolabehere
et al. (2002) and measures the over- or under representation of electoral constituency C.
We adopt the following measure to calculate the representation ratio:
(2) repc=scvc
Where sc is the share of seats allocated to the constituency c and vc is constituency c’s
share of the country’s total number of registered voters. A score above 1 would imply
that a constituency has a higher share of seats than registered voters and is thus
overrepresented, whereas a score below 1 reveals underrepresentation. Our units of
analysis are constituencies grouped into countries. Since our units of analysis are
constituencies but national level characteristics might affect the dependent variable (i.e.,

20
the representation ratio), we estimate a country-fixed effect model.16
A country-fixed
effects model is preferable to, for example, a mixed effects multi-level model because our
interest is in variations in apportionment within- rather than between-countries. We
therefore do not include country-level correlates in our models.17
The motivation behind
our analysis is very different form the analysis of the correlates of aggregate, national-
level malapportionment scores, as in Samuels and Snyder (2001). It is worth mentioning,
however, that Samuels and Snyder only found two factors significantly correlated with
higher levels of malapportinment in lower house elections: a dummy for Latin America
and a dummy for SMD. As all our countries are African SMD systems, we have no
variation on these variables within our sample.
To capture the extent to which potential biases have changed over time since 1990
due to redistricting and electoral turnovers, we run our models both for the first and last
recorded election in our dataset.18
For three countries, the Gambia, Tanzania and
Zimbabwe, we are missing data on some of the earlier elections. This problem is,
however, mitigated by the fact that none of these countries have experienced electoral
turnover.19
Based on the discussion about the political nature of electoral jurisdictions and the
pre-democratic origin of rural biased apportionment, we formulate the following
hypotheses for the multivariate analysis.
16
This model specification is preferable to a random effects model, since we have more observations per
unit (constituencies) than units (countries). Moreover, a Hausman test reveals significant correlation
between the unit effects and the covariates in the model. See Hausman 1978 and Clark and Linzer 2012. 17
Also, note that the number of countries would have been too small to estimate a multi-level model. 18
Botswana 1994, Gambia 1997, Ghana 1996, Kenya 1992, Malawi 1994, Tanzania 2005, Zambia 1991
and Zimbabwe 2005. 19
In Gambia, a 1994 coup brought Yahya Jammeh to power. His government held elections in 1997.

21
Hypotheses for multivariate analyses of first elections in dataset:
H1: Rural constituencies were over represented for the first election in our
dataset.
H2: Constituencies supporting the incumbent party were overrepresented in the
first elections.
H3. Constituencies won by the incumbent by a large margin in the first
multiparty elections were even more overrepresented than those that were more
competitive.
Hypotheses for multivariate analyses of the most recent elections in the dataset:
H4 Rural constituencies remain overrepresented in the most recent election.
H5: Malapportionment does not consistently favor the incumbent party in the
most recent election.
H6: Constituencies supporting the incumbent party in the first multiparty election
are still overrepresented in the most recent election.
To test our hypotheses we include a variable in the models accounting for whether
a constituency was won by the government (i.e., incumbent) party. The government or
incumbent party is defined as the party of the incumbent president.
To identify the rural constituencies we use the method described earlier (see
section II). The variable margin of victory measures the difference in vote share (in
fractions) obtained by the winner and the runner-up in a constituency. One model also
includes an interaction term between government and margin of victory. In models

22
containing the data from the last elections in our data series, we also include a variable
accounting for whether a constituency was won by the ancien regime in the first recorded
election of our dataset. Adding this variable somewhat decreases the number of
observations: due to redistricting, there are some new constituencies and some older
constituencies have ceased to exist.
VII. Results
Table 2 investigates Hypotheses 1 and 2 and 3 and shows the results from our country-
fixed effects OLS regression model, using data from the first election for each country in
our dataset. The dependent variable is the representation ratio, or the ratio between a
constituency’s share of parliamentary seats and its share of the total number of registered
voters. Higher representation ratios indicate overrepresentation, while lower numbers
imply underrepresentation. Model 1 includes all 8 countries in the dataset. For reasons
that will be explained later, model 2 excludes the Tanzanian constituencies. In model 3,
the control for urbanness in excluded to see if the coefficient for government support
changes when not controlling for the fact that incumbent ancien regimes were stronger in
rural areas. Model 4 includes an interaction effect between government support and
margin of victory.
[Table 2 about here]
Table 2 shows clearly that the patterns of over- and under-representation were not
random in Africa’s SMD elections at the time of the return to multipartism in the
1990s.The results show that electoral apportionment was structured in a way that

23
magnified incumbents' electoral success. In model 1, the coefficient for government
support is insignificant, but this result is driven by the rather specific dynamics of the
Tanzanian islands of Zanzibar and Pemba.20
In model 2, we exclude Tanzania, and the
coefficient becomes highly significant and positive, supporting the claims in H2, even
when controling for urbanness. Given that ancien regimes unilaterally controlled
electoral apportionment before the introduction of multipartism, and that some did in fact
alter jurisdictions in the run-up to the first multiparty elections, this finding supports our
claim that apportionment structures reflected political incentives motivating the anciens
regimes.
We also find support in model 4 for H3, which predicts that constituencies won
by a large margin by the ancien regime party in multiparty elections of the early 1990s
(ie., won by the incumbent or government party at that time) were especially favored by
malapportionment (i.e., overrepresented). The interaction effect in model 4 turns out to be
highly significant. The results reveal that it was not simply all government-supporting
constituencies that were overrepresented around the time of the reintroduction of
multiparty competition, but specifically those that returned comfortable victories for the
incumbent. Conversely, where constituencies were won by the opposition, high victory
margins were negatively, although insignificantly, correlated with over- or under
representation. Similarly, when the margin of victory is 0, there is no significant
difference in representation between constituencies supporting the opposition and those
20
In Tanzania, the islands of Zanzibar and Pemba exhibit distinctive patterns. In Zanzibar in the 1990s (and
today), electoral constituencies are both small and oppositional. Their size is the intentional effect of the
1964 political deal designed to magnify their weight the future United Republic of Tanzania, which united
the small islands of Zanzibar and Pemba with the much more populous Tanganyika.

24
supporting the incumbent.21
Figure 5 plots the predicted representation ratio for
government and opposition supporting constituencies, conditional on different winning
margins for the first multiparty elections in our dataset.
Figure 5 shows that the difference in representation ratios between government
and opposition constituencies becomes statistically significant when the winning margin
exceeds 32%. With the low levels of local competitiveness in our sample, such
constituencies are rather common. Model 4 includes 878 constituencies and of these, 416
were won by the incumbent party. In 228 of these (55%), the incumbent party’s winning
margin exceeded 33%.
These results suggest, that even in control for urbanness, the ancien regime was favored
by apportionment structures at the time of the introduction to multipartyism. Rural-bias in
apportionment accentuated the incumbent bias in parlimentary representation. The
clearest result in table 2 is the importance of urbanness in predicting constituency size
(votes-to-seats), supporting our claims in H1. The results show that urban constituencies
were significantly less represented than rural constituencies around the time of the
reintroduction of multipartism, even when controlling for voting patterns. The significant
relationship between the urban/rural status of the constituency and its size is not
surprising, given the descriptive statistics shown earlier. As explained in Section II, the
models use a broad definition of “urban” that includes all major cities in each country. If
we classify only the capital city as “urban” and run the models, the coefficient becomes
even larger. When we exclude the “urban” dummy in model 3, the coefficient for
incumbent support increases. These results illustrate how the general rural bias in
electoral-system apportionment exaggerated the bias in favor of the ancien regime.
21
This is a purely theoretic value of the margin variable.

25
[Table 3 about here]
Table 3 uses data from the most recent election in our dataset to investigate H4 and H5.
The models in table 3 test whether patterns of apportionment changed as a result of
demarcation exercises that took place in the 1990s and 2000s. And because four of the
countries in the sample experienced alternations in power, the models in table 4 are a way
to study whether newcomer regimes did away with the old rural bias in apportionment
that systematically favored the ancien regimes.
In accordance with H4, rural constituencies remain overrepresented in the most
recent elections, despite the fact that newcomer regimes have not relied on rural support
to the same extent as ancien regimes. Urban constituencies are still significantly larger
than their rural counterparts, and are thus underrepresented by prevailing structures of
electoral apportionment. In fact, the coefficient for the rural variable is even more
positive in model 5 than in model 1 (showing the situation in the first election).
Meanwhile, the coefficient for the government variable is now significantly
negative, showing that constituencies supporting incumbents in these latest elections are
actually significantly larger than those supporting the opposition (model 5). We, hence,
find support for H5. This result seems to be driven by the presence of the newcomer
parties. In order not to decrease the number of clusters in the analysis, we did not
separate out the newcomer regimes. Yet in three out of the four countries in which
newcomer parties came to power, the incumbent regime was disfavored by
apportionment in the last election of our dataset. The results remain robust when we
exclude the deviant Tanzanian case (models 6 and 7).

26
To further study the persistence of these institutions and investigate H5 and H6,
we introduce a control for whether a constituency was won by the incumbent government
(i.e. the ancien regime) in the first recorded election of our dataset. With this variable, the
coefficient for government support becomes insignificant. Constituencies that supported
the opposition in the first multiparty elections are still underrepresented as suggested in
H6. The results of model 5-7 suggest that the institutional biases in apportionment have
held constant since the return to multipartism, and that newcomer regimes have not
abolished the inherited institutional structure. Possible explanations for this were
discussed in section V.
VIII. Findings and discussion
The eight country, constituency-level data set that we have assembled offers
evidence of the rural-favoring malapportionment embedded in electoral systems inherited
from era that pre-dated real multiparty competition. It shows that with the introduction of
multipartism, most of the longstanding ruling parties (i.e., the political parties of the
ancien regime) drew heavily on rural constituencies to gather votes. With the return of
multiparty competition, most of the old dominant parties fell-back on their rural electoral
strongholds as they faced organized waves of challenge from the cities. Under
multipartism, victories of newcomer parties, civil society groups, and opposition parties
have been, to a large extent, victories of the cities. Triumph in national-level elections
comes when the urban-based political opposition has been able to harness opposition
sentiment in key regional (predominantly rural) constituencies.

27
And although waves of urban support brought newcomer regimes to power in four
of the countries in our sample, systemic biases in systems of apportionment changed little
during the time period that we studied. The weight of the rural areas exerts a strong pull
on political dynamics in African countries.
Why do rulers in largely- or partly-agrarian societies invest in garnering and
institutionalizing rural support? This analysis does not answer this question -- it lies
outside the scope of our research question and data. However, large literatures on party-
building and electoral politics in developing and post-communist countries, some of
which we have already cited, provide clues to an answer. The phenomenon of rural
political and electoral support for dominant, one-party, and electoral authoritarian
regimes has been observed outside of Africa.22
And as Huntington (1968) suggested,
rulers in developing countries have often used rural support and rural votes to
counterbalance opposition-prone cities, and to isolate the unions, urban professionals,
intellectuals, and the urban poor. In Africa as in much of rural Latin America, Asia, and
the Middle East, villages, rural districts, local government areas, ethnic homelands, and
rural settlement schemes often represent captive constituencies. In many places, rural
strongmen owe their positions and power to rulers at the center, and rural voters are less
autonomous from local strongmen, less mobile and more enmeshed in local social
networks, generally poorer and less literate, and easier to monitor than their urban
counterparts (Koter 2013). And for opposition parties in Africa, the monetary,
transaction, and political costs of campaigning in rural areas are often higher than they
are in urban constituencies.
22
See Scheiner (2006) on Japan, Tucker (2006) on the former Soviet Union, and O'Donnell (1993) on
Brazil and other Latin American countries.

28
The oppositional character of the cities remains a constant feature of African
political systems, dating back to the dawn of modern party politics in the 1940s and
1950s (Bates 1981). The pro-democracy (anti-incumbent) movements of the 1990s were
almost exclusively urban-based, as Bratton and van de Walle (1997) pointed out, and in
most of Africa, civil society activism remains a largely urban phenomenon to this day
(Mamdani 1996). Control over rural majorities has provided ballast that has helped many
ruling parties to withstand the forces of urban opposition.
This analysis has three broad implications for understanding the political
character of African states, and how they have been governed since the 1960s. First, it
underscores the importance of control over the rural areas in stabilizing African regimes
of the post-independence era. This finding raises questions about recent work that
suggests that rural support for African incumbents is a dramatic reversal of historical
voting patterns (Harding 2010; Conroy-Krutz Forthcoming).23
Second, rural bias in electoral apportionment remains a strong feature of these
SMD electoral systems. The electoral game has been systematically stacked against the
urban areas. Without ambitious new demarcation exercises, average levels of
malapportionment are likely to increase into the future because of ongoing processes of
urbanization. As our analysis has been confined to SMD systems, there is wide scope for
future research that examines and compares these dynamics across and within other
systems, and that examines logically-prior questions about political determinants of
electoral system choice.
23
Bates and Block (forthcoming) reverse the line of causality, suggesting that rural votes have been a force
promoting public policies.

29
Third, the analysis raises the possibility that rural bias in representation may be
consequential in shaping both policy outcomes and electoral practices in the future.
Rural bias may give rulers incentives to create or maintain pro-smallholder agricultural
policies, or it may reinforce rulers' incentives (including the incentives of newcomer
parties that were hoisted into office by urban supporters) to invest in longstanding forms
of rural political brokerage and institutionalized electoral clientelism.
It is highly likely that these dynamics will vary across countries and perhaps
subnational units. Important new avenues for research lie in seriously examining the
causes and consequences of these uneven patterns of electoral representation. The stakes
of such research will be high not only for scholars, but also for political activists and
electoral authorities in Africa countries. Meanwhile, growing pluralism in African
political systems may serve to cast the inherently political character of electoral
demarcation processes in ever starker relief.
Acknowledgement
We thank Joe Amick, Daniel Chapman and Josiah Marineau,for assistance in gathering and preparing data
for this paper. Funds from the University of Texas Long Chair in Democratic Studies financed some of the
work. Wahman is thankful for financial support from the Swedish Research Council (Dnr 2012-6653). We
thank Jørgen Elklit and John Ishiyama for providing some electoral data and Matthijs Bogaards, Jeffrey
Conroy-Krutz, Jørgen Elklit, Amy Poteete, Milan Svolik, and Dwayne Woods for valuable comments.
Earlier versions were presented at the 2013 Annual Meeting of the American Political Science Association
on 31 August 2013 and the 2013 General Conference of the European Consortium of Political Research, on
7 September 2013.
Reference List
Ansolabehere, S., Gerber, A., Snyder, J., 2002. Equal Votes, Equal Money: Court Ordered Redistricting
and Public Expenditures in the American Stares. American Political Science Review 96(4), 767-77.
Aubynn, AK., 2002. Behind the Transparent Ballot Box: The Significance of the 1990s Elections in Ghana,
in Cowen, M., Laakso, L., (Eds.), Multi-party Elections in Africa. New York: Palgrave.
Barkan, J.D., Densham, P.J., Rushton G., 2006. Space Matters: Designing Better Electoral Systems for
Emerging Democracies. American Journal of Political Science 50(4), 926-39.
Barkan, J.D., (Ed.), 2009. Legislative Powers in Emerging African Democracies.
Boulder: Lynne Rienner Publishers.

30
Bates, R.H., 1981. Markets and States in Tropical Africa. Los Angeles: University of
California Press.
Bates, R.H., Coatsworth, J.H., Williamson, J.G., 2007. Lost Decades: Post-independence Performance in
Latin America and Africa. Journal of Economic History. 67(4), 917-943.
Bates, R.H., Block, J., forthcoming. Revisiting African Agriculture: Institutions Change and Productivity
Growth. Journal of Politics.
Baylies, C., Szeftel, M., 1984. Introduction: The Making of the One-party State. in Gertzel, C., Baylies, C.,
Szeftel, M., (Eds.), The Dynamics of the One-party State in Zambia. Manchester: Manchester University
Press.
Beck, T., Clark, G., Groff, A., Keefer, P., Walsh, P., 2001. New Tools in Comparative Political Economy:
The Database of Political Institutions. World Bank Economic Review, 15, 775-803.
Bratton, M., van de Walle, N., 1997. Democratic Experiments in Africa: Regime Transitions in
Comparative Perspective. Cambridge: Cambridge University Press.
Bratton, M., Bhavani, R., Chen, T-H., 2012. Voting Intentions in Africa: Ethnic, Economic or Partisan?
Commonwealth and Comparative Politics, 50( 1), 27-52.
Brownlee, J., 2007. Authoritarianism in an Age of Democratization. New York: Cambridge University
Press.
Broz, J. L.,Maliniak, D., 2010. Malapportionment, Gasoline Taxes, and Climate Change. Paper
presented at the annual meeting of the American Political Science Association, Washington DC,
September 1-4.
Bruhn, M., Gallego, F., Onorato, M., 2010. Legislative Malapportionment and Institutional
Persistence. World Bank Policy Research Working Paper, 5467.
Carter Center, 2002. The Final Report from the Carter Center on the 2002 Kenyan elections
Chaisty, P., Cheeseman, N., Power, T., 2014. Rethinking the ‘Presidentialism Debate’:
Conceptualizing Coalition Politics in Cross-Regional Perspective. Democratization 21(1), 72-94.
Chazan, N,. 1979. African Voters at the Polls: A Re-examination of the Role of Elections in
Politics. Journal of Commonwealth and Comparative Politics 17( 2), 136-158. Chigora, P., Nciizah, E., 2007. Electoral Fraud in Zimbabwe: A Critical Analysis of Parliamentary and
Presidential Elections. Unpublished Manuscript, Department of History and Development Studies,
Midlands State University, Zimbabwe.
Clark, T., Linzer D.A., 2012. Deciding Between Fixed and Random Effects. APSA-Comparative Politics
Newsletter 22(1), 9-10.
Commonwealth Secretariat., 2009. The Final Report of the Commonwealth Observer Group on the 2009
Malawi election.
Conroy-Krutz, J., Forthcoming. African Cities and Incumbent Hostility: Explaining Opposition Success in
Urban Areas. Unpublished Manuscript.
European Union. 2011. Final Report on EU EOM Zambia 2011.
Fox, R., 1996. Bleak Future for Multi-Party Elections in Kenya. The Journal of Modern Africa Studies.
34(4), 597-607.
Fridy, K.S., 2007. The Elephant, Umbrella, and Quarrelling Cocks: Disaggregating Partisanship in Ghana’s
Fourth Republic. African Affairs 106(423), 281-305.
Gandhi, J., 2008. Political Institutions under Dictatorship. Cambridge: Cambridge University Press.
Green, E., 2010. Patronage District Creation, and Reform in Uganda. Studies in Comparative International
Development 45(1), 83-101.
Grossman, G., Lewis, J.I., 2014. Administrative Unit Proliferation. American Political Science Review
108(1), 196-217.
Harding, R., 2010. Urban-Rural Differences in Support for Incumbents Across Africa. Afrobarometer
Working Papers, Working Paper 120, June.
Harris, B., 1967. The Electoral System, in Cliffe, L., (Ed.) One Party Democracy: The 1965 Tanzania
General Elections. Nairobi: East Africa Publishing House.
Hassan, M., Forthcoming. District Creation in Kenya under President Moi. Democratization.
Hausman, J.A., 1978. Specification Tests in Econometrics. Econometrica 46(6), 1251-71.
Herbst, J., 2000. States and Power in Africa: Comparative Lessons in Authority and Control. Princeton:
Princeton University Press.

31
Hughes, A., Perfect, D., 2008. A Political History of the Gambia, 1816-199. Rochester: University of
Rochester Press.
Huntington, S.P., 1968. Political Order in Changing Societies. New Haven: Yale University Press.
Hyden, G., 1980. Beyond Ujamaa in Tanzania: Underdevelopment and an Uncaptured Peasantry.
Berkeley: University of California Press.
Hyden, G., Leys, C., 1972. Elections and Politics in Single-Party Systems: The Case of Kenya and
Tanzania. British Journal of Political Science 2(4), 389-422.
Institute for Education in Democracy., 1998. Understanding Elections in Kenya: A Constituency Profile
Approach. Nairobi.
Ishiyama, J., Batta, A., Sortor, A., 2013. Political Parties, Independents and the Electoral Market in Sub-
Saharan Africa. Party Politics 19(5), 695-712.
Khembo, N., 2004. The Anatomy of Electoral Democracy in Malawi: Neo-Authoritarianism in a Multiparty
State, in Jeanette M., (Ed.) Outside the Ballot Box: Preconditions for Elections in Southern Africa.
Windhoek: Media Institute of Southern Africa.
Kollman, K., Hicken, A., Caramani, D., Backer, D., 2012. Constituency-Level Elections Archive (CLEA).
Ann Arbor MI: University of Michigan.
Koter, D., 2013. Urban and Rural Voting Patterns in Senegal: the Spatial Aspect of Incumbency, 1978-
2012. The Journal of Modern Africa Studies 51(4), 653-79.
Kuenzi, M., Lambright, G., 2007. Voter Turnout in Africa’s Multiparty Regimes. Comparative Political
Studies 40(6), 665-90.
Laakso, L., 2002. When Elections are Just a Formality: Rural-Urban Dynamics in the Dominant-Party
System of Zimbabwe. in Cowen, M., Laakso, L.L (Eds.) Multi-party Elections in Africa. New York:
Palgrave.
Larmer, M., Fraser, A., 2007. Of Cabbages and King Cobra: Populist Politics and Zambia’s 2006 Election.
African Affairs 106(453), 611-637.
Lindberg, S.I., Morrison, M.KC., 2005. Exploring Voter Alignment in Africa: Core and Swing Voters in
Ghana. Journal of Modern Africa Studies 43( 4), 1-22.
Lust-Okar, E., 2005. Structuring Conflict in the Arab World: Incumbents, Opponents, and Institutions.
Cambridge: Cambridge University Press.
Mamdani, M., 1996. Citizens and Subjects Contemporary Africa and the Legacy of Late Colonialism.
Princeton: Princeton University Press.
Maundeni, Z., Balule, T. 2004. Elections and Civil Society in Botswana. in Minnie, J (Ed.) Outside the
Ballot Box: Preconditions for Elections in Southern Africa. Windhoek: Media Institute of Southern Africa.
Mozaffar, S., Vengroff, R., 2001. A ‘Whole System’ Approach to the Choice of Electoral Rules in
Democratizing Countries: Senegal in Comparative Perspective. Electoral Studies 21( 4), 601-16.
O'Donnell, G., 1993. On the State, Development, and some Conceptual Problems: A Latin American View
with Some Glances at Post-Communist Countries. World Development 21(8), 1355-69.
Olson, M., 2000. Outgrowing Communist and Capitalist Dictatorship. New York: Basic Books.
Rakner, L., Svåsand, L., 2005. Maybe Free but not Fair: Electoral Administration in Malawi 1994-2004.
CMI Working paper, no. 5.
Samuels, D., Snyder, R., 2001. The Value of a Vote: Malapportionment in a Comparative Perspective.
British Journal of Political Science 31(3), 651-71.
Scheiner, E., 2006. Democracy without Competition in Japan: Opposition Failure in a One-Party State.
Cambridge: Cambridge University Press.
Smith, D.A., 2002. Consolidating Democracy? The Structural Underpinnings of Ghana’s 2000 Elections.
The Journal of Modern Africa Studies, 40(4), 621-50.
--. 2011. The Re-demarcation and Reapportionment of Parliamentary Constituencies in Ghana. Accra,
Ghana: Center for Democratic Development Briefing Papers 10(2).
The Standard. 2007. "Kenya: Battle Lines Drawn Over New Constituency Plan," July 22.
Throup, D., Hornsby, C., 1998. Multiparty Politics in Kenya: The Kenyatta and Moi State and the Triumph
of the System in the 1992 Election. Athens, University of Ohio Press.
Tsie, B., 1996. Political Context of Botswana’s Development Performance. Journal of Southern Africa
Studies 22(4), 599: 616.
Tucker, J., 2006. Regional Economic Voting: Russia, Poland, Slovakia and the Czech Republic 1990-1999.
New York: Cambridge University Press.
Waldner, D., 1999. State Building and Late Development. Ithaca: Cornell University Press.

32
Widner, J.A., 2000. The Rise of a Party-State in Kenya: From "Harambee!" to "Nyayo!" Berkeley:
University of California Press.
Wiseman, J.A., Charlton, R., 1995. The October 1994 Elections in Botswana. Electoral Studies 14(3), 323-
28.

33
Figures and tables
Figure 1: Electoral Malapportionment index- Country scores and change over time
Note: Malapportionment is calculated in relation to the elections included in our dataset. The reference line
indicates the global mean in the Samuels and Snyder (2001) article. Samuels and Snyder do not study
malapportionment over time, hence, we plotted the reference line as a constant over time.

34
Table 1: Demarcation Exercises: Increase in parliamentary seats from benchmark year (i.e., first post
independence SMD election) to last election in dataset *
Botswana Year 1969 1972 1982 1992 2002 2009
(31) +1
+2 +6 +17
(57)
Gambia Year 1966 1977 1987 1997 2002 2007 (32) +3
+1 +9 +3
(48)
Ghana Year 1969 1992 2003 2008 (140) +60 +30
(230) Kenya Year 1969 1987 1996 2007
(158) +30 +22
(210)
Malawi Year 1964 1973 1983 1987 1992 1993 1998 2009 (50) +10 +38 +11 +29 +39 +16
(193)
Tanzania Year 1965 1970 1975 1980 1985 1990 1995 2005 2010
(111) +13 -24 +15 +58 +14 +51 +1 +7 (239)
Zambia Year 196824
1973
1991
2006
(105) +20
+25
(150) Zimbabwe Year 1990
25 1995 2005 2008
(120) +0 +0 +90
(210)
Note: Included are all demarcation exercises occurring under SMD rules (unified roll) after independence.
Grey cells indicate that demarcation was executed under de facto multipartism. First number within
parentheses indicates the number of seats in parliament at benchmark year, last number within parentheses
the number of seats in the last election of our dataset. In cases where the exact date for the exercise is
unknown, the year indicated is that of the first election under the new electoral boundaries. +0 is
redemarcation with no new. Sources: Botswana, Tsie 1996: 599: 616; Wiseman and Charlton 1995: 323-28,
Gambia, Hughes and Perfect 2008; Interparliamentary Union 1997, 2002, 2007, Ghana, Aubynn 2002;
Smith 2011, Kenya, Fox 1996: 597-607; Institute for Education in Democracy 1998, Malawi, Khembo,
2004: 33-34; Rakner and Svåsand 2005:5, Tanzania, Harris 1967; Interparliamentary Union 1975, 1980,
1985, 1990, Zambia, Baylies and Szeftel 1984; Carter Center 1992; European Union Election Observation
Mission 2011, Zimbabwe, Laakso 2002; Chigora and Nciizah 2007.
24
First election without the “main roll” and “reserved roll” system. 25
First election without the “white roll” and “common roll” system in Zimbabwe, at this point Zimbabwe
was already arranging multiparty elections.
35
Figure 2: Rural bias in apportionment
Note: Graph shows the average number of registered voters in rural constituencies/ number of registered
voters in urban constituencies. Circles indicate elections.
Source: Authors’ Dataset

36
Figure 3: Share of urban and rural constituencies won by the incumbent in the first post 1990 competitive
election
Note: Statistics represent the % of constituencies in each category (urban or rural) voting in support of the
government party. Source: authors' dataset

37
Figure 4: Urban and rural constituencies' support for the governing party in countries with electoral
turnovers
Note: Statistics represent the % of constituencies in each category (urban or rural) voting in support of the
government in office at the time of the election. Filled circles represent the first election in a country after
an electoral turnover (i.e. were the ancien regime has been replaced by a newcomer regime.), hollow circles
show other elections. Source: Authors' dataset

38
Table 2: Country-fixed effect regression model on representation ratio: First election in dataset
(1) (2) (3) (4)
Government -.024
(.072)
.165***
(.050)
.232***
(.050)
-.032
(.086)
Rural .372***
(.088)
.380***
(.067)
_ .370***
(.067)
Margin of winning .329***
(.118)
.042
(.091)
.065
(.092)
-.185
(.121)
Government*
Margin of victory
_ .490***
(.174)
Constant .898***
(.096)
.801***
(.081)
1.083***
(.052)
.912***
(.081)
Including Tanzania YES NO NO NO
Constituencies 1093 878 878 878
Countries 8 7 7 7
Within country R2 .025 .060 .025 .068
*** p<.01 **p<.05 *p<.10
Note: Country fixed effect regression models. Entries represent coefficient with standard errors given
within parentheses. Model 1 includes Botswana 1994, the Gambia 1997, Ghana 1996, Kenya 1992, Malawi
1994, Tanzania 2000, Zambia 1991 and Zimbabwe 2005 elections. Models 2-4 exclude Tanzania.

39
Figure 5: Interaction effects prediction for first multiparty election: support for incumbent and
overrepresentation
Note: The dotted line shows the predicted representation ratio for constituencies won by the government
party and the solid line constituencies won by an opposition party. The grey areas indicate the 90%
confidence interval. Predictions based on model 4 in table 2.

40
Table 3: Country-fixed effect regression model on representation ratio: Last election in dataset
(5) (6) (7)
Government -.436***
(.090)
-.078**
(.038)
-.045
(.049)
Rural .386***
(.111)
.358***
(.049)
.438***
(.069)
Margin of winning .325*
(.195)
-.126
(.088)
-.142
(.115)
Ancien Regime _ _ .119**
(.050)
Constant 1.272***
(.116)
.953***
(.051)
.830***
(.070)
Including Tanzania YES NO NO
Constituencies 1284 1062 760
Countries 8 7 7
Within country R2 .025 .053 .075
*** p<.01 **p<.05 *p<.10
Note: Country fixed effect regression models. Entries represent coefficient with standard errors given
within parentheses. Model 5 includes Botswana 1994, the Gambia 1997, Ghana 1996, Kenya 1992, Malawi
1994, Tanzania 2000, Zambia 1991 and Zimbabwe 2005 elections. Models 6-7 exclude Tanzania.

41
Appendix
Table 4: Number of registered voters: Largest city electoral constituencies and average for all other
constituencies
Largest city Country Year Average in
largest city
Average for
other urban
constituencies
Average for
rural
constituencies
Gaborone Botswana 1994 7585 9986 9373
2009 13597 11257 13013
Serekunda/Banjul Gambia 1997 14687 21562 8659
2007 16697 34130 13630
Accra Ghana 1996 90204 70259 41384
2008 105717 82868 47460
Nairobi Kenya 1992 79846 63609 39755
2007 166275 103119 62378
Lilongwe Malawi 1994 31372 27602 20547
2009 60828 44467 29016
Dar es Salaam Tanzania 2000 140094 42071 41131
2010 299842 120587 90067
Lusaka Zambia 1991 44592 31958 16280
2006 66546 32693 23229
Harare Zimbabwe 2005 45340 47710 47348
2008 26027 26613 26814
Source: Authors’ Dataset

42
Table 5: Share of urban and rural seats won by incumbent party
Urban Share Rural Share
Botswana 1994 33.33 73.53
1999 50 88.24
2004 69.23 79.55
2009 84.62 77.27
Gambia 1997 71.43 66.67
2007 100 85
Ghana 1996 33.33 70.52
2000 14.29 51.46
2004 69.44 53.09
2008 51.43 46.35
Kenya 1992 41.18 54.39
1997 40 58.57
2002 25 38.10
2007 30 30.66
Malawi 1994 22.22 47.18
1999 64.71 48.02
2004 35.29 27.48
2009 58.82 53.76
Tanzania 2000 90.9 87.72
2005 88.46 87.79
2010 76.47 78.19
Zambia 1991 4.35 20.47
1996 86.96 85.83
2001 52.17 45.67
2006 8.70 57.72
Zimbabwe 2005 19.44 85.54
2008 9.84 63.09
Note: Entries show the share of urban and rural seats won by incumbent party. Grey cells show elections
where a newcomer party is in government.