catherine amy allsop masters of science by research allsop... · fabric analysis of the samples...
TRANSCRIPT
AN EVALUATION OF BASE LAYER COMPRESSION GARMENTS FOR
SPORTSWEAR
CATHERINE AMY ALLSOP
A thesis submitted in partial fulfilment of
the requirements of the Manchester Metropolitan University for the degree of
Masters of Science by Research
Department of Clothing Design and
Technology the Manchester Metropolitan University
2012

ii
Acknowledgement
I would like to thank my supervisory team Dr D. Tyler, Dr P. Venkatraman and Dr
Z. Chen for their guidance over the past year.
Kind thanks also to the technical staff at the Hollings campus that have assisted
me during my experimental work.

iii
Dedication
I dedicate this thesis to my friends and family. Particularly to my parents, Madeline
and David Allsop, who have supported me not only during this MSc but also on
any task I set out to complete, and to Benjamin Dalby for his constant support and
motivation over the past year.
iv
Abstract
Consumption of functional sportswear to enhance performance on and off the field
of elite athletes has increased in the recent past in the UK. Compression
sportswear in particular, based on evidence on compression therapy which was
widely used for treating venous disorders, is now apparent in the ready to wear
market.
The completion of a literature review documented the history of compression
garments, highlighted benefits of wearing compression sportswear and different
pressure measurement systems currently used. To further analyse ready to wear
compression sportswear, five brands of commercially available compression
garments were examined with reference to size and seam types. Additionally,
fabric analysis of the samples highlighted variations between brands.
The lack of research currently available regarding variations of pressure
distribution, of the same specified size, inhibits informed consumer choices within
the market.
Using the Tekscan system the pressures exerted by the five medium samples
were also analysed. Differences were found between the pressure values
recorded, thus highlighting the differences amongst ready to wear garments of the
same size.
Next, using a 3D avatar in V-Stitcher two of the garments were simulated. FAST
testing was also completed and results put into the software to give a true to life
representation of the fabrics tested. The simulation of the experimental work was
then assessed via the pressure maps on the system to observe whether the
values given in the CAD model matched the experimental work.
The expanding compression market needs to take in to account contributing
factors, such as fabric composition, garment dimensions and placements of
seams, when developing garments. The development of a simulation model that
can map experimental work with regards to pressure distribution may allow the
product development of compression base layers to be better assessed and help
enable informed consumer choices.
v
Contents
Acknowledgement.............................................................................................................ii
Dedication ..........................................................................................................................iii
Abstract.............................................................................................................................. iv
Contents.............................................................................................................................. v
List of Figures ................................................................................................................ viii
List of Tables .................................................................................................................... ix
List of Abbreviations ....................................................................................................... x
List of Measurement Abbreviations ........................................................................... xi
1.0 Introduction ................................................................................................................. 1
1.1 Introduction ............................................................................................................... 1
1.2 Aims ........................................................................................................................... 2
1.3 Chapter Summary.................................................................................................... 3
2.0 Literature Review ....................................................................................................... 4
2.1 Medical Compression.............................................................................................. 4
2.2 Expansion into Sportswear..................................................................................... 7
2.3 Perceived Benefits when using Compression ..................................................... 9
2.3.1 Noticeable Benefits to Performance ............................................................ 11
2.3.2 Small Benefits to Performance ..................................................................... 12
2.3.3 No Benefits to Performance.......................................................................... 13
2.3.4 Benefits to Recovery ...................................................................................... 14
2.3.5 No Benefits to Recovery................................................................................ 15
2.4 Psychology of Compression Garments .............................................................. 15
2.5 Pressure Measurement Systems ........................................................................ 17
2.6 Sizing ....................................................................................................................... 21
2.6.1 Body Shapes ................................................................................................... 22
2.6.2 Sizing for Stretch Garments.......................................................................... 24
vi
2.7 3D Simulation ......................................................................................................... 25
2.8 Summary ................................................................................................................. 26
3.0 Methodology ............................................................................................................. 28
3.1 Deduction and Induction ....................................................................................... 28
3.2 Aim One................................................................................................................... 30
3.3 Aim Two................................................................................................................... 33
3.4 Aim Three................................................................................................................ 35
3.4.1 Fabric Assurance by Simple Testing (FAST) ............................................. 35
4.0 Database of Garments............................................................................................ 38
4.1 Garment Overview ................................................................................................. 38
4.2 Fabric ....................................................................................................................... 38
4.2.1 Fabric Analysis................................................................................................ 39
4.2.2 Stretch and Recovery .................................................................................... 40
4.3 Garment Measurements ....................................................................................... 42
4.4 Stitches .................................................................................................................... 46
4.4.1 Positioning of Seams ..................................................................................... 47
4.5 Summary ................................................................................................................. 49
5.0 Compression Measurement Analysis ................................................................ 51
5.1 Pressure Measurement Analysis......................................................................... 52
5.1.1 Fabric Properties ............................................................................................ 56
5.1.2 Garment Measurements................................................................................ 57
5.1.3 Seams and Construction ............................................................................... 57
5.2 Summary ................................................................................................................. 59
6.0 Simulation Model ..................................................................................................... 61
6.1 Fabric Assurance by Simple Testing (FAST) Results ...................................... 61
6.1.1 Compression ................................................................................................... 63
6.1.2 Bending Rigidity .............................................................................................. 63
6.1.3 Extensibility...................................................................................................... 64
6.1.4 Shear Rigidity .................................................................................................. 65

vii
6.1.5 Formability ....................................................................................................... 65
6.2 3D Simulation Model ............................................................................................. 66
6.2.1 Simulation of Sample A ................................................................................. 69
6.2.2 Simulation of Sample E ................................................................................. 71
6.3 Summary ................................................................................................................. 72
7.0 Conclusions and Recommendations ................................................................. 74
7.1 Conclusions ............................................................................................................ 74
7.2 Recommendations ................................................................................................. 76
References ....................................................................................................................... 78
Appendix........................................................................................................................... xii

viii
List of Figures
Figure 2.1 Key Areas of Stretch ....................................................................................... 7
Figure 2.2 Male Body Shapes ........................................................................................ 22
Figure 2.3 Female Body Shapes ................................................................................... 23
Figure 3.1 The Process of Deduction............................................................................ 29
Figure 3.2 4201 Sensor ................................................................................................... 33
Figure 3.3 Areas to be measured using Tekscan ....................................................... 34
Figure 4.1 Measurement Points in a Typical Base Layer .......................................... 42
Figure 4.2 to 4.6 Positioning of Seams ......................................................................... 48
Figure 5.1 Colour Legend for Tekscan ......................................................................... 52
Figure 5.2 Distribution of Pressure ................................................................................ 53
Figure 5.3 Sample A Point 1 (shoulder)........................................................................ 54
Figure 5.4 Sample B Point 1 (shoulder)........................................................................ 54
Figure 5.5 Sample C Point 1 (shoulder) ....................................................................... 54
Figure 5.6 Sample D Point 1 (shoulder) ....................................................................... 54
Figure 5.7 Sample E Point 1 (shoulder)........................................................................ 54
Figure 5.8 Sample A Point 5 (hem) ............................................................................... 55
Figure 5.9 Sample B Point 5 (hem) ............................................................................... 55
Figure 5.10 Sample C Point 5 (hem) ............................................................................. 55
Figure 5.11 Sample D Point 5 (hem) ............................................................................. 55
Figure 5.12 Sample E Point 5 (hem) ............................................................................. 55
Figure 5.13 Sample A Point 6 (C.F neck) ..................................................................... 59
Figure 5.14 Sample E Point 6 (C.F neck) ..................................................................... 59
Figure 5.15 Sample A Point 7 (C.F chest).................................................................... 59
Figure 5.16 Sample E Point 7 (C.F chest).................................................................... 59
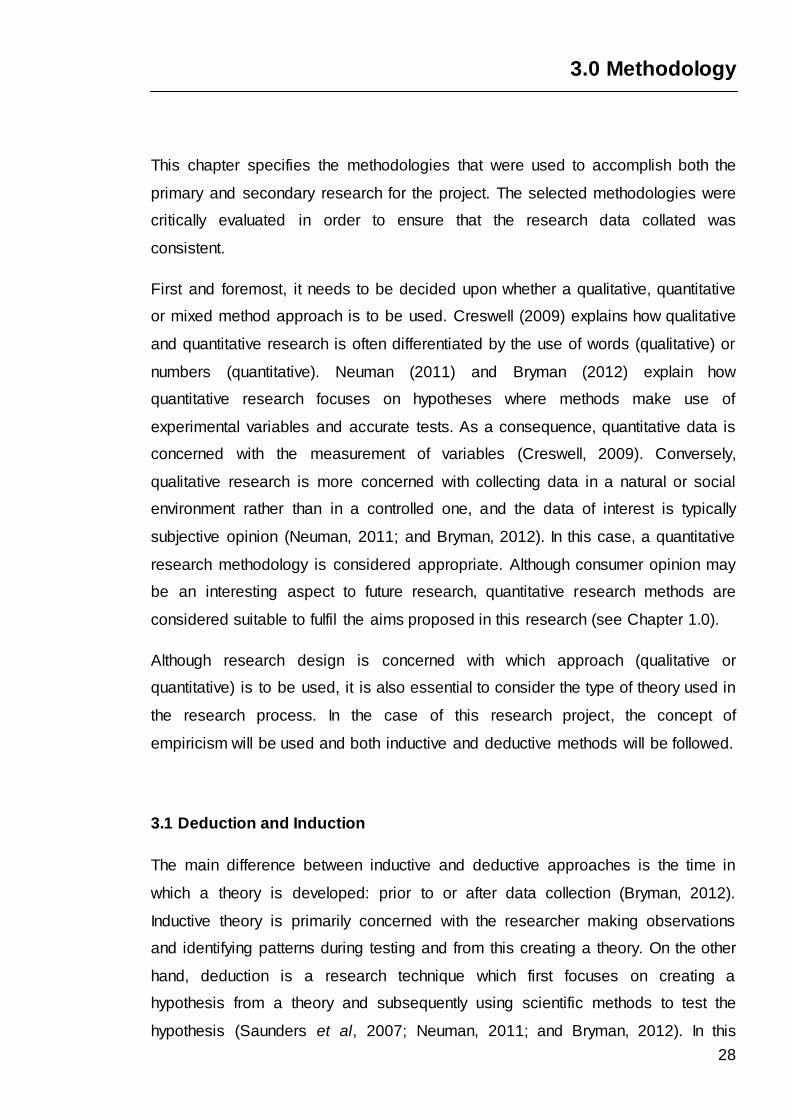
Figure 6.1 Process Flow Diagram for the Simulation Model ..................................... 66
Figure 6.2 Sample A ........................................................................................................ 67
Figure 6.3 Sample E ........................................................................................................ 67
Figure 6.4 Pressure Scale in V-Stitcher........................................................................ 69
Figure 6.5 Simulation of Sample A ................................................................................ 70
Figure 6.6 Pressure Map of Sample A .......................................................................... 70
Figure 6.7 Simulation of Sample E ................................................................................ 72
Figure 6.8 Pressure Map of Sample E .......................................................................... 72
ix
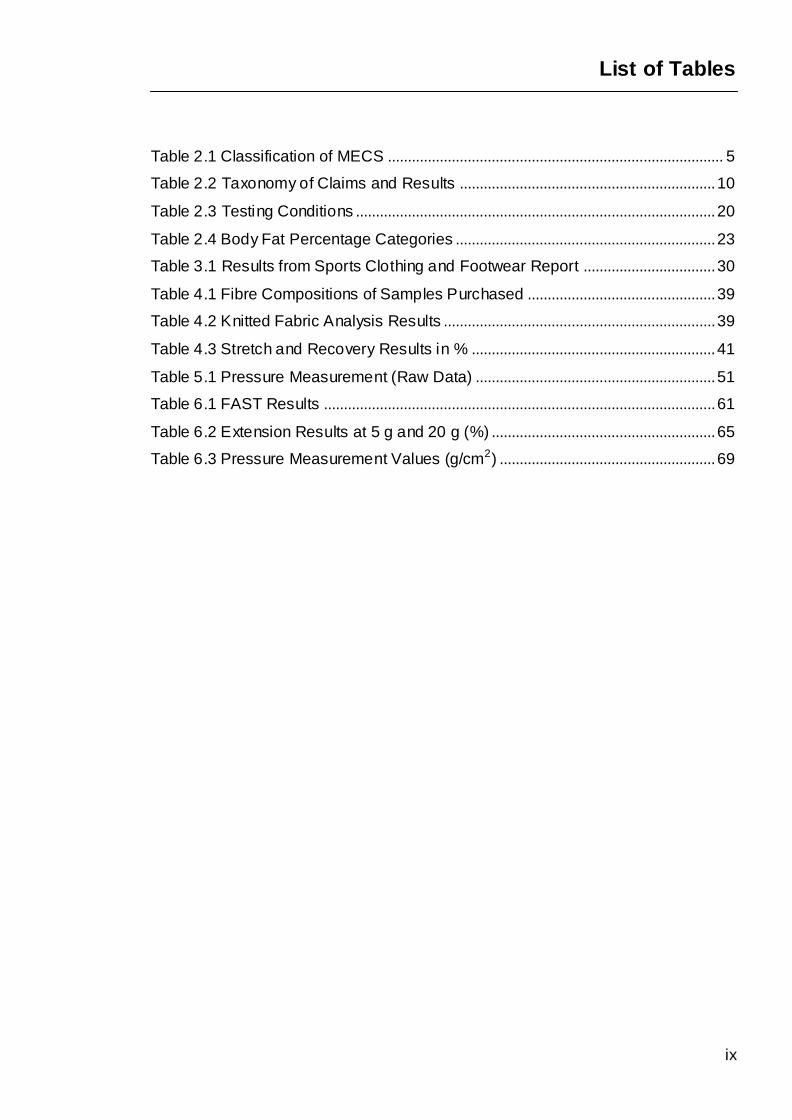
List of Tables
Table 2.1 Classification of MECS .................................................................................... 5
Table 2.2 Taxonomy of Claims and Results ................................................................ 10
Table 2.3 Testing Conditions .......................................................................................... 20
Table 2.4 Body Fat Percentage Categories ................................................................. 23
Table 3.1 Results from Sports Clothing and Footwear Report ................................. 30
Table 4.1 Fibre Compositions of Samples Purchased ............................................... 39
Table 4.2 Knitted Fabric Analysis Results .................................................................... 39
Table 4.3 Stretch and Recovery Results in % ............................................................. 41
Table 5.1 Pressure Measurement (Raw Data) ............................................................ 51
Table 6.1 FAST Results .................................................................................................. 61
Table 6.2 Extension Results at 5 g and 20 g (%) ........................................................ 65
Table 6.3 Pressure Measurement Values (g/cm2) ...................................................... 69

x
List of Abbreviations
2D Two Dimensional
3D Three Dimensional
CAD Computer Aided Design
C.F Centre Front
CSIRO Commonwealth Scientific and Industrial Research Organisation
FAST Fabric Assurance by Simple Testing
KES-F Kawabata Evaluation System for Fabrics
MECS Medical Elastic Compression Stockings
NASA National Aeronautics and Space Administration
UK United Kingdom

xi
List of Measurement Abbreviations
ºC Degrees Celsius
µN Micro Newton
cm Centimetre
g Gram
hPa Hectopascal
in Inch
m Metre
mm Millimetre
mm Hg Millimetres of Mercury
N Newton
1
1.0 Introduction
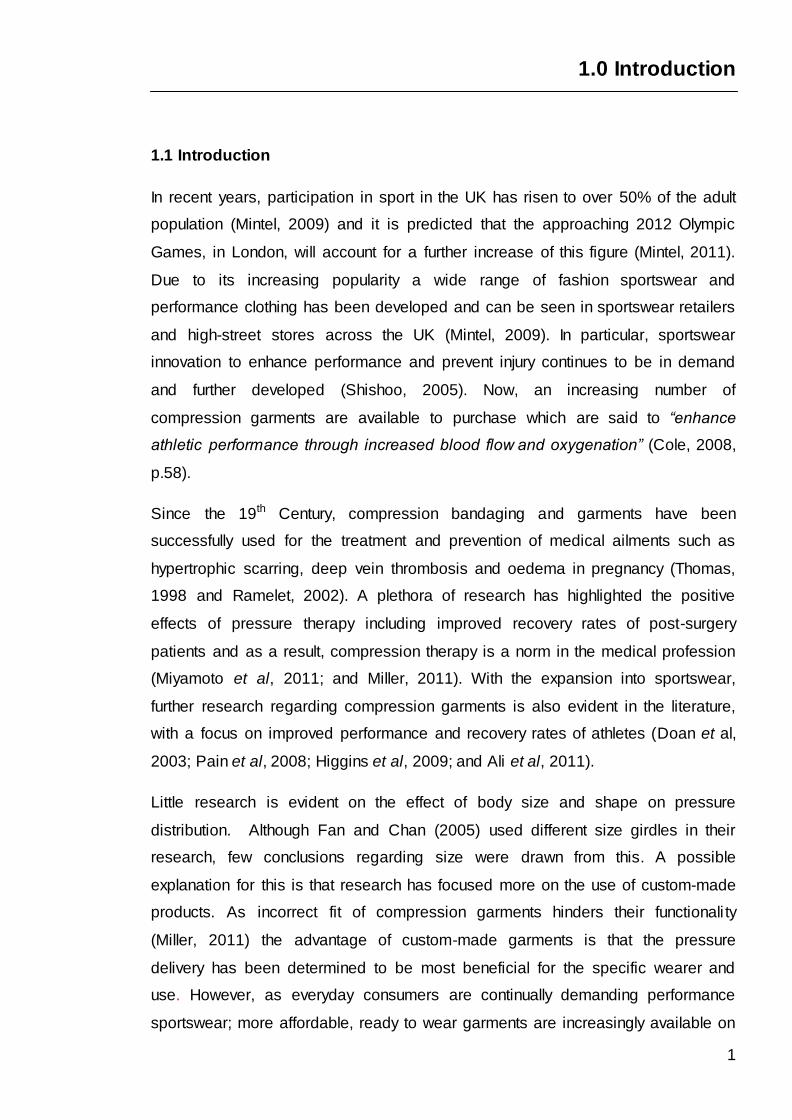
1.1 Introduction
In recent years, participation in sport in the UK has risen to over 50% of the adult
population (Mintel, 2009) and it is predicted that the approaching 2012 Olympic
Games, in London, will account for a further increase of this figure (Mintel, 2011).
Due to its increasing popularity a wide range of fashion sportswear and
performance clothing has been developed and can be seen in sportswear retailers
and high-street stores across the UK (Mintel, 2009). In particular, sportswear
innovation to enhance performance and prevent injury continues to be in demand
and further developed (Shishoo, 2005). Now, an increasing number of
compression garments are available to purchase which are said to “enhance
athletic performance through increased blood flow and oxygenation” (Cole, 2008,
p.58).
Since the 19th Century, compression bandaging and garments have been
successfully used for the treatment and prevention of medical ailments such as
hypertrophic scarring, deep vein thrombosis and oedema in pregnancy (Thomas,
1998 and Ramelet, 2002). A plethora of research has highlighted the positive
effects of pressure therapy including improved recovery rates of post-surgery
patients and as a result, compression therapy is a norm in the medical profession
(Miyamoto et al, 2011; and Miller, 2011). With the expansion into sportswear,
further research regarding compression garments is also evident in the literature,
with a focus on improved performance and recovery rates of athletes (Doan et al,
2003; Pain et al, 2008; Higgins et al, 2009; and Ali et al, 2011).
Little research is evident on the effect of body size and shape on pressure
distribution. Although Fan and Chan (2005) used different size girdles in their
research, few conclusions regarding size were drawn from this. A possible
explanation for this is that research has focused more on the use of custom-made
products. As incorrect fit of compression garments hinders their functionali ty
(Miller, 2011) the advantage of custom-made garments is that the pressure
delivery has been determined to be most beneficial for the specific wearer and
use. However, as everyday consumers are continually demanding performance
sportswear; more affordable, ready to wear garments are increasingly available on

2
the market. A lack of research focused on the sizing of ready to wear compression
garments is currently available. This deficiency is inhibiting informed consumer
choices when purchasing compression sportswear. Therefore, there is a need for
research in the area.
In order to analyse the influence of garment shape, fabric type and body shape on
compression base layers, the pressures exerted need to be determined. It is
thought that clothing technologists would benefit from a standardised system to
measure the areas of compression. Ferguson-Pell et al (2000) explains how a
wide range of pressure measurement systems currently exist to determine the
pressure values exhibited through compression garments. However, there is often
disagreement in the literature over the most accurate and appropriate method to
use.
This research aims to analyse compression variations between commercially
available garments. Different brands will be of particular interest to consider the
effect of fabric type and garment shape on the distribution of compression.
Moreover, the use of a CAD model, that will allow the mapping of experimental
work with compression against a virtual system, will be investigated to observe
how beneficial such systems may be for the future product development of
sporting apparel. The hypothesis of the project is that many variations will be
encountered between the distributions of pressure on same size garments.
Development in the product development of such garments may allow for
variances to be highlighted and greater understood.
1.2 Aims
1. To analyse current base layer products in sportswear, with particular
reference to dimensions, materials and construction.
2. To measure the compression exerted by medium sized upper base layer
garments, on a mannequin, with particular reference to the influence of
material properties, garment construction and body shapes.
3. To create a CAD model that allows the mapping of experimental work with
compression against a virtual system.

3
1.3 Chapter Summary
The next section, Chapter 2.0, is an analysis of the published research in the area,
with particular focus on the increasing popularity of base layer compression
garments for sportswear, the benefits claimed for wearing such compression
garments and the different pressure measurement systems previously and
currently used.
Chapter 3.0, Methodology, details the primary and secondary research methods
used within this research to meet the aims of the project.
Chapter 4.0, Database of Garments, is an analysis of some of the current base
layer products commercially available in the market. This section particularly
references similarities and variations of dimensions, materials and construction of
garments between different brands.
Chapter 5.0, Compression Measurement Analysis, focuses on the results gathered
through the experimental work of measuring pressure distribution in five brands of
compression base layer garments.
Chapter 6.0, Simulation Model, shows the results from the 3D CAD simulation of
the experimental work.
The final section, Chapter 7.0, Conclusions and Recommendations looks at the
overall results emerging from the research project and offers suggestions for
future research in the area.
4
2.0 Literature Review
Competitive sports produce athletes who seem determined to achieve personal
bests, including breaking world records at each competitive event. Some athletes
are even willing to go to extreme lengths, such as Tiger Woods who has allegedly
had surgery to correct his vision and therefore improve his game (Mayes, 2010).
Although not as extreme, it is becoming the norm for performance sportswear,
which aims to aid performance, to be worn to help achieve these high standards.
Compression has been used since the 19th Century to treat medical ailments
(Thomas, 1998 and Ramelet, 2002) and has featured increasingly since the
1980’s, when the use of Lycra gained popularity in sportswear (Walzer, 2004). A
new wave of compression garments is now emerging.
2.1 Medical Compression
Although compression therapy has been widely used since the 19 th Century
(Thomas, 1998 and Ramelet, 2002), the use of bandages to help treat venous
disease has in fact been dated as far back as 450-350BC (Van Geest et al, 2003).
However, Van Geest et al (2003) explain how the introduction of elasticated
stockings came after the discovery of the elastomeric fibre in the mid 1880’s.
Medical practice has found the use of graduated compression favourable
particularly as it works with the muscles to encourage blood flow toward the heart
(Moffatt et al, 2007). Other notable benefits of compression therapy are thought to
be:
The absorption of exudate (fluid) from the wound (Thomas et al, 2007).
Reduction of scar size and improvement of scar appearance (Wienert,
2003).
“Relieves the symptoms associated with venous disease” (Moffatt et al,
2007, pp339)
Compression can be achieved through two methods, either traditional bandaging
techniques, or by specially manufactured garments, such as medical elastic
compression stockings (MECS) (Ramelet, 2002; Van Geest et al, 2003 and URGO
5
Medical, 2010). However, Van Geest et al (2003) explains how these categories
can be divided again as both may be either elastic or inelastic. Although inelastic
bandages may be worn for 24 hours due to a low resting pressure, elastic
compression requires to be removed during a 24 hour period to avoid high resting
pressure accumulating from the constant compression.
Inelastic bandages, also known as short-stretch, only apply light pressure for a
short period of time due to their inability to adapt with the leg, with a high
percentage of the pressure provided being lost in a matter of hours (Ramelet,
2002 and Moffatt et al, 2007). Elastic bandages, or long-stretch, sustain the
pressure provided for a longer period of time due to the flexibility of the structure
(Moffatt et al, 2007) however are more likely to cause discomfort to the wearer
(Ramelet, 2002).
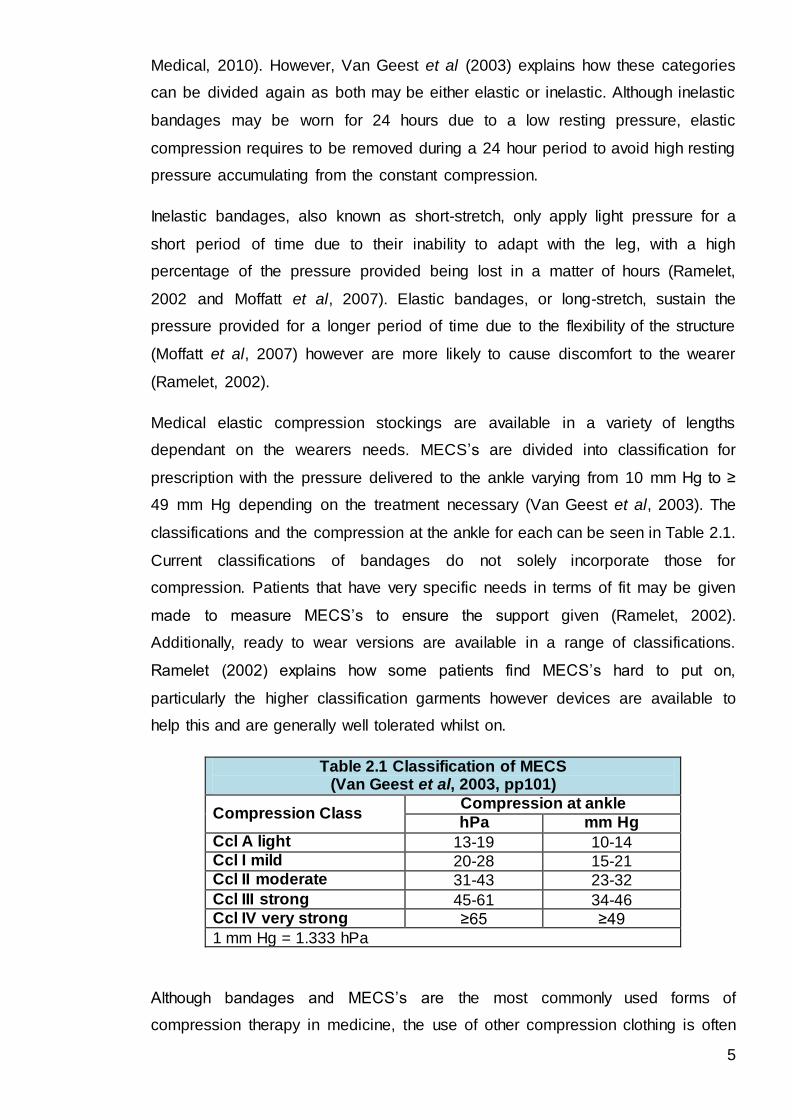
Medical elastic compression stockings are available in a variety of lengths
dependant on the wearers needs. MECS’s are divided into classification for
prescription with the pressure delivered to the ankle varying from 10 mm Hg to ≥
49 mm Hg depending on the treatment necessary (Van Geest et al, 2003). The
classifications and the compression at the ankle for each can be seen in Table 2.1.
Current classifications of bandages do not solely incorporate those for
compression. Patients that have very specific needs in terms of fit may be given
made to measure MECS’s to ensure the support given (Ramelet, 2002).
Additionally, ready to wear versions are available in a range of classifications.
Ramelet (2002) explains how some patients find MECS’s hard to put on,
particularly the higher classification garments however devices are available to
help this and are generally well tolerated whilst on.
Table 2.1 Classification of MECS (Van Geest et al, 2003, pp101)
Compression Class Compression at ankle
hPa mm Hg
Ccl A light 13-19 10-14 Ccl I mild 20-28 15-21 Ccl II moderate 31-43 23-32
Ccl III strong 45-61 34-46 Ccl IV very strong ≥65 ≥49
1 mm Hg = 1.333 hPa
Although bandages and MECS’s are the most commonly used forms of
compression therapy in medicine, the use of other compression clothing is often

6
associated with the treatment of burns and hypertrophic scarring since its
successful use was investigated in the early 1970’s (Wiernert, 2003). Wiernert
(2003) explains how compression clothing is available in many forms including all
in one body suits, and gloves and is habitually worn 24 hours a day.
Some debate of the effectiveness of compression therapy for medical ailments is
apparent (Weller et al, 2010; Feist et al, 2011; and Miller, 2011). However, the
variations between success and failure with reference to compression therapy are
typically dependant on such key factors as:
Size
Watkins (2010) highlights the importance of ensuring each patient is wearing the
correct size compression garment. In a study by Miller (2011) a need for a
standardised method for measuring limbs was called for to ensure patients are
fitted correctly. Incorrect fit not only is a cause of discomfort for the wearer but can
also result in the incorrect amount of pressure being given resulting in ineffective
compression treatment. Watkins (2010) also explains how patients should be
sized for post-operative compression garments prior to surgery unless a significant
change in body shape or size is predicted.
Patient Adherence
Feist et al (2011) and Miller (2011) both determine a key factor to the success of
compression therapy is patient adherence. Although both state discomfort as one
of the main reasons why patients fail to comply with the treatment, Miller (2011)
also explains that poor patient education is a key contributor to lack of adherence
to the regime.
Duration
Understanding compression therapy with regards to how long patients must wear
bandages or garments and possible problems resulting from removing them prior
to the completion of this period were not highlighted in the majority of cases
observed. Furthermore, 100% of the cases observed did not receive any written
information about the importance of compliance.
However, the continued success of compression therapy is perhaps a main reason
as to why sportswear retailers began to incorporate the same theories into
7
sporting apparel. The expansion of compression garments in the sportswear
market is apparent and growing.
2.2 Expansion into Sportswear
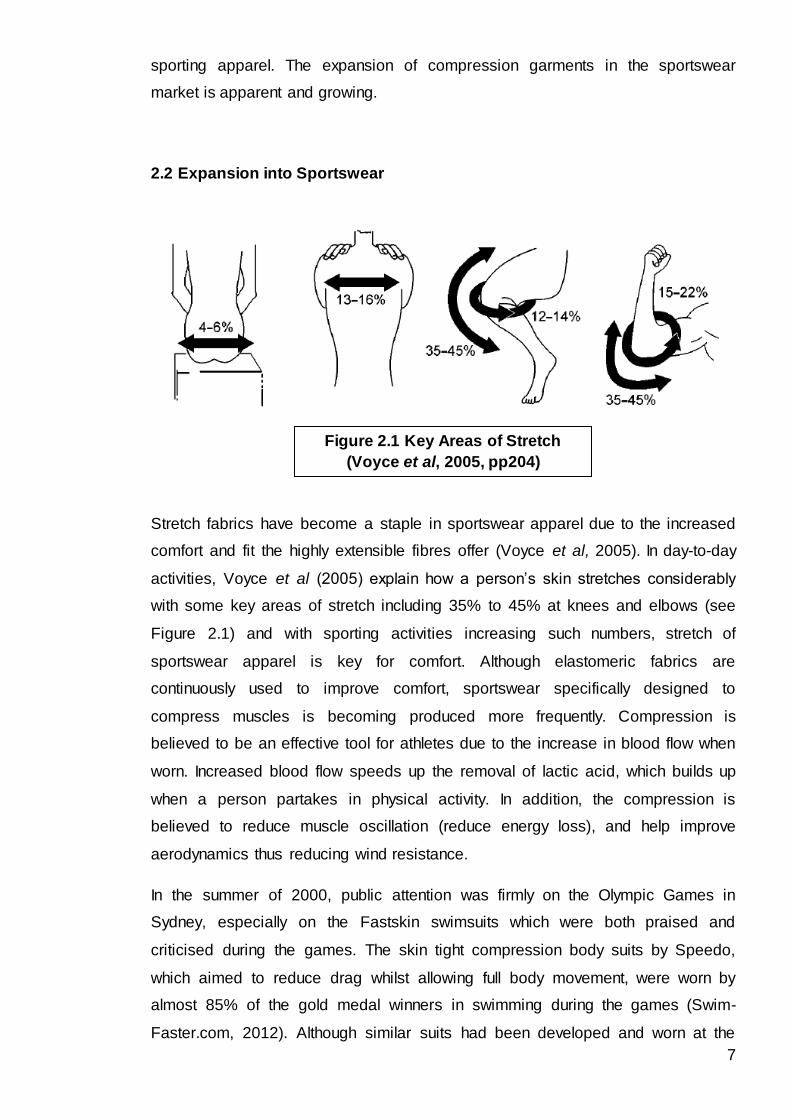
Stretch fabrics have become a staple in sportswear apparel due to the increased
comfort and fit the highly extensible fibres offer (Voyce et al, 2005). In day-to-day
activities, Voyce et al (2005) explain how a person’s skin stretches considerably
with some key areas of stretch including 35% to 45% at knees and elbows (see
Figure 2.1) and with sporting activities increasing such numbers, stretch of
sportswear apparel is key for comfort. Although elastomeric fabrics are
continuously used to improve comfort, sportswear specifically designed to
compress muscles is becoming produced more frequently. Compression is
believed to be an effective tool for athletes due to the increase in blood flow when
worn. Increased blood flow speeds up the removal of lactic acid, which builds up
when a person partakes in physical activity. In addition, the compression is
believed to reduce muscle oscillation (reduce energy loss), and help improve
aerodynamics thus reducing wind resistance.
In the summer of 2000, public attention was firmly on the Olympic Games in
Sydney, especially on the Fastskin swimsuits which were both praised and
criticised during the games. The skin tight compression body suits by Speedo,
which aimed to reduce drag whilst allowing full body movement, were worn by
almost 85% of the gold medal winners in swimming during the games (Swim-
Faster.com, 2012). Although similar suits had been developed and worn at the
Figure 2.1 Key Areas of Stretch
(Voyce et al, 2005, pp204)

8
1992 and 1996 Olympic Games, the replication of a shark’s skin for the Fastskin
swimsuit was even more effective than previous incarnations (Voyce et al, 2005).
Craik (2011) explains that the controversy surrounding the suits, including the
wearers increased ability to break world records, led to the banning in 2010.
However, this ban was not enforced until after much development of the suits and
the introduction of other models including the Fastskin FSII, Fastskin FS-PRO and
most notably the “world’s fastest” suit the LZR Racer Suit (McKeegan, 2008).
McKeegan (2008) and Mayes (2010) explain that the LZR Racer Suit, which is
made using an innovative fabric without any seams, has been tested by the
National Aeronautics and Space Administration (NASA) and found to be more
aerodynamic than any other of its kind.
Compression garments not only sparked media attention in swimming at this time
but also in other sports including track and field. The all in one head to toe Nike
Swift Suit, aims to aid athletes in the same way as the swimsuits by reducing drag
and increasing aerodynamics (Bondy, 2000). American athlete Marion Jones
famously wore the Nike suit to reduce resistance during running (Mayes, 2010);
however, the trend for head to toe suits for running events does not seem to have
the prolonged success as with swimming. Similarly, Nike Swift Suits were used in
other disciplines, including speed skating and cycling, in following years with
positive effects (Voyce et al, 2005). Both sports continue to feature athletes in
similar compression garments.
In 2003, the introduction of compression t-shirts was welcomed in Rugby (Voyce
et al, 2005). The much tighter fit of the shirts, compared to the traditional rugby
jersey, means that not only are the players benefited by the increased blood flow
and muscle support, but also other players cannot easily grip the tops during play.
McCurry (2004); Shishoo (2005); Cole (2008); and Mintel (2009) all state that the
public demand for performance sportswear has increased in recent years, and
noted a rise in compression garments being sold on the market from this time. It is
thought that the increasing media attention on the Speedo Fastskin suits acted as
a catalyst for this despite compression garments being available prior to this.
Walzer (2004) highlights how compression garments have advanced since the
1990s to include a wider variation of products and colours for all genders, which
highlights the greater demand for the product. Also, replicas of professional
9
products, such as the LZR Racer Suit, have also been released to the consumer
market (McKeegan, 2008).
More recently, surfing brand Quiksilver entered the compression market (Cortad,
2011). Cortad (2011) explains that although the new garment has the conventional
appearance of boardshorts, there is a hidden compressive short underneath with
taping precisely positioned to support muscles. The shorts which utilise the
technology usually seen in other sports are proving successful thus far also, with a
surfing champion wearing them. (Watson, cited in Cortad, 2011). It is thought that
this success in a different field may see the compression sportswear market
expand even more.
Furthermore, compression sportswear garments are also entering new markets.
Proskins (2012) have created a range of compression clothing with ingredients
such as caffeine and vitamin E incorporated into the fabric to help reduce cellulite.
This clothing is not only marketed as sportswear but is also suggested for day to
day use, thus expanding the compression market further.
Loenneke et al (2012) also explain how an extreme form of compression, where
blood flow is restricted to a working muscle during exercise, is becoming popular
with rehabilitating athletes. Blood flow restriction training is being used during low
intensity exercise to reduce the amount of exercise needed to be completed
before muscular fatigue.
As the compression market continues to grow popular in both the professional and
consumer markets the benefits often cited in marketing for doing so are being
continually questioned.
2.3 Perceived Benefits when using Compression
Although there is an increasing trend to wear compression sportswear, there is
much debate over the effectiveness of wearing such garments for sporting
activities. Many compression sportswear companies claim that the garments will,
to name just a few:
Improve circulation;
Improve performance; and

10
Table 2.2 Taxonomy of Claims and Results
Author Test Method
Performance Recovery
Noticeable
Benefits
Small
Benefits No Benefits Improvement
No
Improvement
Ali et al
Measured jump height after running trials X X
Chatard et al
Subjects monitored with/without
compression after cycling X
Dascombe et al
Monitored performance levels of flat water kayakers X
Davies et al
Performance monitored before and after wearing compression X X
Doan et al
Measured sprint times, muscle
oscillation and jump heights. X X X X
Duffield and Portus
Distance and accuracy throwing tests analysed, along with sprint
times. X
Higgins et al
Measured sprint times and jump height after netball style circuits X
Jakeman et al
Jump heights recorded before and after wearing compression X
Miyamoto et al
Torque monitored before and
after calf raise exercises. X X
Montgomery et al
Compression compared to cold water bathing and carbohydrate
consumption X
Sperlich et al
Recorded lactate concentration and oxygen uptake during running X
11
Reduce recovery times. (2XU Pty Ltd, 2009; and Skins™, 2012).
These claims have led to the completion of a plethora of research in the area.
However, there is yet to be an holistic agreement on the benefits of performance
and recovery due to conflicting results of many of the investigations completed
(Doan et al, 2003; Chatard et al, 2004; Duffield and Portus, 2007; Montgomery et
al, 2008; Davies et al, 2009; Higgins et al, 2009; Jakeman et al, 2010; Sperlich et
al, 2010; Ali et al, 2011; and Miyamoto et al, 2011). A taxonomy of the literature
analysed can be seen in Table 2.2 which highlights the results of the research.
2.3.1 Noticeable Benefits to Performance
An investigation by Doan et al (2003) reported that twenty track athletes
completed a series of tests to measure sprint times, muscle oscillation and jump
power in both loose gym shorts and compression shorts. The jump heights
recorded in the research were increased by 2.4 cm when wearing the compression
garment. Doan et al (2003) believed the greater support given by the garment,
compared to the control gym shorts, allowed a greater squat before the jump thus
increasing the upward drive of the jump and subsequently the overall height.
Although this somewhat explains the differences between conditions due to the
tight nature of compression garments compared to the control shorts, the
participants may have performed to a greater standard due to the perceived
difference between the garments. Particularly so as the subjects were aware as to
which garment was being scrutinised in each test.
Ali et al (2011) were interested in the effect of varying levels of compression
stockings on performance. Three levels (low, medium and high) were used during
a series of countermovement jumps before and after running trials. It was found
that the changes in jump height from before to after exercise were much bigger
when wearing the low and medium stockings compared to when wearing a control
garment. Perhaps essential to the study was that the subjects were also asked to
rate the comfort of each stocking along with the amount of energy for each
condition they believed to exert. The ratings for exertion showed no significant
differences between all conditions thus helping to rule out the possible placebo
effect.
12
Miyamoto et al (2011) focused on the effect of compression on torque of the
triceps. Triplet torque was monitored both before and after calf raise exercises and
there was a smaller reduction of power after exercise when wearing the
compression stocking with 30 mm Hg at the ankle. However, this was not found
with the 18 mm Hg ankle stockings.
2.3.2 Small Benefits to Performance
The research by Doan et al (2003) also highlighted some possible effect to stride
frequency of sprint athletes. Elasticity tests on a mannequin highlighted a
reduction in hip range when wearing compression garments. However, the 60
metres sprint times for the athletes were no different between the two conditions,
thus suggesting an increase in stride frequency to account for the loss of range. It
was noted, however, that it would be beneficial to test this theory further; in
particular with longer sprint distances in order to fully understand the effect of this.
More recently, Higgins et al (2009) highlighted some benefits of wearing
compression garments. Nine netball players either wore a compression garment,
placebo elastomeric garment without compression or condition garment for circuit
exercises including sprints and jumps. After four, fifteen minute, sessions of
exercise were completed, it was concluded that the athletes wearing a
compression garment increased sprint times, flight times and jump height during
the exercises. However, these were only highlighted when using the Scheffe
method for analysis, with no differences being highlighted if using a traditional
statistical method. Maxwell and Delaney (2004) explained that the Scheffe method
is favourable when examining multiple comparisons. Using a standard analysis to
compare the data no significant differences were found for sprint times, flight times
and jump heights. The benefits determined through this research are questionable
as the significance is unapparent without more detailed statistical analysis or the
reason behind the improved performance.
13
2.3.3 No Benefits to Performance
Although Doan et al (2003) highlighted effects to stride frequency during sprinting
in compression garments, no difference in sprint times were found whilst wearing
pressure garments.
Duffield and Portus (2007) monitored the effects of full body compression
garments. Participants in the study completed a series of distance and accuracy
throwing tests along with sprints in either a control garment or one of three brands
of full body compression garments. However, there were no significant differences
between the control condition and the three brands of compression garment.
Davies et al (2009), although concerned primarily with recovery benefits, also
noted that there were no significant differences during performance tests
consisting of sprints and jumps, among female athletes.
In 2010, Sperlich et al, observed the differences to performance benefits of
compression socks, compression tights, whole body compression garments and
control running clothing. All fifteen participants completed running tests on a
treadmill in each type of clothing and performance was measured by monitoring
lactate concentration and oxygen uptake. These measurements were used to
observe whether compression effectively increased blood flow to speed up lactic
acid removal from the body, thus aiding the athlete during performance.
Furthermore, although Ali et al (2011) found countermovement jumps were
improved with the use of compression stockings, the running times monitored
were not affected by the garments.
The research by Dascombe et al (2011) was focused on the use of upper body
compression garments. The performance levels of seven flat water kayakers were
observed with and without upper body compression garments; however, no
significant improvements were noted. It should be noted that there has been very
little research focused solely on upper body compression garments and as a
result, the work by Dascombe et al (2011) is particularly interesting. In regards to
this, future research on upper body compression would be beneficial to ensure
conclusive results.
It must be taken in to account that the participants in these investigations by Doan
et al (2003); Duffield and Portus (2007); Davies et al (2009); Sperlich et al (2010);
14
Ali et al (2011); and Dascombe et al (2011) were trained athletes accustomed to
the exercise being monitored. As a result, any improvements regarding benefits of
wearing such garments may not have prevailed. It may be that the athletes who
take part have already reached full potential due to years of training and
competitions and that compression garments will do little to alter the
performances. It would be of interest to investigate the same tests with non-
athletes as subjects to see if there are any significant differences.
Despite the recent study in 2011 by Miyamoto et al demonstrating some
performance benefits to triplet torque, there was found to be no improvement to
the maximal voluntary contraction torque with 30 mm Hg or 18 mm Hg stockings.
Miyamoto et al (2011) claims this indicates fatigue, thus leading to no benefit to
the performance of the participant.
2.3.4 Benefits to Recovery
Whilst many of the researchers in the area were concerned with improved
performance benefits of athletes, some research also examined the effects of
compression garments on the recovery of athletes. For example, in the
investigation by Doan et al (2003) a noticeable reduction in muscle oscillation
during jump landings was observed. It is stated that a reduction like this is likely to
reduce injury (Rogers, 2012) and, therefore, improve the recovery time.
Chatard et al (2004) researched this concerning elderly male cyclists. Two five-
minute cycling exercises were completed separated by 80 minutes. During the
resting interval, subjects sat with the legs elevated either with or without the
compression garment depending on the condition monitored. When comparing the
five minute cycling exercises, there was a smaller drop of power sustained for the
second five minutes when wearing the compression garments. However, although
the results seem to show an improvement of recovery time for the athletes, 83% of
the participants also noted that they believed wearing a compression garment
might have influenced the subsequent five-minute performance.
Davies et al (2009) focused on the use of compression tights to reduce muscle
soreness. Seven female and four male participants took part in the investigation
whereby subjects had to complete performance tests including sprints and counter
movement jumps 48 hours after a series of jump tests. All subjects wore
15
compression tights after one of the jump tests for 48 hours with no sporting
garment being worn for the control condition. From this, Davies et al (2009) found
that sprint times during the performance tests were significantly better for the
condition with compression garments, thus implying a greater recovery has taken
place. On the other hand, this result was highlighted when grouping the male and
female results together; whereas, female results alone showed no significant
differences in this area.
In 2010, Jakeman et al also investigated the effects of compression garments on
recovery. Seventeen female volunteers completed a series of ‘drop jumps’ and
squat jumps with half of the participants wearing compression tights for a 12 hour
recovery period. It was established that jump heights during recovery were better
maintained in the condition wearing compression garments. Similarly, Doan et al
(2003) found squat jump height was improved during performance and both may
be due to a greater support given to the participant during squat when wearing
compression garments.
2.3.5 No Benefits to Recovery
Despite some research highlighting the benefits of compression garments on
recovery, Montgomery et al (2008) argued that other techniques still appear to be
favourable. In the research compression garments were used as a recovery tool
for a three-day exercise procedure. Similarly, the use of cold water bathing and
carbohydrate consumption along with post exercise stretching were two other
conditions for the investigation. In this circumstance, cold water bathing was
deemed to be more beneficial to recovery than the use of compression garments
or carbohydrate consumption and post exercise stretching. This was particularly
the case in maintaining line drill performance and acceleration.
2.4 Psychology of Compression Garments
Although there is disagreement in literature about how effective compression for
sportswear may be, there still remains an increased consumer demand for the
garments. Lobby (2010) highlights how psychological effects of wearing
compression may aid athletes. It is becoming increasingly popular, therefore, for

16
research regarding compression garments to include perceptual measures by the
participants. It is thought that monitoring factors such as perceived exertion may
help to highlight if the placebo effect has occurred rather than a true change in
performance.
Although Chatard et al (2004) reported some performance benefits, it should be
noted that 83% of the participants believed that wearing the compression garment
during exercise may have influenced how well they performed. On the other hand,
no correlation between those who thought the garment would improve their
performance and the results gathered could be found.
In 2010, Duffield et al completed an investigation whereby eleven participants
completed ten sets of sprints and jumps, once with a compression garment and
once without during the exercise as well as for a 24 hour period afterwards.
Although results highlighted no improved performance or recovery rates, the
participant’s ratings of muscle soreness were reduced when wearing the
compression garments. Therefore, while the results examined show no
improvement, a placebo effect may be in place in this situation in terms of
perceived recovery.
In the research by Ali et al (2010) participants noted that low grade compression
garments were more comfortable than the high grade compression garments.
Furthermore, some participants even experienced discomfort due to unnecessary
compression when wearing high grade garments. Similarly in the 2011 research
by Ali et al the low grade and control garments were rated as being more
comfortable than the high and medium grade compression garments.
Nevertheless, the rating of exertion for each condition did not alter in this case,
despite noted discomfort.
Although some of the research studied highlights that participants often believe the
compression garments are having a positive effect on their performance, there is
little evidence to confirm this. However, researchers are still intrigued with the
concept of the placebo effect on athletes. Laymon, cited in Lobby (2010) states
that, “…It may be that with compression, if you think it works, it truly does work for
you”. Wallace et al (2008) states that although the use of compression has not
been proven to improve performance there have also been no negative effects on
performance highlighted. Therefore, wearing the garments purely for psychological
impact can do no harm.
17
2.5 Pressure Measurement Systems
A plethora of research has been completed in order to evaluate existing pressure
measurement systems. Ferguson-Pell et al (2000) explained how a wide range of
pressure measurement systems currently exist to determine the pressure values
exhibited through compression garments however, there is often disagreement in
literature over the most accurate and appropriate method to use.
In 1997, Giele et al examined the use of direct measurement to monitor pressures
between the skin and a compression garment being used to aid the treatment of
hypertrophic scarring. Measuring pressure between garment and skin had
previously been found to meet problems with garment wrinkling and the
measurement devices not lying closely to the skin. Therefore, the research by
Giele et al (1997) measured the sub-dermal pressures in an attempt to overcome
these issues. Pressure was measured using a needle connected to a pressure
transducer, with and without the compression garment being worn. Thus enabling
comparisons, between the resting pressure and the pressures produced by the
garment, to be made. It was concluded within the study that the sub-dermal
method reliably allows pressure to be measured and highlights the need to monitor
sub-dermal as well as interface pressures from compression garments. However,
as Giele et al (1997) states, the research is based on an assumption that the
pressures reflect those transmitted through the skin. However, due to the intrusive
nature of measuring sub-dermally, only one subject participated in the study and
studies with more participants would be beneficial to greater understand the
pressures monitored.
Teng et al (2007) highlighted another example of direct measurement of
pressures. Similarly, to Giele et al (1997), the research focused on the pressure
therapy of hypertrophic scarring looking at the pressures between the garment and
scar. One male subject took part in the research where an air-pack sensor was
placed between the skin and the garment on the leg and arm. In all, four positions
on the limbs were monitored with five readings at each site being taken to allow for
averages to be taken. In this instance, the accuracy of the new system was
directly compared to the results obtained by an existing pressure device used for
clinical testing. Teng et al (2007) concluded that pressure readings gathered
through the new device and the comparable measurements from the existing
system were in very close agreement, hence confirming the rationale for using
18
both systems. Although the research showed good correlation with less than 5 mm
Hg between the new measuring system and the commercially available system at
each measurement, some issues have been raised concerning direct
measurement of pressure on live participants. It is thought that the
characteristically small sample size of participants in direct measurement studies
means that even research that is intended to measure comparable outcomes can
conflict due to this lack of reliability (Feist et al, 2011). Therefore, the small sample
size for this investigation raises concern. Furthermore, as previously mentioned,
Giele et al (1997) were concerned with the distortion of the garment and this
problem can be exaggerated by the subject simply moving, making it hard to
eliminate the problem all together.
The problem with movement distorting results associated with direct measurement
on humans stated above, coupled with time consumption, reproducibility and
accuracy, led Fan and Chan (2005) to investigate how predictions of clothing
pressure could be made on a conventional mannequin. After taking pressure
measurements directly on six female subjects in ten positions, the measurements
were recorded again on a standard dress maker’s mannequin. From the
information gathered a simple statistical model was created to predict the pressure
from a mannequin which was concerned with differences in girth, weight and
constants for body positions. Although the simple statistical model achieved
satisfactory results for some areas, such as the waist; body curvature and body fat
were not taken into account thus restricted the success of the simple system.
Further statistical modelling which assumed that curvature is related to body mass
index was shown to improve almost all results, however, success was still limited
due to assumptions. The research concluded that a mannequin with ‘skin’ more
representative of a human’s skin and body fat would improve the prediction model.
Furthermore, while the research examined three brands and three sizes of girdle,
few conclusions regarding sizing were drawn from this as the research focused on
creating the prediction model rather than focusing on the pressures observed.
Another indirect method investigated the use of a spherical pressure system to
monitor the distribution of pressure amongst a series of compression fabrics
(Wang et al, 2010). Within the investigation, the spherical pressure monitor was
utilised with five high precision sensors. As fabrics were fixed in place beneath the
system, the monitor was driven to the fabric and a computer system recorded the
details of when the fabrics deformed under the pressure. The exploration was also

19
supported by completing fabric analysis of the samples prior to testing. Material
characteristics were measured using the Kawabata Evaluation System for Fabrics
(KES-F). KES-F is an objective measurement system looking at the deformation
and recovery of fabrics (Shishoo, 1995). Carr and Latham (2008) explain how the
system focuses on four areas:
Tensile and Shear
Bending
Compression
Surface Tester
The testing system then creates control charts in the form of graphs for each
fabric. By examining these areas, characteristics of the fabric which could impact
on the behaviour of the samples during testing could be highlighted and help to
greater understand the overall results from the research. It was to be expected
that the four fabrics examined in this study would reach the sensors at the same
time due to the predetermined speed set on the system. However, the differences
in knit structure affected this which also resulted in variations of pressure. The
research highlighted the importance of determining the differences in fabric
characteristics when working with a number of samples in order to understand the
effect of the fabric on the pressure tests.
Similarly, Yildiz (2007) emphasises the importance of fabric assessment prior to
measuring pressure in order to highlight any characteristics that may aid or inhibit
the pressure distribution. Thickness, area density and fibre composition were all
taken into account in the research. Furthermore, thermo-physiological
characteristics were examined to provide insight into how comfortable the garment
would feel when worn. Although Yildiz (2007) is focused on thermo-physiological
properties concerned with abrasion against a developing scar, tests such as air
permeability and water absorption would also benefit research for the comfort of
athletes in sports research.
Sawada (1993) investigated how bony prominences and areas of body fat may
affect the compression achieved from a pressure garment. Using seven different
conditions to test under (see Table 2.3) bony prominences and body fat were
simulated using plastic plates and sponges. The pressure values were monitored
using a control-inflator with a range to 88 millimetres of mercury (mm Hg) at the
forearm, upper arm, thigh and leg.

20
Table 2.3 Testing Conditions
(Sawada, 1993)
Test Conditions
1 Garment only 2 Garment with a thin sponge 3 Garment with a thin sponge and a thin plastic plate 4 Garment with a thin sponge and a thick plastic plate 5 Garment with a thick sponge 6 Garment with a thick sponge and a thin plastic plate 7 Garment with a thick sponge and a thick plastic plate
The testing concluded that the pressure increased when applying a sponge, of
either size, or a plastic plate thus concerning the effect of prominences and fat
when wearing medical compression garments. The research not only highlighted
these differences but also focused on a pressure measurement system which was
inexpensive to produce, thus desirable. However, it would be beneficial to
compare the results found through this with a commercially used system like the
research by Teng et al (2007) to validate the accuracy of the system. The
relationship between body fat and bony prominences on compression is especially
interesting with regards to ready to wear compression garments. As each wearer
will be different in terms of body size and shape (eg: weight; muscle; and fat) it is
impossible to predict how a garment’s compression will be affected. Future
research, such as that completed by Sawada (1993), concerned with ready to
wear compression sportswear would be beneficial to investigate this.
A reoccurring theme in research regarding pressure measurement is the use of
the Laplace Law (Ramelet, 2002; Maklewska et al, 2007; Moffatt, 2008; Lin et al,
2010). Maklewska et al (2007, pp 217) explain how the
“Laplace Law has been widely used to calculate the pressure delivered to a
cylinder of known radius by a fabric under known Tension”.
Maklewska et al’s (2007) approach in the research concerning pressure under
compression garments utilised Laplace’s Law to quantify the pressures exerted.
The ‘Textilpress’ system was used to measure the pressure of a compression
garment placed over a rigid cylinder. The system contained a matrix of eighteen
gauges, which combined, measure the curvature radius of the testing area and the
tension exhibited. Using the radius and tension measurements, the pressure is
then determined, as per the following Laplace equation (Maklewska et al, 2007).
21
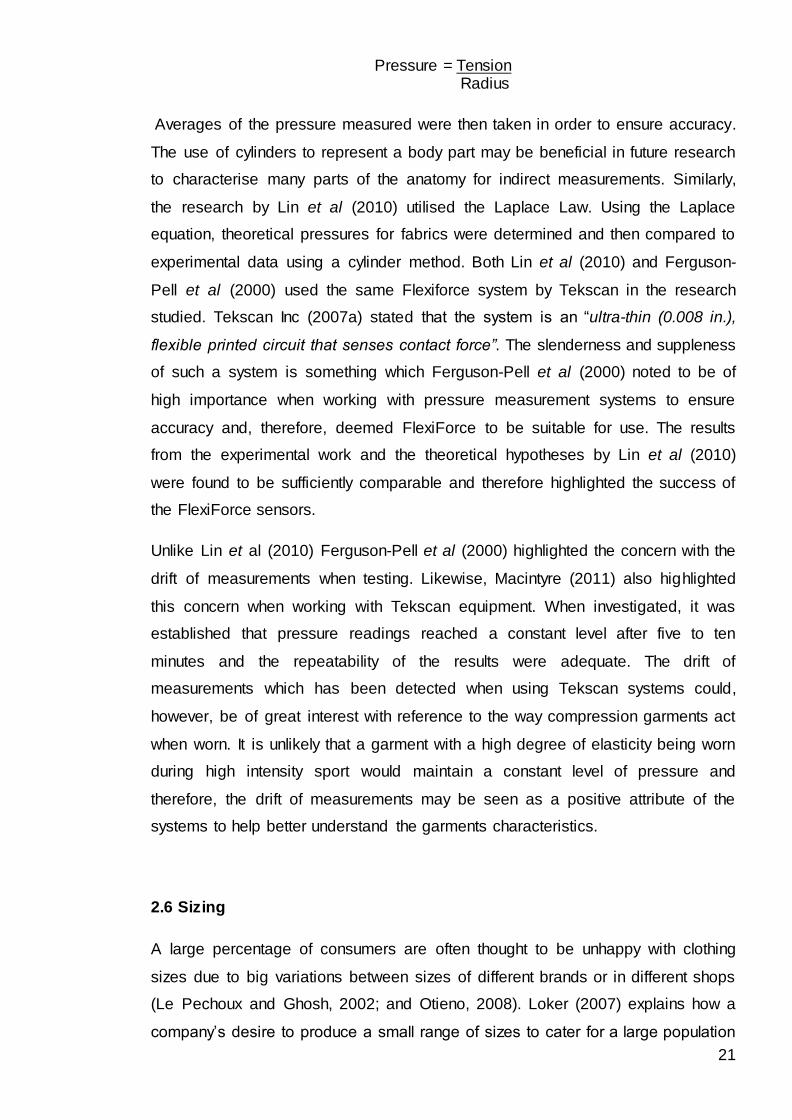
Pressure = Tension Radius
Averages of the pressure measured were then taken in order to ensure accuracy.
The use of cylinders to represent a body part may be beneficial in future research
to characterise many parts of the anatomy for indirect measurements. Similarly,
the research by Lin et al (2010) utilised the Laplace Law. Using the Laplace
equation, theoretical pressures for fabrics were determined and then compared to
experimental data using a cylinder method. Both Lin et al (2010) and Ferguson-
Pell et al (2000) used the same Flexiforce system by Tekscan in the research
studied. Tekscan Inc (2007a) stated that the system is an “ultra-thin (0.008 in.),
flexible printed circuit that senses contact force”. The slenderness and suppleness
of such a system is something which Ferguson-Pell et al (2000) noted to be of
high importance when working with pressure measurement systems to ensure
accuracy and, therefore, deemed FlexiForce to be suitable for use. The results
from the experimental work and the theoretical hypotheses by Lin et al (2010)
were found to be sufficiently comparable and therefore highlighted the success of
the FlexiForce sensors.
Unlike Lin et al (2010) Ferguson-Pell et al (2000) highlighted the concern with the
drift of measurements when testing. Likewise, Macintyre (2011) also highlighted
this concern when working with Tekscan equipment. When investigated, it was
established that pressure readings reached a constant level after five to ten
minutes and the repeatability of the results were adequate. The drift of
measurements which has been detected when using Tekscan systems could,
however, be of great interest with reference to the way compression garments act
when worn. It is unlikely that a garment with a high degree of elasticity being worn
during high intensity sport would maintain a constant level of pressure and
therefore, the drift of measurements may be seen as a positive attribute of the
systems to help better understand the garments characteristics.
2.6 Sizing
A large percentage of consumers are often thought to be unhappy with clothing
sizes due to big variations between sizes of different brands or in different shops
(Le Pechoux and Ghosh, 2002; and Otieno, 2008). Loker (2007) explains how a
company’s desire to produce a small range of sizes to cater for a large population

22
of consumers means that ready to wear garments often fit only a select group. For
companies focused on a mass market, Loker (2007) states that large studies of
body shape and size for the desired population are examined and sizes created to
fit the majority. Such anthropometric studies have benefitted from 3D body
scanners in recent years to reduce the time taken to collate body measurements;
however, are still costly and time consuming to conduct (Le Pechoux and Ghosh,
2002; Yu, 2004; Loker, 2007; and Otieno, 2008). Le Pechoux and Ghosh (2002)
explain that variations between gender, race and generations are apparent
through studies on body shape. Although custom made garments produced to
specific measurements can ensure a perfect fit, the time and cost to produce such
garments is so much that this is not viable for mass markets (Loker, 2007).
2.6.1 Body Shapes
It is popular in current literature to divide male body shapes in to three categories
which can be labelled as: endomorph; mesomorph; and ectomorph. The following
Figure 2.2 shows these shapes. As the pictures illustrate, ectomorph shapes are
characterised by being tall, lean builds with little excess body fat. Mesomorph’s are
a medium build and have a more athletic frame with broad shoulders and a narrow
waist. Whilst endomorph shapes have a wider frame and generally more fat.
Figure 2.2 Male Body Shapes
(Shepherd, Date Unknown, online)
23
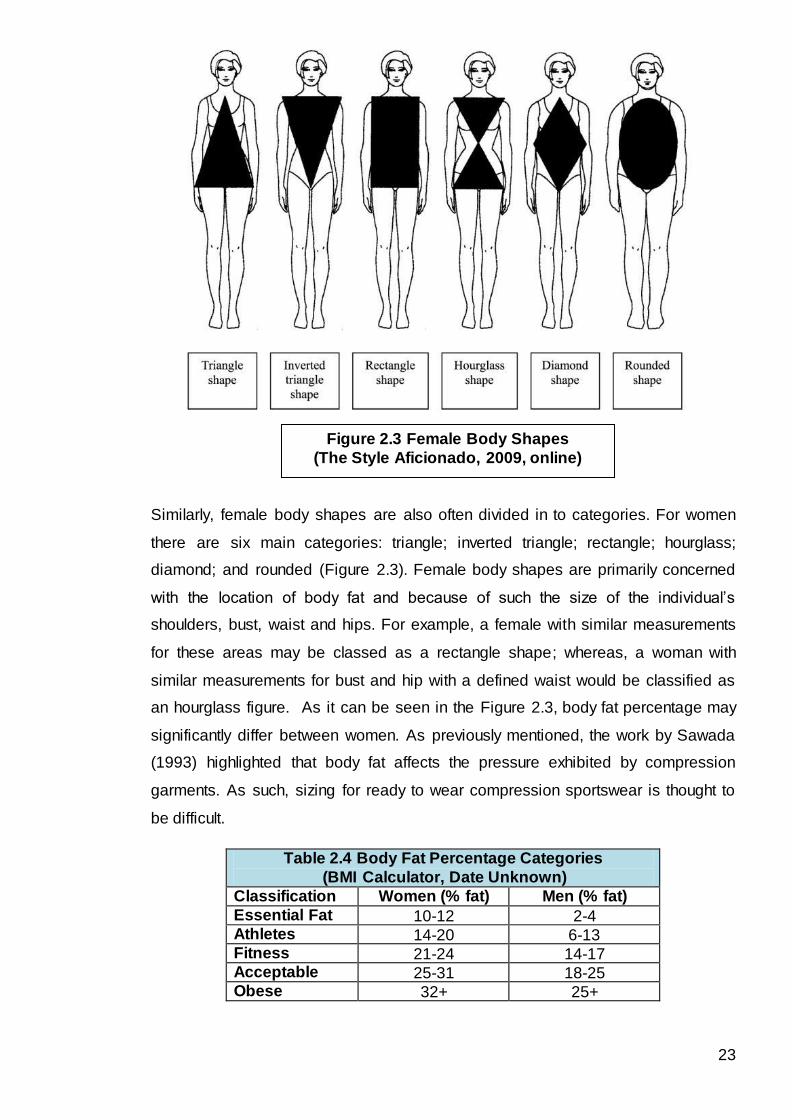
Similarly, female body shapes are also often divided in to categories. For women
there are six main categories: triangle; inverted triangle; rectangle; hourglass;
diamond; and rounded (Figure 2.3). Female body shapes are primarily concerned
with the location of body fat and because of such the size of the individual’s
shoulders, bust, waist and hips. For example, a female with similar measurements
for these areas may be classed as a rectangle shape; whereas, a woman with
similar measurements for bust and hip with a defined waist would be classified as
an hourglass figure. As it can be seen in the Figure 2.3, body fat percentage may
significantly differ between women. As previously mentioned, the work by Sawada
(1993) highlighted that body fat affects the pressure exhibited by compression
garments. As such, sizing for ready to wear compression sportswear is thought to
be difficult.
Table 2.4 Body Fat Percentage Categories
(BMI Calculator, Date Unknown)
Classification Women (% fat) Men (% fat)
Essential Fat 10-12 2-4 Athletes 14-20 6-13 Fitness 21-24 14-17 Acceptable 25-31 18-25 Obese 32+ 25+
Figure 2.3 Female Body Shapes
(The Style Aficionado, 2009, online)

24
Furthermore, body fat percentages between men and women also differ
significantly. Table 2.4 highlights the levels of body fat currently highlighted in
research for men and women of the same fitness level. As it can be seen for all
categories, women should exhibit much higher levels of body fat which would
directly affect the pressure exhibited from compression garments. These values,
coupled with the large variation in location of body fat between women, lead to
difficulties in sizing.
As such, standardised sizing for men’s ready to wear compression sportswear is
thought to be catered for more of the general population due to the lower values of
body fat and fewer variations in body shape. However, as previously noted, the
most common body shapes in a population are further affected by many factors
including race, gender and life style (Le Pechoux and Ghosh, 2002). Furthermore,
although these specific body types are highlighted, many can be a variation of
different types. These factors mean that sizing garments for ready to wear
garments can be extremely difficult for both men and women thus often resulting in
consumer dissatisfaction.
2.6.2 Sizing for Stretch Garments
Sizing for stretch garments, such as compression base layers, varies even more
due to the characteristics of the fabric. Branson and Nam (2007) explain that
garments made with stretch fabrics can be particularly difficult to size due to the
extensibility of the materials being used. It is common place therefore to make
patterns for such garments smaller than body size to achieve a better fit. However,
Branson and Nam (2007) also explain that due to the high elasticity of such
garments, different body shapes may fit in to one size top, unlike a similar size top
in a non-stretch fabric. Hardaker and Fozzard (1997) also highlight the importance
of correct fabric selection as a mistake in this may set production back to early
stages.
Hunter and Fan (2004) explain how fabric characteristics, which may affect the fit
and sizing of garments, can be assessed using the Kawabata Evaluation System
for Fabrics (KES-F) or similarly the Fabric Assurance by Simple Testing (FAST)
method. Thus enabling manufacturers to predict problems before they result in
high costs to adjust. To help assess results from KES-F and FAST tests, which
25
can be often difficult to interpret, McLoughlin and Hayes (2011) have produced a
computer system which analyses the test results. The Fabric Sewability system
not only produces fingerprints of the fabrics but also written analysis of the fabrics
tested. The creation of such a system could further aid the use of objective tests to
measure fabric handle, reducing the time needed to assess the results without the
requirement of an experienced technician.
2.7 3D Simulation
The use of Computer Aided Design (CAD) in industry is under continual
development. The introduction of 3D body scanners for example, has helped to
streamline the method of recording body measurements and instantly creates a
virtual record for analysis (Le Pechoux and Ghosh, 2002). Such anthropometric
data can then be used in conjunction with many CAD systems. Williams et al
(2004) used CAD to produce models of a hand to assess fit of military combat
gloves. The research emphasised the importance of using anthropometric data to
ensure accuracy of a CAD model. Williams et al (2004) also explained how such
methods of design and manufacture are particularly of use when dealing with
products that require a precise fit. Virtual systems used in the product
development process also boast benefits such as reduction in lead times and
increased precision (Davies, 1994). Software which allows users to recreate 2D
patterns and simulate them in 3D on virtual avatars is available from many of the
big suppliers of CAD packages (King, 2009). V-Stitcher by Browzwear, Modaris by
Lectra and 3D Runway Designer by OptiTex are leaders in the market which
enable 3D simulation (OptiTex International Ltd, 2011; Browzwear, 2012; and
Lectra, 2012). All also include the capability for pressure maps to display pressure
values of the pressures exhibited by garments whilst on the body. This function is
improved by the realistic simulation of fabrics. Choi and Ko (2005) explain how
fabric can now be realistically recreated in a virtual system thus largely improving
the accuracy of the simulation process. Similarly to how fabric characteristics can
be assessed before manufacture via KES-F and FAST (Hunter and Fan, 2004),
the same results can be put in to many of the virtual systems. Thus, accurately
recreating fabric characteristics in a virtual system. V-Stitcher, Modaris and 3D
Runway Suite systems all allow users to alter fabric properties in such a way
(OptiTex International Ltd, 2011; Browzwear, 2012; and Lectra, 2012). King (2009)
26
explains how streamlining the product development process by sampling garments
virtually can also make the industry more sustainable. Concern regarding the
reduction of waste is growing across countless industries and this technology is
thought to help tackle the issue.
It is believed that 3D simulation of pressure garments during the product
development process would be a particularly useful tool due to the speed in which
garments can be assessed and adapted if necessary. The pressure maps which
can be used in the systems could also allow for assessment of pressures exhibited
without creation of samples and timely experimental testing. The development of
such tools would therefore be beneficial in the compression sportswear market.
2.8 Summary
It is clear from the literature reviewed that the compression market, although
present for many years, is still expanding. Whilst much research has focused on
improved performance characteristics and recovery times of athletes there is still
yet to be a clear understanding of whether compression garments worn during
sporting activities are always beneficial. A plethora of pressure measurement
systems have been researched with regards to both medical and sporting
industries with varying results. Thin, flexible sensors have been found to be
beneficial when measuring pressure and as such should be considered for this
research project (Ferguson-Pell et al, 2000; Lin et al, 2010; and Macintyre, 2011).
Furthermore, the studies by Yildiz (2007) and Wang et al (2010) have highlighted
the importance of determining fabric characteristics to observe the role such
factors contribute to pressure distributed. The understanding of fabric
characteristics has also been highlighted by Hunter and Fan (2004) as being
particularly vital when dealing with stretch garments. In view of this, experimental
work regarding pressure measurement must be coupled with fabric analysis.
The work by Ferguson-Pell et al (2000) and Macintyre (2011) will be of particular
interest in this research as both are concerned with the drift of measurements
associated with pressure measurement systems. The drift of measurements is
believed to be resulting from the fabrics stretching and relaxing on the body and
therefore pressures continually changing during wear. Therefore any drift recorded
through pressure measurement will be of interest, coupled with fabric

27
characteristic information, in the hope of better understanding the pressures given
by compression garments.
Sizing ready to wear garments has been highlighted as causing difficulties due to
a wide variation of body shapes and sizes in the general population (Loker, 2007).
The effect of body fat on pressure measurements further complicates the sizing of
ready to wear compression base layers. However, the on-going development of
3D simulation tools, by key providers of CAD software, may enable simulation of
compression garments which could potentially identify variations before
production. The work of Hardaker and Fozzard (1997) and Hunter and Fan (2004)
explained how carefully selecting fabrics, and determining the properties of such,
prior to production can help streamline the sizing process. Furthermore, objective
measurement systems such as KES-F and FAST have been identified as useful
tools for successfully assessing fabric properties and can be used in conjunction
with 3D simulation models.
This research analyses variations between compression sportswear brands and
aims to create a CAD model which can map empirical work on compression
measurement. The next chapter 3.0, Methodology, focuses on the primary and
secondary research methods used to conduct the research project. Sampling
methods and limitations encountered will also be detailed.
28
3.0 Methodology
This chapter specifies the methodologies that were used to accomplish both the
primary and secondary research for the project. The selected methodologies were
critically evaluated in order to ensure that the research data collated was
consistent.
First and foremost, it needs to be decided upon whether a qualitative, quantitative
or mixed method approach is to be used. Creswell (2009) explains how qualitative
and quantitative research is often differentiated by the use of words (qualitative) or
numbers (quantitative). Neuman (2011) and Bryman (2012) explain how
quantitative research focuses on hypotheses where methods make use of
experimental variables and accurate tests. As a consequence, quantitative data is
concerned with the measurement of variables (Creswell, 2009). Conversely,
qualitative research is more concerned with collecting data in a natural or social
environment rather than in a controlled one, and the data of interest is typically
subjective opinion (Neuman, 2011; and Bryman, 2012). In this case, a quantitative
research methodology is considered appropriate. Although consumer opinion may
be an interesting aspect to future research, quantitative research methods are
considered suitable to fulfil the aims proposed in this research (see Chapter 1.0).
Although research design is concerned with which approach (qualitative or
quantitative) is to be used, it is also essential to consider the type of theory used in
the research process. In the case of this research project, the concept of
empiricism will be used and both inductive and deductive methods will be followed.
3.1 Deduction and Induction
The main difference between inductive and deductive approaches is the time in
which a theory is developed: prior to or after data collection (Bryman, 2012).
Inductive theory is primarily concerned with the researcher making observations
and identifying patterns during testing and from this creating a theory. On the other
hand, deduction is a research technique which first focuses on creating a
hypothesis from a theory and subsequently using scientific methods to test the
hypothesis (Saunders et al, 2007; Neuman, 2011; and Bryman, 2012). In this
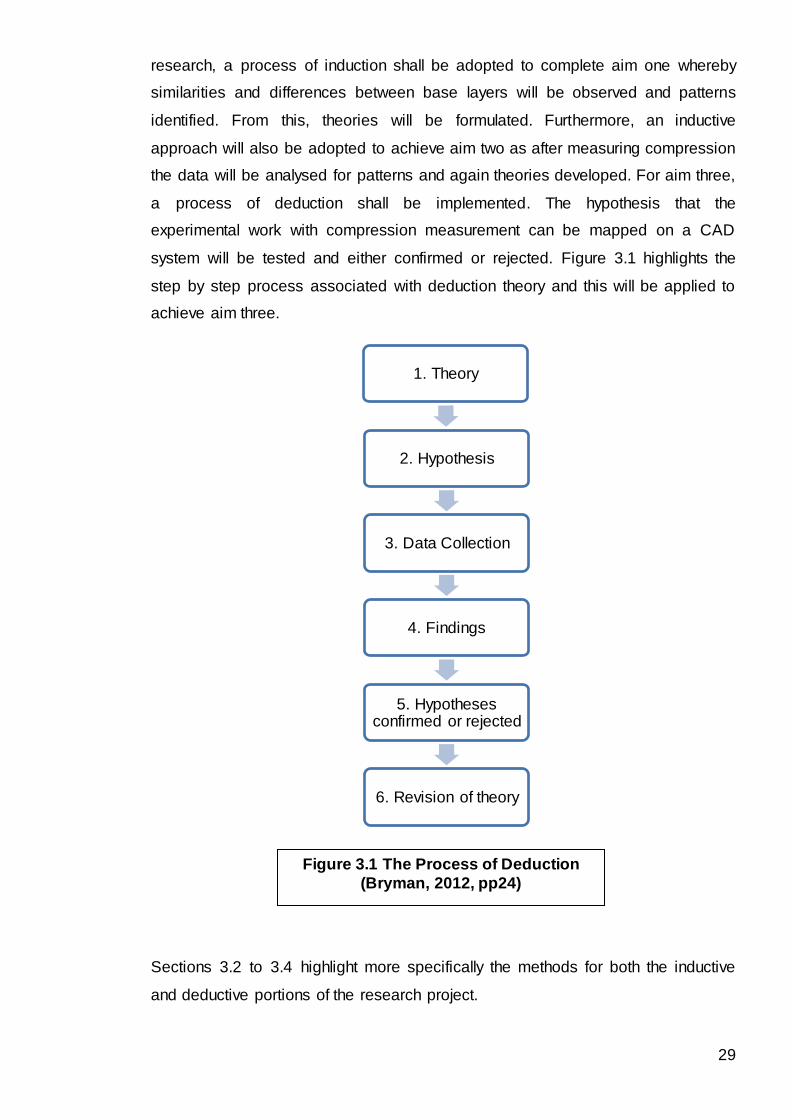
29
research, a process of induction shall be adopted to complete aim one whereby
similarities and differences between base layers will be observed and patterns
identified. From this, theories will be formulated. Furthermore, an inductive
approach will also be adopted to achieve aim two as after measuring compression
the data will be analysed for patterns and again theories developed. For aim three,
a process of deduction shall be implemented. The hypothesis that the
experimental work with compression measurement can be mapped on a CAD
system will be tested and either confirmed or rejected. Figure 3.1 highlights the
step by step process associated with deduction theory and this will be applied to
achieve aim three.
Sections 3.2 to 3.4 highlight more specifically the methods for both the inductive
and deductive portions of the research project.
1. Theory
2. Hypothesis
3. Data Collection
4. Findings
5. Hypotheses confirmed or rejected
6. Revision of theory
Figure 3.1 The Process of Deduction
(Bryman, 2012, pp24)
30
Samples for testing in the research need to be selected using a sampling method.
Sampling methods are mainly divided in two categories; probability, which is
where samples are selected at random, and non-probability, where samples have
not been randomly selected. The sampling procedures to be undertaken in the
research are discussed in sections 3.2 to 3.4.
3.2 Aim One
To begin the inductive portions of the research and to accomplish aim one, a
review of literature was first conducted. Such secondary research was completed
to better understand and analyse the current compression sportswear trend. The
research considered the origins of compression bandaging, how compression
therapy has moved into the sportswear market, perceived benefits of using
compression for sports and the wide range of pressure measurement systems
available. Information was gathered from books, journals and magazine articles.
Online resources were also used with caution to ensure the information gathered
is authentic.
To further achieve aim one, a physical examination of compression base layers
available to the mass market was also conducted in order to develop a database
of typical fabric choice and
construction techniques for
compression base layers. A
selection of base layer products
needed to be selected to be
assessed. As the research is
focused on commercially
available garments, the samples
obtained needed to be those
which are available to the mass
market. The sports clothing and
footwear retail report by Mintel
(2011) (see Table 3.1) which
highlights the most popular stores
for sportswear was utilized to
determine where samples would be purchased. As Table 3.1 shows, Sports Direct
Table 3.1 Results from Sports Clothing
and Footwear Report (Mintel. 2011)
Retailer % of Shoppers
Sports Direct 39
JJB 32
Internet 25
JD Sports 21
Supermarket 19
Value Retailer 19
Next 12
Outdoor Clothing Store 11
Footwear Shop 10
Mail Order 10
Marks and Spencer 9
Independent Retailer 9
Department Store 8
Other sports specialist 6
Mid-Market fashion shop 6
Other 13
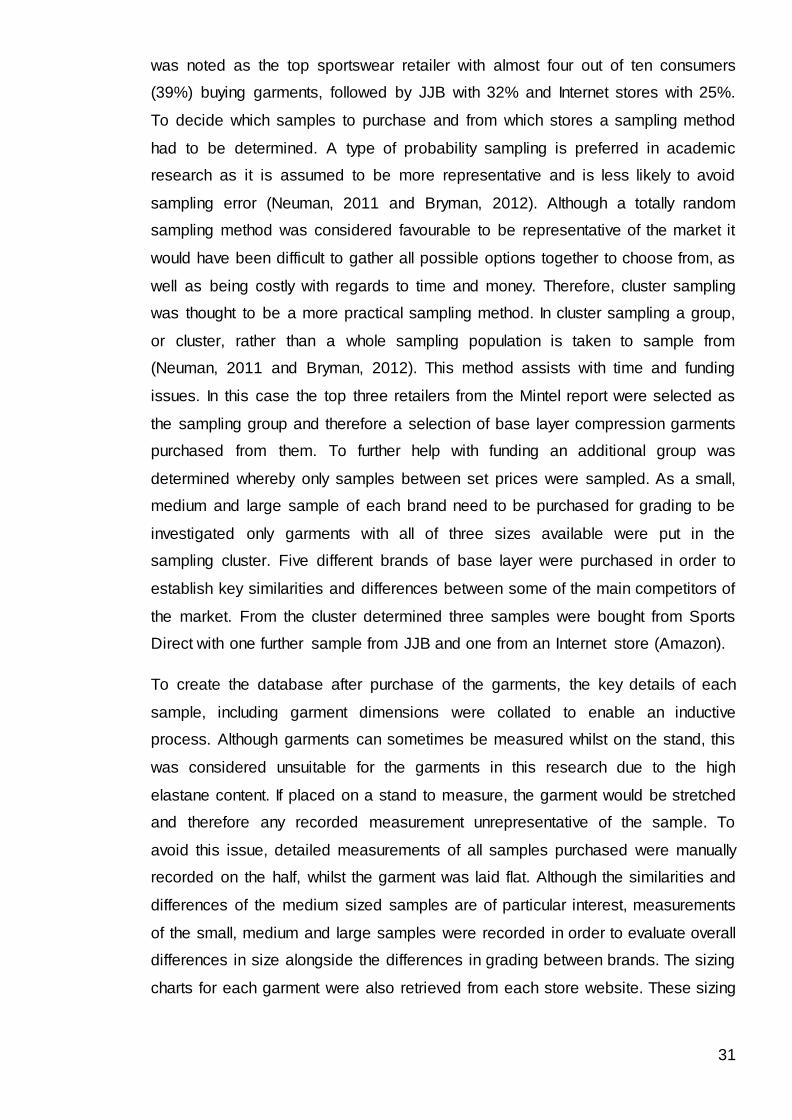
31
was noted as the top sportswear retailer with almost four out of ten consumers
(39%) buying garments, followed by JJB with 32% and Internet stores with 25%.
To decide which samples to purchase and from which stores a sampling method
had to be determined. A type of probability sampling is preferred in academic
research as it is assumed to be more representative and is less likely to avoid
sampling error (Neuman, 2011 and Bryman, 2012). Although a totally random
sampling method was considered favourable to be representative of the market it
would have been difficult to gather all possible options together to choose from, as
well as being costly with regards to time and money. Therefore, cluster sampling
was thought to be a more practical sampling method. In cluster sampling a group,
or cluster, rather than a whole sampling population is taken to sample from
(Neuman, 2011 and Bryman, 2012). This method assists with time and funding
issues. In this case the top three retailers from the Mintel report were selected as
the sampling group and therefore a selection of base layer compression garments
purchased from them. To further help with funding an additional group was
determined whereby only samples between set prices were sampled. As a small,
medium and large sample of each brand need to be purchased for grading to be
investigated only garments with all of three sizes available were put in the
sampling cluster. Five different brands of base layer were purchased in order to
establish key similarities and differences between some of the main competitors of
the market. From the cluster determined three samples were bought from Sports
Direct with one further sample from JJB and one from an Internet store (Amazon).
To create the database after purchase of the garments, the key details of each
sample, including garment dimensions were collated to enable an inductive
process. Although garments can sometimes be measured whilst on the stand, this
was considered unsuitable for the garments in this research due to the high
elastane content. If placed on a stand to measure, the garment would be stretched
and therefore any recorded measurement unrepresentative of the sample. To
avoid this issue, detailed measurements of all samples purchased were manually
recorded on the half, whilst the garment was laid flat. Although the similarities and
differences of the medium sized samples are of particular interest, measurements
of the small, medium and large samples were recorded in order to evaluate overall
differences in size alongside the differences in grading between brands. The sizing
charts for each garment were also retrieved from each store website. These sizing
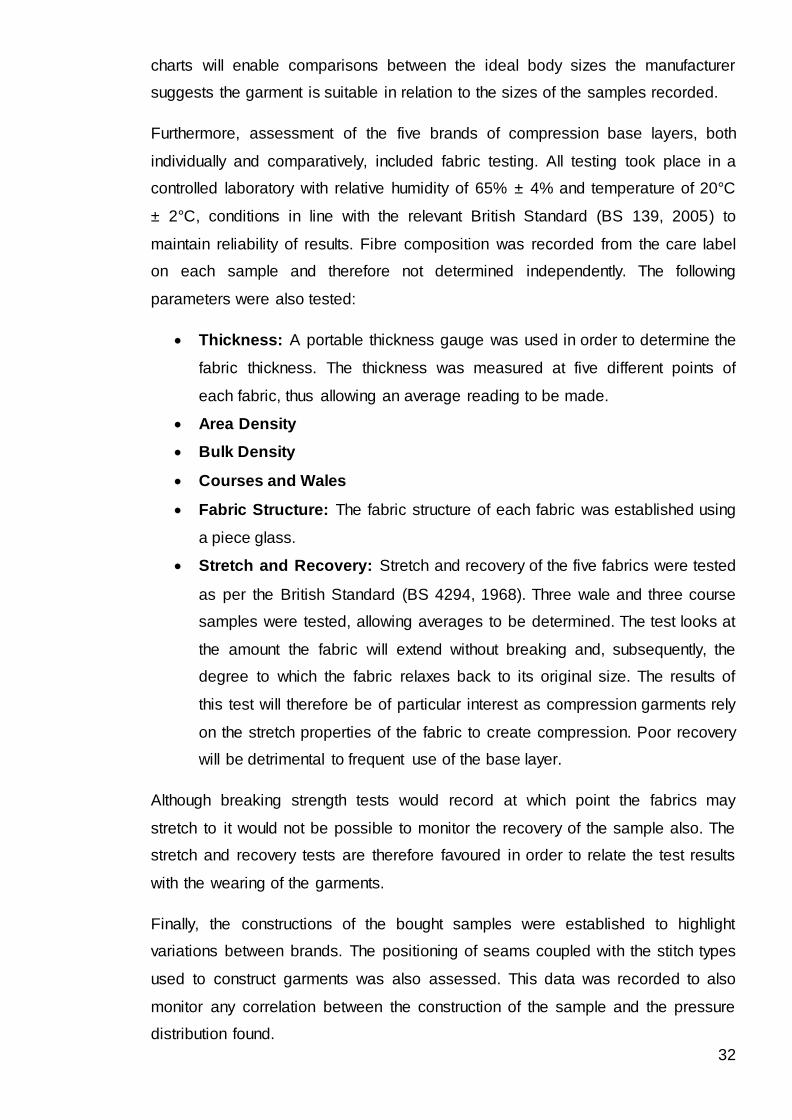
32
charts will enable comparisons between the ideal body sizes the manufacturer
suggests the garment is suitable in relation to the sizes of the samples recorded.
Furthermore, assessment of the five brands of compression base layers, both
individually and comparatively, included fabric testing. All testing took place in a
controlled laboratory with relative humidity of 65% ± 4% and temperature of 20°C
± 2°C, conditions in line with the relevant British Standard (BS 139, 2005) to
maintain reliability of results. Fibre composition was recorded from the care label
on each sample and therefore not determined independently. The following
parameters were also tested:
Thickness: A portable thickness gauge was used in order to determine the
fabric thickness. The thickness was measured at five different points of
each fabric, thus allowing an average reading to be made.
Area Density
Bulk Density
Courses and Wales
Fabric Structure: The fabric structure of each fabric was established using
a piece glass.
Stretch and Recovery: Stretch and recovery of the five fabrics were tested
as per the British Standard (BS 4294, 1968). Three wale and three course
samples were tested, allowing averages to be determined. The test looks at
the amount the fabric will extend without breaking and, subsequently, the
degree to which the fabric relaxes back to its original size. The results of
this test will therefore be of particular interest as compression garments rely
on the stretch properties of the fabric to create compression. Poor recovery
will be detrimental to frequent use of the base layer.
Although breaking strength tests would record at which point the fabrics may
stretch to it would not be possible to monitor the recovery of the sample also. The
stretch and recovery tests are therefore favoured in order to relate the test results
with the wearing of the garments.
Finally, the constructions of the bought samples were established to highlight
variations between brands. The positioning of seams coupled with the stitch types
used to construct garments was also assessed. This data was recorded to also
monitor any correlation between the construction of the sample and the pressure
distribution found.
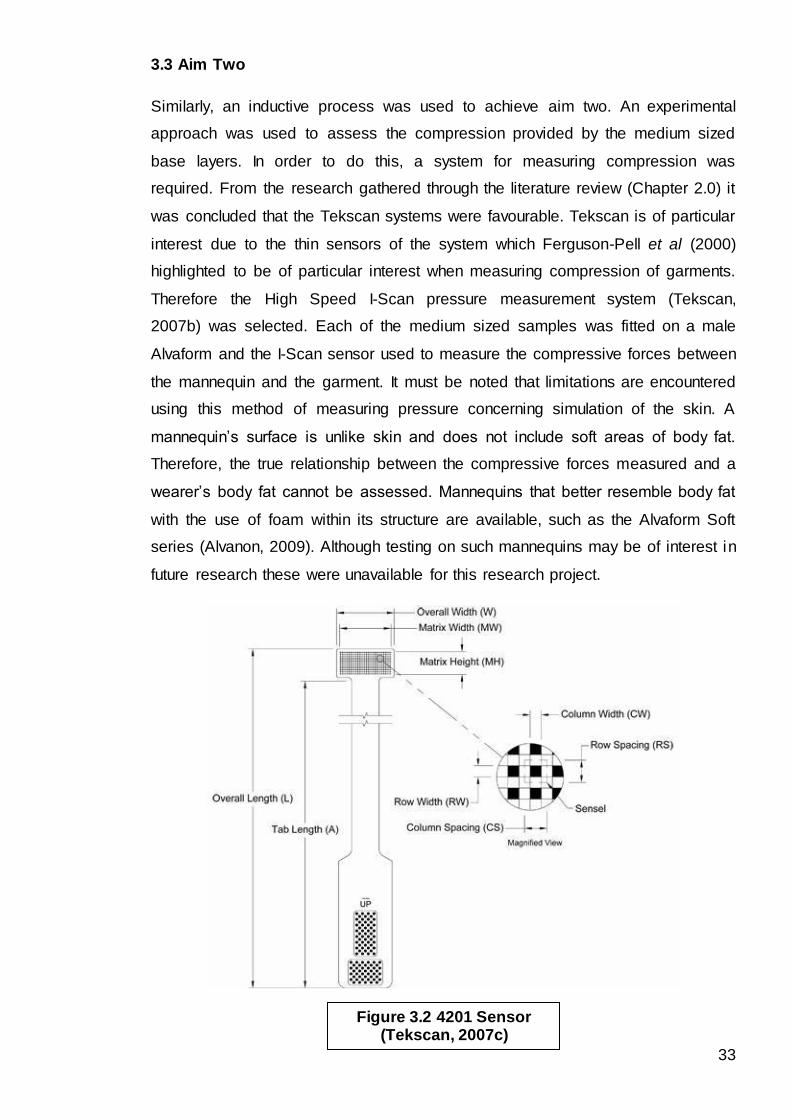
33
3.3 Aim Two
Similarly, an inductive process was used to achieve aim two. An experimental
approach was used to assess the compression provided by the medium sized
base layers. In order to do this, a system for measuring compression was
required. From the research gathered through the literature review (Chapter 2.0) it
was concluded that the Tekscan systems were favourable. Tekscan is of particular
interest due to the thin sensors of the system which Ferguson-Pell et al (2000)
highlighted to be of particular interest when measuring compression of garments.
Therefore the High Speed I-Scan pressure measurement system (Tekscan,
2007b) was selected. Each of the medium sized samples was fitted on a male
Alvaform and the I-Scan sensor used to measure the compressive forces between
the mannequin and the garment. It must be noted that limitations are encountered
using this method of measuring pressure concerning simulation of the skin. A
mannequin’s surface is unlike skin and does not include soft areas of body fat.
Therefore, the true relationship between the compressive forces measured and a
wearer’s body fat cannot be assessed. Mannequins that better resemble body fat
with the use of foam within its structure are available, such as the Alvaform Soft
series (Alvanon, 2009). Although testing on such mannequins may be of interest in
future research these were unavailable for this research project.
Figure 3.2 4201 Sensor (Tekscan, 2007c)
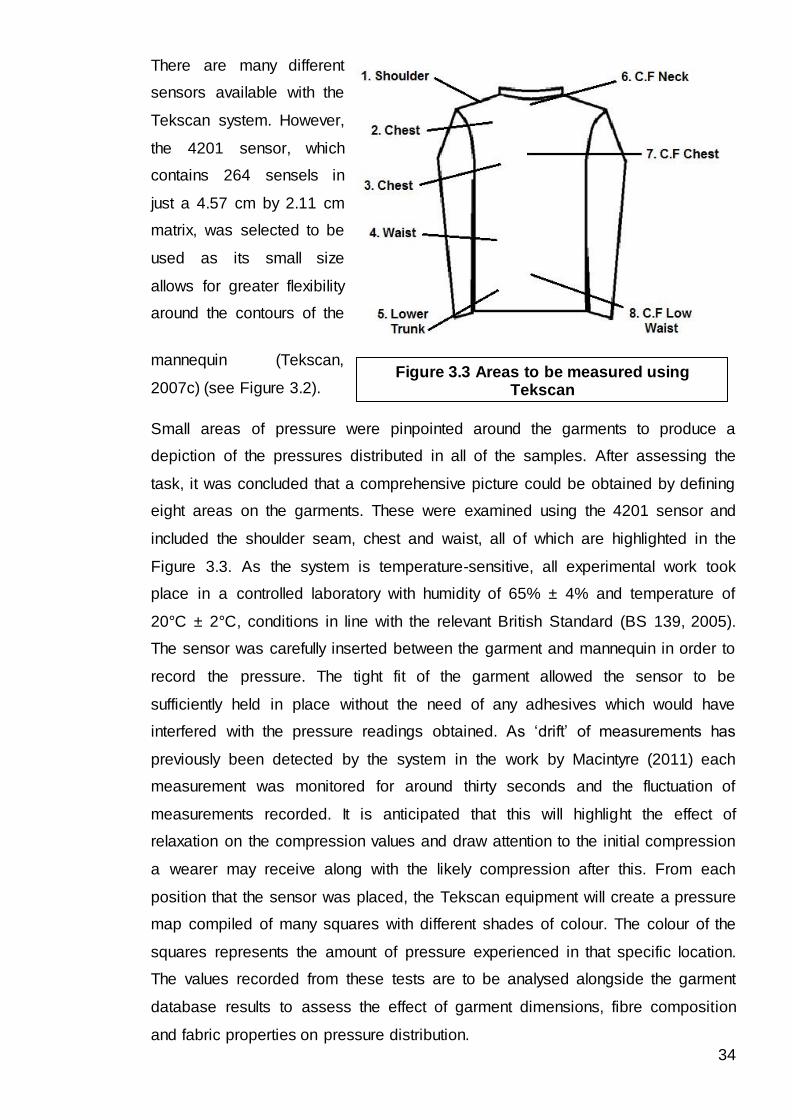
34
There are many different
sensors available with the
Tekscan system. However,
the 4201 sensor, which
contains 264 sensels in
just a 4.57 cm by 2.11 cm
matrix, was selected to be
used as its small size
allows for greater flexibility
around the contours of the
mannequin (Tekscan,
2007c) (see Figure 3.2).
Small areas of pressure were pinpointed around the garments to produce a
depiction of the pressures distributed in all of the samples. After assessing the
task, it was concluded that a comprehensive picture could be obtained by defining
eight areas on the garments. These were examined using the 4201 sensor and
included the shoulder seam, chest and waist, all of which are highlighted in the
Figure 3.3. As the system is temperature-sensitive, all experimental work took
place in a controlled laboratory with humidity of 65% ± 4% and temperature of
20°C ± 2°C, conditions in line with the relevant British Standard (BS 139, 2005).
The sensor was carefully inserted between the garment and mannequin in order to
record the pressure. The tight fit of the garment allowed the sensor to be
sufficiently held in place without the need of any adhesives which would have
interfered with the pressure readings obtained. As ‘drift’ of measurements has
previously been detected by the system in the work by Macintyre (2011) each
measurement was monitored for around thirty seconds and the fluctuation of
measurements recorded. It is anticipated that this will highlight the effect of
relaxation on the compression values and draw attention to the initial compression
a wearer may receive along with the likely compression after this. From each
position that the sensor was placed, the Tekscan equipment will create a pressure
map compiled of many squares with different shades of colour. The colour of the
squares represents the amount of pressure experienced in that specific location.
The values recorded from these tests are to be analysed alongside the garment
database results to assess the effect of garment dimensions, fibre composition
and fabric properties on pressure distribution.
Figure 3.3 Areas to be measured using Tekscan
35
3.4 Aim Three
Completion of aim three was by a method of deduction. The hypothesis that the
experimental work with compression measurement can be mapped on a CAD
system was tested to be either confirmed or rejected. In order to test this
hypothesis the compression measurement tests completed in the laboratory were
virtually simulated within a computer aided design (CAD) programme. From the
simulation systems discussed in the literature review, V-Stitcher was selected to
be used to create the CAD model. V-Stitcher allows the user to see digital patterns
on detailed 3D avatars, thus allowing flaws to be highlighted (Browzwear, 2012).
The results from the garment database and compression measurement analysis
were assessed to select samples for simulation. Two samples were selected for
simulation as they had contrasting fabric properties and pressure measurements.
Dissimilar samples were selected to determine the accuracy of the CAD model to
simulate a variation of properties.
To recreate the garments virtually and begin the simulation, patterns for the
randomly chosen garments were reconstructed. Although the detailed
measurements taken of each sample for the database could have been used to
create such patterns, it was believed that the deconstruction of the samples would
help the patterns to be more precise. Particularly when recreating the curves of the
garments. The paper patterns were then digitised so that they were able to be
viewed and manipulated within the V-Stitcher software. The patterns next had to
be virtually ‘sewn’ together. To do this each seam needed to be manually assigned
to its right position. These instructions then enable the system to virtually construct
the garment. An avatar was then modified to the dimensions of the male
mannequin used during the experimental procedure for the simulation. Once the
patterns were displayed digitally on the avatar, pressure maps could be viewed
within the system. The hypothesis will then be validated if the readings from these
maps correlate with the pressures found through experimental testing.
3.4.1 Fabric Assurance by Simple Testing (FAST)
In order to simulate the pressure tests on the body form and to further support aim
three, fabric properties were put into the V-Stitcher programme that are
representative of the fabrics used in the commercial garments. Browzwear (2012)
36
states that the “Unique texture mapping capabilities provide photo-like
representation of fabric” thus ensuring the simulation is as true to life as possible.
Fabric Assurance by Simple Testing (FAST) is a collection of tests, created by the
Commonwealth Scientific and Industrial Research Organisation (CSIRO), to
determine the deformation of fabrics by low loads (CSIRO, 2004). Although
subjective measurement is used widely throughout industry for determining fabric
handle, the FAST system was created in order to eliminate bias from the
qualitative methods previously used (Hunter and Fan, 2004). Prior to the creation
of FAST, Kawabata and associates created the Kawabata Evaluation System for
Fabrics (KES-F) in order to examine the deformation and recovery of fabrics.
However, KES-F is often cited as being expensive and difficult to use, points which
the FAST system was designed to overcome. Ly et al (1991) and Fan and Ng
(2001) claim that it achieves this objective. Furthermore, FAST is more beneficial
in this circumstance as the results from which could be put directly in to the V-
Stitcher system, unlike the results derived using the KES-F equipment. By doing
this the relevant patterns were better simulated in the CAD system with more true
to life garment characteristics. FAST is comprised of four tests, each of which is
detailed below (Minazio, 1995):
Compression - The FAST 1 test initially measures the fabrics thickness.
Although this is a measurement used to better understand the
characteristics of a fabric, the thickness alone does not indicate much
regarding the fabric performance during construction and use. To further
understand this, FAST 1 measures the thickness of each fabric under two
loads, so that it is possible to calculate the stability of the fabrics thickness
when under pressure. Durability of the fabric can also be calculated by
repeating the thickness test after steaming the fabric, thus indicating the
effect of such low loads.
Bending - FAST 2 focuses on the rigidity of each fabric. The system
measures how easily the fabric begins to bend and therefore how well it is
likely to drape. The test determines two parameters: bending length; and
bending rigidity
Extensibility - The FAST 3 extension meter measures how far a fabric will
stretch in all the warp, weft and bias directions. The extension of each will
be measured using three weights, 5 g, 20 g and 100 g. From the results
gathered by FAST 3 the shear rigidity can also be calculated. The FAST

37
system was produced for tailoring fabrics and as such the parameters of the
test are for woven fabrics (McLoughlin et al, 2010). Therefore, the fabrics
are likely to reach the limit of the machine at 100 g.
Dimensional Stability - FAST 4 is used to determine the dimensional
stability and hygral expansion of the fabric. In order to calculate this, the
fabrics need to be dried, soaked in water and then re-dried, being
measured at each point for differences in size to be calculated.
After the completion of the FAST tests, the formability of each fabric will also be
determined through a simple calculation using previous results.
The research methods outlined in this chapter include a combination of inductive
and deductive processes which were completed in order to achieve the three aims
of the research. Secondary research was gathered in the form of a literature
review to assess the use of compression in medicine and the increased availability
in sportswear. Primary research collection began with the selection of base layer
garments through cluster sampling. The chosen samples were then analysed with
reference to fabric properties, garment measurements and seams to create a
garment database of commercially available base layers to satisfy the first aim of
the research.
Next, compression measurement using the Tekscan system was completed and
assessed against the results from the garment database to accomplish aim two.
The Tekscan system was selected as thin flexible sensors have been favoured in
literature regarding pressure measurements and it is believed that the drift of
measurements associated with the system will highlight the relaxation of the
samples.
Finally, two samples were randomly selected to be recreated in a 3D simulation
model. The CAD model was created to test the hypothesis that the experimental
data can be mapped in a virtual system. FAST testing of the fabrics also allowed
for fabric properties to be put in the system for a more true to life simulation of the
garments to be created.
The next chapter focuses on the garment database detailed in this chapter
focusing on the construction, fabric types and measurements of compression base
layers on the current market.

38
4.0 Database of Garments
This database was compiled to observe the variations present between brands of
compression base layers for sport. Five different brands of compression base
layer were randomly chosen for this (see Chapter 3.0 Methodology). It is hoped
that the research gathered will highlight some of the main differences between
mass market brands which consumers consider upon purchase. Furthermore, the
information collected for this database with reference to dimensions, materials and
construction, shall be used to better analyse effects on the pressures measured
from each sample. It is believed that the database information coupled with the
compression measurement results will highlight some of the main effects of sizing,
construction and fabric differences between brands.
4.1 Garment Overview
As the compression sportswear market has expanded, a wide range of garments
are available for the everyday consumer to purchase. All samples purchased were
long sleeved base layer t-shirts. Short sleeved shirts, as well as leggings, socks
and shorts are also available.
The price of the samples purchased range from £15.99 to £19.99. Although more
expensive garments are available these were not on offer by the three top retailers
as detailed in the sports and clothing retail report by Mintel (2011).
From the five brands of base layer purchased (refer to Appendix A for photos) the
fabric compositions, measurements and construction were compared to produce
this database.
4.2 Fabric
The following Table 4.1 shows the fibre composition of the five different styles of
base layers purchased. All fibre compositions were taken directly from the care
label and not determined independently. From the fabric compositions displayed in
Table 4.1 it is interesting to point that garments were made of eight and eighteen
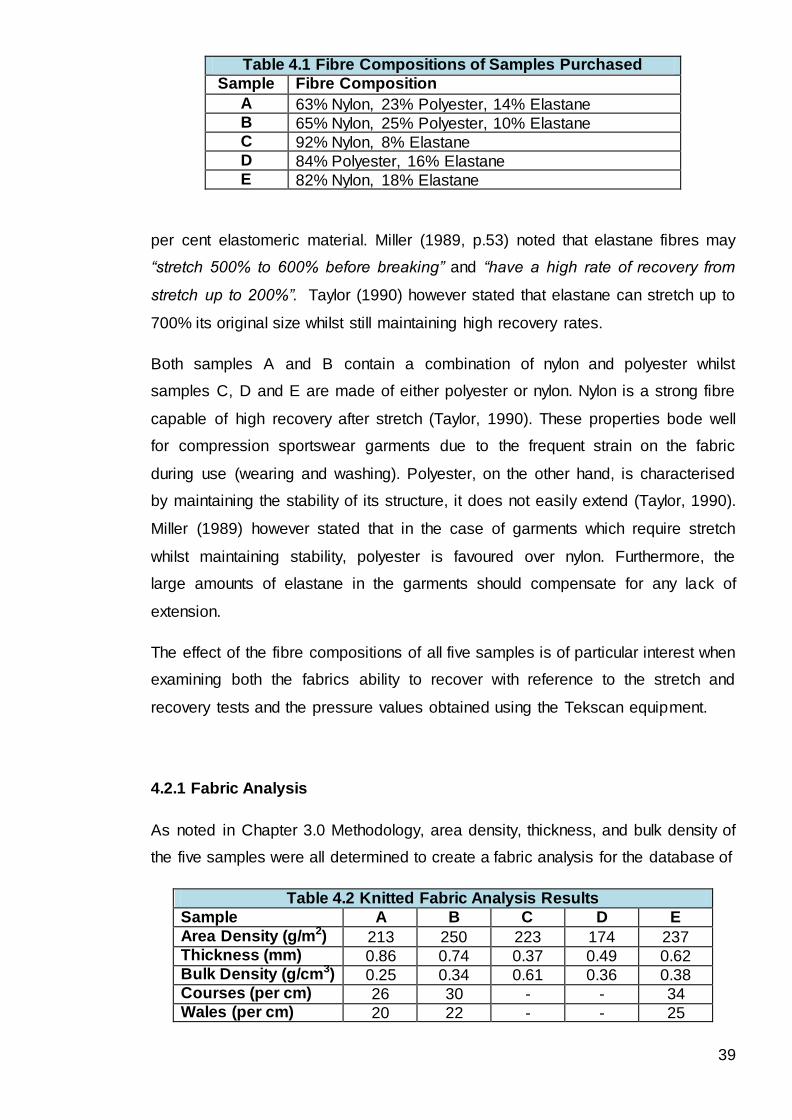
39
Table 4.1 Fibre Compositions of Samples Purchased
Sample Fibre Composition
A 63% Nylon, 23% Polyester, 14% Elastane B 65% Nylon, 25% Polyester, 10% Elastane C 92% Nylon, 8% Elastane D 84% Polyester, 16% Elastane E 82% Nylon, 18% Elastane
per cent elastomeric material. Miller (1989, p.53) noted that elastane fibres may
“stretch 500% to 600% before breaking” and “have a high rate of recovery from
stretch up to 200%”. Taylor (1990) however stated that elastane can stretch up to
700% its original size whilst still maintaining high recovery rates.
Both samples A and B contain a combination of nylon and polyester whilst
samples C, D and E are made of either polyester or nylon. Nylon is a strong fibre
capable of high recovery after stretch (Taylor, 1990). These properties bode well
for compression sportswear garments due to the frequent strain on the fabric
during use (wearing and washing). Polyester, on the other hand, is characterised
by maintaining the stability of its structure, it does not easily extend (Taylor, 1990).
Miller (1989) however stated that in the case of garments which require stretch
whilst maintaining stability, polyester is favoured over nylon. Furthermore, the
large amounts of elastane in the garments should compensate for any lack of
extension.
The effect of the fibre compositions of all five samples is of particular interest when
examining both the fabrics ability to recover with reference to the stretch and
recovery tests and the pressure values obtained using the Tekscan equipment.
4.2.1 Fabric Analysis
As noted in Chapter 3.0 Methodology, area density, thickness, and bulk density of
the five samples were all determined to create a fabric analysis for the database of
Table 4.2 Knitted Fabric Analysis Results
Sample A B C D E
Area Density (g/m2) 213 250 223 174 237 Thickness (mm) 0.86 0.74 0.37 0.49 0.62 Bulk Density (g/cm3) 0.25 0.34 0.61 0.36 0.38 Courses (per cm) 26 30 - - 34 Wales (per cm) 20 22 - - 25
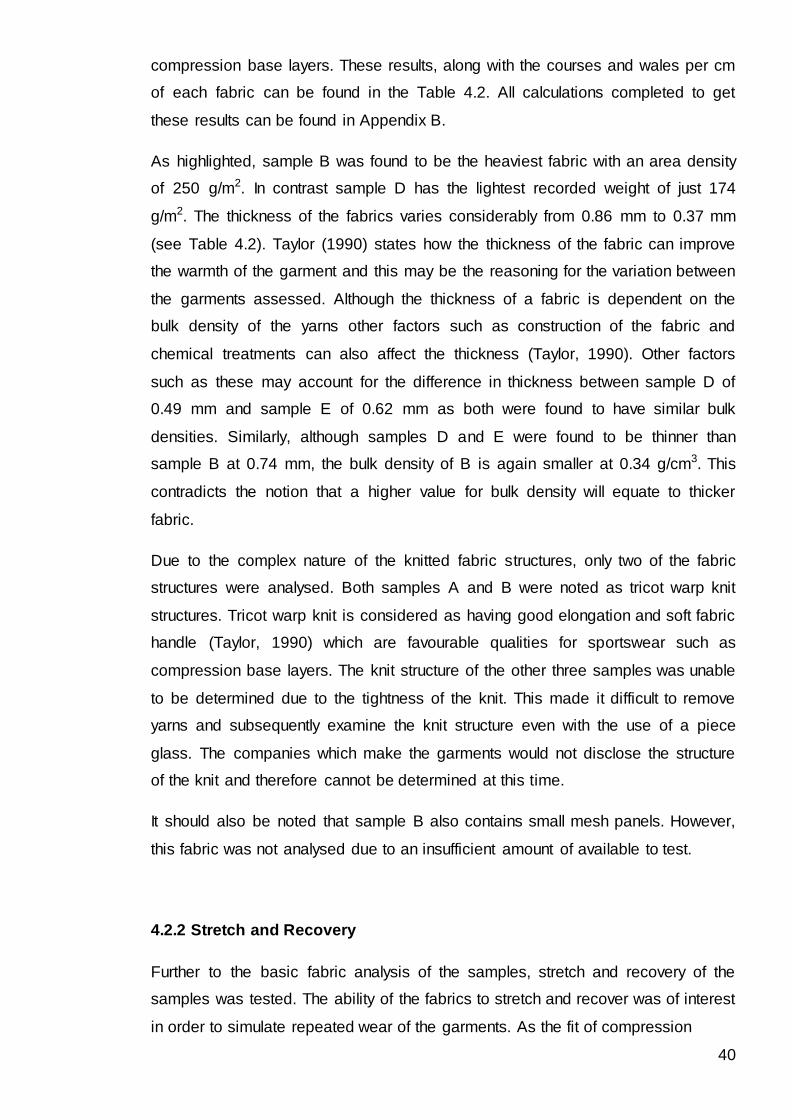
40
compression base layers. These results, along with the courses and wales per cm
of each fabric can be found in the Table 4.2. All calculations completed to get
these results can be found in Appendix B.
As highlighted, sample B was found to be the heaviest fabric with an area density
of 250 g/m2. In contrast sample D has the lightest recorded weight of just 174
g/m2. The thickness of the fabrics varies considerably from 0.86 mm to 0.37 mm
(see Table 4.2). Taylor (1990) states how the thickness of the fabric can improve
the warmth of the garment and this may be the reasoning for the variation between
the garments assessed. Although the thickness of a fabric is dependent on the
bulk density of the yarns other factors such as construction of the fabric and
chemical treatments can also affect the thickness (Taylor, 1990). Other factors
such as these may account for the difference in thickness between sample D of
0.49 mm and sample E of 0.62 mm as both were found to have similar bulk
densities. Similarly, although samples D and E were found to be thinner than
sample B at 0.74 mm, the bulk density of B is again smaller at 0.34 g/cm3. This
contradicts the notion that a higher value for bulk density will equate to thicker
fabric.
Due to the complex nature of the knitted fabric structures, only two of the fabric
structures were analysed. Both samples A and B were noted as tricot warp knit
structures. Tricot warp knit is considered as having good elongation and soft fabric
handle (Taylor, 1990) which are favourable qualities for sportswear such as
compression base layers. The knit structure of the other three samples was unable
to be determined due to the tightness of the knit. This made it difficult to remove
yarns and subsequently examine the knit structure even with the use of a piece
glass. The companies which make the garments would not disclose the structure
of the knit and therefore cannot be determined at this time.
It should also be noted that sample B also contains small mesh panels. However,
this fabric was not analysed due to an insufficient amount of available to test.
4.2.2 Stretch and Recovery
Further to the basic fabric analysis of the samples, stretch and recovery of the
samples was tested. The ability of the fabrics to stretch and recover was of interest
in order to simulate repeated wear of the garments. As the fit of compression
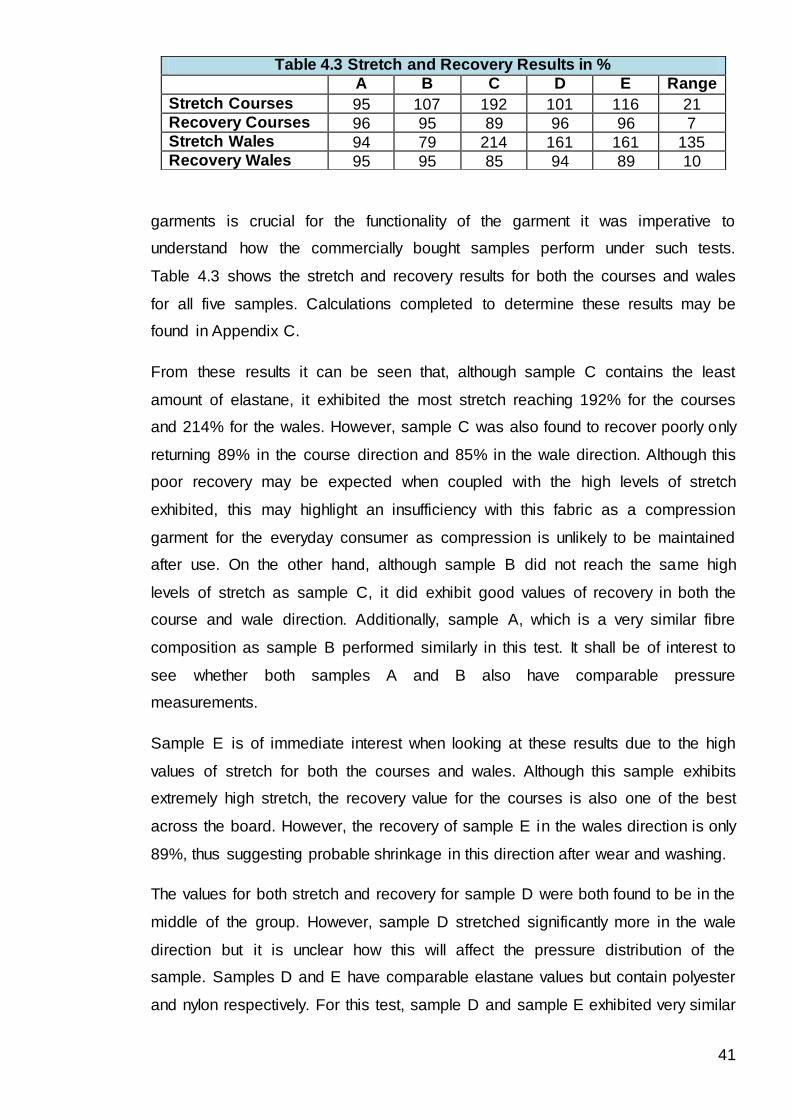
41
garments is crucial for the functionality of the garment it was imperative to
understand how the commercially bought samples perform under such tests.
Table 4.3 shows the stretch and recovery results for both the courses and wales
for all five samples. Calculations completed to determine these results may be
found in Appendix C.
From these results it can be seen that, although sample C contains the least
amount of elastane, it exhibited the most stretch reaching 192% for the courses
and 214% for the wales. However, sample C was also found to recover poorly only
returning 89% in the course direction and 85% in the wale direction. Although this
poor recovery may be expected when coupled with the high levels of stretch
exhibited, this may highlight an insufficiency with this fabric as a compression
garment for the everyday consumer as compression is unlikely to be maintained
after use. On the other hand, although sample B did not reach the same high
levels of stretch as sample C, it did exhibit good values of recovery in both the
course and wale direction. Additionally, sample A, which is a very similar fibre
composition as sample B performed similarly in this test. It shall be of interest to
see whether both samples A and B also have comparable pressure
measurements.
Sample E is of immediate interest when looking at these results due to the high
values of stretch for both the courses and wales. Although this sample exhibits
extremely high stretch, the recovery value for the courses is also one of the best
across the board. However, the recovery of sample E in the wales direction is only
89%, thus suggesting probable shrinkage in this direction after wear and washing.
The values for both stretch and recovery for sample D were both found to be in the
middle of the group. However, sample D stretched significantly more in the wale
direction but it is unclear how this will affect the pressure distribution of the
sample. Samples D and E have comparable elastane values but contain polyester
and nylon respectively. For this test, sample D and sample E exhibited very similar
Table 4.3 Stretch and Recovery Results in %
A B C D E Range
Stretch Courses 95 107 192 101 116 21 Recovery Courses 96 95 89 96 96 7 Stretch Wales 94 79 214 161 161 135 Recovery Wales 95 95 85 94 89 10
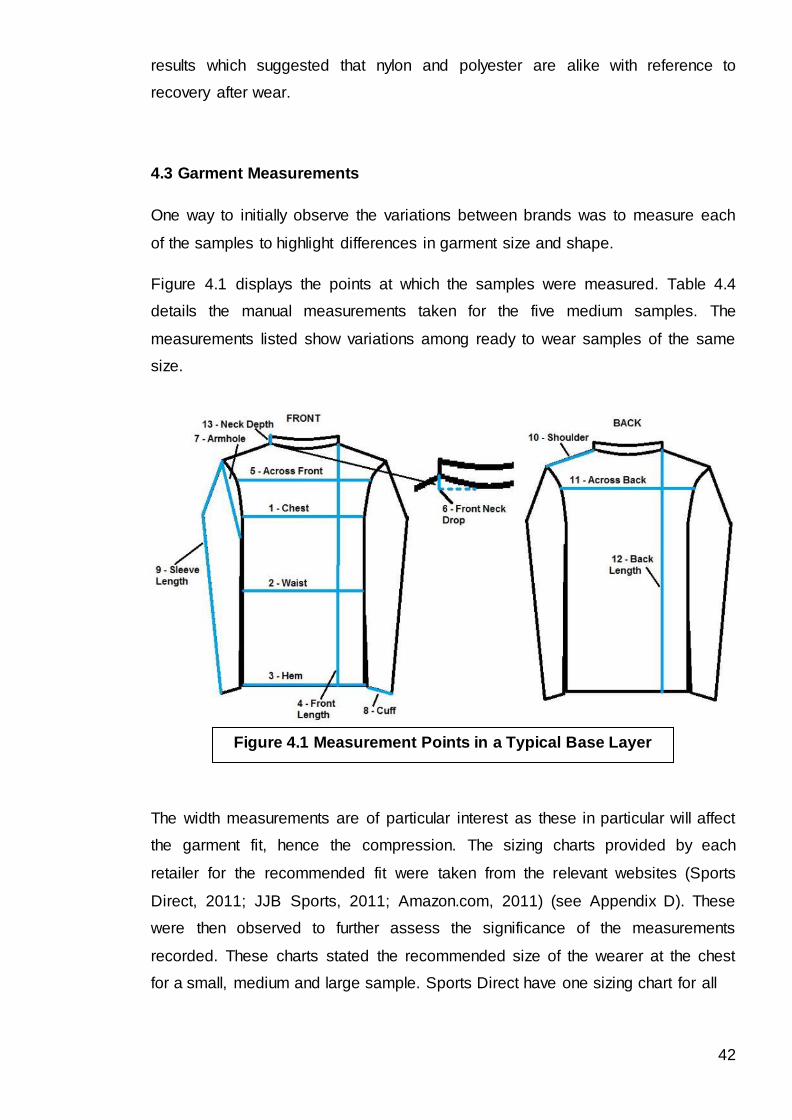
42
results which suggested that nylon and polyester are alike with reference to
recovery after wear.
4.3 Garment Measurements
One way to initially observe the variations between brands was to measure each
of the samples to highlight differences in garment size and shape.
Figure 4.1 displays the points at which the samples were measured. Table 4.4
details the manual measurements taken for the five medium samples. The
measurements listed show variations among ready to wear samples of the same
size.
The width measurements are of particular interest as these in particular will affect
the garment fit, hence the compression. The sizing charts provided by each
retailer for the recommended fit were taken from the relevant websites (Sports
Direct, 2011; JJB Sports, 2011; Amazon.com, 2011) (see Appendix D). These
were then observed to further assess the significance of the measurements
recorded. These charts stated the recommended size of the wearer at the chest
for a small, medium and large sample. Sports Direct have one sizing chart for all
Figure 4.1 Measurement Points in a Typical Base Layer
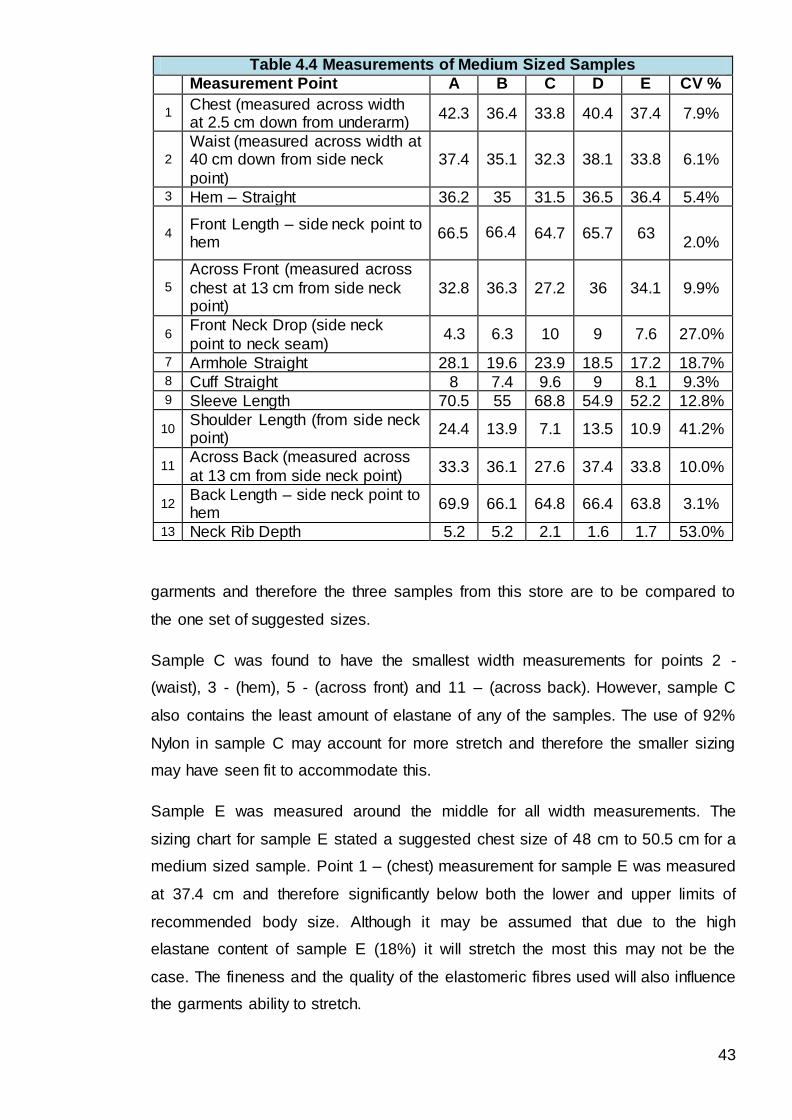
43
Table 4.4 Measurements of Medium Sized Samples
Measurement Point A B C D E CV %
1 Chest (measured across width at 2.5 cm down from underarm)
42.3 36.4 33.8 40.4 37.4 7.9%
2
Waist (measured across width at 40 cm down from side neck
point)
37.4 35.1 32.3 38.1 33.8 6.1%
3 Hem – Straight 36.2 35 31.5 36.5 36.4 5.4%
4 Front Length – side neck point to hem
66.5 66.4
64.7 65.7 63
2.0%
5
Across Front (measured across
chest at 13 cm from side neck point)
32.8 36.3 27.2 36 34.1 9.9%
6 Front Neck Drop (side neck
point to neck seam) 4.3 6.3 10 9 7.6 27.0%
7 Armhole Straight 28.1 19.6 23.9 18.5 17.2 18.7% 8 Cuff Straight 8 7.4 9.6 9 8.1 9.3% 9 Sleeve Length 70.5 55 68.8 54.9 52.2 12.8%
10 Shoulder Length (from side neck point)
24.4 13.9 7.1 13.5 10.9 41.2%
11 Across Back (measured across
at 13 cm from side neck point) 33.3 36.1 27.6 37.4 33.8 10.0%
12 Back Length – side neck point to hem
69.9 66.1 64.8 66.4 63.8 3.1%
13 Neck Rib Depth 5.2 5.2 2.1 1.6 1.7 53.0%
garments and therefore the three samples from this store are to be compared to
the one set of suggested sizes.
Sample C was found to have the smallest width measurements for points 2 -
(waist), 3 - (hem), 5 - (across front) and 11 – (across back). However, sample C
also contains the least amount of elastane of any of the samples. The use of 92%
Nylon in sample C may account for more stretch and therefore the smaller sizing
may have seen fit to accommodate this.
Sample E was measured around the middle for all width measurements. The
sizing chart for sample E stated a suggested chest size of 48 cm to 50.5 cm for a
medium sized sample. Point 1 – (chest) measurement for sample E was measured
at 37.4 cm and therefore significantly below both the lower and upper limits of
recommended body size. Although it may be assumed that due to the high
elastane content of sample E (18%) it will stretch the most this may not be the
case. The fineness and the quality of the elastomeric fibres used will also influence
the garments ability to stretch.

44
Although samples D (16%) and E (18%) both contain similar values of elastane
content, sample D, which contains polyester, is bigger at measurement points 1 –
(chest), 2 – (waist), 5 – (across front) and 11 – (across back), as opposed to
sample E which contains nylon. Again, the quality of elastane fibres will influence
the garments stretch characteristics. As previously noted, Miller (1989) and Taylor
(1990) both state that polyester is characterised by having good stability and
therefore is less likely to stretch than Nylon. Therefore the variations in size
between D and E may be in order to accommodate this. Samples A and B also
have similar fibre compositions and are therefore of particular interest when
observing if measurements are comparable. Although sample A was found to be
have broader width measurements at points 1 – (chest), 2 – (waist) and 3 – (hem),
sample B is wider at points 5 – (across front) and 11 – (across back). The sizing
chart for sample B states a recommended chest size of 47 cm to 49.5 cm. Sample
B was measured as 36.4 cm at point 1 – (chest) and therefore is much smaller
than the suggested chest size of the wearer.
Medium sized garments A, C and D, from Sports Direct, were all recommended for
a chest size between 48.5 cm to 51 cm. However, the point 1 - (chest)
measurements recorded for these three samples vary significantly from 33.8 cm
for sample C to 42.3 cm for sample A. This means sample C is made to be much
smaller than the lower limit of the recommended chest size. Although the chest
measurements recorded for sample D and sample A were found to be over 6 cm
and 8 cm (respectively) bigger than sample C, the measurements are still below
the lower limit of the recommended chest size. This wide variation between the
size of different brands, which have the same recommended chest size, is thought
to effect the pressure distributed by the garments when worn by different sized
individuals. In particular if the wearer of the garments is towards the upper limit of
the recommended sizes. Although it has been previously noted that the
measurements for sample C may need to be slightly bigger due to the stability of
polyester, it may be the case that this sample will not provide as much pressure as
desired. Again, especially if the person wearing said garment is toward the higher
limit of the recommended size.
All the samples examined were significantly below the lower limit of recommended
chest sizes specified by the retailers. However, there was a wide variation of
proximities to said limits. Whilst sample A measured 6.2 cm below the limit,
sample C measured 14.7 cm below. The wide variation in differences between
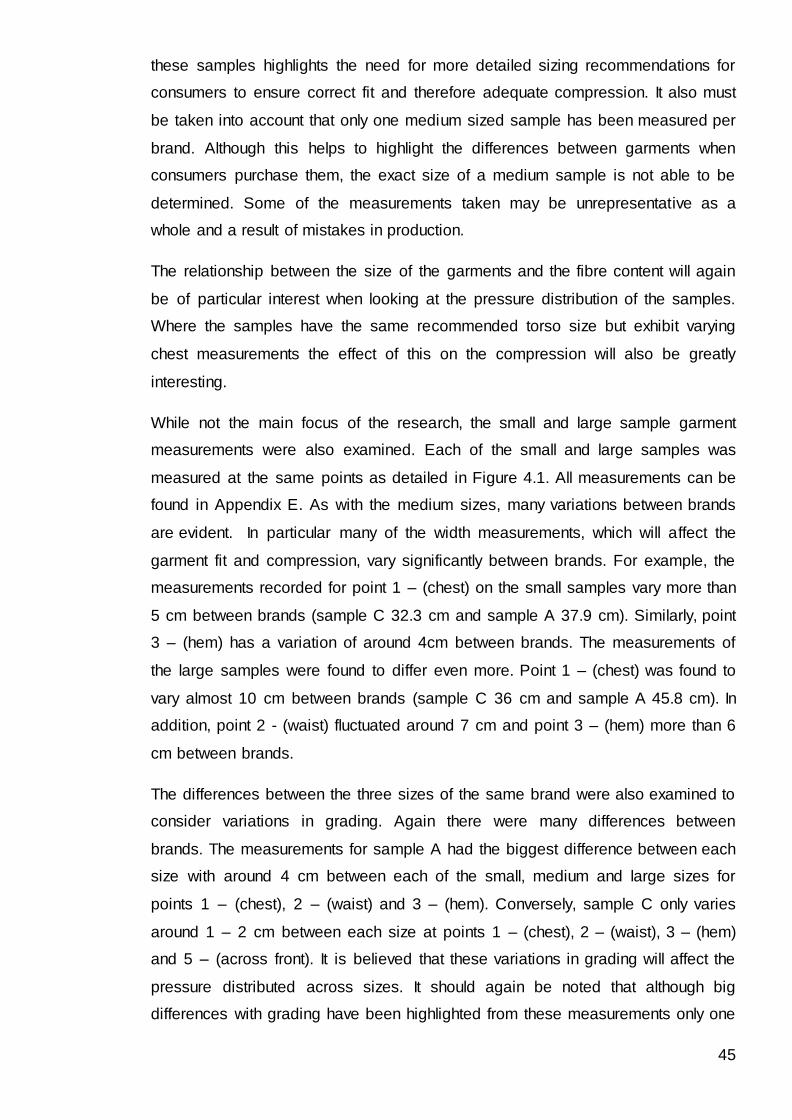
45
these samples highlights the need for more detailed sizing recommendations for
consumers to ensure correct fit and therefore adequate compression. It also must
be taken into account that only one medium sized sample has been measured per
brand. Although this helps to highlight the differences between garments when
consumers purchase them, the exact size of a medium sample is not able to be
determined. Some of the measurements taken may be unrepresentative as a
whole and a result of mistakes in production.
The relationship between the size of the garments and the fibre content will again
be of particular interest when looking at the pressure distribution of the samples.
Where the samples have the same recommended torso size but exhibit varying
chest measurements the effect of this on the compression will also be greatly
interesting.
While not the main focus of the research, the small and large sample garment
measurements were also examined. Each of the small and large samples was
measured at the same points as detailed in Figure 4.1. All measurements can be
found in Appendix E. As with the medium sizes, many variations between brands
are evident. In particular many of the width measurements, which will affect the
garment fit and compression, vary significantly between brands. For example, the
measurements recorded for point 1 – (chest) on the small samples vary more than
5 cm between brands (sample C 32.3 cm and sample A 37.9 cm). Similarly, point
3 – (hem) has a variation of around 4cm between brands. The measurements of
the large samples were found to differ even more. Point 1 – (chest) was found to
vary almost 10 cm between brands (sample C 36 cm and sample A 45.8 cm). In
addition, point 2 - (waist) fluctuated around 7 cm and point 3 – (hem) more than 6
cm between brands.
The differences between the three sizes of the same brand were also examined to
consider variations in grading. Again there were many differences between
brands. The measurements for sample A had the biggest difference between each
size with around 4 cm between each of the small, medium and large sizes for
points 1 – (chest), 2 – (waist) and 3 – (hem). Conversely, sample C only varies
around 1 – 2 cm between each size at points 1 – (chest), 2 – (waist), 3 – (hem)
and 5 – (across front). It is believed that these variations in grading will affect the
pressure distributed across sizes. It should again be noted that although big
differences with grading have been highlighted from these measurements only one

46
sample in each size has been examined. Therefore, some of the measurements
taken may be unrepresentative as a whole and a result of mistakes in production.
Therefore, research that further investigates these differences in grading on a
much larger number of samples may be beneficial.
4.4 Stitches
Table 4.5 Stitches Used in Samples Purchased.
Sample Stitches
A 607 Wide Cover Stitch, 406 Bottom Cover Stitch and 504 Over
edge. B 605 Cover Stitch and 504 Over edge. C 607 Wide Cover Stitch and 514 Four Thread Over edge D 607 Wide Cover Stitch, 406 Bottom Cover Stitch and 401 Double
Locked Stitch E 605 Cover Stitch and 607 Wide Cover Stitch
The Table 4.5 lists the stitches used in the compression samples analysed.
Combinations of the following six different stitch types have been identified in the
samples:
401 Double Locked Stitch: The 401 Double Locked Stitch is used to join
fabric such as the neck seam on sample D. Cooklin (2006) explains how
the 401 stitch, although similar to the common 301 allows a greater
extension and is therefore more suitable for stretch fabrics.
406: Bottom Cover Stitch: On both samples A and D the 406 bottom
cover stitch is used for the hems of the garments. This stitch allows the hem
to be neatened whilst being sewn and its high elasticity means it is suitable
for use on fabrics with high stretch (Carr and Latham, 2008).
504: Over edge: To join the neck seam on sample A and both the side
seams and sleeve seams on sample B, the 504 over edge stitch has been
used. The three thread stitch exhibits both good stretch and recovery and
therefore is suitable for stretch fabrics (Carr and Latham, 2008).
514: Four Thread Over edge: The 514 stitch both neatens and joins using,
as the name suggests, four threads. This stitch increases the strength of
the seam without compromising on the bulkiness of it (Cooklin, 2006). Carr
and Latham (2008) explain how the 514 stitch is less vulnerable to rupture
47
due to its increased width compared to the similar 504. The 514 stitch was
identified on the neck attachment of sample C.
605: Cover Stitch: The majority of seams for both samples B and E are the
605 cover stitch. This stitch type has excellent stretch properties and is
usually used to “eliminate some overlocking operations” (Cooklin, 2006,
pp110).
607: Wide Cover Stitch: Similar to the 605 cover stitch, the 607 stitch
boasts high elongation and therefore suitability for garments such as those
being analysed. Unlike the 605, the 607 has a wider bight and is made
using six threads rather than five. On samples A, C and D the majority of
seams are constructed using the 607 wide cover stitch.
All six stitches identified within the samples are considered to display adequate
levels of elasticity for use in stretch garments and are therefore unlikely to affect
the garment. The 607 wide cover stitch is noted as having a wider bight than the
similar 605 cover stitch, as does the 514 four thread over edge compared to the
504 over edge. The wider bight in these stitches should create a stronger seam.
The increased durability from this may ensure the garment is fit for purpose for a
longer period. Although, it is thought that this will have no bearing on the
compression measurement during this research.
4.4.1 Positioning of Seams
Although the construction of the seams is noteworthy to highlight similarities and
differences between the samples, it may be argued that the position of the seams
is of greater importance on the impact of the pressure distribution. The following
Figures 4.2 to 4.6 are working drawings to show the positioning of the seams and
panels of each sample. As it can be seen from these images, no two samples
were alike with reference to seam positioning. Whilst sample E is a ‘basic’ style
long sleeve t-shirt, sample B incorporates many panels on both the back and the
front of the garment. It will be of particular interest when recording the pressure
vales of the garments whether these panels appear to effect the distribution and
values of pressure.

48
Figure 4.2 to 4.6 Positioning
of Seams
Figure 4.2 Figure 4.3
Figure 4.4 Figure 4.5 Figure 4.6
49
4.5 Summary
All in all there have been both variations and similarities highlighted through the
collation of the garment database. Nylon, polyester or a combination of the two
fibres have been used in all the fabrics examined. It is likely that these fibres have
been utilised for high values of stretch and recovery and the good stability
associated with the fibres. However, after testing the stretch and recovery of
garments some poor recovery rates were highlighted. Although high levels of
elastomeric fibres have been used in all garments the insufficiency of recovery
found may be a result from poor elastomeric fibre quality. No matter what the
reason for the poor recovery, this will directly affect the compression exhibited in
the garments when worn multiple times. Thus meaning that the support the
garments will provide to the wearer will reduce after each wear due to their inability
to return to their original state.
From the manual measurements taken, the samples vary considerably between
garments of the same specified size. This is a particular concern with regards to
the three samples purchased from one retailer as the size chart for all is the same.
By having the same size chart but different brands which are inevitably of different
fits compression consumers will get from each garment will vary considerable.
However, unless purchasing all and comparing, consumers may be unaware of
this. The size charts from all three retailers are also very basic with only a few
guideline measurements given. It is thought that garments such as these require
much more accurate size charts and more detailed help for fitting in order for
consumers to make informed choices when buying.
Combinations of six stitch types were identified in the five samples. All are thought
to be appropriate for stretch garments and whilst some boast bigger bights
resulting in increased strength this is not thought to be an issue with regards the
compression measurement analysis. The position of seams and panels varies
widely between all samples analysed. It is yet to be determined what effect, if any,
this will have on the distribution and values of pressure. It could be the case that
these panels were designed merely for aesthetic purposes but the impact of this
could be significant if seams are found to have effected compression. Again, there
is no information at point of purchase about the effect of seams and panels.
Although these may be thought to be ergonomically placed, there is no further
50
explanation as to what this means and their effect on the body. Further detail on
such factors would also aid consumer choices.
Overall, it is clear that there is a huge variation between brands with regards to
ready to wear compression base layers. More detailed sizing information for
consumers will perhaps help overcome these differences as sizing charts provided
currently are only vague. The differences highlighted here shall help to analyse
variations and similarities between the pressures measured
The next Chapter, 5.0 Compression Measurement Analysis, highlights the key
findings from the pressure measurements taken of the five samples in the
database. From the analysis in Chapter 5.0, it may be possible to allow a better
understanding of the behaviour of the fabrics with reference to compression values
and distribution.
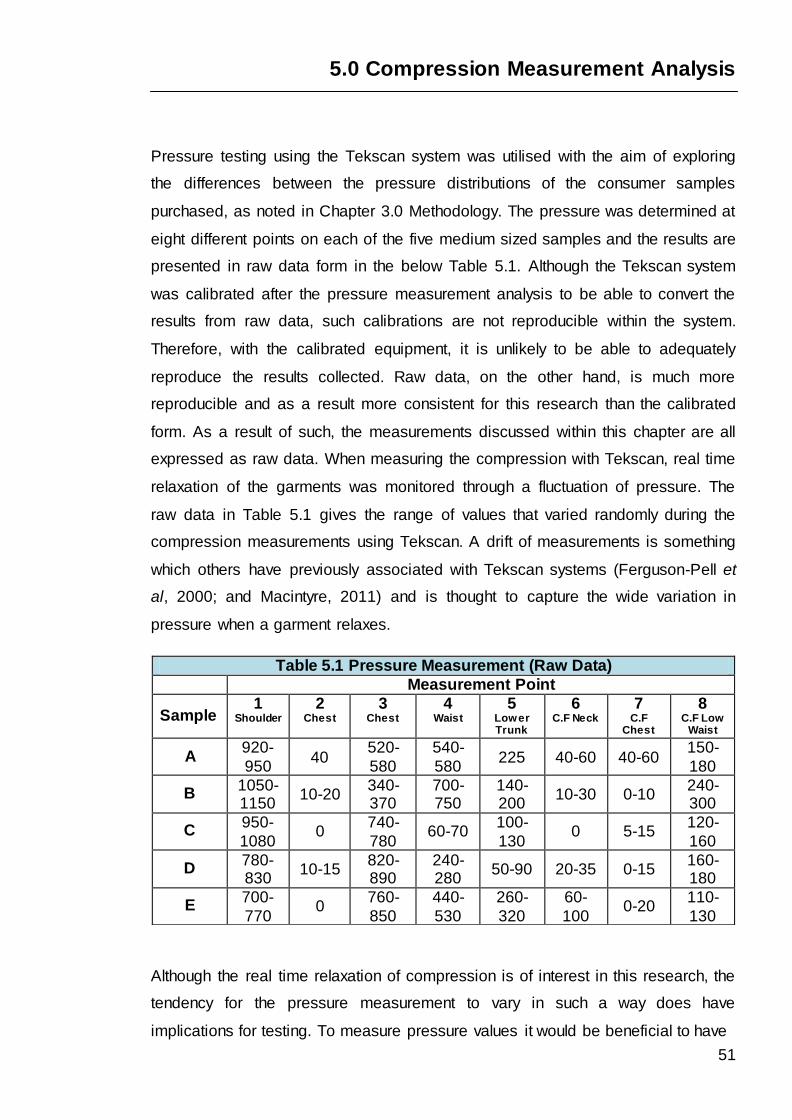
51
5.0 Compression Measurement Analysis
Pressure testing using the Tekscan system was utilised with the aim of exploring
the differences between the pressure distributions of the consumer samples
purchased, as noted in Chapter 3.0 Methodology. The pressure was determined at
eight different points on each of the five medium sized samples and the results are
presented in raw data form in the below Table 5.1. Although the Tekscan system
was calibrated after the pressure measurement analysis to be able to convert the
results from raw data, such calibrations are not reproducible within the system.
Therefore, with the calibrated equipment, it is unlikely to be able to adequately
reproduce the results collected. Raw data, on the other hand, is much more
reproducible and as a result more consistent for this research than the calibrated
form. As a result of such, the measurements discussed within this chapter are all
expressed as raw data. When measuring the compression with Tekscan, real time
relaxation of the garments was monitored through a fluctuation of pressure. The
raw data in Table 5.1 gives the range of values that varied randomly during the
compression measurements using Tekscan. A drift of measurements is something
which others have previously associated with Tekscan systems (Ferguson-Pell et
al, 2000; and Macintyre, 2011) and is thought to capture the wide variation in
pressure when a garment relaxes.
Although the real time relaxation of compression is of interest in this research, the
tendency for the pressure measurement to vary in such a way does have
implications for testing. To measure pressure values it would be beneficial to have
Table 5.1 Pressure Measurement (Raw Data)
Measurement Point
Sample 1
Shoulder
2 Chest
3 Chest
4 Waist
5 Lower Trunk
6 C.F Neck
7 C.F
Chest
8 C.F Low
Waist
A 920-
950 40
520-
580
540-
580 225 40-60 40-60
150-
180
B 1050-1150
10-20 340-370
700-750
140-200
10-30 0-10 240-300
C 950-
1080 0
740-
780 60-70
100-
130 0 5-15
120-
160
D 780-830
10-15 820-890
240-280
50-90 20-35 0-15 160-180
E 700-
770 0
760-
850
440-
530
260-
320
60-
100 0-20
110-
130

52
Figure 5.1
Colour
Legend for
Tekscan
a more stable position to capture however, the drift of measurements would still
need to be understood. Figure 5.1 also displays the raw data in the form of a
graph. Where a fluctuation of measurements was recorded at one point the
median value for that area has been taken and plotted on the graph. Immediately
from the results, shown in both Table 5.1 and Figure 5.1, clear similarities and
differences between samples A to E can be observed. Very little compression is
thought to be required down the centre front of the body due to the close proximity
to the heart. Therefore, the low values of pressure which are shown on Figure 5.1
at points six (Centre Front (C.F) neck) and seven (C.F chest) are to be expected.
Although on the centre front of the body, point eight (C.F low waist) exhibited
slightly more pressure than the other centre front measurements. However,
compression here is likely to facilitate the return of deoxygenated blood toward the
heart. Very little compression was also measured on all samples at point three
(chest). Again, this area is a close immediacy to the heart and, therefore, little
pressure is expected here. The areas of most pressure have been found to be at
point one (shoulder) and point three (chest). However, Figure 5.1 clearly highlights
how sample B differs from other garments at measurement points three (chest)
and four (waist) with the higher value at point four (waist). Similarly, sample A also
exhibits higher pressure values for point four (waist) than point three (chest)
although with a much smaller difference between the two. These anomalies will be
of interest when further analysing the compression measurement.
Pressure maps collected via the Tekscan system also
help to highlight the vast differences in the way the
pressures are distributed. Figure 5.2 is the colour
legend to which the pressure maps relate to. The
results from the five samples need to be analysed
collectively and in relation to fabric properties, garment
measurements and garment seams and construction
for the effect of variances between compression
garments of the same stated size to be identified.
5.1 Pressure Measurement Analysis
To begin the pressure measurement analysis patterns of pressure distribution
across all five sizes were identified. Immediately it can be seen that all five
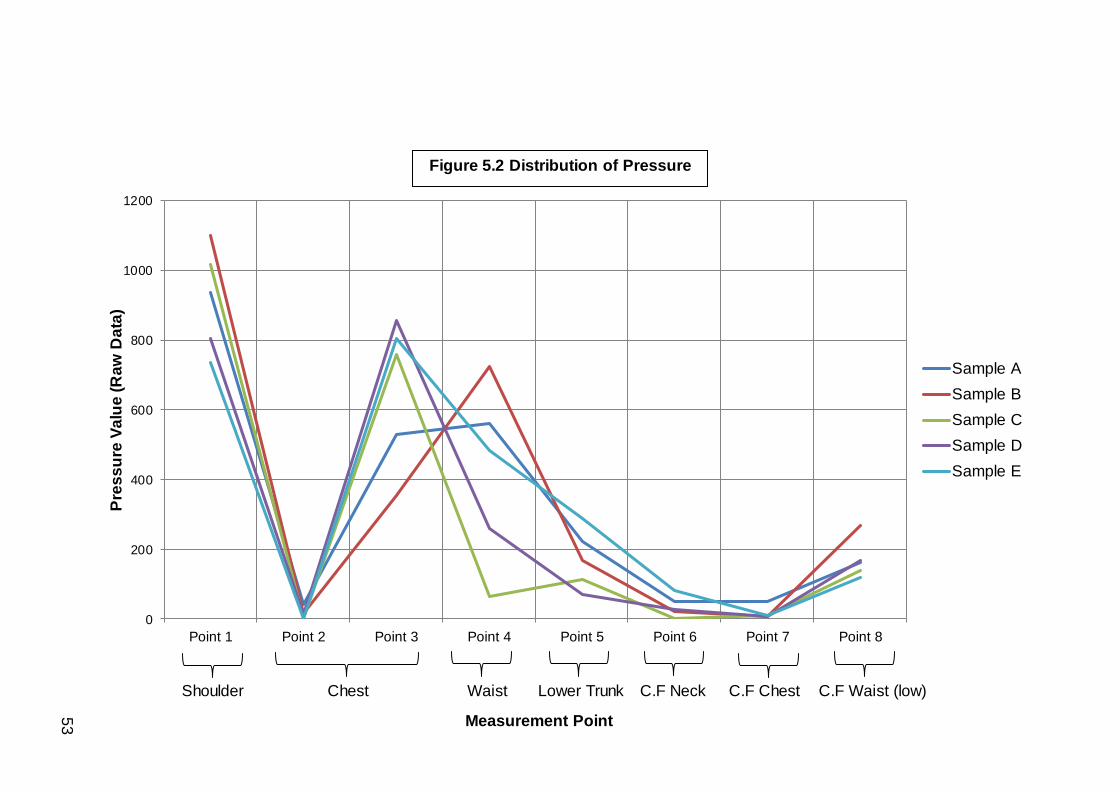
53
Shoulder Chest Waist Lower Trunk C.F Neck C.F Chest C.F Waist (low)
0
200
400
600
800
1000
1200
Point 1 Point 2 Point 3 Point 4 Point 5 Point 6 Point 7 Point 8
Pre
ss
ure
Va
lue
(R
aw
Da
ta)
Sample A
Sample B
Sample C
Sample D
Sample E
Figure 5.2 Distribution of Pressure
Measurement Point
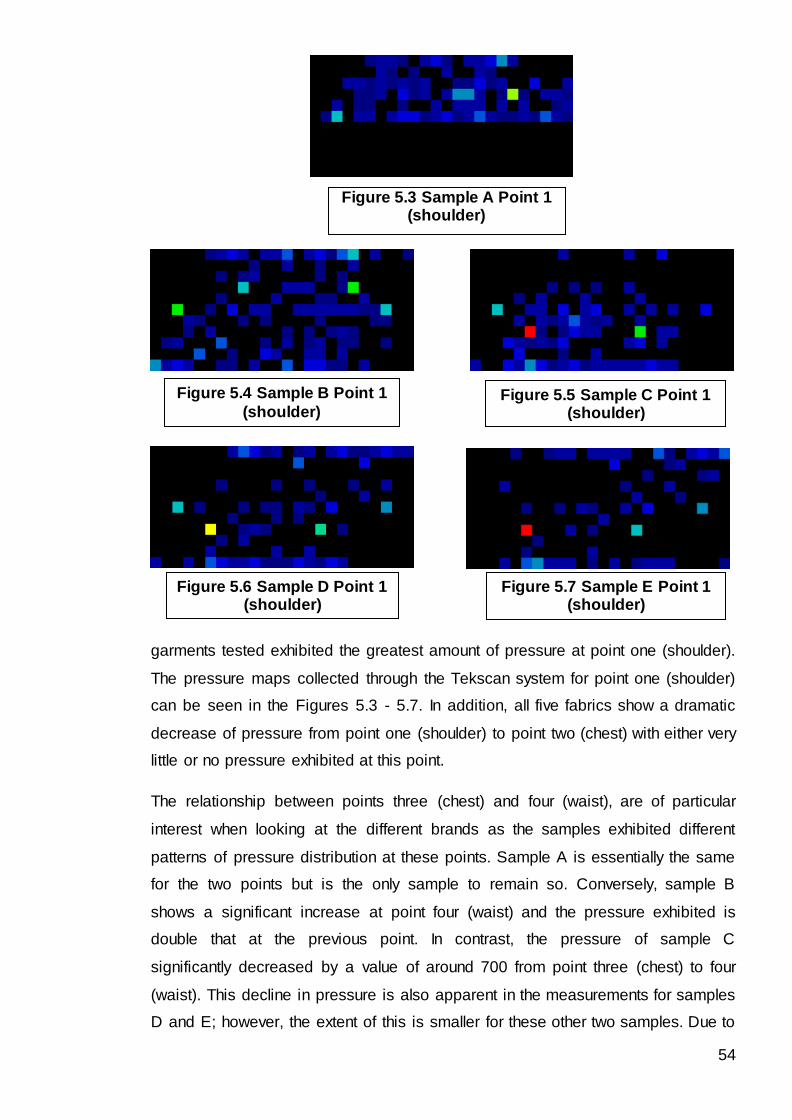
54
garments tested exhibited the greatest amount of pressure at point one (shoulder).
The pressure maps collected through the Tekscan system for point one (shoulder)
can be seen in the Figures 5.3 - 5.7. In addition, all five fabrics show a dramatic
decrease of pressure from point one (shoulder) to point two (chest) with either very
little or no pressure exhibited at this point.
The relationship between points three (chest) and four (waist), are of particular
interest when looking at the different brands as the samples exhibited different
patterns of pressure distribution at these points. Sample A is essentially the same
for the two points but is the only sample to remain so. Conversely, sample B
shows a significant increase at point four (waist) and the pressure exhibited is
double that at the previous point. In contrast, the pressure of sample C
significantly decreased by a value of around 700 from point three (chest) to four
(waist). This decline in pressure is also apparent in the measurements for samples
D and E; however, the extent of this is smaller for these other two samples. Due to
Figure 5.4 Sample B Point 1
(shoulder)
Figure 5.6 Sample D Point 1 (shoulder)
Figure 5.7 Sample E Point 1 (shoulder)
Figure 5.5 Sample C Point 1 (shoulder)
Figure 5.3 Sample A Point 1 (shoulder)
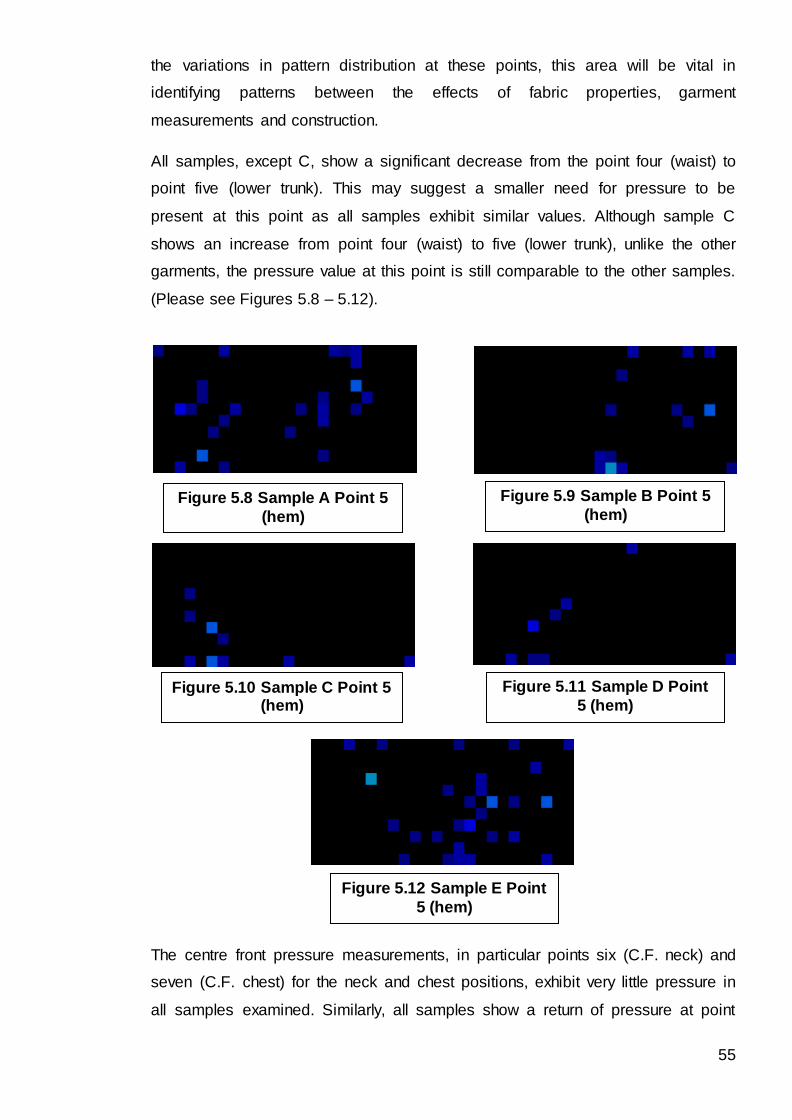
55
the variations in pattern distribution at these points, this area will be vital in
identifying patterns between the effects of fabric properties, garment
measurements and construction.
All samples, except C, show a significant decrease from the point four (waist) to
point five (lower trunk). This may suggest a smaller need for pressure to be
present at this point as all samples exhibit similar values. Although sample C
shows an increase from point four (waist) to five (lower trunk), unlike the other
garments, the pressure value at this point is still comparable to the other samples.
(Please see Figures 5.8 – 5.12).
The centre front pressure measurements, in particular points six (C.F. neck) and
seven (C.F. chest) for the neck and chest positions, exhibit very little pressure in
all samples examined. Similarly, all samples show a return of pressure at point
Figure 5.8 Sample A Point 5
(hem) Figure 5.9 Sample B Point 5
(hem)
Figure 5.10 Sample C Point 5 (hem)
Figure 5.11 Sample D Point
5 (hem)
Figure 5.12 Sample E Point
5 (hem)
56
eight (C.F. low waist). Once more, sample B shows the greatest pressure at point
eight (C.F. low waist) of all the samples, of 240-300.
5.1.1 Fabric Properties
The effect of the samples fibre composition on the distribution of pressure was
highlighted in Chapter 4.0 to be of interest. From the recorded data in the garment
database it was highlighted that samples A and B have very similar fibre
compositions, containing nylon, polyester and elastane. In addition, both had
comparable results for the stretch and recovery tests. However, there is a
noticeable variation between some of the pressure measurements collected. In
particular, points three (chest), four (waist) and eight (C.F. low waist). Although
sample B has slightly lower elastomeric fibre content than sample A (10% as
opposed to 14%) and this may reflect the variations in values, other factors such
as garment size and seams are likely to be affecting the pressure values.
Additionally, samples C and E have similar fibre compositions, with a nylon and
elastane blend, however showed big variations between points one (shoulder),
four (waist) and five (lower trunk). Although sample C has 10% less elastane than
sample E, there is no apparent pattern between the difference in elastane content
and the pressure values recorded. Neither sample was monitored as exhibiting
higher values than the other across the board. Furthermore, samples D and E
have comparable fibre compositions though sample D contains polyester opposed
to sample E which contains nylon. The biggest variations of pressure recorded on
these two samples are at points four (waist), five (lower trunk) and six (C.F. neck).
Similarity between the pressures recorded at the other points may suggest that
pattern or size have more impact on the compression rather than the fibre
composition. With reference to the fabric analysis results from the garment
database, the two fabrics, A and B, whose construction are known to be a tricot
warp knit, have some comparable values for pressure. Certain points, such as
three (chest), four (waist) and eight (C.F low waist) show some variation however,
as previously mentioned, may be influenced by garment design and shape.
Furthermore, as the knit type of the remaining three samples was undetermined
these similarities in pressure cannot be completely accounted for by the fabric
construction. No patterns of pressure with fabric thickness or area density were
recognized in this investigation.
57
5.1.2 Garment Measurements
In Chapter 4.0 it was highlighted that manual width measurements recorded, in
particular measurement points 1 – (chest), 2 – (waist) and 3 – (hem), were of
particular interest in relation to pressure values exhibited. These measurements
will specifically correlate to the pressure recorded at points: two (chest); three
(chest); four (waist); five (lower trunk); and seven (C.F. chest). From the
information gathered for the garment database, sample C was found to have the
smallest width measurements for points 1 – (chest), 2 – (waist), 3 – (hem), 5 –
(across front) and 11 – (across back). Sample E measured around the middle for
all width measurements and the largest measurements as a whole were recorded
for sample D. However, the compression values recorded using the Tekscan
equipment showed no correlation between width in size and values of pressure.
At point one (shoulder), samples C and D both have no shoulder seam, yet
sample C was measured to have much more pressure in this area. One
explanation for this may be the short length from the side neck point to the
armhole on this garment. The measurement at this position was almost half of the
same measurement on sample D. This difference may have, therefore, impacted
the pressure distributed here; especially due to the similarities of these two
garments otherwise.
All in all, no relationship between variation of garment size and pressure values
were identified in this case. Although the five samples examined did vary with
regard to garment measurements; the size of this variation may in fact be too
small to truly affect the pressure. Furthermore, it would be interesting to observe
the effect body fat and muscle would have on this relationship.
5.1.3 Seams and Construction
The five bought samples varied significantly on the positioning of seams with no
two samples the same. It was believed that these differences will help identify
patterns with pressure distribution.
Samples A and B both have similar panels over the shoulder and because of such
pressures measured at point one (shoulder) are expected to be similar for both
samples. The high pressures measured at point one (shoulder) for both A and B is

58
comparable which indicates that the panels inserted have influenced the pressures
exerted. Samples C and D both have no shoulder seam at the position measured,
however sample C was measured to have much more pressure at this point one
(shoulder). Sample E shows the smallest amount of pressure at point one
(shoulder) and is the only sample to be constructed with a ‘normal’ shoulder seam
at this position with no other panels to influence the compression thus further
indicating the influence of panel insertion on pressure.
The sudden decrease of pressure from point one (shoulder) to point two (chest),
noted previously, also shows some correlation with the panels at the shoulder.
Sample A and B, which both have shoulder panels show some pressure at point
two but only minimal values. An explanation as to why sample A exhibits the most
pressure could be that the shoulder panel of this garment comes down the body
further than that on sample B, thus extending the area of greater pressure. The
zero pressure measurement for sample C in this area may be another resulting
factor from having no shoulder panel. Similarly, sample E also has no shoulder
panel and shows no recorded pressure at point two (chest). However, if this is the
case, sample D is an anomaly as a small amount of pressure was noted at point
two (chest). On the other hand, the minimal values may be thought to be
insignificant here.
The variances in pressure at points three (chest) and four (waist) can also be
analysed with reference to seams. Sample B has some panels down the sides of
the torso, which may account for the difference at these points between A and B
that were previously exhibiting similar values around the point one (shoulder) area.
Similarly to sample A, C, D and E also have no panels at the side of the torso,
which may explain why the pressure did not increase as with sample B. However,
there is still an obvious difference between the brands studied at these points and
therefore seams alone do not appear solely accountable for this.
From point four (waist) to point five (lower trunk), although all samples exhibited a
decrease in pressure, once again, sample B shows the most significant difference
between the two points with a decrease of around 500. Again, it is thought that the
side panels in the garment may account for this.
In reference to points six (C.F. neck) and seven (C.F. chest), samples A and E
show the greatest pressures here (Figures 5.13 to 5.16 show the pressure maps
at these points). Both samples A and E have mock polo necks and therefore much

59
higher collars than the other samples. This may have added more pressure to
these areas compared to garments with a lower neck line.
Overall, the insertion of panels in the garments studied appears to result in a clear
effect on pressure. The inclusion of panels not only seems to be for aesthetics but
also to increase pressure at areas on the body. The variations in pressure are
much more apparent when studying garments with more seams and panels as
opposed to sample E which is a more basic style.
5.2 Summary
From the analysis of the database information and the pressure values recorded at
eight points on the five randomly chosen samples difference between brands have
been highlighted.
No clear pattern between percentage of elastomeric fibres in the fabrics and the
values of pressure recorded was determined. Although some variations in
pressure were found between sample D containing polyester and sample E
containing nylon it has not yet been determined whether this alone has caused this
difference.
Figure 5.14 Sample E Point 6 (C.F neck)
Figure 5.13 Sample A Point 6 (C.F neck)
Figure 5.15 Sample A Point 7
(C.F chest)
Figure 5.16 Sample E Point 7 (C.F chest)
60
Whilst garment measurements did not appear to affect the pressure values in this
case, it is thought that body muscle and fat of a wearer would alter these results.
Sawada (1993) highlighted that bony prominences and body fat do increase
compression by using sponges and plastic plates to simulate them. Although the
testing in this case did not simulate body fat or bony prominences, the
investigation by Sawada et al (1993) would suggest that the build of the wearer
would certainly effect the compression exhibited. Further investigation in to this
would be useful to help understand the true relationship between measurements
and pressure values. Furthermore, future research to evaluate the effect of
differences in grading on pressure distribution would help to analyse the influence
of garment measurements on compression.
It was clear that the positioning of seams in the garments have clearly affected the
distribution of pressure. Many of the sudden increases and decreases in pressure
in the garments are situated around seams, thus highlighting the influence of them
to pressure. Some of the most clear increases and decreases in compression
between measurement points were recorded for samples A and B, both of which
have many seams, compared to the other samples.
The spread of data, which has been highlighted as the relaxation of the garment,
is apparent from the compression measurement. Although this relaxation has been
noted to be beneficial in understanding the pressure exhibited in compression
garments it is questionable about how such issues effect the testing of
compression garments. In order to achieve truly fully reproducible values through
pressure testing a ‘stable’ position needs to be captured. However, such a stable
position also still needs to capture the true pressure exhibited in garments. An
effective way of testing which considers fluctuation of results yet is able to take a
stable reading is needed for the industry.
The next chapter, 6.0 Simulation Model, discusses the testing of the hypothesis
that experimental work regarding compression measurement can be simulated
using a CAD model. Test results from the FAST system will also be analysed.

61
6.0 Simulation Model
The empirical work on compression analysis using Tekscan highlighted the
pressure values at eight different points (shoulder, chest at two positions, waist,
lower trunk, centre front (C.F) neck, C.F chest, C.F low waist). The garment
measurements did not affect the pressure values for the samples explored;
however the positioning of seams clearly affected the distribution of pressure
(frequent variations). A CAD simulation model was explored to evaluate whether a
virtual system can be used to re-create the compression measurements obtained
using Tekscan. This chapter presents the simulation model. The model was
created using the V-Stitcher software, by Browzwear, and FAST data was used to
represent fabric properties. If the simulation model is successful, then there is
potential for it to be used as a tool in the product development process of
compression garments. It will facilitate understanding of the effect of fabric,
garment measurements and construction on compression without the expense
and time of creating the garments. Furthermore, a simulation model could be used
as a research tool for consumers so that they may make more informed choices
before purchase.
6.1 Fabric Assurance by Simple Testing (FAST) Results
Table 6.1 FAST Results
A B C D E
Weight (g) 2.13 2.50 2.23 1.74 2.37 Thickness at 2 g (mm) 1.11 0.88 1.17 0.60 0.63 Thickness at 100 g (mm) 0.84 0.74 0.86 0.49 0.59
Surface Thickness (mm) 0.26 0.14 0.30 0.11 0.04 Bending Rigidity Wale (µNm)
5.33 7.22 8.41 3.07 2.44
Bending Rigidity Course (µNm)
6.82 8.00 6.67 3.07 3.85
Formability Wale (mm2) 3.66 5.75 9.56 2.40 2.14 Formability Course (mm2) 7.44 4.43 7.15 1.65 2.30 Extension Wale % >20.3 >20.3 >20,3 >20.3 >20.3 Extension Course % >20.3 >20.3 >20.3 >20.3 >20.3 Shear Rigidity N/m 40.33 67.10 91.11 18.59 62.02
Testing of the fabric properties of the five different samples was conducted using
FAST to enable simulation of the fabrics in the virtual system. Results for all five

62
fabrics are in the Table 6.1. The results from the tests will enable a further
understanding of the fabric properties. Although not all of the samples were
simulated in the CAD model all fabrics were tested using FAST to further
contribute to the analysis of the garments. From the data generated from the
FAST tests a series of calculations have been completed to obtain each fabric’s
performance. Results such as formability and bending rigidity were not measured
directly by the system but have been calculated using the relevant equations. For
the full set of original data and calculations for samples A to E refer to Appendix F.
Further to this, FAST control charts have been created for each of the five fabrics
using these results, which are in Appendix G. FAST charts give the finger print of
the fabrics and highlight the potential problem areas during garment manufacturing
should the plots fall into shaded areas of the chart. Falling beyond these limits
highlight possible problems with production issues such as seam pucker,
difficulties whilst cutting, sleeve insertion and laying up. Although it would be
desirable for the fabrics tested to fall within these predetermined limits, it must be
remembered that the system was created for worsted suiting fabrics. Therefore,
the shaded limits on the control charts may not be entirely suitable for determining
the handle and performance during manufacture of the warp knitted fabrics tested
in this case. However, in this case the FAST data was used primarily to input the
fabric behaviour/performance in the CAD simulation software.
As shown in Table 6.1, all results of extension at 100 g for wale and course
directions for the five fabrics were found to be >20.3%. However, this is
constrained by the limit to which the FAST extension apparatus can measure and
therefore not a true representation of the fabrics extension. The stretch and
recovery tests completed for the garment database (Chapter 4.0) highlight each
fabric’s ability to extend. Shear rigidity is unaffected by the limit of the FAST
extension apparatus as the result is calculated from the bias extension results,
which are only tested at 5 g.
The FAST 4 test, which determines dimensional stability and hygral expansion,
has not been completed on this occasion as it is not required to simulate the
garments on the virtual system. In addition, there was a limited amount of fabric
available for testing and as such the template for the FAST 4 test was too large to
include.
Although the results from FAST identify CSIRO’s concerns for each fabric during
garment production and for the fabrics hand, it must be noted that all fabrics tested
63
are part of ready-made garments. This means that any production problems
encountered must have been overcome during make-up.
6.1.1 Compression
The values for thickness as discussed in the garment database are comparable to
the FAST results for thickness at 100 g and therefore do not highlight any
significant points.
From the results of thickness at 2 g and 100 g surface thickness was calculated.
The surface thickness is concerned with the stability of the fabric and higher
values for surface thickness equate to a greater stability. Looking at the surface
thickness results it can be seen that sample C was found to have the highest value
and sample E the lowest.
The released surface thickness was not measured at this time as it was not
required for the simulation of fabrics.
6.1.2 Bending Rigidity
Bending rigidity relates to the stiffness of a fabric and the ability of fabric to drape
(freely fall or hang over a three-dimensional form). A high value for bending rigidity
signifies that a fabric is stiff, while a low value indicates a fabric is very pliable.
CSIRO claim a low value, below the pre-determined limits of the FAST chart, may
suggest problems during garment construction whilst cutting. It is also believed
that bending rigidity, as it is concerned with drape, will highlight how well a fabric
will conform to the body. In this circumstance the ability of a fabric to conform to
the body is vital for compression and therefore bending rigidity values within the
pre-set limits would be beneficial. Nonetheless, all the samples tested at this time
have high elastomeric values and as such their conformity to the body is almost
certain.
Sample D exhibits very low bending rigidity values with both wale and course
direction at 3.07 µNm which CSIRO claim to highlight problems during
manufacture (please see Table 6.1) due to being very pliable. Conversely, sample
B was found to have the highest bending rigidity values with 8.00 µNm in the
64
course direction and 7.22 µNm in the wale direction. Nonetheless, these values
are both within the predetermined limits. The bending rigidity value for sample E
was found to be only 2.44 µNm in the wale direction which is the lowest of all
samples. This could highlight possible problems during manufacture for garments
made with fabric E due to the suppleness of the fabric.
Both sample B and C displayed similar results for bending rigidity and are both
within the FAST limits as on the control chart. Although lower than the values for
sample B and C, the results of bending rigidity for sample A are also within the
limits. All three samples are therefore predicted to conform to the body sufficiently.
The low bending rigidity value for sample E in the wale direction could also
suggest problems with drape. However, as the course value for the same sample
is within the limits set by FAST, and the garment has a high degree of elasticity no
problems with conforming to the body are expected.
6.1.3 Extensibility
The extension values noted in Table 6.1 are those tested at 100 g. As it can be
seen, all samples displayed extensibility values of >20.3% in both the wale and
course directions which exceeds the limit the FAST extension apparatus can
measure. The restriction of the FAST apparatus to measure the true value of
extension is a limitation to the use of FAST results in a virtual system. However, it
continues to be used within industry in various CAD simulation packages.
As the extension values at 100 g are therefore not a true representation of each
fabric’s stretch, the values for extension at 5 g and 20 g are also to be analysed.
Although this data is not directly used to create the FAST control charts these
values have been highlighted to further assess the differences noted between
fabrics. These values were both obtained during testing and the averages for each
sample are noted in Table 6.2.
The recorded averages for extension at 5 g and 20 g are also of importance as
they are required for the simulation of the fabrics in V-Stitcher. The values for
extension at 5 g for sample B (0.9 and 0.8) and sample C (0.6 and 0.8) are
comparable. However, sample C exhibited much more stretch at 20 g (17.3 and
16.5) than sample B (12.6 and 8.9). Samples A exhibited some similar results for
extension as sample C at 20 g however show much greater extension at 5 g.
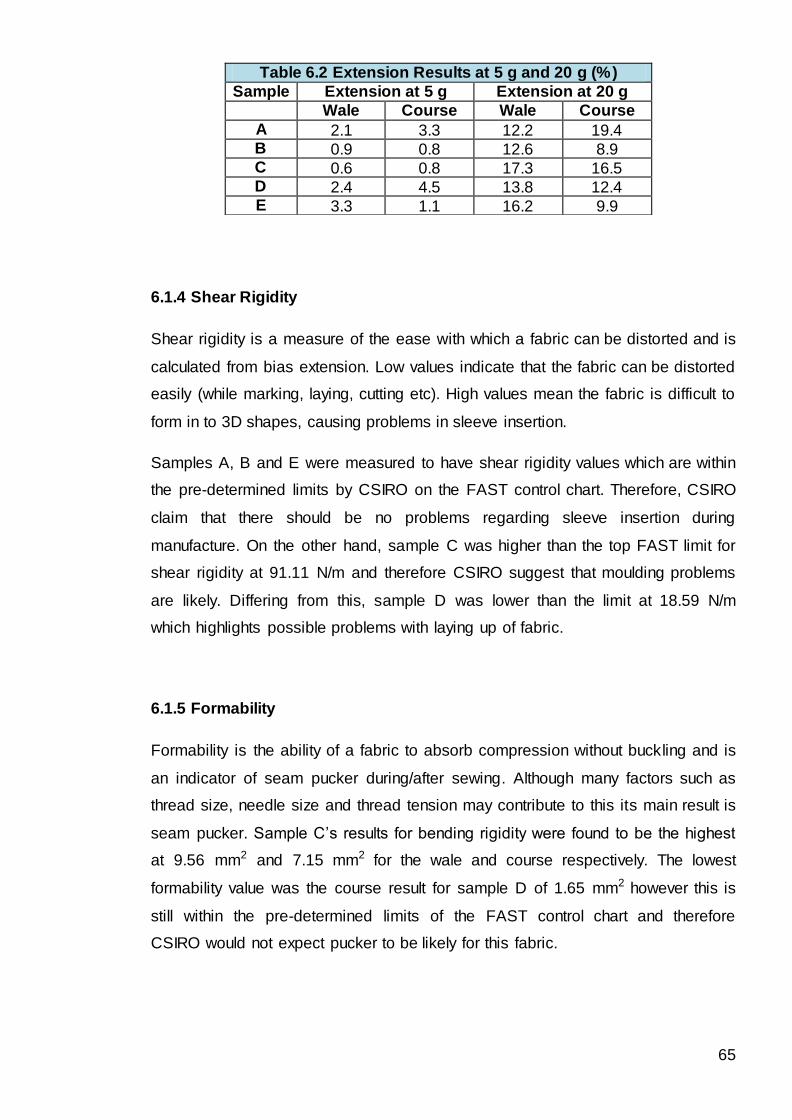
65
6.1.4 Shear Rigidity
Shear rigidity is a measure of the ease with which a fabric can be distorted and is
calculated from bias extension. Low values indicate that the fabric can be distorted
easily (while marking, laying, cutting etc). High values mean the fabric is difficult to
form in to 3D shapes, causing problems in sleeve insertion.
Samples A, B and E were measured to have shear rigidity values which are within
the pre-determined limits by CSIRO on the FAST control chart. Therefore, CSIRO
claim that there should be no problems regarding sleeve insertion during
manufacture. On the other hand, sample C was higher than the top FAST limit for
shear rigidity at 91.11 N/m and therefore CSIRO suggest that moulding problems
are likely. Differing from this, sample D was lower than the limit at 18.59 N/m
which highlights possible problems with laying up of fabric.
6.1.5 Formability
Formability is the ability of a fabric to absorb compression without buckling and is
an indicator of seam pucker during/after sewing. Although many factors such as
thread size, needle size and thread tension may contribute to this its main result is
seam pucker. Sample C’s results for bending rigidity were found to be the highest
at 9.56 mm2 and 7.15 mm2 for the wale and course respectively. The lowest
formability value was the course result for sample D of 1.65 mm2 however this is
still within the pre-determined limits of the FAST control chart and therefore
CSIRO would not expect pucker to be likely for this fabric.
Table 6.2 Extension Results at 5 g and 20 g (%)
Sample Extension at 5 g Extension at 20 g
Wale Course Wale Course
A 2.1 3.3 12.2 19.4 B 0.9 0.8 12.6 8.9 C 0.6 0.8 17.3 16.5 D 2.4 4.5 13.8 12.4 E 3.3 1.1 16.2 9.9

66
Once FAST testing was completed, the simulation of the empirical work could then
take place. The following section 6.2 highlights the procedure to create the model
and explains in more detail how the FAST data was used within the CAD system.
6.2 3D Simulation Model
Test fabrics on FAST
Deconstruct samples to
recreate patterns
Digitise paper patterns
Include seam allowance on
patterns
Create pattern model
Open model in V-Stitcher
Assign clusters to patterns
pieces
Assign which seams to stitch
together
Assign fabric to pattern
Modify fabric to include FAST
data
Create male avatar
Simulate and dress with
pattern
Apply pressure map
Convert raw data
Compare to experimental
results
Figure 6.1 Process Flow Diagram for the Simulation Model
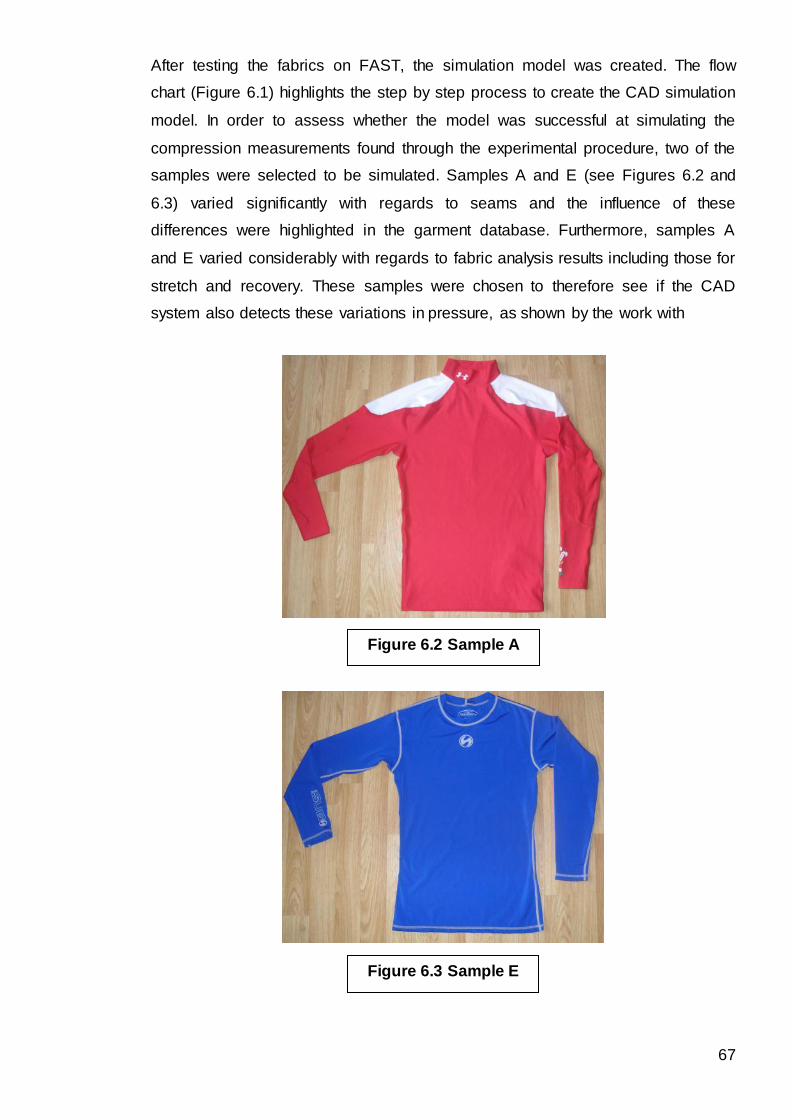
67
After testing the fabrics on FAST, the simulation model was created. The flow
chart (Figure 6.1) highlights the step by step process to create the CAD simulation
model. In order to assess whether the model was successful at simulating the
compression measurements found through the experimental procedure, two of the
samples were selected to be simulated. Samples A and E (see Figures 6.2 and
6.3) varied significantly with regards to seams and the influence of these
differences were highlighted in the garment database. Furthermore, samples A
and E varied considerably with regards to fabric analysis results including those for
stretch and recovery. These samples were chosen to therefore see if the CAD
system also detects these variations in pressure, as shown by the work with
Figure 6.2 Sample A
Figure 6.3 Sample E
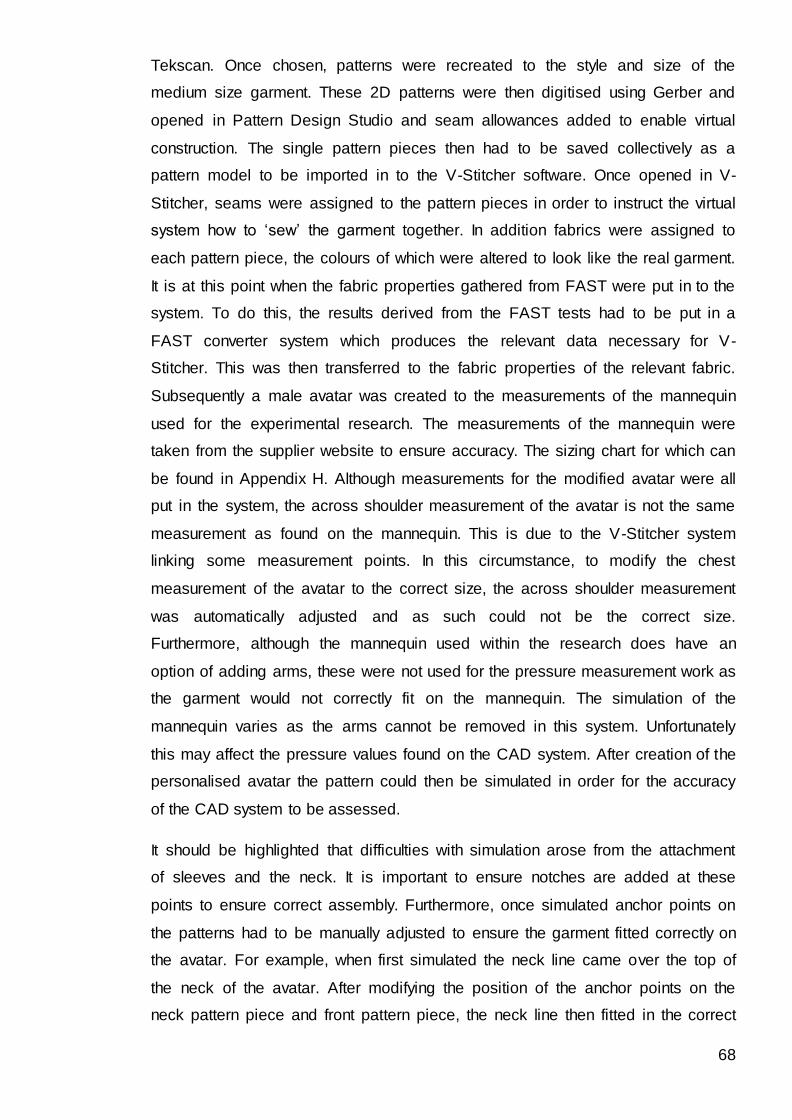
68
Tekscan. Once chosen, patterns were recreated to the style and size of the
medium size garment. These 2D patterns were then digitised using Gerber and
opened in Pattern Design Studio and seam allowances added to enable virtual
construction. The single pattern pieces then had to be saved collectively as a
pattern model to be imported in to the V-Stitcher software. Once opened in V-
Stitcher, seams were assigned to the pattern pieces in order to instruct the virtual
system how to ‘sew’ the garment together. In addition fabrics were assigned to
each pattern piece, the colours of which were altered to look like the real garment.
It is at this point when the fabric properties gathered from FAST were put in to the
system. To do this, the results derived from the FAST tests had to be put in a
FAST converter system which produces the relevant data necessary for V-
Stitcher. This was then transferred to the fabric properties of the relevant fabric.
Subsequently a male avatar was created to the measurements of the mannequin
used for the experimental research. The measurements of the mannequin were
taken from the supplier website to ensure accuracy. The sizing chart for which can
be found in Appendix H. Although measurements for the modified avatar were all
put in the system, the across shoulder measurement of the avatar is not the same
measurement as found on the mannequin. This is due to the V-Stitcher system
linking some measurement points. In this circumstance, to modify the chest
measurement of the avatar to the correct size, the across shoulder measurement
was automatically adjusted and as such could not be the correct size.
Furthermore, although the mannequin used within the research does have an
option of adding arms, these were not used for the pressure measurement work as
the garment would not correctly fit on the mannequin. The simulation of the
mannequin varies as the arms cannot be removed in this system. Unfortunately
this may affect the pressure values found on the CAD system. After creation of the
personalised avatar the pattern could then be simulated in order for the accuracy
of the CAD system to be assessed.
It should be highlighted that difficulties with simulation arose from the attachment
of sleeves and the neck. It is important to ensure notches are added at these
points to ensure correct assembly. Furthermore, once simulated anchor points on
the patterns had to be manually adjusted to ensure the garment fitted correctly on
the avatar. For example, when first simulated the neck line came over the top of
the neck of the avatar. After modifying the position of the anchor points on the
neck pattern piece and front pattern piece, the neck line then fitted in the correct
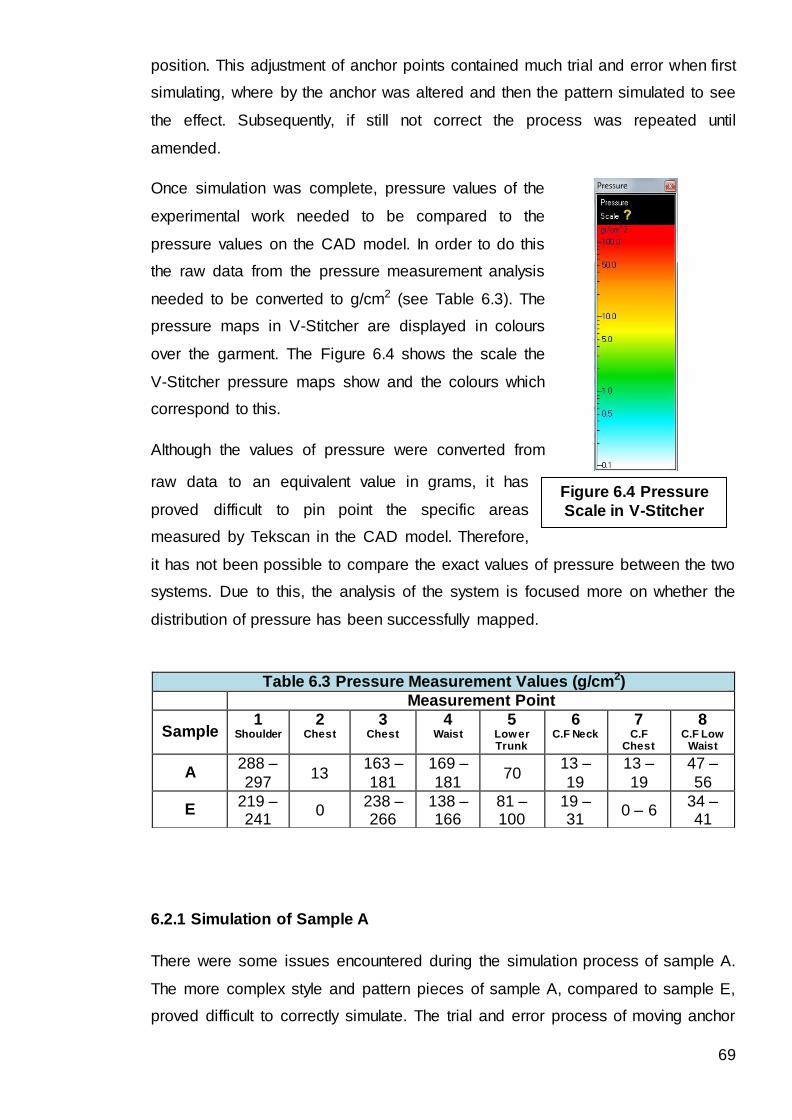
69
position. This adjustment of anchor points contained much trial and error when first
simulating, where by the anchor was altered and then the pattern simulated to see
the effect. Subsequently, if still not correct the process was repeated until
amended.
Once simulation was complete, pressure values of the
experimental work needed to be compared to the
pressure values on the CAD model. In order to do this
the raw data from the pressure measurement analysis
needed to be converted to g/cm2 (see Table 6.3). The
pressure maps in V-Stitcher are displayed in colours
over the garment. The Figure 6.4 shows the scale the
V-Stitcher pressure maps show and the colours which
correspond to this.
Although the values of pressure were converted from
raw data to an equivalent value in grams, it has
proved difficult to pin point the specific areas
measured by Tekscan in the CAD model. Therefore,
it has not been possible to compare the exact values of pressure between the two
systems. Due to this, the analysis of the system is focused more on whether the
distribution of pressure has been successfully mapped.
6.2.1 Simulation of Sample A
There were some issues encountered during the simulation process of sample A.
The more complex style and pattern pieces of sample A, compared to sample E,
proved difficult to correctly simulate. The trial and error process of moving anchor
Table 6.3 Pressure Measurement Values (g/cm2)
Measurement Point
Sample 1
Shoulder
2 Chest
3 Chest
4 Waist
5 Lower Trunk
6 C.F Neck
7 C.F
Chest
8 C.F Low
Waist
A 288 –
297 13
163 –
181
169 –
181 70
13 –
19
13 –
19
47 –
56
E 219 – 241
0 238 – 266
138 – 166
81 – 100
19 – 31
0 – 6 34 – 41
Figure 6.4 Pressure
Scale in V-Stitcher
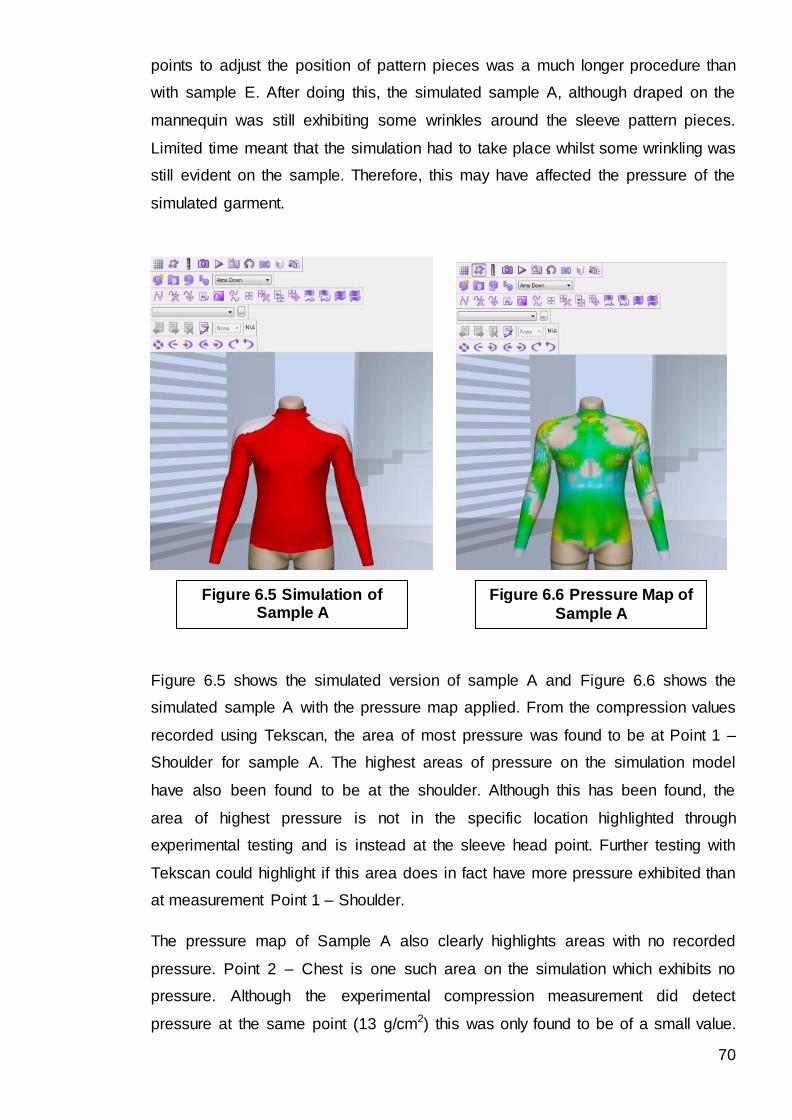
70
points to adjust the position of pattern pieces was a much longer procedure than
with sample E. After doing this, the simulated sample A, although draped on the
mannequin was still exhibiting some wrinkles around the sleeve pattern pieces.
Limited time meant that the simulation had to take place whilst some wrinkling was
still evident on the sample. Therefore, this may have affected the pressure of the
simulated garment.
Figure 6.5 shows the simulated version of sample A and Figure 6.6 shows the
simulated sample A with the pressure map applied. From the compression values
recorded using Tekscan, the area of most pressure was found to be at Point 1 –
Shoulder for sample A. The highest areas of pressure on the simulation model
have also been found to be at the shoulder. Although this has been found, the
area of highest pressure is not in the specific location highlighted through
experimental testing and is instead at the sleeve head point. Further testing with
Tekscan could highlight if this area does in fact have more pressure exhibited than
at measurement Point 1 – Shoulder.
The pressure map of Sample A also clearly highlights areas with no recorded
pressure. Point 2 – Chest is one such area on the simulation which exhibits no
pressure. Although the experimental compression measurement did detect
pressure at the same point (13 g/cm2) this was only found to be of a small value.
Figure 6.5 Simulation of Sample A
Figure 6.6 Pressure Map of
Sample A
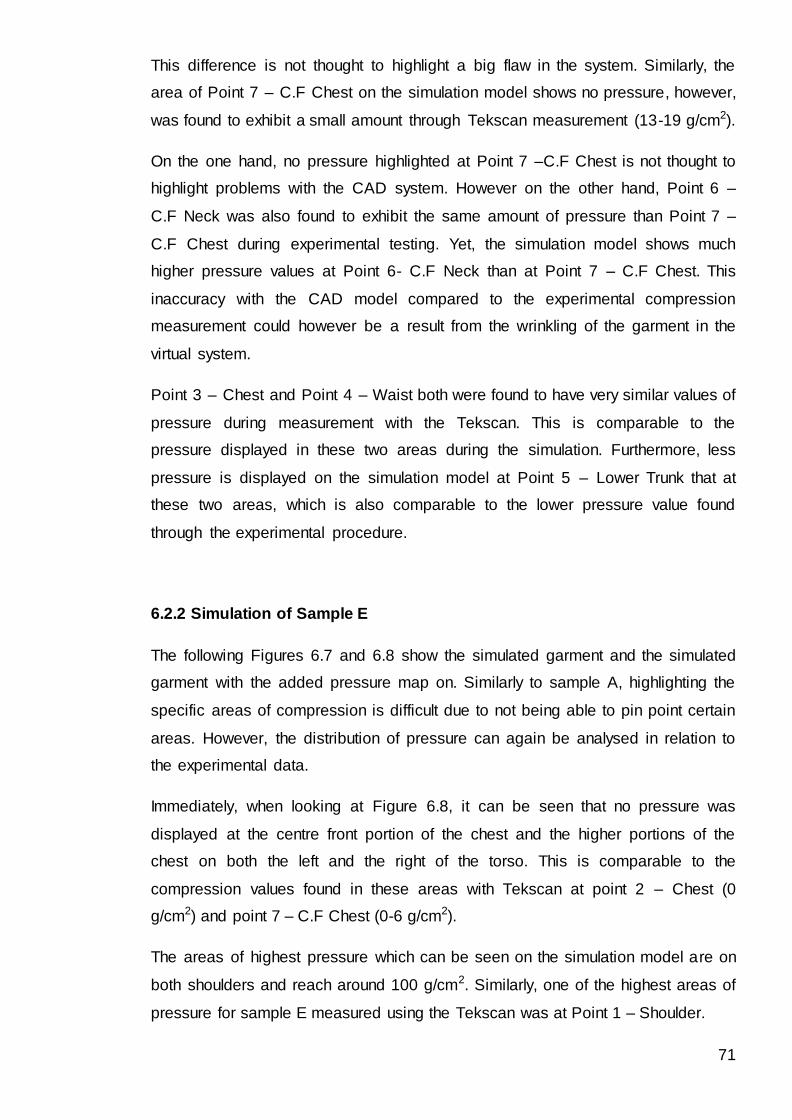
71
This difference is not thought to highlight a big flaw in the system. Similarly, the
area of Point 7 – C.F Chest on the simulation model shows no pressure, however,
was found to exhibit a small amount through Tekscan measurement (13-19 g/cm2).
On the one hand, no pressure highlighted at Point 7 –C.F Chest is not thought to
highlight problems with the CAD system. However on the other hand, Point 6 –
C.F Neck was also found to exhibit the same amount of pressure than Point 7 –
C.F Chest during experimental testing. Yet, the simulation model shows much
higher pressure values at Point 6- C.F Neck than at Point 7 – C.F Chest. This
inaccuracy with the CAD model compared to the experimental compression
measurement could however be a result from the wrinkling of the garment in the
virtual system.
Point 3 – Chest and Point 4 – Waist both were found to have very similar values of
pressure during measurement with the Tekscan. This is comparable to the
pressure displayed in these two areas during the simulation. Furthermore, less
pressure is displayed on the simulation model at Point 5 – Lower Trunk that at
these two areas, which is also comparable to the lower pressure value found
through the experimental procedure.
6.2.2 Simulation of Sample E
The following Figures 6.7 and 6.8 show the simulated garment and the simulated
garment with the added pressure map on. Similarly to sample A, highlighting the
specific areas of compression is difficult due to not being able to pin point certain
areas. However, the distribution of pressure can again be analysed in relation to
the experimental data.
Immediately, when looking at Figure 6.8, it can be seen that no pressure was
displayed at the centre front portion of the chest and the higher portions of the
chest on both the left and the right of the torso. This is comparable to the
compression values found in these areas with Tekscan at point 2 – Chest (0
g/cm2) and point 7 – C.F Chest (0-6 g/cm2).
The areas of highest pressure which can be seen on the simulation model are on
both shoulders and reach around 100 g/cm2. Similarly, one of the highest areas of
pressure for sample E measured using the Tekscan was at Point 1 – Shoulder.
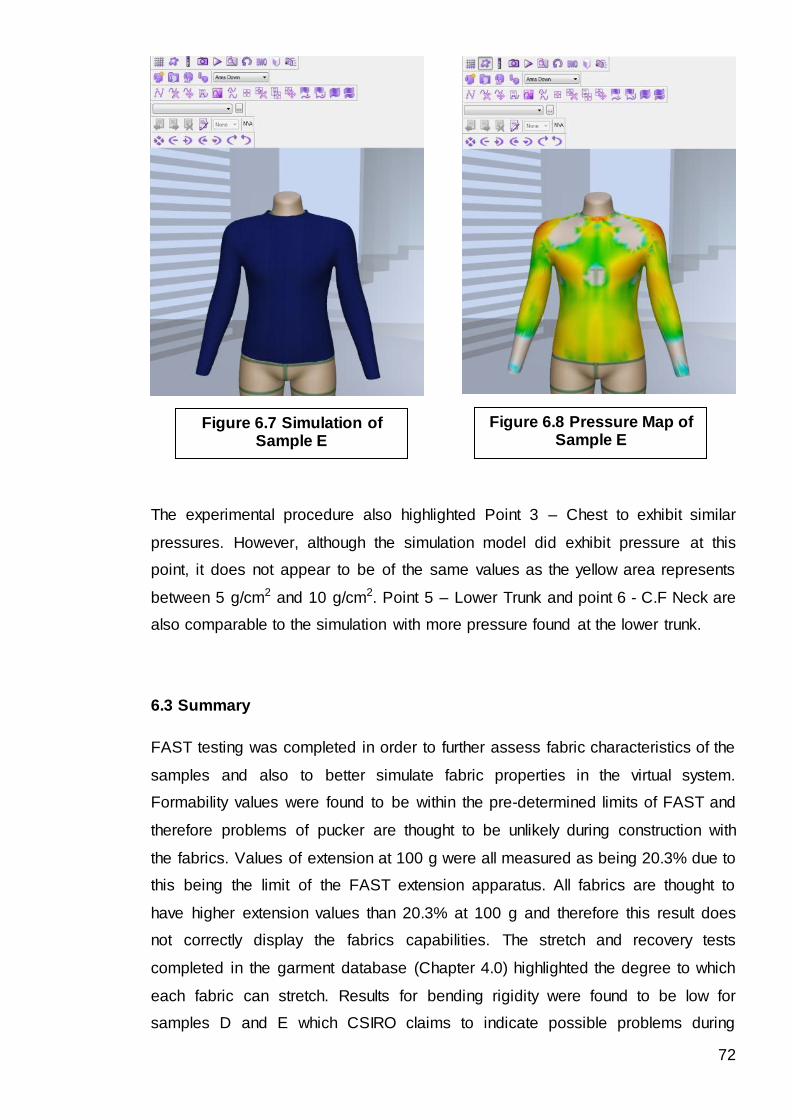
72
The experimental procedure also highlighted Point 3 – Chest to exhibit similar
pressures. However, although the simulation model did exhibit pressure at this
point, it does not appear to be of the same values as the yellow area represents
between 5 g/cm2 and 10 g/cm2. Point 5 – Lower Trunk and point 6 - C.F Neck are
also comparable to the simulation with more pressure found at the lower trunk.
6.3 Summary
FAST testing was completed in order to further assess fabric characteristics of the
samples and also to better simulate fabric properties in the virtual system.
Formability values were found to be within the pre-determined limits of FAST and
therefore problems of pucker are thought to be unlikely during construction with
the fabrics. Values of extension at 100 g were all measured as being 20.3% due to
this being the limit of the FAST extension apparatus. All fabrics are thought to
have higher extension values than 20.3% at 100 g and therefore this result does
not correctly display the fabrics capabilities. The stretch and recovery tests
completed in the garment database (Chapter 4.0) highlighted the degree to which
each fabric can stretch. Results for bending rigidity were found to be low for
samples D and E which CSIRO claims to indicate possible problems during
Figure 6.7 Simulation of Sample E
Figure 6.8 Pressure Map of Sample E
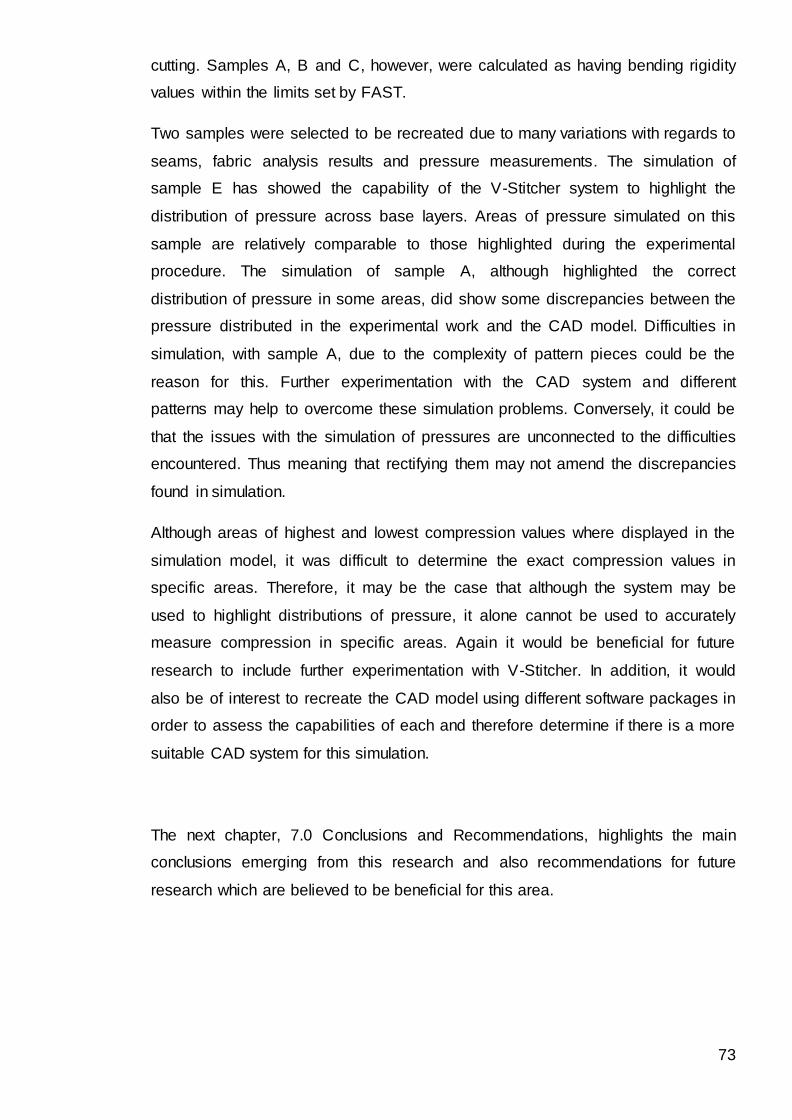
73
cutting. Samples A, B and C, however, were calculated as having bending rigidity
values within the limits set by FAST.
Two samples were selected to be recreated due to many variations with regards to
seams, fabric analysis results and pressure measurements. The simulation of
sample E has showed the capability of the V-Stitcher system to highlight the
distribution of pressure across base layers. Areas of pressure simulated on this
sample are relatively comparable to those highlighted during the experimental
procedure. The simulation of sample A, although highlighted the correct
distribution of pressure in some areas, did show some discrepancies between the
pressure distributed in the experimental work and the CAD model. Difficulties in
simulation, with sample A, due to the complexity of pattern pieces could be the
reason for this. Further experimentation with the CAD system and different
patterns may help to overcome these simulation problems. Conversely, it could be
that the issues with the simulation of pressures are unconnected to the difficulties
encountered. Thus meaning that rectifying them may not amend the discrepancies
found in simulation.
Although areas of highest and lowest compression values where displayed in the
simulation model, it was difficult to determine the exact compression values in
specific areas. Therefore, it may be the case that although the system may be
used to highlight distributions of pressure, it alone cannot be used to accurately
measure compression in specific areas. Again it would be beneficial for future
research to include further experimentation with V-Stitcher. In addition, it would
also be of interest to recreate the CAD model using different software packages in
order to assess the capabilities of each and therefore determine if there is a more
suitable CAD system for this simulation.
The next chapter, 7.0 Conclusions and Recommendations, highlights the main
conclusions emerging from this research and also recommendations for future
research which are believed to be beneficial for this area.
74
7.0 Conclusions and Recommendations
This chapter highlights the conclusions that emerged through the research
process, with reference to the aims highlighted in Chapter 1.0. Recommendations
for further research in the field, which have materialised whilst completing the
research, are also discussed.
7.1 Conclusions
To recognise the use of compression sportswear and its increased availability in
the market a literature review was completed (Chapter 2.0). The analytical
approach to the literature review first began with understanding the use of
compression therapy in medicine (section 2.1). The use of compression garments
in professional sports was then investigated and found to be a catalyst for an
increased demand for such garments in the ready to wear market (section 2.2).
Although much research has been completed, and continues to be undertaken,
with regards to how beneficial compression is to the wearer, there is still
disagreement about its effectiveness (section 2.3). It was also noted that very little
research has been conducted with reference to ready to wear compression
garments and the differences between brands. This justifying the need for
research in the area of ready to wear garments. Pressure measurement systems
were also studied, which were found to vary significantly, however thin, flexible
sensors were noted as being preferable (section 2.5). The research also focused
on the problems encountered with sizing for mass market (section 2.6) and
considered the growing tendency for CAD systems to be used as a product
development tool (section 2.7).
In addition, long sleeved compression base layer products available to the mass
market were analysed in order to achieve aim one (Chapter 4.0). Five different
brands were selected for analysis through cluster sampling. The creation of a
garment database which examined the variations in materials, garment
dimensions and construction between the brands was then completed. All samples
were noted as having high elastane content, although some exhibited poor
recovery rates after stretch. Results also emphasised a significant variation in the
positioning of seams with no two samples looking the same in this respect.
75
Variations in measurements between the same specified sizes also raised
concern, particularly with reference to three samples purchased from the same
retailer. Sizing charts from the retailers which are to help consumers to buy the
appropriate size garment were also very sparse with only a few basic
measurements. It is thought that more detailed sizing charts, tailored for each
specific brand, would aid consumers whilst purchasing such garments to ensure
correct fit.
After completion of the garment database, the compression exerted by the
medium sized upper base layer garments was measured using the High Speed I-
Scan system by Tekscan to accomplish aim two (Chapter 5.0). The Tekscan
system was selected due to its thin flexible sensors which were outlined in the
literature review as being beneficial for pressure measurement. On a male
mannequin, the pressure was recorded at eight areas around the body to provide
an insight in to the pressure values exhibited and the distribution of pressure. The
readings from this experimental work were then analysed with particular reference
to the influence of material properties, garment measurements and construction.
Patterns were recognised between dramatic compression gradients and proximity
to seams. This highlighted the importance of the positioning of panels for
influencing compression values and distribution. Garment measurements,
although varied between the brands, did not appear to effect the pressure values.
However, it is believed that these measurements coupled with variations in body
muscle and fat of individuals would affect the overall compression exerted by the
garment. The temporal drift of measurements detected by the Tekscan system
was also of interest during testing and highlighted the natural relaxation of the
garment when worn whilst motionless.
Finally, the hypothesis that a CAD model could map the experimental work with
compression on a virtual system was tested to realise aim three (Chapter 6.0).
Two of the five samples were selected to be simulated within the V-Stitcher
system. Limitations with the CAD software were encountered when the across
shoulder measurement of the avatar was linked to the chest measurement and as
a result the shoulder width could not be exactly amended to the size of the male
mannequin. Furthermore, the simulated mannequin had arms, whereas the
mannequin’s arms could not be used during the experimental procedure in the
laboratory. Nonetheless, the simulation of sample E highlighted the models
capability to map the distribution of pressure found through compression

76
measurement with Tekscan. Although simulation of sample A proved more
difficult, due to an increased complexity in component patterns, the distribution of
pressure in the virtual system was still largely comparable to that in the
experimental work. More specific pressure values were found to be difficult to pin
point in the virtual system and as a result the CAD model needs further
development to precisely identify pressures at key areas on the body.
Overall, compression sportswear continues to be demanded by everyday
consumers and its increased availability for the mass market is apparent. Since
reported research has been inconclusive, further work is needed to determine the
effectiveness of such garments in use. A greater understanding of ready to wear
base layers is required to aid consumers during purchase. The five brands
analysed in the research have highlighted many variations between seemingly
similar products. Compression measurement with the Tekscan further emphasised
differences and the effects of them on pressure values and distribution. With
further development, the use of a simulation model could be used to not only
facilitate the product design and development for manufacturers but also to allow
consumers to have a greater understanding of the compression garments they are
purchasing.
7.2 Recommendations
During the process of completing this research, further research in some areas
has been mentioned. The following recommendations for future academic
research have been suggested:
Firstly, measuring pressures around a cylinder may further quantify the pressures
determined by the Tekscan system. Laplace’s Law could be utilised to do so and
therefore further justify the use of Tekscan to measure compression exerted by
compression sportswear.
Secondly, as the exploration of small and large sizes was only a small portion of
this research it is suggested that further research is conducted to explore grading
issues of ready to wear compression base layers. The effect of any grading
differences on compression values and distribution would also be beneficial using
the Tekscan, thus building on the garment database created in the current
research.

77
Thirdly, to expand this research to involve ready to wear compression base layers
for women would help to highlight the effect of body fat on pressure values and
distribution. A similar garment database could be used to highlight variations
between brands. Measurement of the compression values and distribution of
samples would also distinguish difference between compression base layers for
males and females.
An investigation in to how effective other CAD systems could be at simulating the
compression measurement work would be advantageous to determine if the V-
Stitcher software is the most appropriate for this work due to the limitations faced.
Simulating the same pattern in a number of systems and comparing to
experimental pressure data would highlight the effectiveness.
Finally, to develop the research so that, after participants body measurements are
determined through a 3D body scanner, individuals could then be simulated in the
CAD system. This could help to further understand the effect of body shape and
size on compression. If such a model is proven successful this research tool could
be used by consumers as a way of determining the pressure of ready to wear
samples before purchase.
78
References
2XU Pty Ltd (2009) Compression 2XU: Benefits, [online] http://www.2xushop.co.uk
/compression/benefits.html [Accessed 7th February 2012].
Ali, A. Creasy, R.H. and Edge, J.A. (2010) ‘Physiological effects of wearing
graduated compression stockings during running’, European Journal of Applied
Physiology, Vol. 109, Issue 6, pp1017-1025.
Ali, A. Creasy, R.H. and Edge, J.A. (2011) ‘The effect of graduated compression
stockings on running performance’, Journal of Strength and Conditioning
Research, Vol. 25, Issue 5, pp1385-1392.
Alvanon (2009) Alvaform: Innovative Body Forms Utilizing Tailored Specifications,
[online], http://www.alvanon.com/M03_S04.html [Accessed 23rd November 2011].
Amazon.com (2011) SUB DUAL Sports Compression Fit Baselayer Top Long
Sleeve, [online], http://www.amazon.co.uk/DUAL-Sports-Compression-Baselayer-
Sleeve/dp/B00426A0CG/ref=sr_1_sc_6?ie=UTF8&qid=1340043609&sr=8-6-spell
[Accessed 12th September 2011]
BMI Calculator (Date Unknown) BMI Calculator: Body Fat Chart, [online] http://ww
w.bmi-calculator.net/body-fat-calculator/body-fat-chart.php [Accessed 1st June
2012].
Bondy, F. (2000) Garb Doesn’t Suit Olympic Athletes Well, [online] http://articles.n
ydailynews.com/2000-07-21/sports/18158625_1_swift-suit-snatchersfull-body-suit
[Accessed 20th April 2012].
Branson, D.H. and Nam, J. (2007) ‘Materials and Sizing’ in Ashdown, S.P. (ed)
Sizing in Clothing: Developing effective sizing systems for ready-to-wear clothing,
Cambridge, Woodhead Publishing.
Browzwear (2012) V-Stitcher, [online] http://browzwear.com/products/v-stitcher/
[Accessed 19th October 2011].
Bryman, A. (2012) Social Research Methods, (Fourth Edition), Oxford, Oxford
University Press.
79
BS 139 (2005) Textiles: Standard atmospheres for conditioning and testing, BS
EN ISO 139, [online], https://bsol.bsigroup.com/en/Bsol-Item-Detail-Page/?pid=00
0000000030095012 [Accessed 10th January 2012].
BS 4294 (1968) Methods of test for the stretch and recovery properties of fabrics,
BS 4294, [online], https://bsol.bsigroup.com/en/Bsol-Item-Detail-Page/?pid=00000
0000010082641 [Accessed 10th January 2012].
Carr, H. and Latham, B. (2008) Carr and Latham’s Technology of Clothing
Manufacture, revised by Tyler, D. (Fourth Edition), Oxford, Blackwell Publishing.
Chatard, J-C. Atlaoui, D. Farjanel, J. Louisy, F. Rastel, D. and Guézennec, C-Y.
(2004) ‘Elastic stockings, performance and leg pain recovery in 63-year-old
sportsmen’, European Journal of Applied Physiology, Vol. 93, Issue 3, pp347-352.
Choi, K-J. and Ko, H-S. (2005) ‘Research problems in clothing simulation’,
Computer-Aided Design, Vol. 37, Issue 6, pp.585-592.
Cole, M.D. (2008) ‘Compression Apparel Brand Winning at the “Skins” Game’,
Apparel Magazine, Vol.50, Issue 3, pp58-62.
Cooklin, G. (2006) Introduction to Clothing Manufacture, revised by Hayes, S. and
McLoughlin, J. (Second Edition), Oxford, Blackwell Publishing.
Cortad, R. (2011) Quiksilver’s New Boardshorts Combine Compression and
Taping Technologies, [online] http://www.apparelnews.net/news/manufacturing/10
2011-Quiksilvers-New-Boardshorts-Combine-Compression-and-Taping-Technolog
ies [Accessed 25th October 2011].
Craik, J. (2011) ‘The Fastskin Revolution: From Human Fish to Swimming
Androids’, Culture Unbound, Vol. 3, pp71-82.
Creswell, J.W. (2009) Research Design: Qualitative, Quantitative, and Mixed
Methods Approaches, (Third Edition), London, SAGE Publications Ltd.
CSIRO (2004) siroFAST- A System for Fabric Objective Measurement and its
Application in Fabric and Garment Manufacture [online],http://www.csiro.org/files/fil
es/p92v.pdf [Accessed December 18th 2011].
Dascombe, B. Laursen, P. Nosaka, K. and Polglaze, T. (2011) ‘No effect of upper
body compression garments in elite flat-water kayakers’ [online] European Journal
80
of Sport Science, http://www.tandfonline.com/doi/pdf/10.1080/17461391.2011.606
842 [Accessed 16th April 2012]
Davies, R. (1994) ‘CAD in the ‘Real World’: Using CAD Clothing/Textile Systems
in Industry’ in Aldrich, W. (ed) CAD in Clothing and Textiles, (Second Edition),
Oxford, Blackwell Science Ltd.
Davies , V. Thompson, K.G. and Cooper, S-M. (2009) ‘The Effects of Compression
Garments on Recovery’, Journal of Strength and Conditioning Research, Vol. 23,
Issue 6, pp1786-1794.
Doan, B.K. Kwon, Y.H. Newton, R.U. Shim, J. Popper, E.M. Rogers, R.A. Bolt,
L.R. Robertson, M. and Kraemer, W.J. (2003) ‘Evaluation of a lower-body
compression garment’, Journal of Sports Sciences, Vol. 21, Issue 8, pp601-610.
Duffield, R. Cannon, J. and King, M. (2010) ‘The effects of compression garments
on recovery of muscle performance following high-intensity sprint and polymetric
exercise’, Journal of Science and Medicine in Sport, Vol. 13, Issue 1, pp136-140.
Duffield, R. and Portus, M. (2007) ‘Comparison of three types of full-body
compression garments on throwing and repeat-sprint performance in cricket
players’, British Journal of Sports Medicine, Vol. 41, Issue 7, pp409-414.
Fan, J. and Chan, A.P. (2005) ‘Prediction of girdle’s pressure on human body from
the pressure measurement on a dummy’, International Journal of Clothing Science
and Technology, Vol. 17, Issue 1, pp6-12.
Fan, J and Ng, Y. N. (2001) ‘Objective Evaluation of the Hand of Nonwoven
Fusible Interlining’, Textiles Research Journal, Vol. 71, Issue 8, pp661-664.
Feist, W.R. Andrade, D. and Nass, L. (2011) ‘Problems with measuring
compression device performance in preventing deep vein thrombosis’, Thrombosis
Research, Vol. 128, Issue 3, pp207-209.
Ferguson-Pell, M. Hagisawa, S. and Bain, D. (2000) ‘Evaluation of a sensor for
low interface pressure applications’, Medical Engineering and Physics, Vol. 22,
Issue 9, pp657-663.
Giele, H.P. Liddiard, K. Currie, K. and Wood, F.M. (1997) ‘Direct measurement of
cutaneous pressures generated by pressure garments’, Burns, Vol. 23, Issue 2,
pp137-141.
81
Hardaker, C.H.M. and Fozzard, G.J.W. (1997) ‘The bra design process – a study
of professional practice’, International Journal of Clothing and Science
Technology, Vol. 9, Issue 4, pp311-325.
Higgins, T. Naughton, G.A and Burgess, D. (2009) ‘Effects of wearing
compression garments on physiological and performance measures in a simulated
game-specific circuit for netball’, Journal of Science and Medicine in Sport, Vol.
21, Issue 1, pp223-226.
Hunter, L. and Fan, J. (2004) ‘Fabric properties related to clothing appearance and
fit’ in Fan, J. Yu, W. and Hunter, L. (eds), Clothing appearance and fit: Science
and technology, Cambridge, Woodhead Publishing.
Jakeman, J.R. Byrne, C. and Eston, R.G. (2010) ‘Lower limb compression
garment improves recovery from exercise-induced muscle damage in young,
active females’, European Journal of Applied Physiology, Vol. 109, Issue 6,
pp1137-1144.
JJB Sports (2011) Size Guide, [online] http://www.jjbsports.com/size-guide/content
/fcp-content [Accessed 12th September 2011].
Kemmler, W. Stengel, S.V. Köckritz, C. Mayhew, J. Wassermann, A. and Zapf, J.
(2009) ‘Effect of compression stockings on running performance in men runners’,
Journal of Strength and Conditioning Research, Vol 23, Iss 1, pp101-105.
King, K.M. (2009) ‘Lean makes Green’, Apparel Magazine, [online], http://apparel.
edgl.com/magazine/July-2009/Lean-Makes-Green65168 [Accessed 19th October
2011]
Lectra (2012) Modaris V7 - 3D at the heart of product development, [online] http://
www.lectra.com/en/soluti ons/fashion-product-development/modaris-v7-3d-at-the-
heart-of-product-development/modaris-v7-3d-at-the-heart-of-product-development.
html [Accessed 19th October 2011]
Loenneke, J.P. Balapaur, A. Thrower, A.D. Barnes, J. and Pujol, T.J. (2012) ‘Blood
flow restriction reduces time to muscular fatigue’, European Journal of Sport
Science, Vol. 12, Issue 3, pp.238 – 243.
Le Pechoux, B. and Ghosh, T.K. (2002) Textile Progress: Apparel Sizing and Fit,
Vol. 32, Number 1, Manchester, The Textiles Institute.
82
Lin, Y. Lei, Y. Choi, K-F. Luximon, A. and Li, Y. (2010) ‘Contact pressure of tubular
fabrics for compression sportswear’ Textile Bioengineering and Informatics Society
Symposium, 28th - 30th May, Shanghai, China.
Lobby, M. (2010) ‘Compression Gear: Hype or Helpful?’, Running Times, [online],
http://runningtimes.com/Article.aspx?ArticleID=21359 [Accessed 30 th May 2012].
Loker, S. (2007) ‘Mass customization and sizing’ in Ashdown, S.P. (ed), Sizing in
Clothing: Developing effective sizing systems for ready-to-wear clothing,
Cambridge, Woodhead Publishing.
Ly, N.G. Tester, D.H. Buckenham, P. Roczniok, A.F. Adriaansen, A.L.
Scaysbrook, F. and De Jong, S. (1991) ‘Simple Instruments for Quality Control by
Finishers and Tailors’, Textile Research Journal, Vol. 61, Issue 7, pp402-406.
Macintyre, L. (2011) ‘New calibration method for I-Scan sensors to enable the
precise measurement of pressures delivered by ‘pressure garments’’, Burns, Vol.
37, Issue 7, pp1174-1181.
Maklewska, E. Nawrocki, A. Kowalski, K. Andrzejewska, E. and Kuzański, W.
(2007) ‘New measuring device for estimating the pressure under compression
garments’, International Journal of Clothing Science and Technology, Vol. 19,
Issue 3/4, pp215-221.
Maxwell, S.E. and Delaney, H.D. (2004) Designing Experiments and Analyzing
Data: A Model Comparison Perspective, (Second Edition), New Jersey, Lawrence
Erlbaum Associates, Inc.
Mayes, R. (2010) ‘The Modern Olympics & Post Modern Athletics: A Clash in
Values’, The Journal of Philosophy, Science and Law, [online], Vol. 10,
https://www6.miami.edu/ethics/jpsl/archives/all/Olympics%20and%20Athletics.pdf
[Accessed 20th April 2012].
McCurry, J.W. (2004) ‘Building on the Base Layer Buzz’, Apparel Magazine, Vol.
45, Issue 5, pp22-23.
McKeegan, N. (2008) SPEEDO LZR RACER – the world’s fastest swimsuit,
[online] http://www.gizmag.com/speedo-lzr-racer-worlds-fastest-swimsuit/8819/
[Accessed 2nd May 2012].
83
McLoughlin, J. and Hayes, S. (2011) ‘Computerised reporting for fabric sewability’,
Journal of the Textile Institute, Vol. 102, Issue 7, pp.621 – 632.
McLouglin, J. Sabir, T. and Hayes, S. (2010) ‘Fabric parameter mapping for seam
sewability’, International Journal of Fashion Design, Technology and Education,
Vol. 3, Issue 2, pp77-88.
Miller, E. (1989) Textiles Properties and Behaviour in Clothing Use, (Revised
Reprint), London, BT Batsford Ltd.
Miller, J.A. (2011) ‘Use and wear of anti-embolism stockings: a clinical audit of
surgical patients’, International Wound Journal, Vol. 8, Issue 1, pp74-83.
Minazio, P. G. (1995) ‘FAST- Fabric Assurance by Simple Testing’, International
Journal of Clothing Science and Technology, Vol. 7, Issue 2/3, pp43-48.
Mintel (2009) Sports Clothing and Footwear – UK – September 2009, [online],
London, Mintel Ltd, http://academic.mintel.com/sinatra/oxygen_academic/search_r
esults/show&/display/id=394601/display/id=479629#hit1 [Accessed 2nd March
2011].
Mintel (2011) Sports Clothing and Footwear – UK – August 2011, [online], London,
Mintel Ltd, http://academic.mintel.com/sinatra/oxygen_academic/search_results/di
splay/id=545461/display/id=591380#hit1 [Accessed 9th September 2011].
Miyamoto, N. Hirata, K. Mitsukawa, N. Yanai, T. and Kawakami, Y. (2011) ‘Effect
of pressure intensity of graduated elastic compression stocking on muscle fatigue
following calf-raise exercise’, Journal of Electromyography and Kinesiology, Vol.
21, Issue 2, pp249-254.
Moffatt, C. (2008) ‘Variability of pressure provided by sustained compression’,
International Wound Journal, Vol. 5, Issue 2, pp259-265.
Moffatt, C. Martin, R. and Smithdale, R. (2007) Leg Ulcer Management, Oxford,
Blackwell Publishing.
Montgomery, P.G. Pyne, D.B. Hopkins, W.G. Dorman, J.C. Cook, K. and Minhan,
C.L. (2008) ‘The effect of recovery strategies on physical performance and
cumulative fatigue in competitive basketball’, Journal of Sports Sciences, Vol. 26,
Issue 11, pp1135-1145.

84
Neuman, W.L. (2011) Social Research Methods: Qualitative and Quantitative
Approaches, Seventh Edition, Boston, Pearson Education Inc.
OptiTex International Ltd (2011) 3D Runway Designer, [online] http://www.optitex.c
om/en/products/3DRunway_Tools/3d_Runway_Designer [Accessed 19th October
2011]
Otieno, R.B. (2008) ‘Improving apparel sizing and fit’ in Fairhurst, C. (ed),
Advances in apparel production, Cambridge, Woodhead Publishing.
Pain, M.G. Tsui, F. and Cove, S. (2008) ‘In vivo determination of the effect of
shoulder pads on tackling forces in rugby’, Journal of Sports Sciences, Vol. 26,
Issue 8, pp855-862.
Proskins (2012) The Technology Behind Proskins, [online], http://www.proskins.co/
store/en/content/8-how-proskins-work [Accessed 18th April 2012].
Ramelet, A.A. (2002) ‘Compression therapy’, Dermatolgic Surgery, Vol. 28, Issue
1, pp6-10.
Rogers, L. (2012) Post Op Compression Garments for Hockey, Football and
Basketball Players, [online], http://ezinearticles.com/?Post-Op-Compression-
Garments-for-Hockey,-Football-and-Basketball-Players&id=6263104 [Accessed
21st February 2012].
Saunders, M. Lewis, P. and Thornhill, A. (2007) Research Methods for Business
Students, (Fourth Edition), Essex, Pearson Education Limited.
Sawada, Y. (1993) ‘Pressure developed under pressure garment’, British Journal
of Plastic Surgery, Vol. 46, Issue 6, pp538-541.
Shepherd, J. (Date Unknown) Body type training – are we slaves to our ‘body type’
genes?, [online], http://www.pponline.co.uk/encyc/body-type-training-are-we-slave
s-to-our-body-type-genes-39798 [Accessed 9th May 2012].
Shishoo, R. L. (1995) ‘Importance of mechanical and physical properties of fabrics
in the clothing manufacturing process’, International Journal of Clothing Science
and Technology, Vol. 7, Issue 2/3, pp35-42.
Shishoo, R. (2005) Textiles in Sport, Cambridge, Woodhead Publishing Limited.

85
Swim-Faster.com (2012) The Speedo Fastskin fsii Swimsuit Story, [online] http://w
ww.swimming-faster.com/ [Accessed April 20th 2012].
Skins™ (2012) SKINS Science, [online] http://www.skins.net/en-GB/whyskins/skin
s-science.aspx [Accessed 7th February 2012].
Sperlich, B. Haegele, M. Achtzehn, S. Linville, J. Holmberg, H-C. and Mester, J.
(2010) ‘Different types of compression clothing do not increase sub-maximal and
maximal endurance performance in well-trained athletes’, Journal of Sports
Sciences, Vol. 28, Issue 6, pp609-614.
Sports Direct (2011) Sizing Charts, [online] http://www.sportsdirect.com/Customer
Services/SizeChart.aspx [Accessed 12th September 2011].
Taylor, M.A. (1990) Technology of Textile Properties, (Third Edition), London,
Forbes Publications Limited.
Tekscan Inc (2007a) FlexiForce® Sensors, [online], http://www.tekscan.com/flexibl
e-force-sensors [Accessed 14th February 2012].
Tekscan (2007b) High Speed I-Scan System, [online] http://www.tekscan.com/indu
strial/hispeed-system.html [Accessed 2nd March 2011].
Tekscan (2007c) Sensor Model/Map: 4201, [online] http://www.tekscan.com/4201-
pressure-sensor [Accessed 23rd November 2011].
Teng, T.L. Chou, K.T. and Lin, C.H. (2007) ‘Design and Implementation of
Pressure Measurement System for Pressure Garments’, Information Technology
Journal, Vol. 6, Issue 3, pp359-362.
The Style Aficionado (2009) Identifying your body shape: Women, [online],
http://thestyleaficionado.com/2009/11/identifing-your-body-shape-women,
[Accessed 5th June 2012]
Thomas, S. Fram, P. and Phillips, P. (2007) World Wide Wounds: The importance
of compression on dressing performance, [online], http://www.worldwidewounds.c
om/2007/November/Thomas-FramPhillips/Thomas-Fram-Phillips-CompressionWR
AP.ht ml [Accessed 1st May 2012].
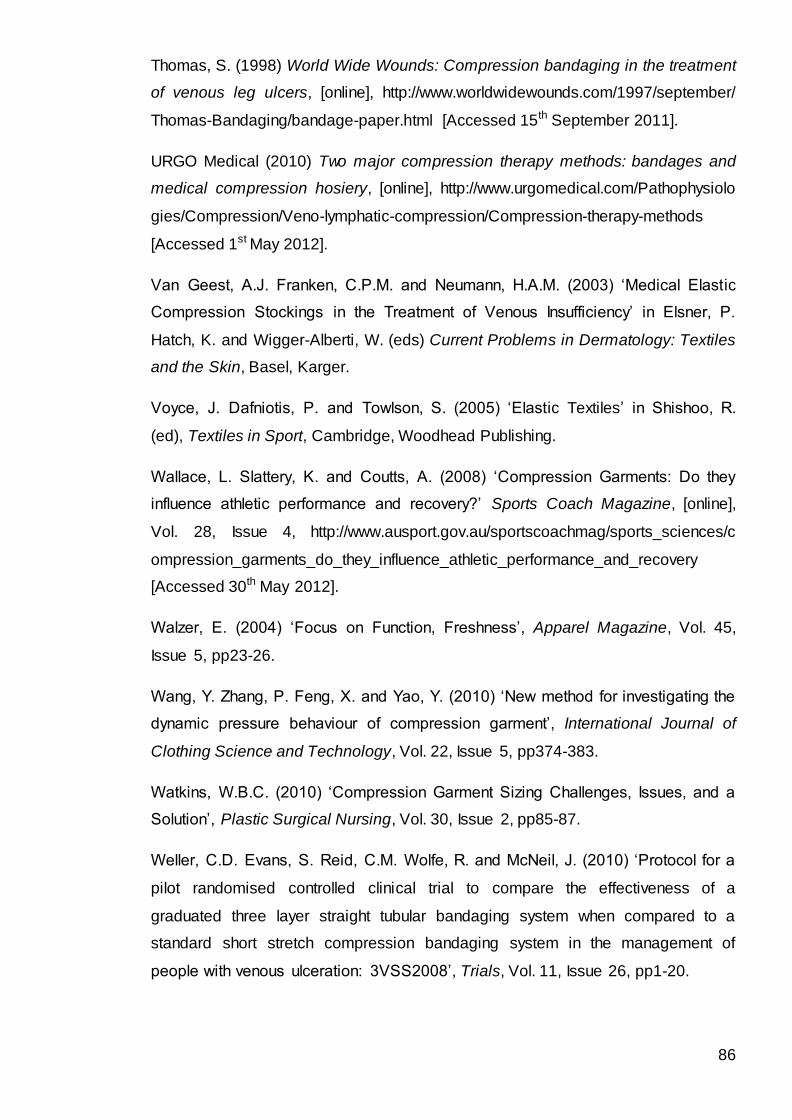
86
Thomas, S. (1998) World Wide Wounds: Compression bandaging in the treatment
of venous leg ulcers, [online], http://www.worldwidewounds.com/1997/september/
Thomas-Bandaging/bandage-paper.html [Accessed 15th September 2011].
URGO Medical (2010) Two major compression therapy methods: bandages and
medical compression hosiery, [online], http://www.urgomedical.com/Pathophysiolo
gies/Compression/Veno-lymphatic-compression/Compression-therapy-methods
[Accessed 1st May 2012].
Van Geest, A.J. Franken, C.P.M. and Neumann, H.A.M. (2003) ‘Medical Elastic
Compression Stockings in the Treatment of Venous Insufficiency’ in Elsner, P.
Hatch, K. and Wigger-Alberti, W. (eds) Current Problems in Dermatology: Textiles
and the Skin, Basel, Karger.
Voyce, J. Dafniotis, P. and Towlson, S. (2005) ‘Elastic Textiles’ in Shishoo, R.
(ed), Textiles in Sport, Cambridge, Woodhead Publishing.
Wallace, L. Slattery, K. and Coutts, A. (2008) ‘Compression Garments: Do they
influence athletic performance and recovery?’ Sports Coach Magazine, [online],
Vol. 28, Issue 4, http://www.ausport.gov.au/sportscoachmag/sports_sciences/c
ompression_garments_do_they_influence_athletic_performance_and_recovery
[Accessed 30th May 2012].
Walzer, E. (2004) ‘Focus on Function, Freshness’, Apparel Magazine, Vol. 45,
Issue 5, pp23-26.
Wang, Y. Zhang, P. Feng, X. and Yao, Y. (2010) ‘New method for investigating the
dynamic pressure behaviour of compression garment’, International Journal of
Clothing Science and Technology, Vol. 22, Issue 5, pp374-383.
Watkins, W.B.C. (2010) ‘Compression Garment Sizing Challenges, Issues, and a
Solution’, Plastic Surgical Nursing, Vol. 30, Issue 2, pp85-87.
Weller, C.D. Evans, S. Reid, C.M. Wolfe, R. and McNeil, J. (2010) ‘Protocol for a
pilot randomised controlled clinical trial to compare the effectiveness of a
graduated three layer straight tubular bandaging system when compared to a
standard short stretch compression bandaging system in the management of
people with venous ulceration: 3VSS2008’, Trials, Vol. 11, Issue 26, pp1-20.

87
Wiernert, V. (2003) ‘Compression Treatment after Burns’ in Elsner, P. Hatch, K.
and Wigger-Alberti, W. (eds) Current Problems in Dermatology: Textiles and the
Skin, Basel, Karger.
Williams, G.L. Torrens, G.E. and Hodgson, A.R. (2004) ‘Integration of
anthropometric data within a computer aided design model’, Journal of
Engineering Manufacture, Vol. 218, Issue 10, pp. 1417 – 1421.
Yildiz, N. (2007) ‘A novel technique to determine pressure in pressure garments
for hypertrophic burn scars and comfort properties’, Burns, Vol. 33, Issue 1, pp59-
64.
Yu, W. (2004) ‘3D body scanning’ in Fan, J. Yu, W. and Hunter, L. Clothing
appearance and fit: Science and technology, Cambridge, Woodhead Publishing.
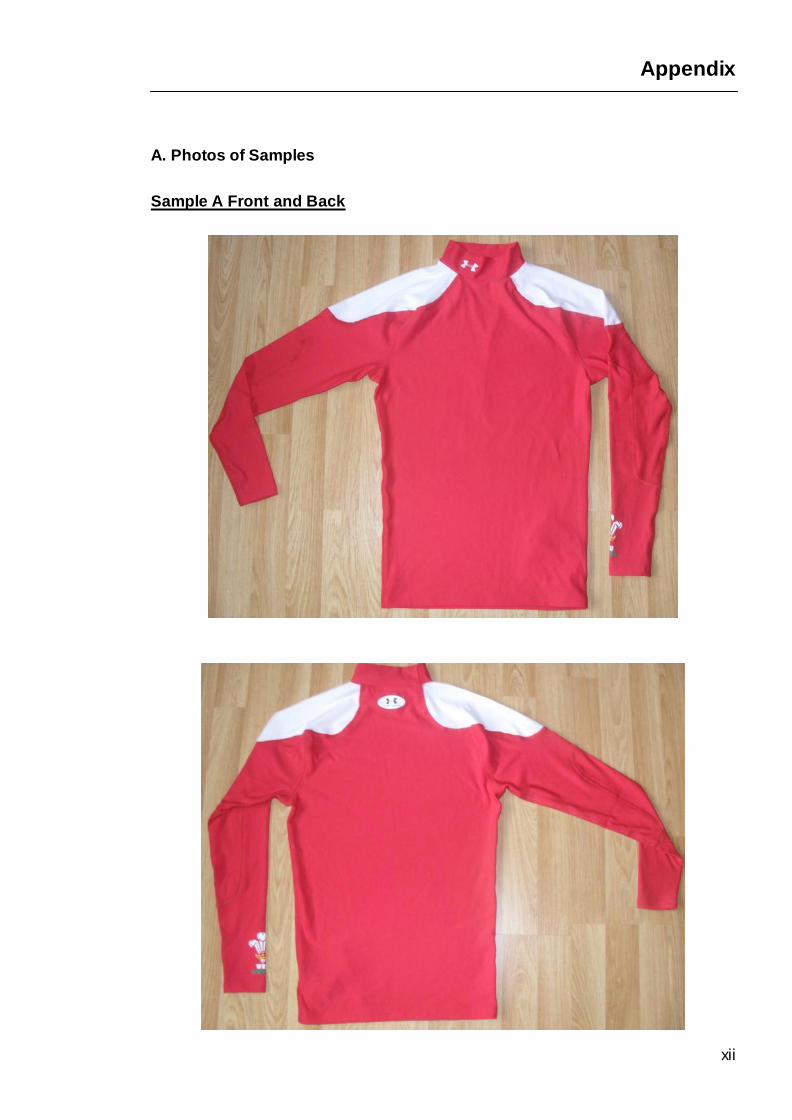
xii
Appendix
A. Photos of Samples
Sample A Front and Back
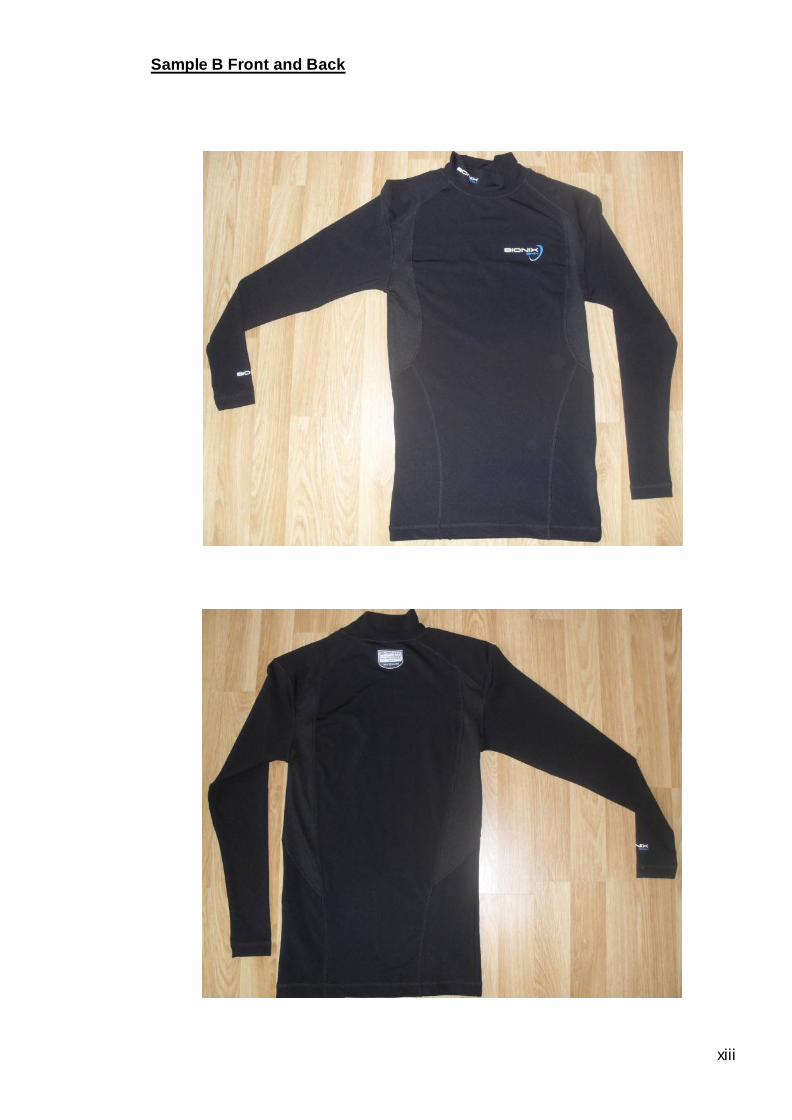
xiii
Sample B Front and Back
xiv
Sample C Front and Back
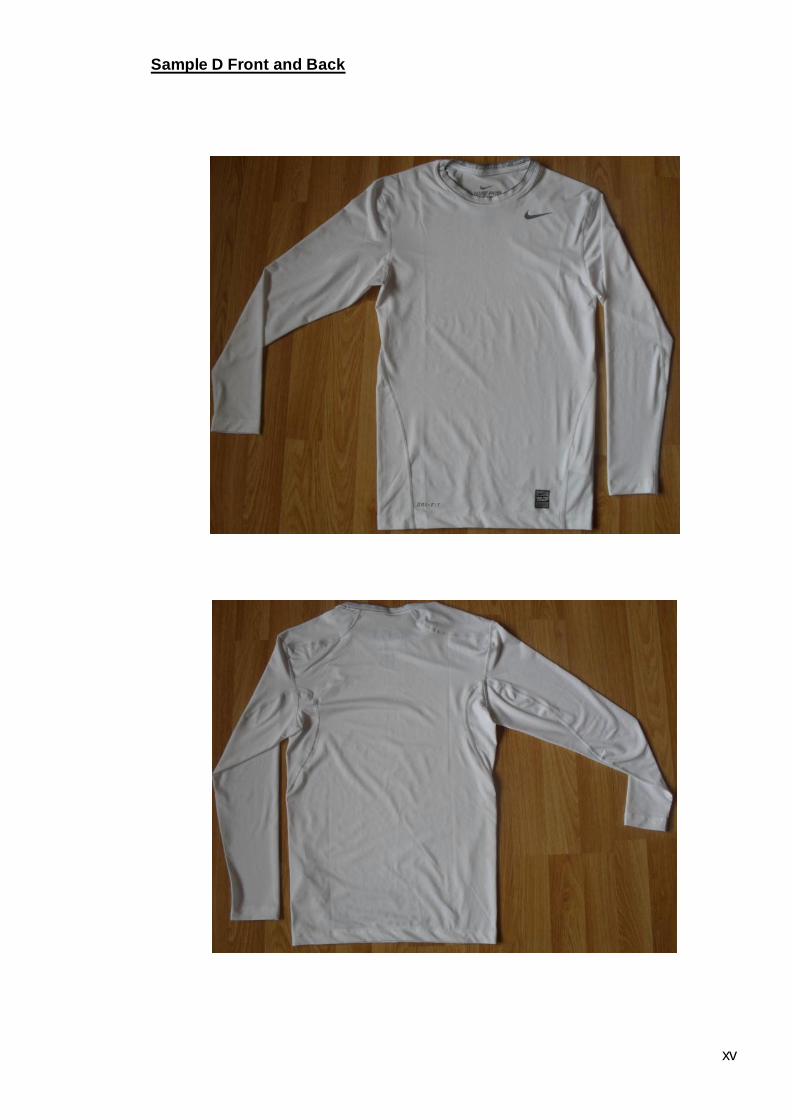
xv
Sample D Front and Back
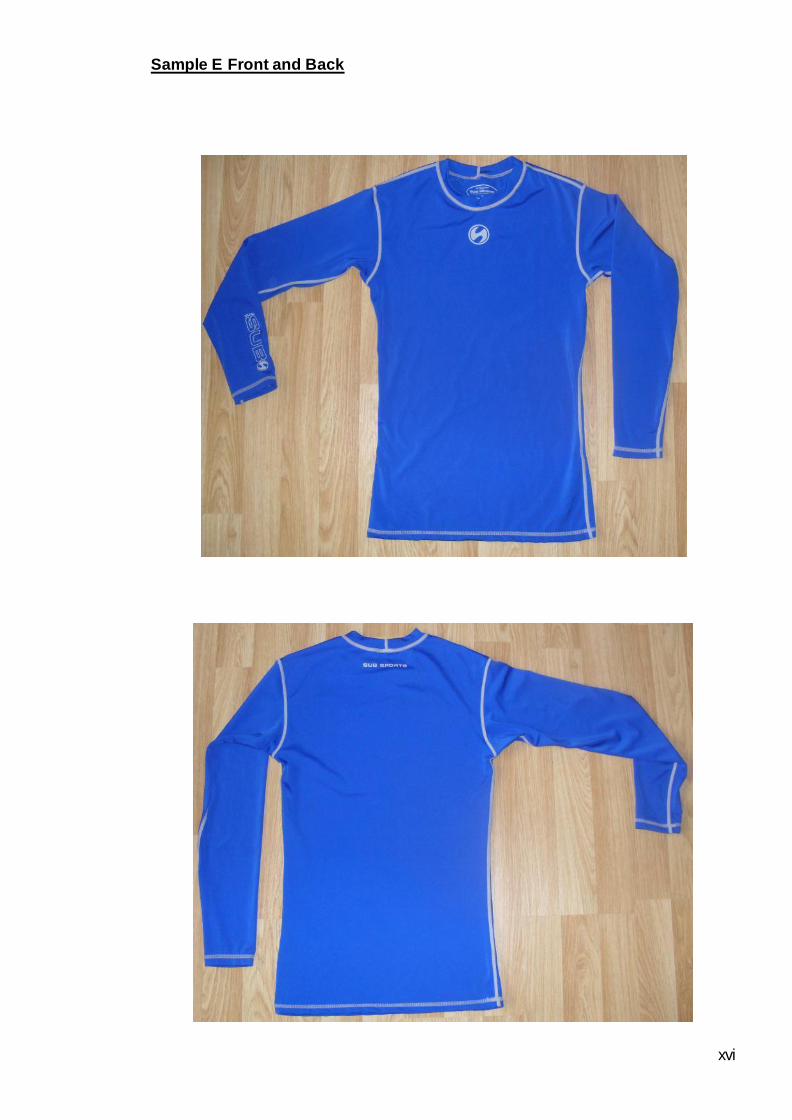
xvi
Sample E Front and Back
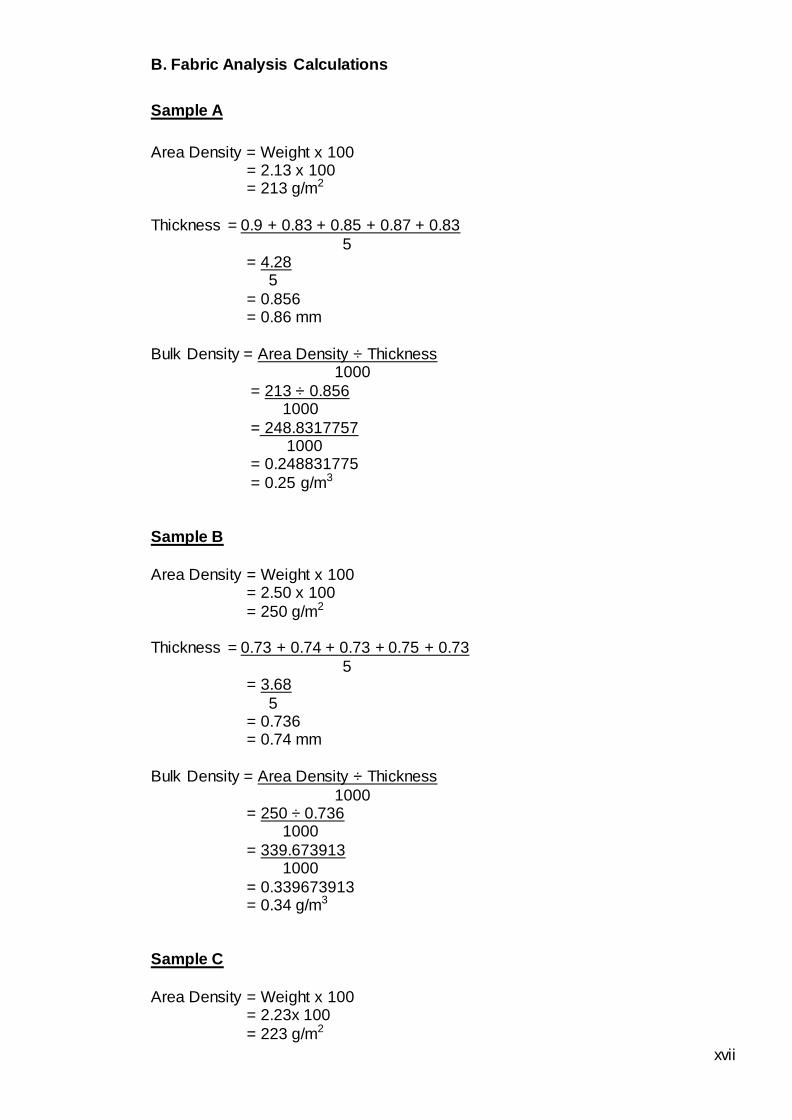
xvii
B. Fabric Analysis Calculations
Sample A
Area Density = Weight x 100 = 2.13 x 100 = 213 g/m2
Thickness = 0.9 + 0.83 + 0.85 + 0.87 + 0.83
5 = 4.28 5
= 0.856 = 0.86 mm
Bulk Density = Area Density ÷ Thickness 1000
= 213 ÷ 0.856 1000
= 248.8317757 1000 = 0.248831775
= 0.25 g/m3
Sample B
Area Density = Weight x 100 = 2.50 x 100
= 250 g/m2 Thickness = 0.73 + 0.74 + 0.73 + 0.75 + 0.73
5 = 3.68
5 = 0.736 = 0.74 mm
Bulk Density = Area Density ÷ Thickness
1000 = 250 ÷ 0.736
1000
= 339.673913 1000
= 0.339673913 = 0.34 g/m3
Sample C
Area Density = Weight x 100
= 2.23x 100
= 223 g/m2
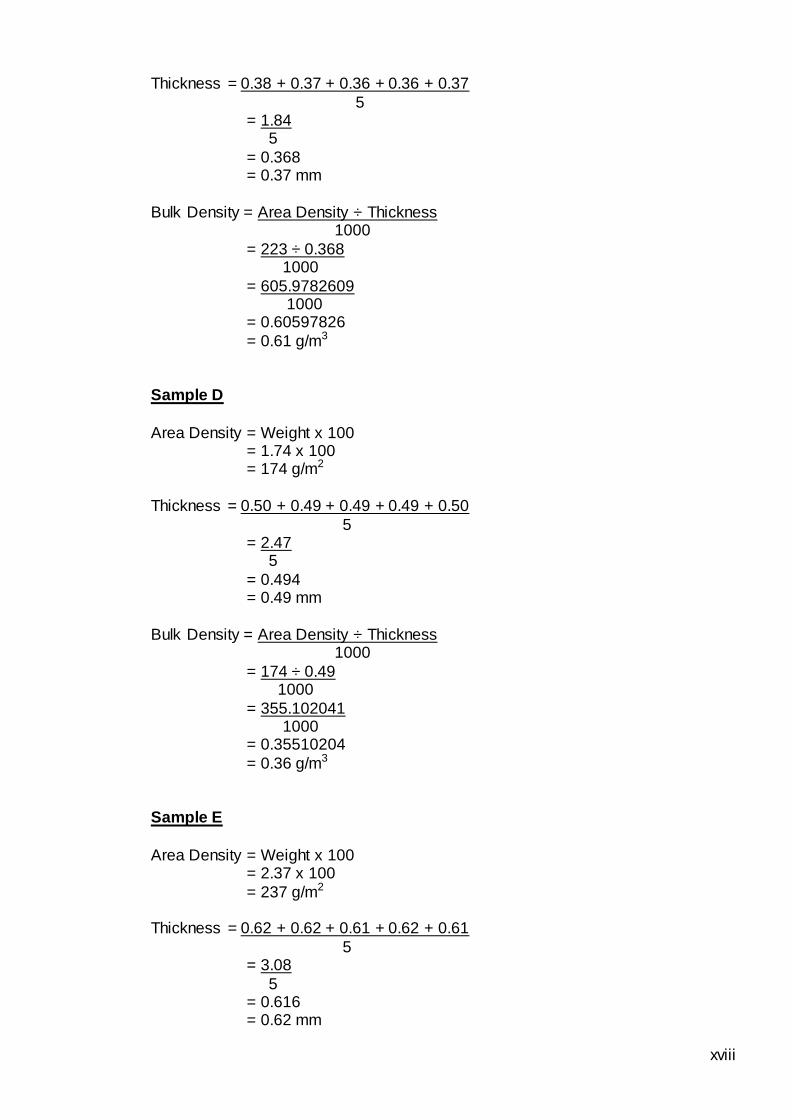
xviii
Thickness = 0.38 + 0.37 + 0.36 + 0.36 + 0.37
5 = 1.84
5
= 0.368 = 0.37 mm
Bulk Density = Area Density ÷ Thickness 1000
= 223 ÷ 0.368 1000
= 605.9782609 1000
= 0.60597826
= 0.61 g/m3
Sample D
Area Density = Weight x 100 = 1.74 x 100 = 174 g/m2
Thickness = 0.50 + 0.49 + 0.49 + 0.49 + 0.50
5 = 2.47
5
= 0.494 = 0.49 mm
Bulk Density = Area Density ÷ Thickness 1000
= 174 ÷ 0.49 1000
= 355.102041 1000
= 0.35510204
= 0.36 g/m3
Sample E
Area Density = Weight x 100 = 2.37 x 100
= 237 g/m2 Thickness = 0.62 + 0.62 + 0.61 + 0.62 + 0.61
5 = 3.08
5 = 0.616 = 0.62 mm
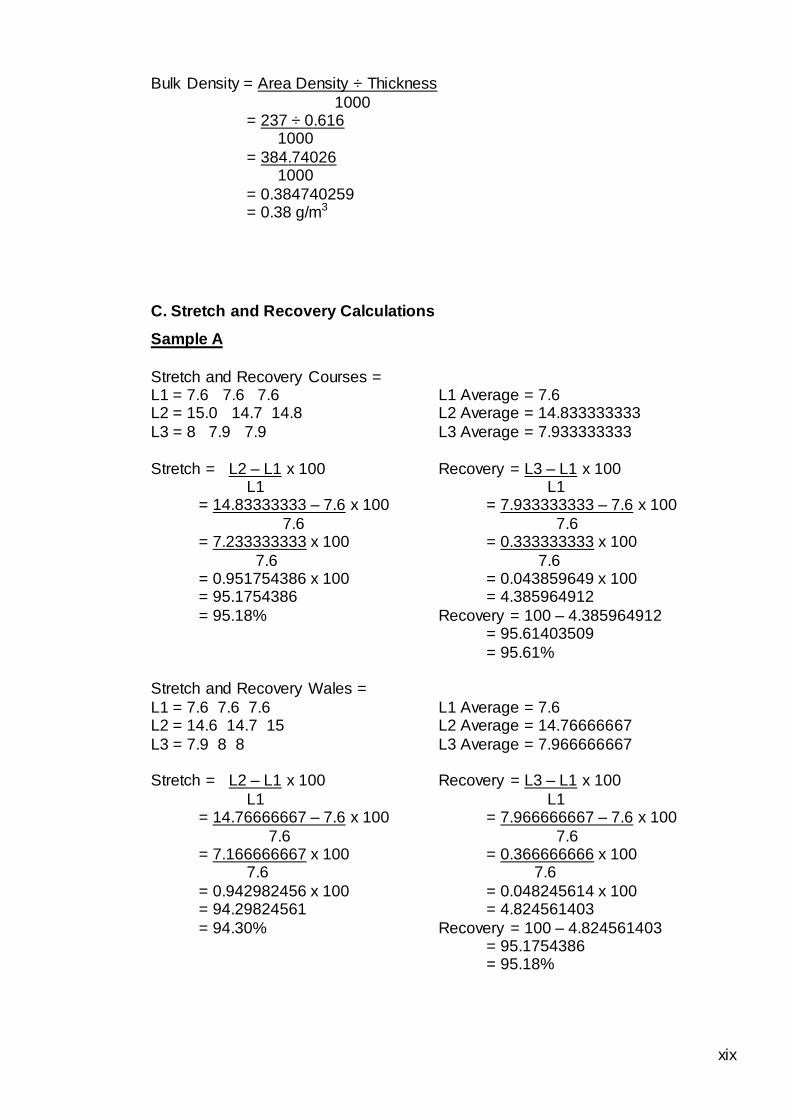
xix
Bulk Density = Area Density ÷ Thickness
1000 = 237 ÷ 0.616
1000
= 384.74026 1000
= 0.384740259 = 0.38 g/m3
C. Stretch and Recovery Calculations
Sample A
Stretch and Recovery Courses = L1 = 7.6 7.6 7.6 L1 Average = 7.6 L2 = 15.0 14.7 14.8 L2 Average = 14.833333333
L3 = 8 7.9 7.9 L3 Average = 7.933333333
Stretch = L2 – L1 x 100 Recovery = L3 – L1 x 100 L1 L1
= 14.83333333 – 7.6 x 100 = 7.933333333 – 7.6 x 100
7.6 7.6 = 7.233333333 x 100 = 0.333333333 x 100
7.6 7.6 = 0.951754386 x 100 = 0.043859649 x 100 = 95.1754386 = 4.385964912
= 95.18% Recovery = 100 – 4.385964912 = 95.61403509
= 95.61% Stretch and Recovery Wales =
L1 = 7.6 7.6 7.6 L1 Average = 7.6 L2 = 14.6 14.7 15 L2 Average = 14.76666667
L3 = 7.9 8 8 L3 Average = 7.966666667 Stretch = L2 – L1 x 100 Recovery = L3 – L1 x 100
L1 L1 = 14.76666667 – 7.6 x 100 = 7.966666667 – 7.6 x 100
7.6 7.6 = 7.166666667 x 100 = 0.366666666 x 100
7.6 7.6
= 0.942982456 x 100 = 0.048245614 x 100 = 94.29824561 = 4.824561403
= 94.30% Recovery = 100 – 4.824561403 = 95.1754386 = 95.18%
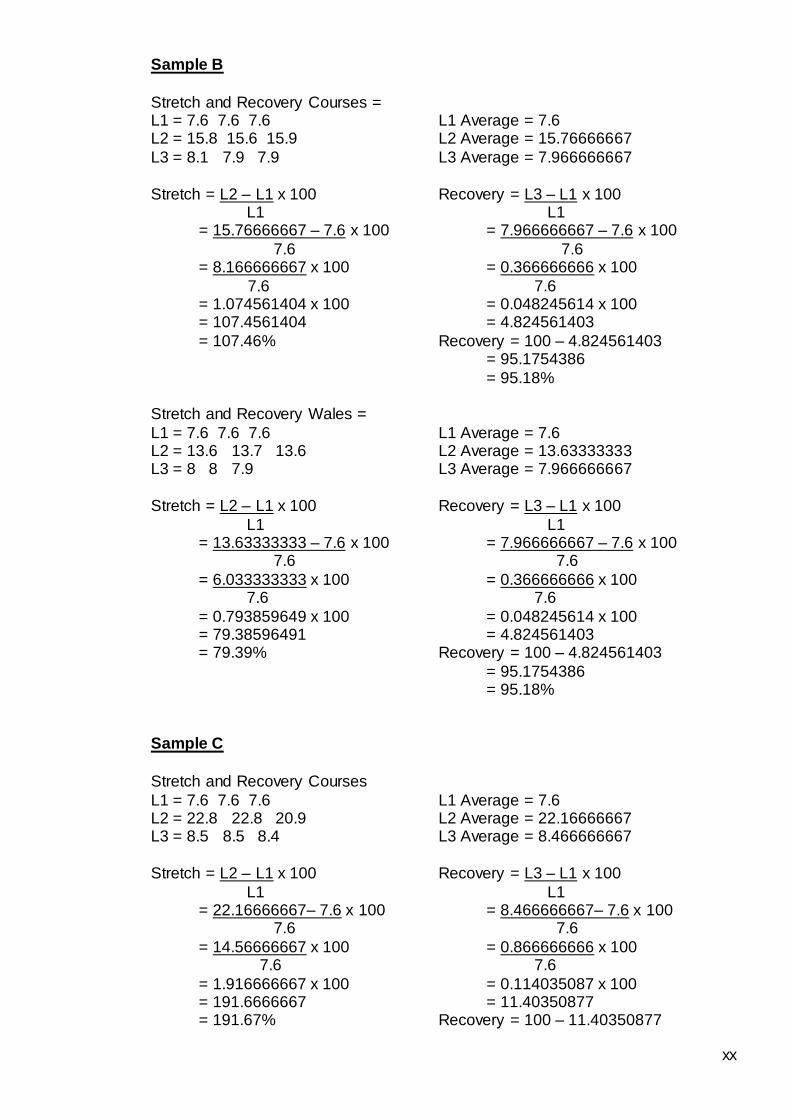
xx
Sample B
Stretch and Recovery Courses = L1 = 7.6 7.6 7.6 L1 Average = 7.6 L2 = 15.8 15.6 15.9 L2 Average = 15.76666667
L3 = 8.1 7.9 7.9 L3 Average = 7.966666667
Stretch = L2 – L1 x 100 Recovery = L3 – L1 x 100 L1 L1
= 15.76666667 – 7.6 x 100 = 7.966666667 – 7.6 x 100
7.6 7.6 = 8.166666667 x 100 = 0.366666666 x 100
7.6 7.6 = 1.074561404 x 100 = 0.048245614 x 100 = 107.4561404 = 4.824561403
= 107.46% Recovery = 100 – 4.824561403 = 95.1754386
= 95.18% Stretch and Recovery Wales =
L1 = 7.6 7.6 7.6 L1 Average = 7.6 L2 = 13.6 13.7 13.6 L2 Average = 13.63333333 L3 = 8 8 7.9 L3 Average = 7.966666667
Stretch = L2 – L1 x 100 Recovery = L3 – L1 x 100
L1 L1 = 13.63333333 – 7.6 x 100 = 7.966666667 – 7.6 x 100
7.6 7.6
= 6.033333333 x 100 = 0.366666666 x 100 7.6 7.6
= 0.793859649 x 100 = 0.048245614 x 100 = 79.38596491 = 4.824561403 = 79.39% Recovery = 100 – 4.824561403
= 95.1754386 = 95.18%
Sample C
Stretch and Recovery Courses
L1 = 7.6 7.6 7.6 L1 Average = 7.6 L2 = 22.8 22.8 20.9 L2 Average = 22.16666667 L3 = 8.5 8.5 8.4 L3 Average = 8.466666667
Stretch = L2 – L1 x 100 Recovery = L3 – L1 x 100
L1 L1 = 22.16666667– 7.6 x 100 = 8.466666667– 7.6 x 100
7.6 7.6
= 14.56666667 x 100 = 0.866666666 x 100 7.6 7.6
= 1.916666667 x 100 = 0.114035087 x 100 = 191.6666667 = 11.40350877 = 191.67% Recovery = 100 – 11.40350877

xxi
= 88.59649123 = 88.60%
Stretch and Recovery Wales L1 = 7.6 7.6 7.6 L1 Average = 7.6
L2 = 24.5 22.8 24.3 L2 Average = 23.86666667 L3 = 8.6 8.8 8.8 L3 Average = 8.733333333
Stretch = L2 – L1 x 100 Recovery = L3 – L1 x 100 L1 L1
= 23.86666667 – 7.6 x 100 = 8.733333333 – 7.6 x 100 7.6 7.6
= 16.26666667 x 100 = 1.133333333 x 100 7.6 7.6
= 2.140350877 x 100 = 0.149122807 x 100
= 214.0350877 = 14.9122807 = 214.04% Recovery = 100 – 14.9122807
= 85.0877193 = 85.09%
Sample D
Stretch and Recovery Courses L1 = 7.6 7.6 7.6 L1 Average = 7.6
L2 = 15.4 15.3 15.2 L2 Average = 15.3 L3 = 7.9 7.9 7.8 L3 Average = 7.866666667
Stretch = L2 – L1 x 100 Recovery = L3 – L1 x 100 L1 L1
= 15.3 - 7.6 x 100 = 7.866666667 - 7.6 x 100 7.6 7.6 = 7.7 x 100 = 0.266666666 x 100
7.6 7.6 = 1.013157895 x 100 = 0.035087719 x 100
= 101.3157895 = 3.50877193 = 101.32% Recovery = 100 – 3.50877193
= 96.49122807
= 96.50%
Stretch and Recovery Wales L1 = 7.6 7.6 7.6 L1 Average = 7.6 L2 = 19.8 19.9 19.7 L2 Average = 19.8
L3 = 8 8.1 8 L3 Average = 8.033333333
Stretch = L2 – L1 x 100 Recovery = L3 – L1 x 100 L1 L1
= 19.8 – 7.6 x 100 = 8.033333333 – 7.6 x 100
7.6 7.6 = 12.2 x 100 = 0.433333333 x 100
7.6 7.6 = 1.605263158 x 100 = 0.057017543 x 100 = 160.5263158 = 5.701754386
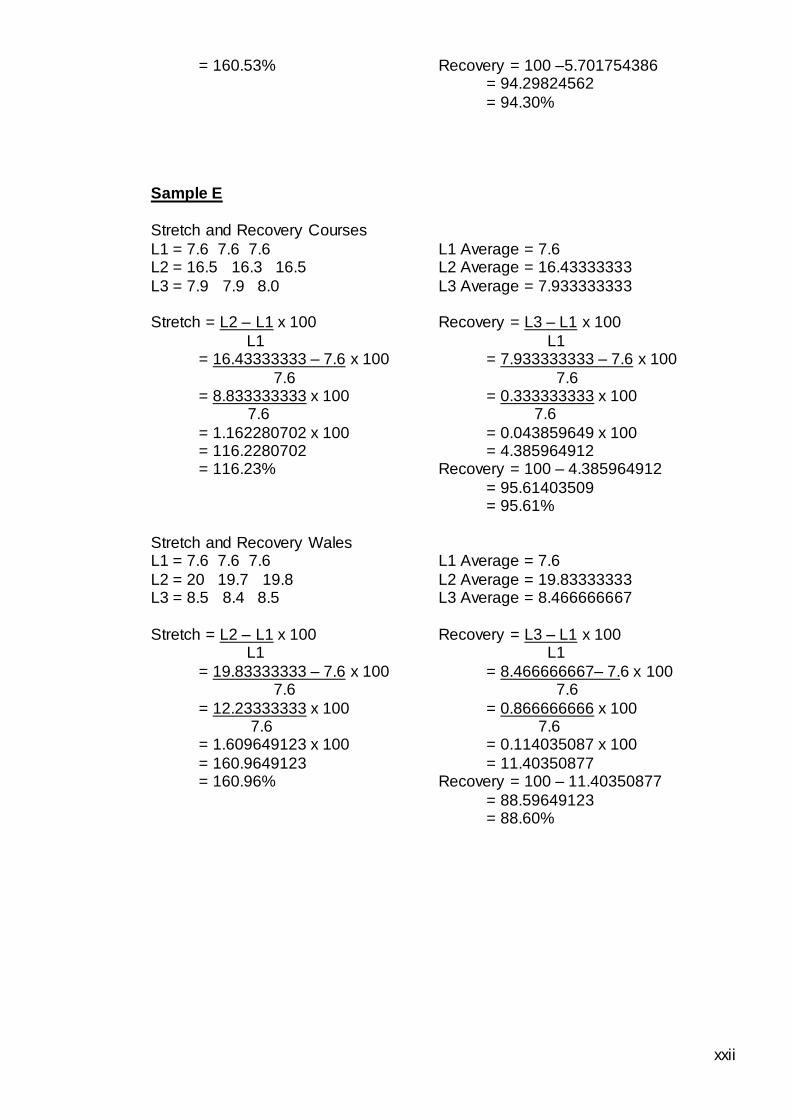
xxii
= 160.53% Recovery = 100 –5.701754386 = 94.29824562
= 94.30%
Sample E
Stretch and Recovery Courses
L1 = 7.6 7.6 7.6 L1 Average = 7.6 L2 = 16.5 16.3 16.5 L2 Average = 16.43333333
L3 = 7.9 7.9 8.0 L3 Average = 7.933333333 Stretch = L2 – L1 x 100 Recovery = L3 – L1 x 100
L1 L1 = 16.43333333 – 7.6 x 100 = 7.933333333 – 7.6 x 100
7.6 7.6 = 8.833333333 x 100 = 0.333333333 x 100
7.6 7.6
= 1.162280702 x 100 = 0.043859649 x 100 = 116.2280702 = 4.385964912 = 116.23% Recovery = 100 – 4.385964912
= 95.61403509 = 95.61%
Stretch and Recovery Wales L1 = 7.6 7.6 7.6 L1 Average = 7.6
L2 = 20 19.7 19.8 L2 Average = 19.83333333 L3 = 8.5 8.4 8.5 L3 Average = 8.466666667
Stretch = L2 – L1 x 100 Recovery = L3 – L1 x 100 L1 L1
= 19.83333333 – 7.6 x 100 = 8.466666667– 7.6 x 100 7.6 7.6
= 12.23333333 x 100 = 0.866666666 x 100 7.6 7.6
= 1.609649123 x 100 = 0.114035087 x 100
= 160.9649123 = 11.40350877 = 160.96% Recovery = 100 – 11.40350877
= 88.59649123 = 88.60%

xxiii
D. Size Chart from Retailers
Sports Direct Sizing Chart (to nearest 0.5 cm)
Small Medium Large
Chest Circular Measurement
Half Measurement
91.5
45.5
96.5 -
101.5
48.5 - 51
106.5 -112
53.5 – 56
JJB Sports Sizing Chart (to nearest 0.5 cm)
Small Medium Large
Chest Circular Measurement
Half Measurement
86.5 –
91.5
43-45.5
94 - 99
47-49.5
101.5 -
106.5
50.5 - 53
Amazon Sizing Chart (to nearest 0.5cm)
Small Medium Large
Neck Circular Measurement
Half Measurement
35.5 - 37
18 - 18.5
38 - 39.5
19 - 20
40.5 - 42
20 - 21 Chest Circular Measurement
Half Measurement
86 - 91
43 - 45.5
96 - 101
48 - 50.5
107 - 111
53.5 - 55.5 Sleeve Length Circular Meas.
Half Measurement
80 - 81
40 - 40.5
82.5 - 84
41 - 42
85 - 86.5
42.5 - 43
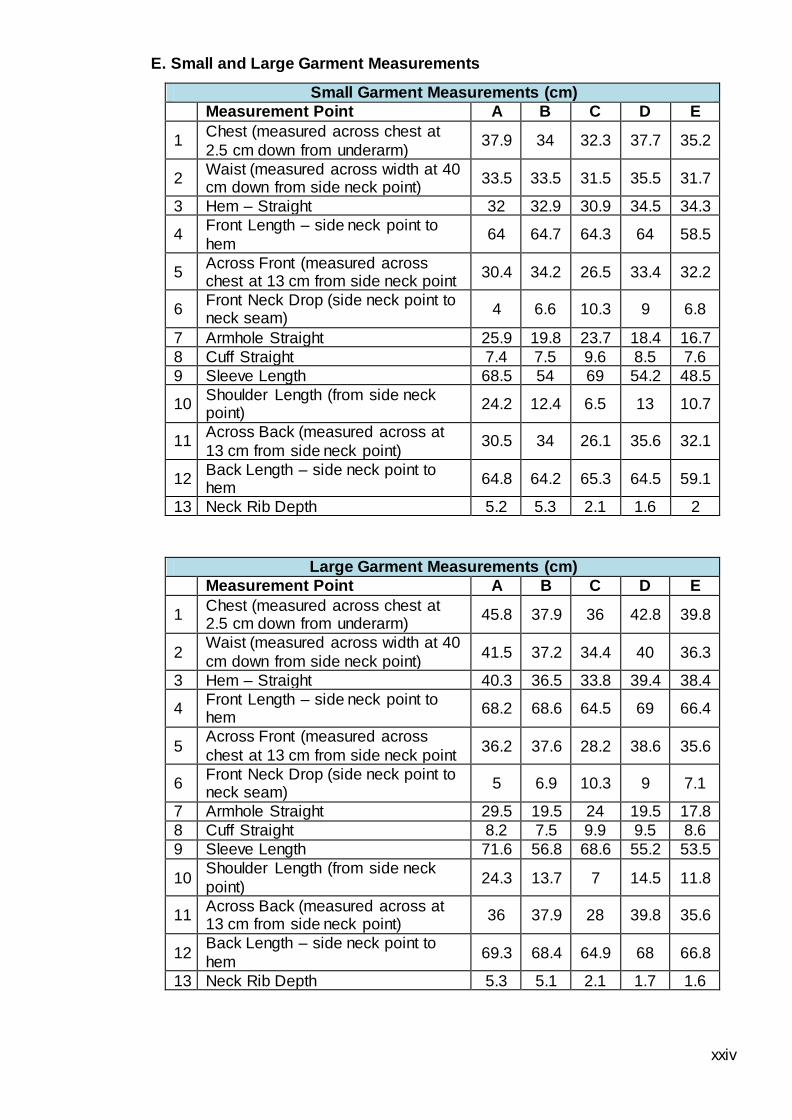
xxiv
E. Small and Large Garment Measurements
Small Garment Measurements (cm)
Measurement Point A B C D E
1 Chest (measured across chest at
2.5 cm down from underarm) 37.9 34 32.3 37.7 35.2
2 Waist (measured across width at 40 cm down from side neck point)
33.5 33.5 31.5 35.5 31.7
3 Hem – Straight 32 32.9 30.9 34.5 34.3
4 Front Length – side neck point to
hem 64 64.7 64.3 64 58.5
5 Across Front (measured across chest at 13 cm from side neck point
30.4 34.2 26.5 33.4 32.2
6 Front Neck Drop (side neck point to neck seam)
4 6.6 10.3 9 6.8
7 Armhole Straight 25.9 19.8 23.7 18.4 16.7
8 Cuff Straight 7.4 7.5 9.6 8.5 7.6
9 Sleeve Length 68.5 54 69 54.2 48.5
10 Shoulder Length (from side neck point)
24.2 12.4 6.5 13 10.7
11 Across Back (measured across at
13 cm from side neck point) 30.5 34 26.1 35.6 32.1
12 Back Length – side neck point to hem
64.8 64.2 65.3 64.5 59.1
13 Neck Rib Depth 5.2 5.3 2.1 1.6 2
Large Garment Measurements (cm)
Measurement Point A B C D E
1 Chest (measured across chest at 2.5 cm down from underarm)
45.8 37.9 36 42.8 39.8
2 Waist (measured across width at 40
cm down from side neck point) 41.5 37.2 34.4 40 36.3
3 Hem – Straight 40.3 36.5 33.8 39.4 38.4
4 Front Length – side neck point to hem
68.2 68.6 64.5 69 66.4
5 Across Front (measured across
chest at 13 cm from side neck point 36.2 37.6 28.2 38.6 35.6
6 Front Neck Drop (side neck point to neck seam)
5 6.9 10.3 9 7.1
7 Armhole Straight 29.5 19.5 24 19.5 17.8
8 Cuff Straight 8.2 7.5 9.9 9.5 8.6
9 Sleeve Length 71.6 56.8 68.6 55.2 53.5
10 Shoulder Length (from side neck
point) 24.3 13.7 7 14.5 11.8
11 Across Back (measured across at 13 cm from side neck point)
36 37.9 28 39.8 35.6
12 Back Length – side neck point to
hem 69.3 68.4 64.9 68 66.8
13 Neck Rib Depth 5.3 5.1 2.1 1.7 1.6
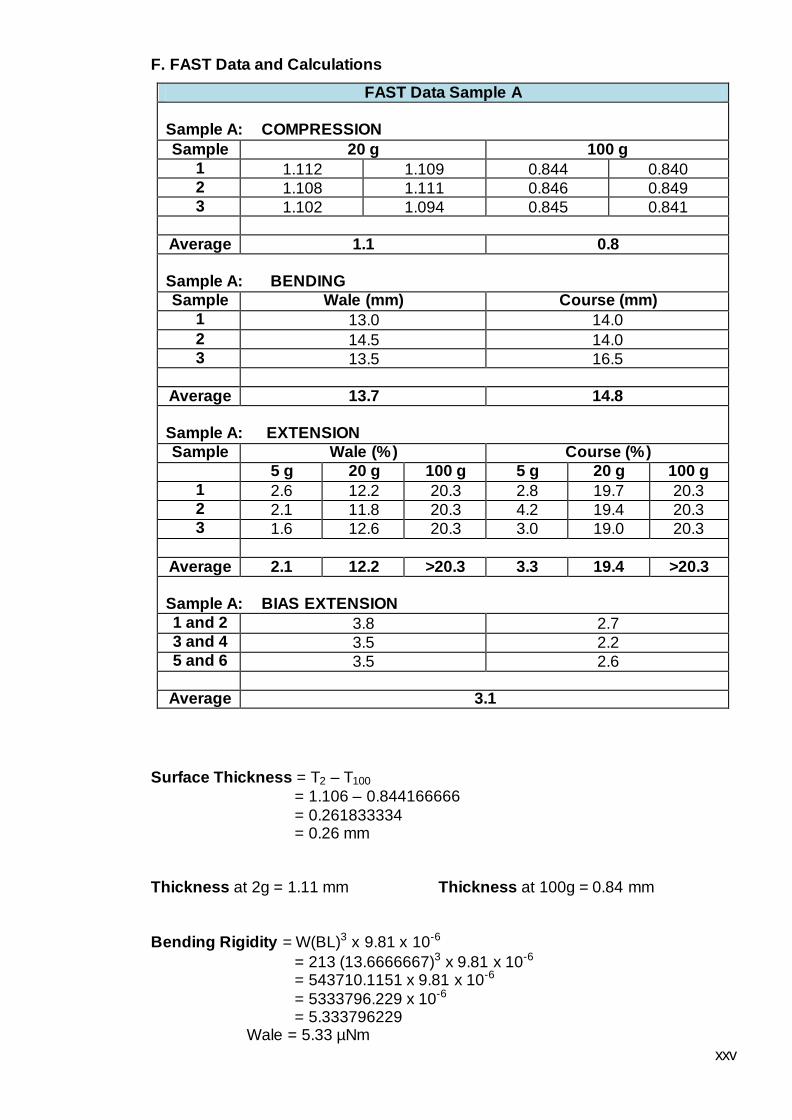
xxv
F. FAST Data and Calculations
FAST Data Sample A
Sample A: COMPRESSION
Sample 20 g 100 g
1 1.112 1.109 0.844 0.840 2 1.108 1.111 0.846 0.849 3 1.102 1.094 0.845 0.841
Average 1.1 0.8
Sample A: BENDING
Sample Wale (mm) Course (mm)
1 13.0 14.0
2 14.5 14.0 3 13.5 16.5
Average 13.7 14.8
Sample A: EXTENSION
Sample Wale (%) Course (%)
5 g 20 g 100 g 5 g 20 g 100 g
1 2.6 12.2 20.3 2.8 19.7 20.3 2 2.1 11.8 20.3 4.2 19.4 20.3 3 1.6 12.6 20.3 3.0 19.0 20.3
Average 2.1 12.2 >20.3 3.3 19.4 >20.3
Sample A: BIAS EXTENSION
1 and 2 3.8 2.7 3 and 4 3.5 2.2 5 and 6 3.5 2.6
Average 3.1
Surface Thickness = T2 – T100
= 1.106 – 0.844166666
= 0.261833334 = 0.26 mm
Thickness at 2g = 1.11 mm Thickness at 100g = 0.84 mm
Bending Rigidity = W(BL)3 x 9.81 x 10-6
= 213 (13.6666667)3 x 9.81 x 10-6 = 543710.1151 x 9.81 x 10-6
= 5333796.229 x 10-6 = 5.333796229
Wale = 5.33 µNm
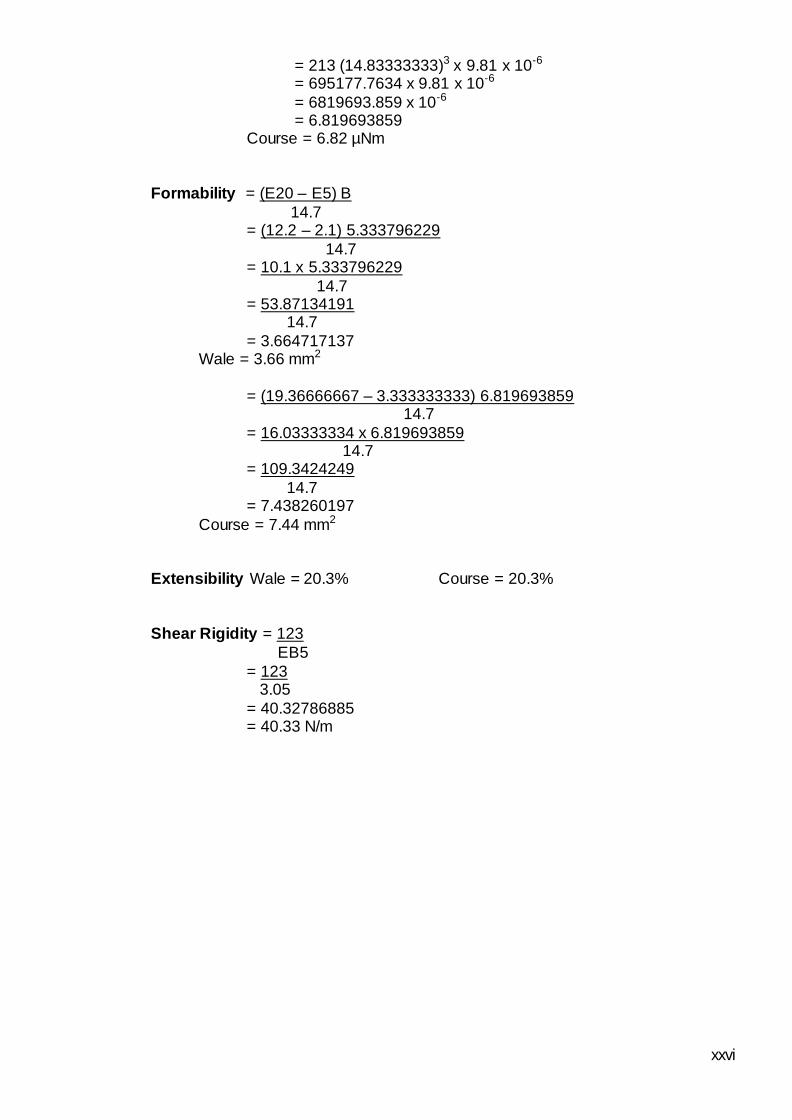
xxvi
= 213 (14.83333333)3 x 9.81 x 10-6 = 695177.7634 x 9.81 x 10-6
= 6819693.859 x 10-6 = 6.819693859
Course = 6.82 µNm
Formability = (E20 – E5) B
14.7 = (12.2 – 2.1) 5.333796229
14.7 = 10.1 x 5.333796229
14.7 = 53.87134191
14.7
= 3.664717137 Wale = 3.66 mm2
= (19.36666667 – 3.333333333) 6.819693859
14.7
= 16.03333334 x 6.819693859 14.7
= 109.3424249
14.7 = 7.438260197
Course = 7.44 mm2
Extensibility Wale = 20.3% Course = 20.3%
Shear Rigidity = 123
EB5
= 123 3.05
= 40.32786885 = 40.33 N/m

xxvii
FAST Data Sample B
Sample B: COMPRESSION
Sample 20 g 100 g
1 0.867 0.864 0.736 0.726 2 0.871 0.885 0.733 0.744 3 0.888 0.882 0.743 0.746
Average 0.9 0.7
Sample B: BENDING
Sample Wale (mm) Course (mm)
1 15.5 14.5 2 13.5 15.0 3 14.0 15.0
Average 14.3 14.8
Sample B: EXTENSION
Sample Wale (%) Course (%)
5 g 20 g 100 g 5 g 20 g 100 g
1 1.3 12.8 20.3 1.4 9.3 20.3 2 0.8 12.6 20.3 0.5 8.8 20.3 3 0.7 12.5 20.3 0.4 8.6 20.3
Average 0.9 12.6 >20.3 0.8 8.9 >20.3
Sample B: BIAS EXTENSION
1 and 2 2.8 1.9 3 and 4 0.7 1.8 5 and 6 1.6 2.2
Average 1.8
Surface Thickness = T2 – T100
= 0.876166666 – 0.738
= 0.138166666 = 0.14 mm
Thickness at 2g = 0.88 mm Thickness at 100g = 0.74 mm
Bending Rigidity = W(BL)3 x 9.81 x 10-6
= 250 (14.33333333)3 x 9.81 x 10-6 = 736175.9254 x 9.81 x 10-6
= 7221885.828 x 10-6 = 7.221885828
Wale = 7.22 µNm
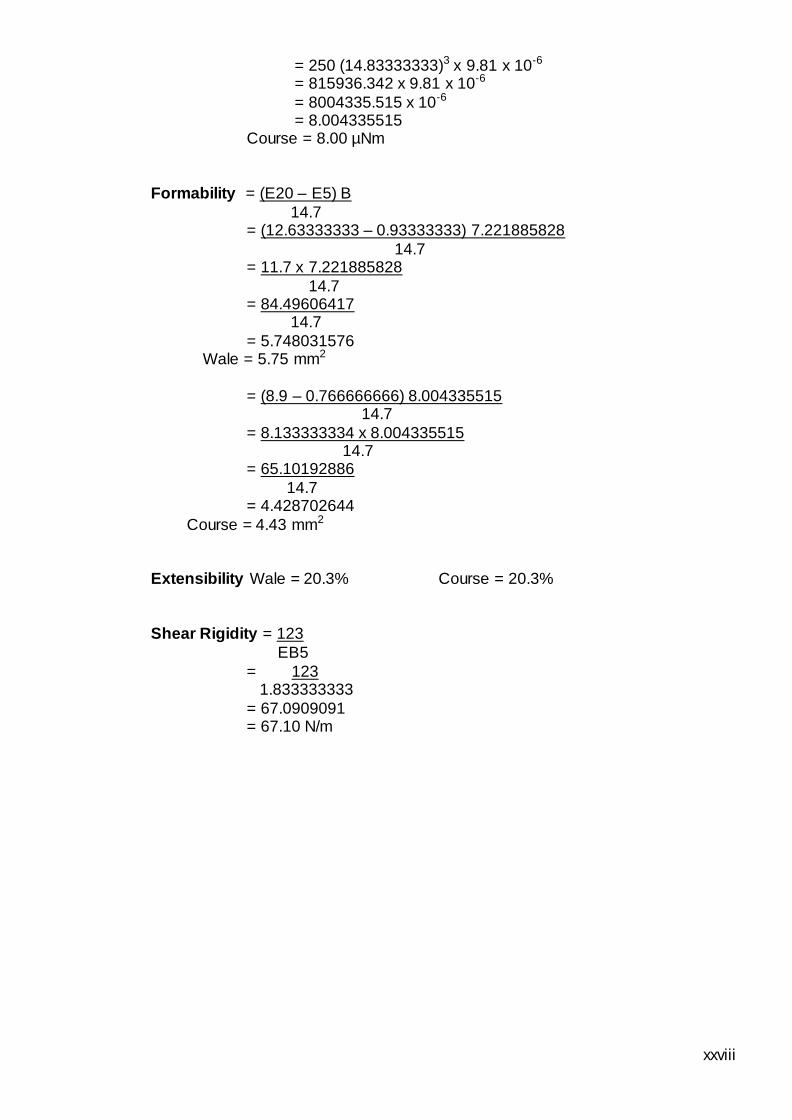
xxviii
= 250 (14.83333333)3 x 9.81 x 10-6 = 815936.342 x 9.81 x 10-6
= 8004335.515 x 10-6 = 8.004335515
Course = 8.00 µNm
Formability = (E20 – E5) B
14.7 = (12.63333333 – 0.93333333) 7.221885828
14.7 = 11.7 x 7.221885828
14.7 = 84.49606417
14.7
= 5.748031576 Wale = 5.75 mm2
= (8.9 – 0.766666666) 8.004335515
14.7
= 8.133333334 x 8.004335515 14.7
= 65.10192886
14.7 = 4.428702644
Course = 4.43 mm2 Extensibility Wale = 20.3% Course = 20.3%
Shear Rigidity = 123
EB5
= 123 1.833333333
= 67.0909091 = 67.10 N/m

xxix
FAST Data Sample C
Sample C: COMPRESSION
Sample 20 g 100 g
1 1.114 1.116 0.851 0.855 2 1.295 1.129 0.912 0.848 3 1.257 1.094 0.878 0.840
Average 1.2 0.9
Sample C: BENDING
Sample Wale (mm) Course (mm)
1 14.5 14.5 2 15.0 13.5 3 17.5 15.5
Average 15.7 14.5
Sample C: EXTENSION
Sample Wale (%) Course (%)
5 g 20 g 100 g 5 g 20 g 100 g
1 0.8 16.5 20.3 0.9 12.6 20.3 2 0.6 16.8 20.3 0.4 17.8 20.3 3 0.4 18.6 20.3 1.0 19.2 20.3
Average 0.6 17.3 >20.3 0.8 16.5 >20.3
Sample C: BIAS EXTENSION
1 and 2 0.8 1.8 3 and 4 1.2 1.9 5 and 6 0.7 1.7
Average 1.4
Surface Thickness = T2 – T100
= 1.1675 – 0.864
= 0.3035 = 0.30 mm
Thickness at 2g = 1.17 mm Thickness at 100g = 0.86 mm
Bending Rigidity = W(BL)3 x 9.81 x 10-6
= 223 (15.66666667)3 x 9.81 x 10-6 = 857501.0746 x 9.81 x 10-6
= 8412085.542 x 10-6 = 8.412085542
Wale = 8.41 µNm

xxx
= 223 (14.5)3 x 9.81 x 10-6 = 679843.375 x 9.81 x 10-6
= 6669263.509 x 10-6 = 6.669263509
Course = 6.67 µNm
Formability = (E20 – E5) B
14.7 = (17.3 – 0.6) 8.412085542
14.7 = 16.7 x 8.412085542
14.7 = 140.4818286
14.7
= 9.556586976 Wale = 9.56 mm2
= (16.53333333 – 0.766666666) 6.669263509
14.7
= 15.76666666 x 6.669263509 14.7
= 105.1520546
14.7 = 7.153200996
Course = 7.15 mm2
Extensibility Wale = 20.3% Course = 20.3%
Shear Rigidity = 123
EB5
= 123 1.35
= 91.11111111 = 91.11 N/m
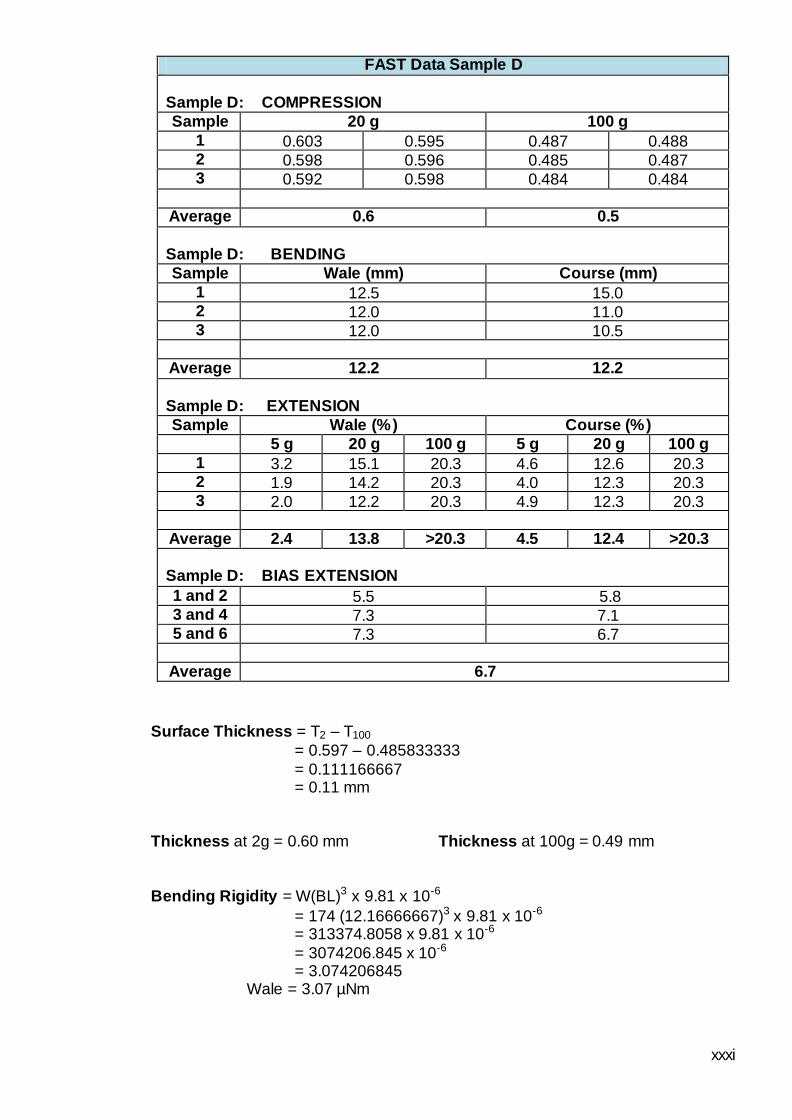
xxxi
FAST Data Sample D
Sample D: COMPRESSION
Sample 20 g 100 g
1 0.603 0.595 0.487 0.488 2 0.598 0.596 0.485 0.487 3 0.592 0.598 0.484 0.484
Average 0.6 0.5
Sample D: BENDING
Sample Wale (mm) Course (mm)
1 12.5 15.0 2 12.0 11.0 3 12.0 10.5
Average 12.2 12.2
Sample D: EXTENSION
Sample Wale (%) Course (%)
5 g 20 g 100 g 5 g 20 g 100 g
1 3.2 15.1 20.3 4.6 12.6 20.3 2 1.9 14.2 20.3 4.0 12.3 20.3 3 2.0 12.2 20.3 4.9 12.3 20.3
Average 2.4 13.8 >20.3 4.5 12.4 >20.3
Sample D: BIAS EXTENSION
1 and 2 5.5 5.8 3 and 4 7.3 7.1 5 and 6 7.3 6.7
Average 6.7
Surface Thickness = T2 – T100
= 0.597 – 0.485833333
= 0.111166667 = 0.11 mm
Thickness at 2g = 0.60 mm Thickness at 100g = 0.49 mm
Bending Rigidity = W(BL)3 x 9.81 x 10-6
= 174 (12.16666667)3 x 9.81 x 10-6 = 313374.8058 x 9.81 x 10-6
= 3074206.845 x 10-6 = 3.074206845
Wale = 3.07 µNm
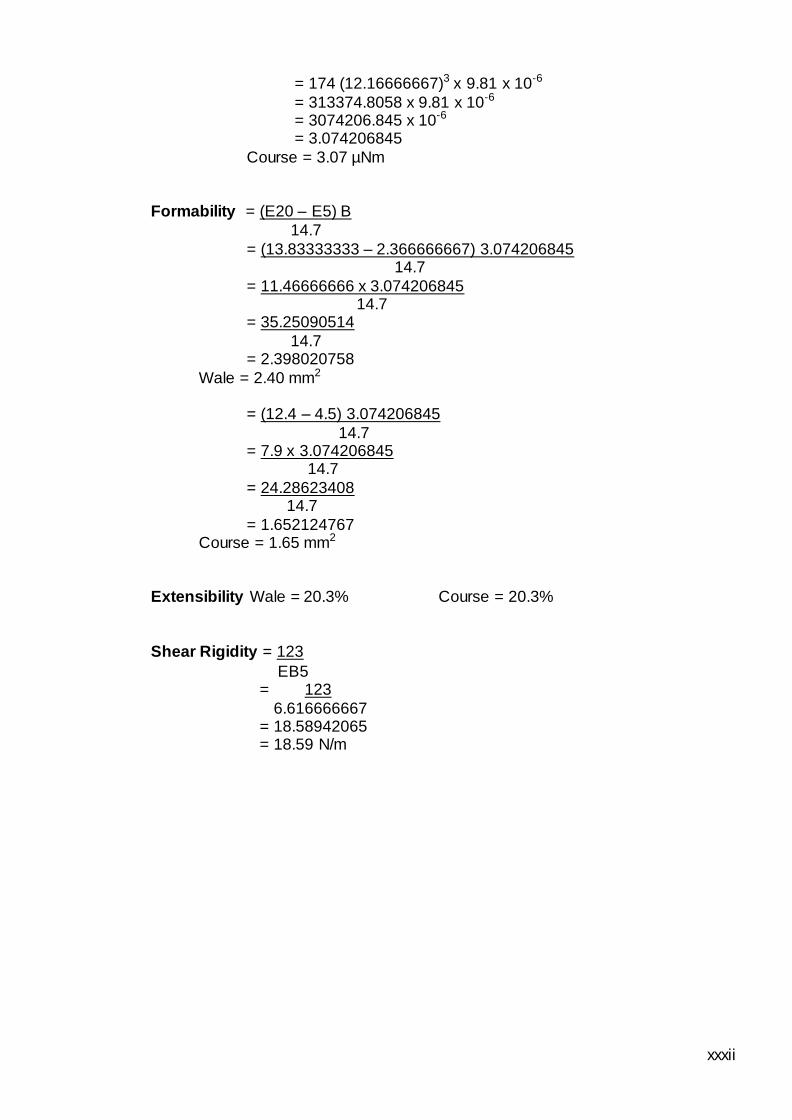
xxxii
= 174 (12.16666667)3 x 9.81 x 10-6
= 313374.8058 x 9.81 x 10-6 = 3074206.845 x 10-6 = 3.074206845
Course = 3.07 µNm
Formability = (E20 – E5) B
14.7
= (13.83333333 – 2.366666667) 3.074206845 14.7
= 11.46666666 x 3.074206845 14.7
= 35.25090514
14.7 = 2.398020758
Wale = 2.40 mm2
= (12.4 – 4.5) 3.074206845
14.7 = 7.9 x 3.074206845
14.7
= 24.28623408 14.7
= 1.652124767 Course = 1.65 mm2
Extensibility Wale = 20.3% Course = 20.3%
Shear Rigidity = 123
EB5 = 123
6.616666667 = 18.58942065 = 18.59 N/m
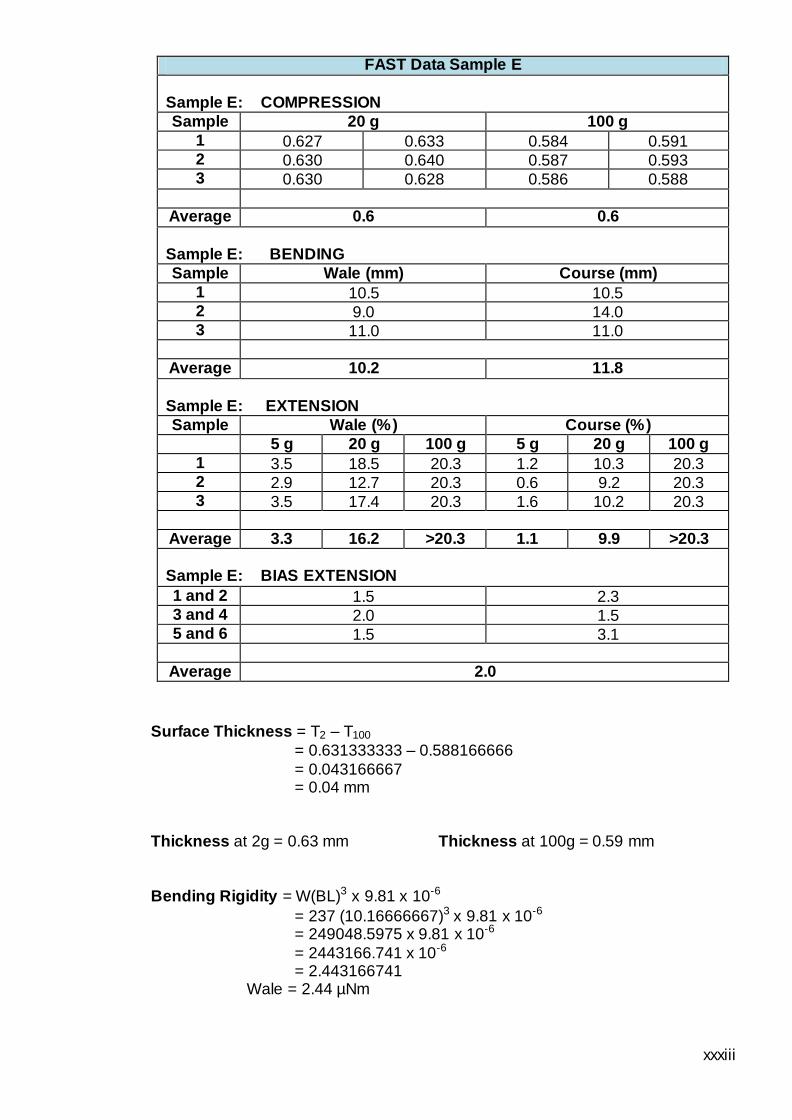
xxxiii
FAST Data Sample E
Sample E: COMPRESSION
Sample 20 g 100 g
1 0.627 0.633 0.584 0.591 2 0.630 0.640 0.587 0.593 3 0.630 0.628 0.586 0.588
Average 0.6 0.6
Sample E: BENDING
Sample Wale (mm) Course (mm)
1 10.5 10.5 2 9.0 14.0 3 11.0 11.0
Average 10.2 11.8
Sample E: EXTENSION
Sample Wale (%) Course (%)
5 g 20 g 100 g 5 g 20 g 100 g
1 3.5 18.5 20.3 1.2 10.3 20.3 2 2.9 12.7 20.3 0.6 9.2 20.3 3 3.5 17.4 20.3 1.6 10.2 20.3
Average 3.3 16.2 >20.3 1.1 9.9 >20.3
Sample E: BIAS EXTENSION
1 and 2 1.5 2.3 3 and 4 2.0 1.5 5 and 6 1.5 3.1
Average 2.0
Surface Thickness = T2 – T100
= 0.631333333 – 0.588166666
= 0.043166667 = 0.04 mm
Thickness at 2g = 0.63 mm Thickness at 100g = 0.59 mm
Bending Rigidity = W(BL)3 x 9.81 x 10-6
= 237 (10.16666667)3 x 9.81 x 10-6 = 249048.5975 x 9.81 x 10-6
= 2443166.741 x 10-6 = 2.443166741
Wale = 2.44 µNm

xxxiv
= 237 (11.83333333)3 x 9.81 x 10-6
= 392707.9024 x 9.81 x 10-6 = 3852464.523 x 10-6 = 3.852464523
Course = 3.85 µNm
Formability = (E20 – E5) B
14.7
= (16.2 – 3.3) 2.443166741 14.7
= 12.9 x 2.443166741 14.7
= 31.51685096
14.7 = 2.144003467
Wale = 2.14 mm2
= (9.9 – 1.133333333) 3.852464523
14.7 = 8.766666667 x 3.852464523
14.7
= 33.77327232 14.7
= 2.297501518 Course = 2.30 mm2
Extensibility Wale = 20.3% Course = 20.3%
Shear Rigidity = 123
EB5 = 123
1.983333333 = 62.01680673
= 62.02 N/m

xxxv
G. FAST Fingerprints
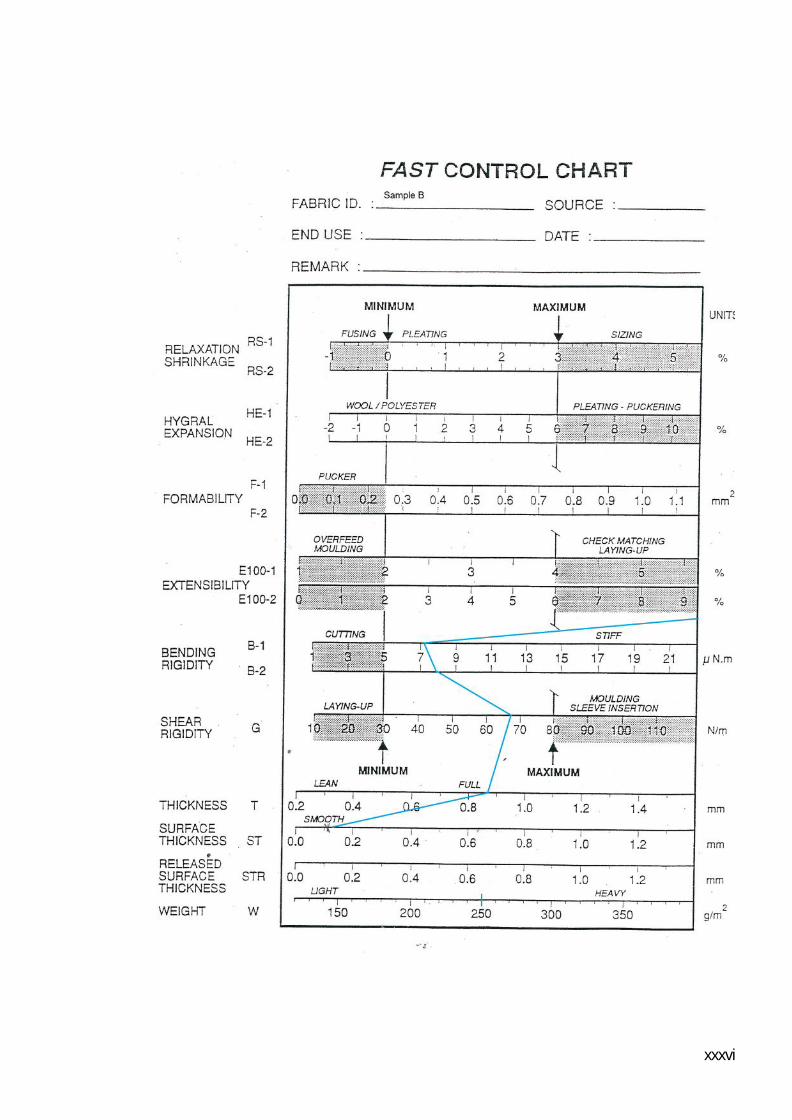
xxxvi
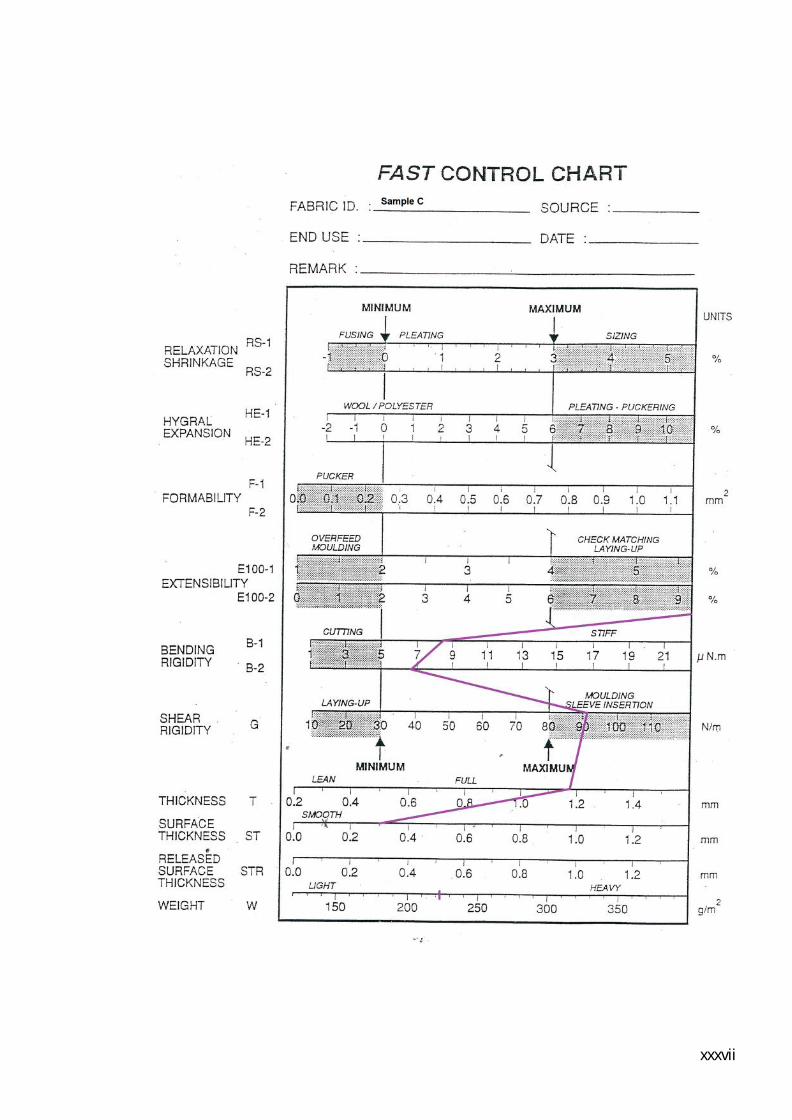
xxxvii

xxxviii
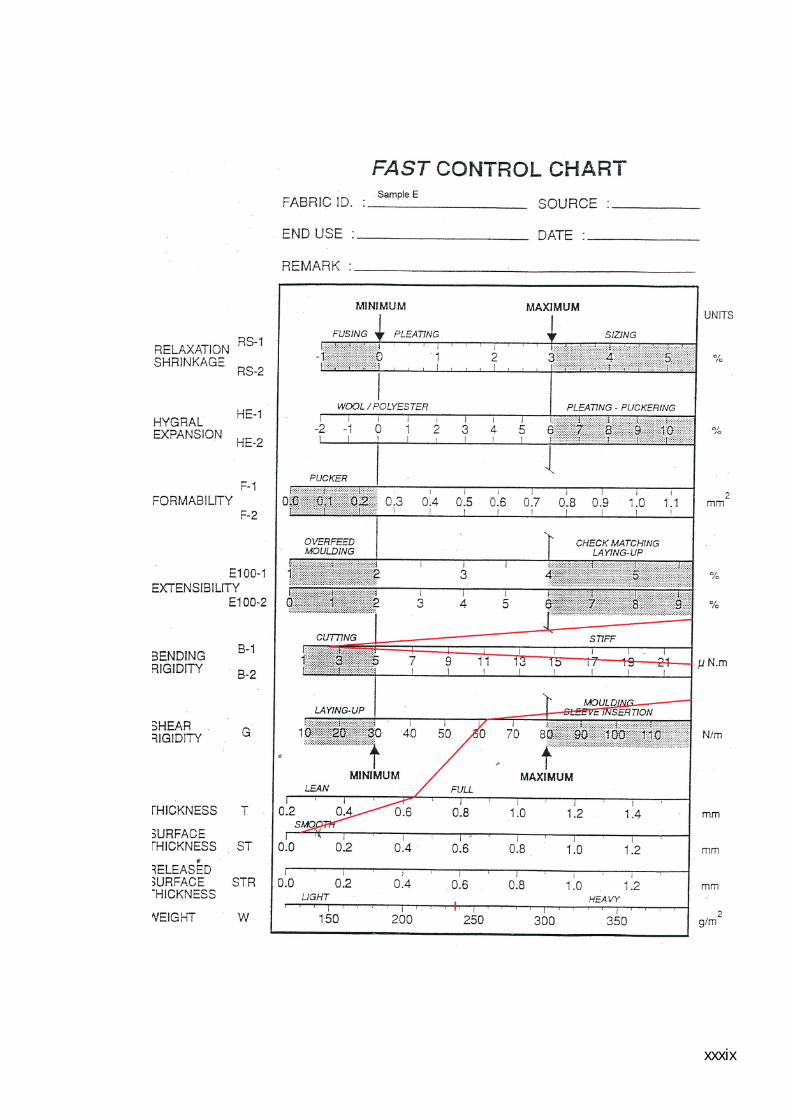
xxxix
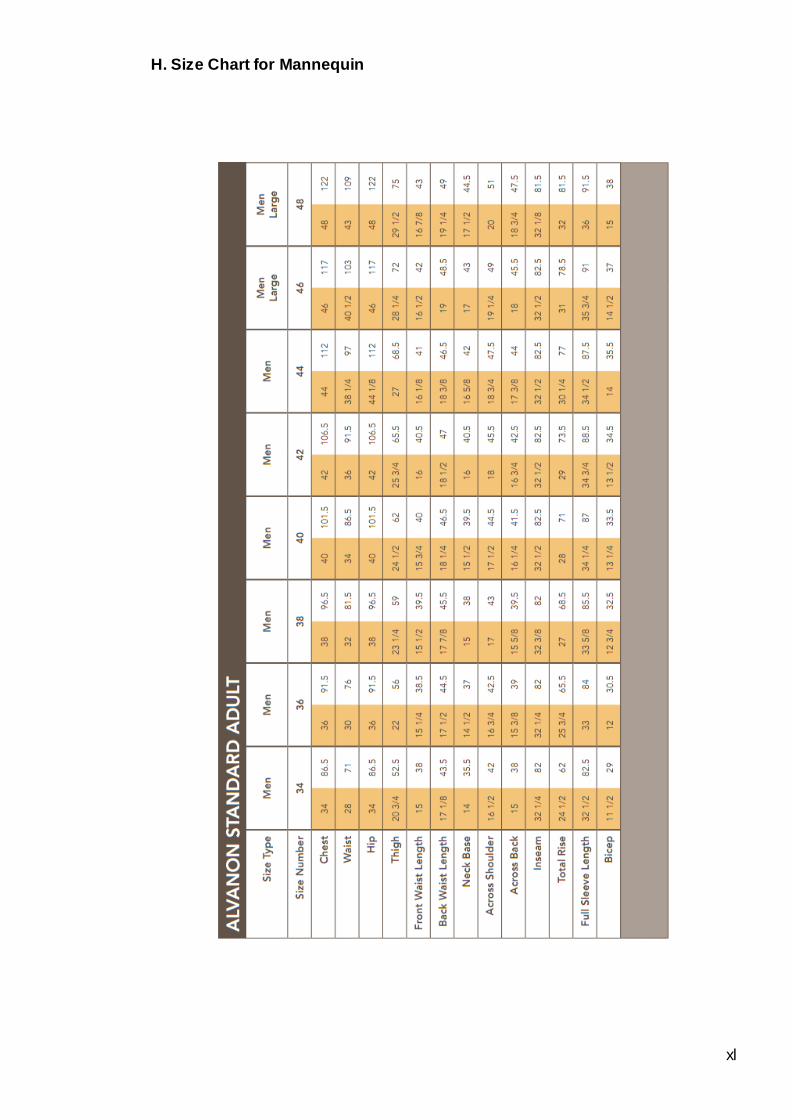
xl
H. Size Chart for Mannequin