categorical statistical approach to satellite retrieved
TRANSCRIPT

Vol. 8(43), pp. 2123-2137, 18 November, 2013
DOI 10.5897/SRE2013.5512
ISSN 1992-2248 © 2013 Academic Journals
http://www.academicjournals.org/SRE
Scientific Research and Essays
Full Length Research Paper
Categorical statistical approach to satellite retrieved rainfall data analysis in Nigeria
Semire Folasade Abiola1,2, Rosmiwati Mohd-Mokhtar1*, Widad Ismail1, Norizah Mohamad1, and J. S. Mandeep3
1School of Electrical and Electronic Engineering, Universiti Sains Malaysia, Engineering Campus, 14300, Nibong Tebal,
Pulau Pinang, Malaysia. 2Department of Electronic and Electrical Engineering, Ladoke Akintola University of Technology, P.M.B 4000,
Ogbomoso, Nigeria. 3Department of Electrical, Electronic and System Engineering, Universiti Kebangsaan Malaysia, 43600, Bangi, Selangor,
Malaysia.
Accepted 6 August, 2013
This paperwork describes a comprehensive statistical assessment of rain gauge and satellite- based monthly and annual rainfall measurements over Nigeria during the period of 2001 to 2010. Two statistical methods were empolyed for inter-comparison and validation of the Tropical Rainfall Measuring Mission - TRMM 3B43 V7 rainfall product. TRMM was selected because of the recently developed algorithms to estimate 3D rain distribution from the visual spectrum radiance, radar and microwave sensors. The results of the continuous statistical assessment of the rainfall algorithms show good agreement with rain gauge measurement in term of correlation coefficient and improved mean error tests. The geometric mean of correlation coefficient from all the locations for annual, monthly, wet and dry period are 0.43, 0.79, 0.64, and 0.41 respectively. The categorical analysis assessment is based on the International Telecommunication Union for Radio-communication (ITU-R) recommended threshold for radio propagation. The results of Accuracy and FBI for ITU-R recommendation threshold of 1 to 10% percentage error for radio propagation applications are 0.629 and 0.901 for annual while that of monthly are 0.558 and 0.416. The overall performance of the TRMM based rainfall assessment is encouraging but more improvement is still needed for accurate and sufficient global rainfall estimation. Key words: TRMM 3B43 V6, satellite data, cross-validation, categorical statistics, radio propagation, ITU-R.
INTRODUCTION Advancement in satellite technology and remote sensing techniques have brought about the development and launching of space borne measuring instruments for continuous monitoring of rainfall and its associated parameters in space and time. To a certain extent, a number of meteorological weather satellites have been launched in the last few decades and some of these satellite rainfall products are freely available in real time
on the internet via the web or File Transfer Protocol (FTP) such as PERSIANN, CMORPH, and GSMAP etc. Satellite based precipitation estimates provide greater spatial coverage with higher temporal frequency than many of the current rain gauge networks.
Satellite rainfall estimation coupled with ground validation and calibration, offers a good view for an accurate and global rainfall database particularly for
*Corresponding author. E-mail: [email protected]. Tel: +604-5996056. Fax: +604-5941023.

2124 Sci. Res. Essays remote areas and oceans (Arkin and Xie, 1994; Chandrasekar et al., 2008). However, coarse spatial resolution of many of the satellite precipitation products currently available is one of the hindrances to their prevailing adoption in many applications and the fact that the precipitation products are derived indirectly from either thermal or microwave radiance observations makes them less acceptable to direct measurements taken via rain gauge. Nevertheless, satellite data remain the most valuable source of information on clouds and rainfall, most importantly over water bodies where conventional rain gauge measurement is practically impossible (Todd and Bailey, 1995). Recent research has shown that two-third of the world precipitation falls in the tropics and that the region is covered with 75% of oceans and seas (NOAA, 2013). Consequently, precipitation over tropics can only be best quantified through the use of satellite weather monitoring instruments.
In recent studies, several satellite retrieval rainfall products have been subjected to cross-validation tests over many regions to ascertain the accuracy of their rainfall estimations. The performance of satellite precipitation estimates over land areas has been reported to be highly dependent on the rainfall regime and the temporal and spatial scale of the retrievals (Ebert, 2007). The continuous statistical approach to validation studies of satellite retrieval algorithms in the work of (Ji, 2006; Wagner et al., 2008; Omotosho and Oluwafemi, 2009; Jianxin and David, 2009) has pointed out good agreement between satellite and ground rainfall data at different percentage bias errors which ranges from 1 to 15%.
In the validation study reported on Nigeria rainfall estimate by (Omotosho and Oluwafemi, 2009), TRMM 3B43 V6 among other satellite rainfall products presented by TRMM is found to be in agreement with ground measurement. However, in the study carried out on East Africa validation examination on NOAA-CPC Rainfall Estimator known as RFE, the rainfall estimation is found not to be in agreement with in-situ rain gauge data over a study region in Ethiopia (Dinku et al., 2007). The study specifically observed the significant role of topography in satellite rainfall estimation. The algorithms are reported to be incapable of detecting orographically induced rainfall, which does not imply that the algorithms are unable to detect the daily occurrence of precipitation, but however, it leads to a low detection rate relative to magnitude of rainfall on a daily basis. Therefore, continuous statistical analysis has been reported not to be a good approach in satellite retrieval algorithms inter-comparison performance evaluation (Matina et al., 2006).
Although TRMM precipitation products have been extensively validated at ground sites around the world (Adler et al., 1994; Ferraro and Marks, 1995; Petty and Krajewski, 1996; Tsintikidis et al., 1997; Conner and Petty, 1998; Hsu et al., 1999; Mircea and Emmanouil, 2001), very few of these sites lie in Africa. Thus, an
explicit validation for Africa is necessary to ensure confidence in the TRMM estimates for the region. Hence, in this study, comprehensive categorical statistical analysis is done on satellite-ground rainfall measurement over Nigeria by comparing TRMM 3B43 V7 rainfall product with rain gauge data. Owing to lack of sparingly deployed rain gauge networks and inadequate controlled measurement of rainfall data, the analysis is limited to state capitals of the country where measured rainfall data are available.
STUDY AREA
Precipitation measurements in Nigeria are inadequately measured and controlled as a result of its sparingly populated rain gauge networks. In fact, most remote areas are not covered by precipitation measuring instruments. With the advent of satellite technologies and applications such as broadband internet facilities, satellite televisions and GSM for mobile communications, accurate measurement of rainfall is very crucial. Rainfall has long been recognised as one of the atmospheric effects that has serious impacts on radio wave propagation (Aydin and Daisley, 2002; Pratt et al., 2003; Mandeep et al., 2008). The effect becomes more important as frequency of operation increases especially above 12 GHz. Therefore, for a reliable and efficient communication design and many other applications, precipitation measurements are needed to be adequately quantified and controlled. In view of this, satellite based rainfall estimation which offers greater spatial coverage with higher temporal frequency than ground measurement is becoming more popular. Hence, need to evaluate the performance of the satellite rainfall retrieval algorithms over Nigeria.
Ground measurement data for Nigeria
Nigeria lies wholly within the tropical zone, between latitude of 4°N and 14°S and longitudes of 2°W and 15°E. The country is divided into six regions: North-West, North-East, North-Central, South-West, South-East and South-South. There are wide climatic variations for the regions of the country. The rainfall event and its associated rain accumulation increases from North-east region down to the South-south region. In Nigeria, there are two distinct seasons: a wet season from April to October, with generally lower temperatures, and a dry season from November to March, with midday temperatures of 38°C or more. In the coastal and south-eastern portions of Nigeria, the rainy season usually begins in February or March as moist Atlantic air, known as the southwest monsoon, invades the country. The peak of the rainy season occurs through most of northern Nigeria in August, when air from the Atlantic covers the entire country. In southern regions, this period marks the

MAP OF NIGERIA
5 E 10 E 15 E
4 N
5 N
6 N
7 N
8 N
9 N
10 N
11 N
12 N
13 N
14 N
R
R
R
R
R
R
RR
RR
RR
RRR
R
R
R R
R R
RR
R R
R
R
RR
R
RR
R
R
R
R
R- rain gauge location
Figure 1. Map of Nigeria showing locations of state capitals.
August dip in precipitation known as August break. Sometimes around November of the year, moist air from the Atlantic converges with hot, dry and often dust-laden air from the Sahara locally known as the Harmattan.
The study locations are divided into six different regions according to the country’s classification and each region is represented by its state capitals. The location of the rain gauges as represented by its state capital is as shown in Figure 1.
Ten-year rain data from 2001 to 2010 are collected from network of rain gauges of Nigeria Meteorological Centre (NiMet), Osodi, Lagos. The missing data in this study is filled using Coefficient of Correlation Weighting Method (CCWM) as defined in Equation 1.
n
i mi
n
i mii
m
r
rPP
1
1 (1)
where, mP is the missing precipitation value to be
interpolated (which also represents precipitation at the
base station m); n is the number of stations; iP is the
precipitation at station, i and 2
mir which is the ratio of
covariance of two data sets to the product of standard deviations of data sets (Ramesh et al., 2005).
mi PP
mimi
PPr
,cov2 (2)
TRMM based data for Nigeria The Tropical Rainfall Measuring Mission (TRMM) satellite
Abiola et al. 2125 was the first weather space borne measuring instruments launched in November 1997 (Kummerow et al., 1998). It is designed to take measurements of rainfall and its associated parameters in the tropics, but since the orbit has been increased to 403 km altitude in August 2001, the swaths of TRMM Microwave Imager (TMI) now covers up to 50° North and South Pole. The details of TRMM missions and instruments on the satellite can be found in (Kummerow et al., 1998). The basic TRMM sensors are passive microwave radiometers known as the TRMM Microwave Imagers (TMI), a microwave radar unit called Precipitation Radar (PR) and a visible and infrared radiometer tagged Visible and Infrared Scanner (VIRS). These sensors are combined together with some other infrared (IR) and gauge measurement to produce rainfall products such as TRMM 3B42 V7, 3B43 V7, TMI 2A12, and many others.
In this work, the TRMM space borne rainfall sensor is employed because of the newly developed algorithms to estimate the 3D rain distribution from the visual spectrum radiance, radar and microwave sensor on the basis of multi-sensor approach for precipitation analysis. The TRMM rainfall product is a real time data logging system for which data set is produced six to nine hours after acquisition. TRMM 3B43 V7 database is a combination scheme for precipitation estimates from different satellite measuring instruments such as microwave infrared, radar data and rain gauge measurements. The algorithm is based on the concepts of Huffman (Huffman et al., 1995). The TRMM 3B43 V7 is a monthly gridded rainfall estimate with spatial resolution of 0.25° by 0.25°, which is a product of rain archives of different estimates (NASA, 2011). The area covered by one tile of 0.25° by 0.25° correlates to an area of approximately 25 km by 25 km in Nigeria. The topographic feature of the locations considered is shown in Table 1. STATISTICAL METHODS
In this paper, there are two statistical methods employed: the continuous and categorical approach. Categorical statistical approach has been reported to be the most appropriate method used in precipitation retrieving algorithms validation (Matina et al., 2006). The details of both methods are explained in “continuous statistical method” and “categorical statistical method” part of this work.
Continuous statistical method
A number of continuous statistical measures are employed to determine the ability of TRMM 3B43 V7 algorithms to accurately identify and quantify the magnitude of rainfall and to detect its associated systematic errors. The statistical measures for the performance assessment are as expressed in Equations 3 to 7.
n
ii
ii
iGD
GDSD
NE
1
1 MAE (3)

2126 Sci. Res. Essays Table 1. Topographic features and 10 year annual mean average rainfall accumulation of TRMM 3B43 V6 and NiMet.
Location Latitude Longitude Altitude
(m)
Surface
Temperature (C)
Mean surface rainfall (mm)
Mean TRMM 3B43 V6 rainfall (mm)
North West Nigeria
Kaduna 10.96 8.38 605.0 30.3 1025.79 1031.29
Birini Kebbi 12.28 4.08 244.0 34.9 706.7 716.89
Kano 11.68 9.25 566.0 35.5 663.59 646.46
Kastina 12.97 7.59 590.0 35.3 588.01 591.67
Sokoto 13.1 5.27 247.0 35.6 529.46 553.96
Gusau 12.17 6.66 440.0 33.9 667.24 667.56
North East Nigeria
Bauchi 11.49 10.29 665.0 34.9 564.8 620.67
Damaturu 11.44 11.58 451.0 35.3 505.01 631.33
Dutse 11.43 9.25 452.0 34 677.16 699.22
Gombe 9.75 11.42 422.0 34.7 957.04 841.05
Jalingo 8.54 11.22 304.0 29.1 1173.88 1359.25
Maiduguri 11.85 13.01 343.0 35.9 641.87 625.88
Yola 9.28 12.45 207.0 33.1 1013.33 909
Middle belt Nigeria
Ilorin 8.48 4.55 304.0 27.4 1191.87 1205.17
Lokoja 7.81 6.74 204.0 25.3 1402.15 1301.43
Minna 9.66 6.52 152.0 25.3 1191.13 1207.02
Abuja 9.07 7.46 334.0 27.4 1306.26 1328.89
Markurdi 7.73 8.54 142.0 25.3 2153.67 1330.34
Lafia 8.29 8.34 403.0 28.9 1366.06 1184.67
Jos 9.86 8.87 1110.0 28.9 1135.27 1146.55
South West Nigeria
Abeokuta 7.17 3.35 74.0 28.9 1267.65 1278.21
Ado Ekiti 7.42 5.13 363.0 28.7 1331.56 1247.8
Akure 7.25 5.2 303.0 30.4 1331.56 1247.8
Ibadan 7.36 3.96 134.0 28.8 1273.1 1366.23
Ikeja 6.35 3.2 38.0 28.2 1426.84 1204.92
Ogbomoso 8.15 4.25 353.8 34 1031.44 1124.98
Osogbo 7.79 4.52 229.0 32.1 1337.92 1311.74
South East Nigeria
Abakaliki 6.18 8.7 149.0 26.4 2706.04 2463.51
Akwa 6.12 7.04 159.0 26 2391.17 1953.72
Enugu 6.85 7.4 139.0 26.9 2335.47 1588.78
Owerri 5.19 7.07 158.0 25.3 2771.2 2502.69
Umuahia 5.3 7.33 165.0 25.3 2771.99 2483.61
South South Nigeria
Asaba 6.1 6.44 152.0 25.5 1913.05 1901.78
Benin 6.35 5.62 42.0 25 1641.58 1977.69
Calabar 4.96 8.34 370.0 23.7 3139.44 3372.35
Port Harcourt 4.83 6.98 18.0 24.5 2675.05 2760
Uyo 5 7.57 163.0 24.7 2721.61 2549.76
Yenago 4.55 6.16 93.0 23.4 2634.59 2772.41

Abiola et al. 2127
Table 2. 2 x 2 Contingency table.
Measured Values (Rain Gauge)
Estimated values (TRMM 3B43 V6)
Yes No Total
Yes Hit False Alarm Total
No Misses Null Total
Total Total Total No. of samples
i
iE
F
1
1 Fitness, (4)
n
iii
ii
SDGD
SDGD
N 1
1 SMAPE (5)
n
i ii GDSDN 1
21 RMSE (6)
Pearson correlation coefficient,
ii GDSD
ii
SG
GDSDr
,cov2 (7)
Where iSD is the TRMM estimated precipitation, iGD is the
corresponding ground measurement, N is the number of data point,
iE is the mean absolute error, is the standard deviation and
cov is the covariance between the ground and satellite data. The Bias or Mean Absolute Error (MAE) estimates the average
difference between the satellite and gauge values while Fitness measures the accuracy of the prediction algorithm. The values of fitness measure ranges from 0 to 1, with value of 1 corresponding to an ideal estimate (Wilks, 1995). Improved Symmetric Mean Absolute Percentage Error (SMAPE) is an accuracy measure based on percentage (or relative) error (Armstrong, 1985; Flores, 1986). It measures the symmetric difference between the estimated and measured values. Root Mean Square error (RMSE) measures the average magnitude of the errors with a focus on extreme values
while Pearson’s correlation coefficient SGr evaluates the degree of
linear association between the two datasets (Ebert and McBride, 2000).
Categorical statistical method
The 2 × 2 contingency table is employed to define categorical measures for the verification of satellite algorithms estimate against rain gauge measurement. A contingency table is a scatter plot for a categorical variable. The entries of the table simply represent a convenient presentation of the raw verification dataset from which many statistical inferences can be drawn (Murphy, 1993, 1995). To verify the accuracy of the algorithms estimate, four combinations between the estimate and the measured data are used. These are: Hit, Miss, False alarm and Null. The total numbers of measured and algorithm’s estimated rainfall occurrences and non occurrences are given on the lower and right sides of the contingency table, and are called the marginal distribution. Hit represents the event estimated to occur and did occur, Miss describes the event estimated not to occur but did occur, False Alarm evaluates the event estimated to
occur but did not occur and Null represents the event estimated not to occur and did not occur. The contingency table is shown in Table 2. The validation analysis is based on the following:
(i) If the percentage bias error is within the threshold and it is positive, allocate “Hit” (ii) If the percentage bias error is within the threshold and it is negative, allocate “False Alarm” (iii) If the percentage bias error is more than the threshold and it is positive, allocate “Misses” (iv) If the percentage bias error is more than the threshold and it is negative, allocate “Null”
The following expressions are computed from the contingency table to describe the particular aspects of TRMM algorithms performance relative to frequency of detection.
Misses Hit
Hit POD
(8)
Alarm False Hit
Alarm False FAR
(9)
Misses Hit
Alarm False Hit FBI
(10)
Total
Null Hit Accuracy
(11)
The probability of detection (POD) measures the percentage of real precipitation events that are correctly detected by the satellite algorithms, the false alarm ratio (FAR) measures the fraction of false alarms in the satellite estimates, the Accuracy estimates the percentage of the estimated values that are correctly predicted while the frequency bias index (FBI) is the ratio of satellite rain estimates to the actual precipitation events (Scheel et al., 2011). The percentage bias threshold recommendation for meteorological applications is from 1 to 20%. However, 1 to 10% bias error is recommended by the ITU-R for radio propagation applications (ITU-R P.618, 2008). Therefore, emphasis is laid on the ITU-R recommendation because this work is tailored to have applications in radio wave propagation.
PERFORMANCE EVALUATION
The suitability of TRMM 3B43 V7 rainfall retrieval algorithms for Nigeria rainfall estimation has been examined. The results of continuous statistical analysis

2128 Sci. Res. Essays reveal that there is random negative and positive bias in the satellite estimation for the entire database considered. For all the locations, the highest and the least positive bias for annual analysis are 336.11 and 0.32 mm which correspond to location Benin and Gusau respectively. While that of monthly, wet and dry are 31.68, 5.65 and 10.23 mm for highest bias and 1.4, 0.004 and 0.0 mm for lowest bias respectively.
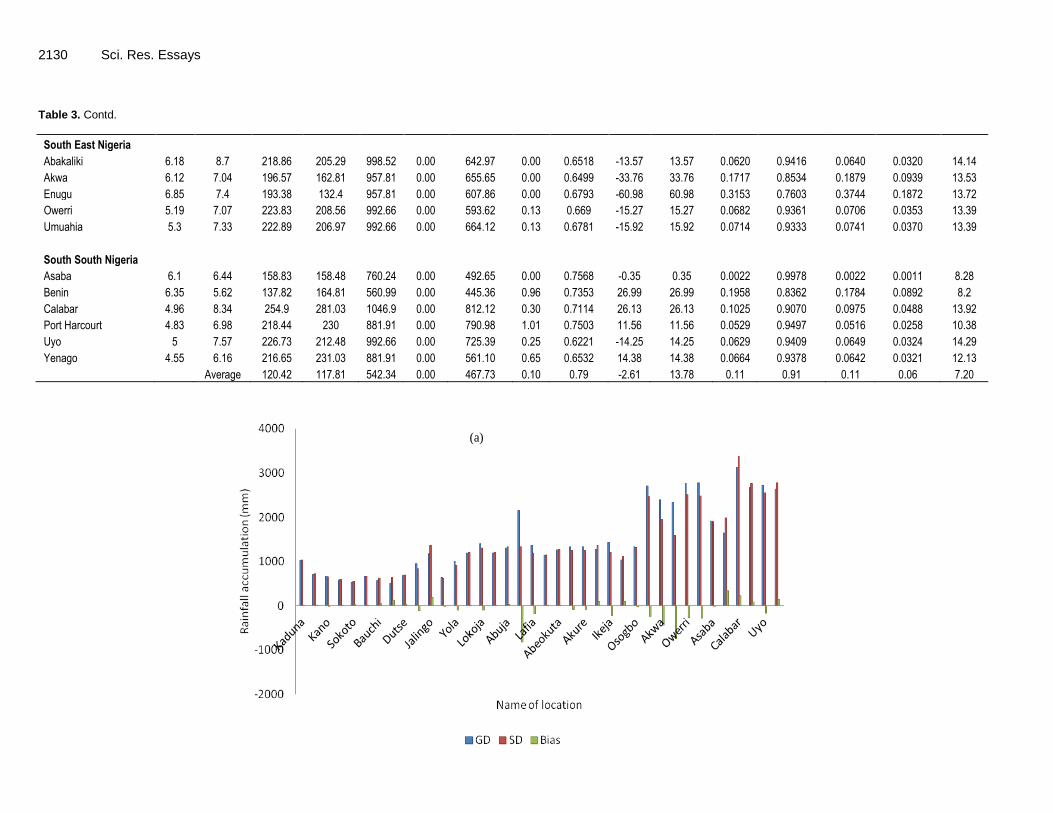
The monthly inter-comparative analysis between the grounds measured and satellite retrieved rainfall is shown in Table 3. The Mean Absolute Error (MAE) for all the stations ranges from 0.4007 to 0.0009. The highest MAE is found in the FCT Abuja while the lowest is from Abeokuta. The comparative analysis plot of ten year monthly average along with bias error is shown in Figure 2(a-d). The scattered plot of 10- year rainfall accumulation between the satellite and ground data is shown in Figure 3(a). The plot shows good correlation coefficient R
2 of 0.8522. The Fitness of TRMM 3B43 V7
estimated algorithm as compared with ground measurement is found to be very high for all stations. The highest Fitness is 0.9991 which corresponds to Abeokuta station and the least on the table is linked to Abuja with corresponding value of 0.7139. The highest values for Improved SMAPE and RMSE are 0.2401 and 14.99 while the lowest values are 0.0005 and 2.38 with corresponding locations at Markurdi and Abeokuta respectively.
The geometrical mean of correlation coefficient for annual, monthly, wet and dry are 0.43, 0.79, 0.64, and 0.41 respectively. The variation in the correlation coefficient is shown in Figure 3(b). The estimates of the TRMM algorithms seem to be affected by season. The dry season has the lowest correlation coefficient value, followed by annual, wet, and monthly which gives an indication that TRMM algorithms underestimate rainfall in dry season compared to wet season. The details are as shown in Table 4. Similar results are reported by researchers across the globe (Adeyewa and Kenji, 2003; Feidas, 2009; Sergio et al., 2009). This may be as a result of surface background effects which are largely influenced by topography and orological effect ensuing from region elevated terrain associated with barrier width, slope steepness, updraft speed and wind ward shielding from larger weather and rain bearing systems (Gomez, 2007). The plot of correlation coefficient as a function of stations is shown in Figure 4(a-d).
Some rain or no rain categorical statistics such as accuracy, frequency bias index, probability of detection (POD), and false alarm ratio (FAR) are computed for different percentage bias thresholds as follows: 5, 10, 15 and 20%. The overall accuracy is season dependent. It increases from annual through wet, monthly and dry (Table 5). The accuracy values for annual, monthly, wet, and dry season are 0.629, 0.553, 0.559 and 0.583 respectively at 10% bias threshold. These values indicate that more than half of all rainfall observations for the
average of 10 years are correctly detected and estimated. The plot is as given in Figure 5(a).
The frequency bias index increases as threshold bias increases for all seasons. FBI for annual prediction ranges from 0.613 to 1.406, which indicates an underestimation at lower bias threshold and overestimation of measured accumulation at higher bias threshold. For monthly, wet and dry season, FBI underestimates at 29.4 to 62.3%, 32.7 to 74.6% and 22.8 to 39.6% for monthly, wet and dry season respectively. Similar result was reported in researchers (Gottschalck et al., 2005; Su et al., 2008; Daniel et al., 2009). The plot is as shown in Figure 5(b). The 10% bias shows almost accurate estimation of ground rain at 0.901.
The probability of detection increases gradually from 0.449 for 5% bias threshold to 0.666 for 20%. POD decreases from annual, followed by wet, monthly and dry as percentage bias increases. For 10% bias, its POD is 0.571 which indicates that more than half of the observed rain events were correctly detected by TRMM algorithms. The plot of the variation is as shown in Figure 5(c).
The false alarm ratio for both threshold bias and seasonal changes follows the same trend. The plot of false alarm ratio as a function of seasonal changes is shown in Figure 5(d). The minimum FAR is 0.113 for dry season rainfall accumulation at 5% bias threshold. This value indicates that approximately 10% of the predicted rainfall event did not occur. FAR for dry seasonal analysis for all bias thresholds is lower than that of annual, monthly and wet season. Conclusion A ten year monthly rainfall measurement from 2001 to 2010 was selected for validation analysis and performance evaluation of space borne rainfall estimation of TRMM 3B43 V7 algorithms. Two different statistical approaches were employed. The results for continuous statistical analysis for RMSE, Improved SMAPE and Correlation Coefficient reveal good agreement. The best correlation coefficient, RMSE and Improved SMAPE for the algorithm 3B43 versus gauge are 0.8522, 2.38 and 0.005 respectively. However, correlation coefficient has been reported not to be the appropriate measure in rain algorithm inter-comparisons because frequency distribution of rain is a much skewed one and not Gaussian (Martina et al., 2006).
In view of this, categorical statistical approach was used for further testing of the algorithms. The result of categorical statistic of rain or no rain occurrence reveals that satellite estimate’s performance on annual and monthly basis for Nigeria is good. This is as a result of low percentage of false alarm ratios of approximately 10% recorded in the analysis. The results of accuracy and FBI for ITU-R recommendation threshold of 1 to 10% percentage error for radio propagation applications are

Abiola et al. 2129 Table 3. Continuous statistic analysis for monthly inter-comparison.
Lat Lon Surface rainfall (mm)
TRMM 3B43 V6 rainfall
(mm)
Surface
rainfall (mm)
TRMM 3B43 V6
rainfall (mm) Correlation Bias
Absolute Bias
MAE Fitness of
TRMM SMAPE
Improved SMAPE
RMSE
North West Nigeria Average Average Max Min Max Min
Kaduna 10.96 8.38 72.6 85.94 407.67 0.00 506.17 0.00 0.8065 13.34 13.34 0.1837 0.8448 0.1683 0.0841 6.26
Birini Kebbi 12.28 4.08 57.25 59.74 329.11 0.00 321.11 0.00 0.9259 2.49 2.49 0.0435 0.9583 0.0426 0.0213 2.64
Kano 11.68 9.25 55.85 53.87 360.98 0.00 447.94 0.00 0.8982 -1.98 1.98 0.0355 0.9658 0.0361 0.0180 3.33
Kastina 12.97 7.59 49.57 49.31 308.73 0.00 369.14 0.00 0.9177 -0.26 0.26 0.0052 0.9948 0.0053 0.0026 2.74
Sokoto 13.1 5.27 43.11 46.16 273.21 0.00 279.19 0.00 0.913 3.05 3.05 0.0707 0.9339 0.0683 0.0342 2.38
Gusau 12.17 6.66 51.9 55.63 295.66 0.00 349.86 0.00 0.9046 3.73 3.73 0.0719 0.9329 0.0694 0.0347 2.87
North East Nigeria
Bauchi 11.49 10.29 47.37 51.72 282.72 0.00 290.67 0.00 0.9014 4.35 4.35 0.0918 0.9159 0.0878 0.0439 2.83
Damaturu 11.44 11.58 42.84 52.61 246.38 0.00 283.77 0.00 0.8233 9.77 9.77 0.2281 0.8143 0.2047 0.1024 3.86
Dutse 11.43 9.25 56.55 58.27 360.98 0.00 482.84 0.00 0.916 1.72 1.72 0.0304 0.9705 0.0300 0.0150 3.14
Gombe 9.75 11.42 79.37 70.09 422.36 0.00 399.28 0.00 0.8965 -9.28 9.28 0.1169 0.8953 0.1242 0.0621 4.07
Jalingo 8.54 11.22 92.9 113.27 367.75 0.00 604.77 0.00 0.8237 20.37 20.37 0.2193 0.8202 0.1976 0.0988 7.13
Maiduguri 11.85 13.01 53.03 52.16 320.28 0.00 550.97 0.00 0.886 -0.87 0.87 0.0164 0.9839 0.0165 0.0083 3.43
Yola 9.28 12.45 82.64 75.75 431.71 0.00 334.97 0.00 0.9045 -6.89 6.89 0.0834 0.9230 0.0870 0.0435 3.97
Middle belt Nigeria
Ilorin 8.48 4.55 99.03 100.43 319.11 0.00 369.16 0.01 0.8297 1.4 1.4 0.0141 0.9861 0.0140 0.0070 4.65
Lokoja 7.81 6.74 117.99 108.45 549.28 0.00 538.48 0.00 0.7078 -9.54 9.54 0.0809 0.9252 0.0843 0.0421 8.03
Minna 9.66 6.52 85.75 100.59 390.89 0.00 491.36 0.00 0.8505 14.84 14.84 0.1731 0.8525 0.1593 0.0796 5.59
Abuja 9.07 7.46 79.06 110.74 365.43 0.00 497.31 0.00 0.796 31.68 31.68 0.4007 0.7139 0.3338 0.1669 6.73
Markurdi 7.73 8.54 180.91 110.86 929.34 0.00 504.57 0.00 0.6188 -70.05 70.05 0.3872 0.7209 0.4802 0.2401 14.99
Lafia 8.29 8.34 117.78 98.72 474.02 0.00 390.98 0.01 0.6232 -19.06 19.06 0.1618 0.8607 0.1761 0.0880 8.66
Jos 9.86 8.87 75.78 95.55 346.32 0.00 477.03 0.06 0.8051 19.77 19.77 0.2609 0.7931 0.2308 0.1154 6.02
South West Nigeria
Abeokuta 7.17 3.35 106.62 106.52 348.89 0.00 355.49 0.00 0.918 -0.1 0.1 0.0009 0.9991 0.0009 0.0005 3.12
Ado Ekiti 7.42 5.13 113.29 103.98 468.21 0.00 289.32 0.02 0.7325 -9.31 9.31 0.0822 0.9241 0.0857 0.0428 6.11
Akure 7.25 5.2 113.29 103.98 468.21 0.00 289.32 0.02 0.7325 -9.31 9.31 0.0822 0.9241 0.0857 0.0428 6.11
Ibadan 7.36 3.96 107.25 113.85 348.89 0.00 306.96 0.23 0.882 6.6 6.6 0.0615 0.9420 0.0597 0.0299 3.75
Ikeja 6.35 3.2 118.02 100.41 474.59 0.00 295.12 0.00 0.8355 -17.61 17.61 0.1492 0.8702 0.1612 0.0806 5.87
Ogbomoso 8.15 4.25 95.56 94.94 286.59 0.00 375.24 0.01 0.8118 -0.62 0.62 0.0065 0.9936 0.0065 0.0033 4.6
Osogbo 7.79 4.52 111.83 109.31 407.49 0.00 380.80 0.00 0.7889 -2.52 2.52 0.0225 0.9780 0.0228 0.0114 5.4
2130 Sci. Res. Essays Table 3. Contd.
South East Nigeria
Abakaliki 6.18 8.7 218.86 205.29 998.52 0.00 642.97 0.00 0.6518 -13.57 13.57 0.0620 0.9416 0.0640 0.0320 14.14
Akwa 6.12 7.04 196.57 162.81 957.81 0.00 655.65 0.00 0.6499 -33.76 33.76 0.1717 0.8534 0.1879 0.0939 13.53
Enugu 6.85 7.4 193.38 132.4 957.81 0.00 607.86 0.00 0.6793 -60.98 60.98 0.3153 0.7603 0.3744 0.1872 13.72
Owerri 5.19 7.07 223.83 208.56 992.66 0.00 593.62 0.13 0.669 -15.27 15.27 0.0682 0.9361 0.0706 0.0353 13.39
Umuahia 5.3 7.33 222.89 206.97 992.66 0.00 664.12 0.13 0.6781 -15.92 15.92 0.0714 0.9333 0.0741 0.0370 13.39
South South Nigeria
Asaba 6.1 6.44 158.83 158.48 760.24 0.00 492.65 0.00 0.7568 -0.35 0.35 0.0022 0.9978 0.0022 0.0011 8.28
Benin 6.35 5.62 137.82 164.81 560.99 0.00 445.36 0.96 0.7353 26.99 26.99 0.1958 0.8362 0.1784 0.0892 8.2
Calabar 4.96 8.34 254.9 281.03 1046.9 0.00 812.12 0.30 0.7114 26.13 26.13 0.1025 0.9070 0.0975 0.0488 13.92
Port Harcourt 4.83 6.98 218.44 230 881.91 0.00 790.98 1.01 0.7503 11.56 11.56 0.0529 0.9497 0.0516 0.0258 10.38
Uyo 5 7.57 226.73 212.48 992.66 0.00 725.39 0.25 0.6221 -14.25 14.25 0.0629 0.9409 0.0649 0.0324 14.29
Yenago 4.55 6.16 216.65 231.03 881.91 0.00 561.10 0.65 0.6532 14.38 14.38 0.0664 0.9378 0.0642 0.0321 12.13
Average 120.42 117.81 542.34 0.00 467.73 0.10 0.79 -2.61 13.78 0.11 0.91 0.11 0.06 7.20
(a)
(b)

Abiola et al. 2131
(a)
(b)
(c)
(c)
2132 Sci. Res. Essays
(c)
(d)
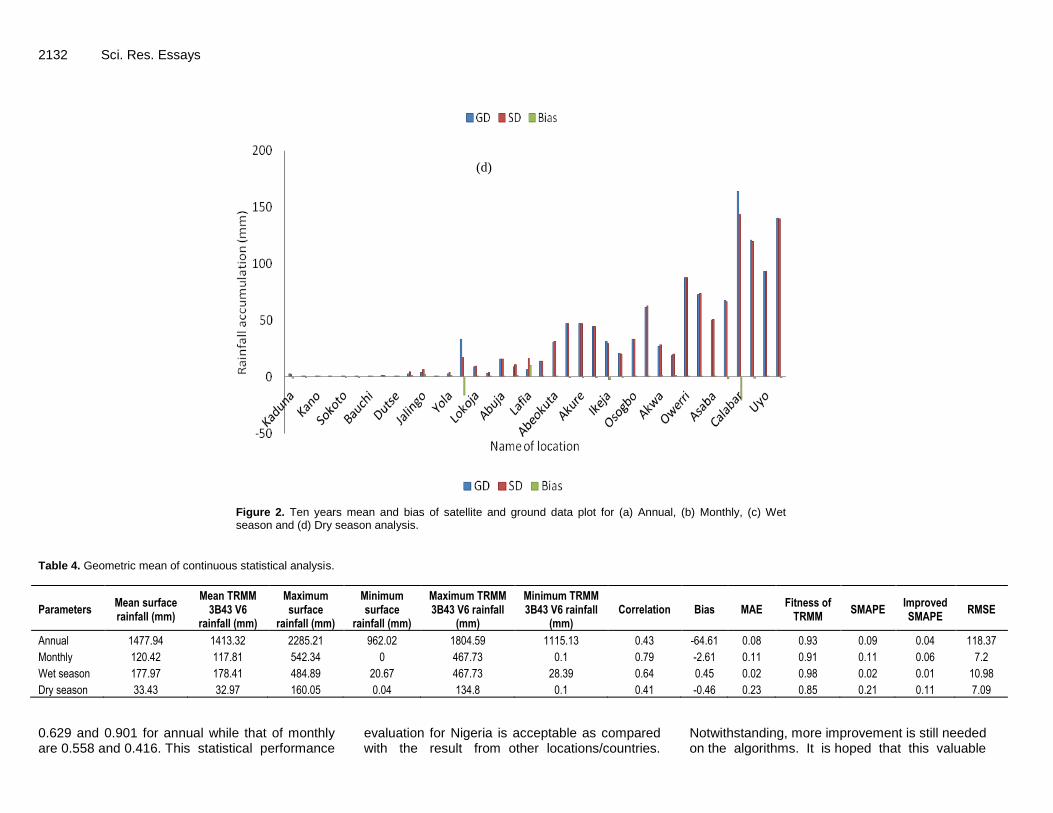
Figure 2. Ten years mean and bias of satellite and ground data plot for (a) Annual, (b) Monthly, (c) Wet season and (d) Dry season analysis.
Table 4. Geometric mean of continuous statistical analysis.
Parameters Mean surface rainfall (mm)
Mean TRMM 3B43 V6
rainfall (mm)
Maximum surface
rainfall (mm)
Minimum surface
rainfall (mm)
Maximum TRMM 3B43 V6 rainfall
(mm)
Minimum TRMM 3B43 V6 rainfall
(mm) Correlation Bias MAE
Fitness of TRMM
SMAPE Improved SMAPE
RMSE
Annual 1477.94 1413.32 2285.21 962.02 1804.59 1115.13 0.43 -64.61 0.08 0.93 0.09 0.04 118.37
Monthly 120.42 117.81 542.34 0 467.73 0.1 0.79 -2.61 0.11 0.91 0.11 0.06 7.2
Wet season 177.97 178.41 484.89 20.67 467.73 28.39 0.64 0.45 0.02 0.98 0.02 0.01 10.98
Dry season 33.43 32.97 160.05 0.04 134.8 0.1 0.41 -0.46 0.23 0.85 0.21 0.11 7.09
0.629 and 0.901 for annual while that of monthly are 0.558 and 0.416. This statistical performance
evaluation for Nigeria is acceptable as compared with the result from other locations/countries.
Notwithstanding, more improvement is still needed on the algorithms. It is hoped that this valuable

Abiola et al. 2133
Figure 3. The plot of (a) Ten year monthly accumulation of Ground and Satellite and (b) Geometric mean correlation.

2134 Sci. Res. Essays
(a)
dd
(b)
sss
(c)
ddd
(d)
Figure 4. Correlation coefficients plot for, (a) Annual (b) Monthly, (c) Wet season and (d) Dry season.

Abiola et al. 2135
Table 5. The result of categorical analysis.
Threshold percentage bias at 5% Threshold percentage bias at 10%
Accuracy FBI POD FAR POFD CSI Accuracy FBI POD FAR POFD CSI
Annual 0.621 0.613 0.449 0.228 0.225 0.399 0.629 0.901 0.571 0.305 0.366 0.472
Monthly 0.558 0.294 0.239 0.187 0.062 0.228 0.553 0.416 0.295 0.279 0.136 0.265
Wet season 0.563 0.327 0.264 0.187 0.073 0.249 0.559 0.482 0.336 0.283 0.166 0.296
Dry season 0.588 0.228 0.201 0.113 0.034 0.196 0.583 0.285 0.219 0.183 0.067 0.203
Threshold percentage bias at 15% Threshold percentage bias at 20%
Accuracy FBI POD FAR POFD CSI Accuracy FBI POD FAR POFD CSI
Annual 0.597 1.162 0.633 0.371 0.496 0.478 0.577 1.406 0.666 0.387 0.567 0.484
Monthly 0.550 0.516 0.340 0.330 0.201 0.290 0.544 0.623 0.388 0.366 0.268 0.313
Wet season 0.556 0.61 0.394 0.336 0.243 0.326 0.544 0.746 0.448 0.382 0.331 0.344
Dry season 0.577 0.33 0.234 0.233 0.105 0.211 0.581 0.396 0.273 0.254 0.135 0.241
ss
(a)
(b)

2136 Sci. Res. Essays
(c)
(d)
Figure 5. Categorical statistical parameters (a) Accuracy, (b) FBI, (c) POD and (d) FAR.
assessment would be useful in the on-going Global Precipitation Measurement Mission (GPM) 2013. ACKNOWLEDGMENTS
The authors would like to appreciate the support of National Aeronautics and space Administration (NASA) USA and National Space Development Agency (NASDA) Japan for free access to their rainfall data archive. Many thanks go to the Nigeria Meteorological Center (NiMet), for making their precipitation data available to us.
REFERENCES
Adeyewa ZD, Kenji N (2003). Validation of TRMM Radra rainfall Data
over Major climatic Regions in Africa, J. Appl. Meteor., 42:331-347. Adler RF, Huffman GJ, Keehn PR (1994). Global tropical rain rate
estimates from microwave-adjusted geosynchronous IR data, Remote Sens. Rev. 11:125-152.
Arkin PA, Xie P (1994). The Global Precipitation Climatology Project: First Algorithm Intercomparison Project. Bull. Am. Meteor. Soc. 75:401-419.
Armstrong S (1985). Long-range forecasting: From Crystal Ball to Computer. Wiley, p. 348.
Aydin K, Daisley SEA (2002). Relationship between rainfall rate and 35-GHz attenuation and differential attenuation: Modelling the effects of raindrop size distribution canting and oscillation. IEEE Trans.

Geosci. Rem. Sens., 40(11):2343-2352. Chandrasekar V, Hou A, Smith E, Bringi VN, Rutledge SA, Gorgucci E,
Petersen WA, Gackson GS (2008). Potential Role of Dual polarization Radar in the Validation of Satellite Precipitation Measurements Rationale and Opportunities. Amer. Meteor. Soc., 89:1127-1145.
Conner MD, Petty GW (1998). Validation and intercomparison of SSM/I rain-rate retrieval methods over the continental United States. J. Appl. Meteor. 37:679-700.
Daniel AV, Luis GG, Goncalves D, David LT, Jose RR (2009). Statistical Evaluation of Combined Daily Gauge Observations and Rainfall Satellite Estimates over Continental South America. Am. Meteor. Soc. 10:533-543.
Dinku T, Ceccato P, Grover-Kopec E, Lemma M, Connor SJ, Ropelewski CF (2007). Validation of satellite rainfall products over East Africa’s complex topography. Int. J. Rem. Sens. 28:1503-1526.
Ebert EE, McBride JL (2000). Verification of precipitation in weather systems: determination of systematic errors. J. Hydrol. 239:179-202.
Ebert EE (2007). Methods in verifying satellite precipitation estimates, in: Measuring Precipitation from Space: EURAINSAT and the Future. Adv. Glob. Change Res. 28:611-653.
Feidas H (2009). Validation of Satellite Rainfall Products over Greece. Theor. Appl. Climatol. 99:1-2, 193
Flores BE (1986). A pragmatic view of accuracy measurement in forecasting. Omega (Oxford) 14(2):93-98.
Ferraro RR, Marks GF (1995). The development of SSM/I rain-rate retrieval algorithms using ground-based radar measurements. J. Atmos. Oceanic Technol. 12:755-770.
Gomez MRS (2007). Spatial and Temporal Rainfall gauge data analysis and validation with TRMM Microwave Radiometer Surface Rainfall Retrievals, Master Thesis, International Institute for Geo-information Science and Earth Observation Enschede, The Netherland.
Gottschalck J, Meng J, Rodell M, House P (2005). Analysis of Multiple Precipitation Products and Preliminary Assessment of their Impact on Global Land Data Assimilation System Land Surface States. J. Hydrometeor. 6:573-598.
Hsu KL, Gupta HV, Gao XG, Sorooshian S (1999). Estimation of physical variables from multichannel remotely sensed imagery using a neural network: Application to rainfall estimation. Water Resour. Res. 35:1605-1618.
Huffman GJ, Adler RF, Rudolf B, Schneider U, Kehn PR (1995). Global precipitation estimates based on a technique for combining satellite-estimates, rain gauge analysis, and NWP model precipitation estimation. J. Clim. 8:1284-1295.
ITU-R P.618 (2008). Propagation Data and Prediction Methods Required for the Design of Earth-Space Telecommunication System, Geneva.
Ji Y (2006). Validation of Diurnal Cycle and Intra-seasonal Variability of TRMM Satellite Rainfall, PIERS Online 2(6):628-632.
Jianxin W, David BW (2009). Evaluation of TRMM Ground – Validation Radar- Rain Errors using Rain gauge measurements. J. Appl. Meteorol. Climatol. 49(2):310-324.
Kummerow CD, Barnes W, Kozu T, Shiue J, Simpson J (1998). The Tropical Rainfall Measuring System (TRMM) sensor package. J. Atmos. Oceanic Technol. 15:809-817.
Mandeep JS, Hassan SIS, Ain MF (2008). Rain rate conversion for various integration times for equatorial and tropical climates. Int. J. Satellite Commun. 26:329-345.
Martina K, Francesca T, Silvio D (2006). Intercomparison of satellite-based and model-based rainfall analyses, Meteorol. Appl. 13:213-223.
Mircea G, Emmanouil NA (2001). Overland Precipitation Estimation from TRMM Passive Microwave Observations. Am. Meteorol. Soc. 40:1367-1380.
Murphy AH (1993). What is a Good Forecast? An Essay on the Nature of Goodness in Weather Forecasting. Weather Forecast. 8:281-293.
Abiola et al. 2137 Murphy AH (1995). The Coefficients of Correlation and Determination
as Measures of Performance in Forecast Verification. Weather Forecast. 10:681-688.
NASA/GSFC (2011). National Aeronautics and Space Administration, Goddard Space Flight Centre. http://www.gsfc.nasa.gov/. Retrieved on Sept, 2011.
NOAA (2013). National Oceanic and Atmospheric Administration. http:// http://www.noaa.gov/.
Omotosho VT, Oluwafemi CO (2009). Impairment of Radio Wave Signal by Rainfall on Fixed Satellite Service on Earth-space Path at 37 Stations in Nigeria. J. Atmos. Solar-Terrestrial Phys. 71:830-840.
Petty GW, Krajewski WF (1996). Satellite Estimation of Precipitation over land, Hydrol. Sci. J. 41:433-451.
Pratt T, Bostian CW, Alnutt JE (2003). Satellite Communication. Third Ed., Wiley: New York.
Ramesh SV, Teegavarapu, Chandramouli V (2005). Improved Weighting Methods, Deterministic and Stochastic Data- Driven Models for Estimation of Missing Precipitation Records. J. Hydrol. 312:199-206.
Sergio HF, Brahmananda RV, Ana CV, Clovis MES, Jorge CC (2009). Validation of TRMM precipitation radar monthly rainfall estimates over Brazil. J. Geophys. Res. 114: D2
Scheel MLM, Rohrer M, Huggel C, Villar SD, Silvestre E, Huffman GJ (2011). Evaluation of TRMM Multi-satellite Precipitation Analysis (TMPA) performance in the Central Andes region and its dependency on spatial and temporal resolution. Hydrol. Earth Syst. Sci. 15:2649-2663.
Su F, Hong Y, Lettenmaier DP (2008). Evaluation of TRMM Multisatellite Precipitation Analysis (TMPA) and its utility in Hydrologic Prediction in the La Plata Basin. J. Hydrometeorol. 9(4):622–640.
Todd MC, Bailey JO (1995). Estimates of Rainfall over the UK and Surrounding Seas from SSM/I Using Polarized Corrected Temperature Algorithm. J. Appl. Meteor. 34:1254-1265.
Tsintikidis D, Haferman JL, Anagnostou EN, Krajewski WF, Smith TF (1997). A neural network approach to estimating rainfall from spaceborne microwave data. IEEE Trans. Geosci. Rem. Sens. 35:1079-1093.
Wagner S, Kunstmann H, Bardossy A, Conrad C, Colditz RR (2008). Water balance estimation of a poorly gauged catchment in West Africa using dynamically downscaled meteorological fields and remote sensing information, Phys. Chem. Earth 34(4-5):225-235.
Wilks DS (1995). Statistical Methods in the Atmospheric Sciences: An Introduction, International Geophysics Series, Academic Press, 59:464-475.