categorical and quantitative variables two-way tables ap statistics chapter 1
TRANSCRIPT
CATEGORICAL AND QUANTITATIVE VARIABLES
TWO-WAY TABLES
AP StatisticsChapter 1
Data Collection
Data is never just numbers. There is context behind the data that is always important.
Context is the: who, what, where, when, why, and how.
Data is collected on individual cases with specific variables.
Variables can be broken into two types Categorical Variables Quantitative Variables
Categorical Variables
Categorical variables identify a category for each case.
Data can be written as words, letters, or even numbers.
ExamplesSubject; Department; Color; Yes/No; Class
Rank

Quantitative Variables
Quantitative variables record measurements or amounts of something
Must have units.ExamplesLength; weight; volume; number of jelly
beans; salary

Class Data
Which Variables are Categorical?
Which Variables are Quantitative?
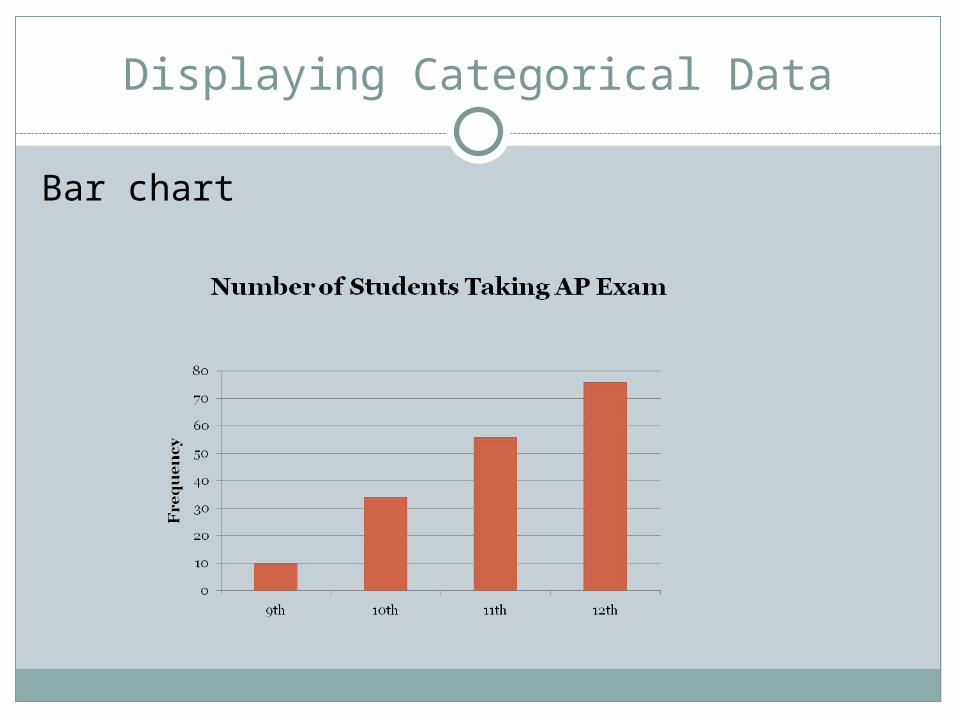
Displaying Categorical Data
Bar chart

Bar Chart
A bar is given for each category of the variable along x–axis
The y–axis can be the counts or frequency, or as a percent, relative frequency, without loss of basic shape.
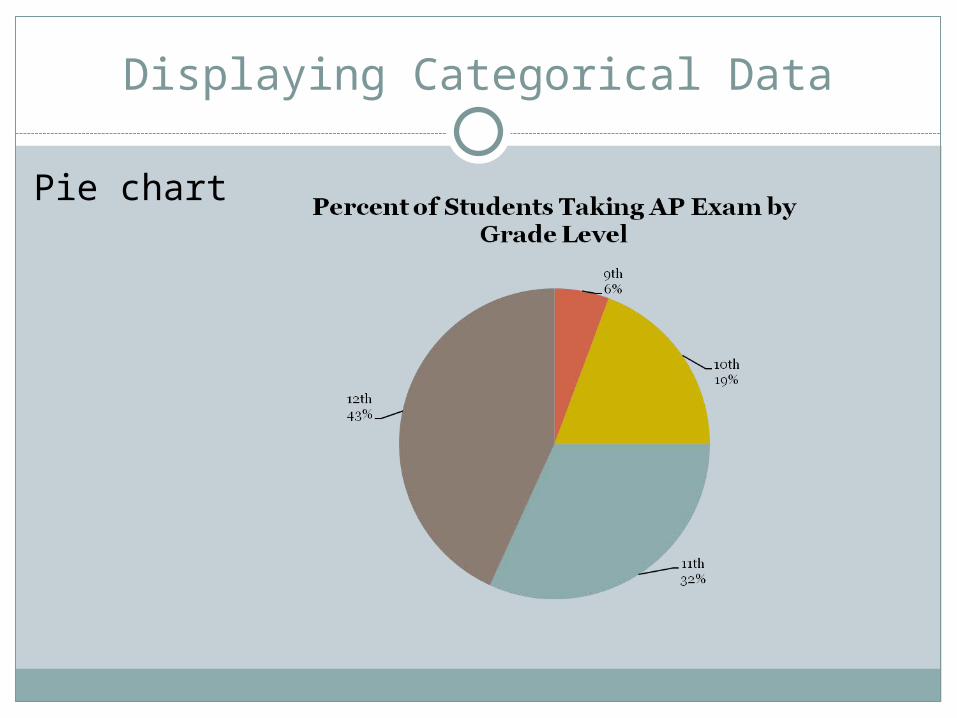
Displaying Categorical Data
Pie chart
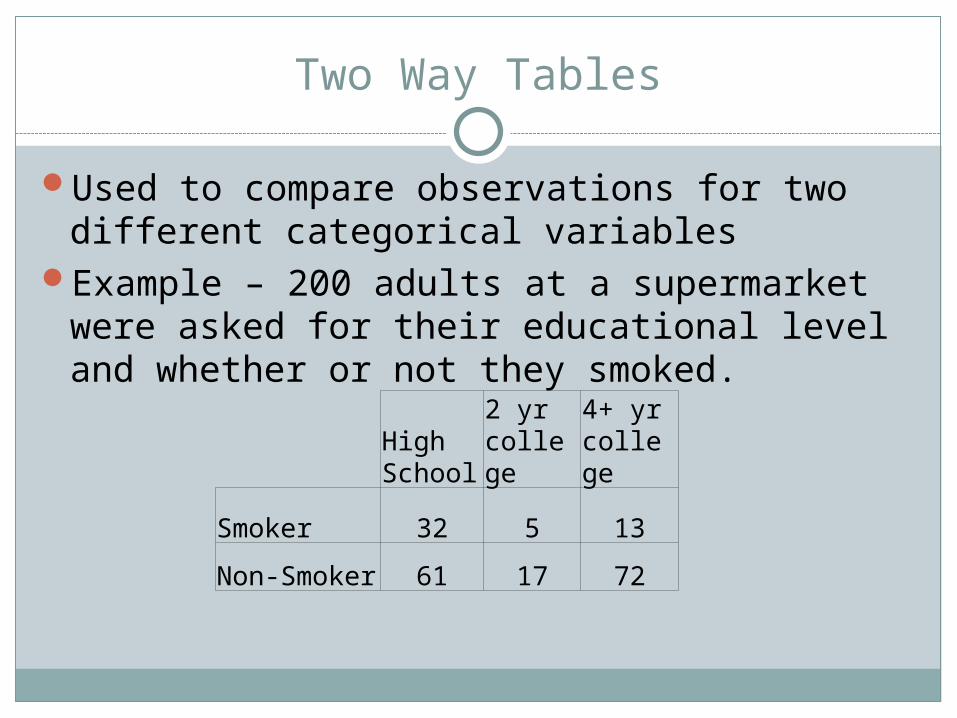
Two Way Tables
Used to compare observations for two different categorical variables
Example – 200 adults at a supermarket were asked for their educational level and whether or not they smoked.
High School
2 yr college
4+ yr college
Smoker 32 5 13
Non-Smoker 61 17 72
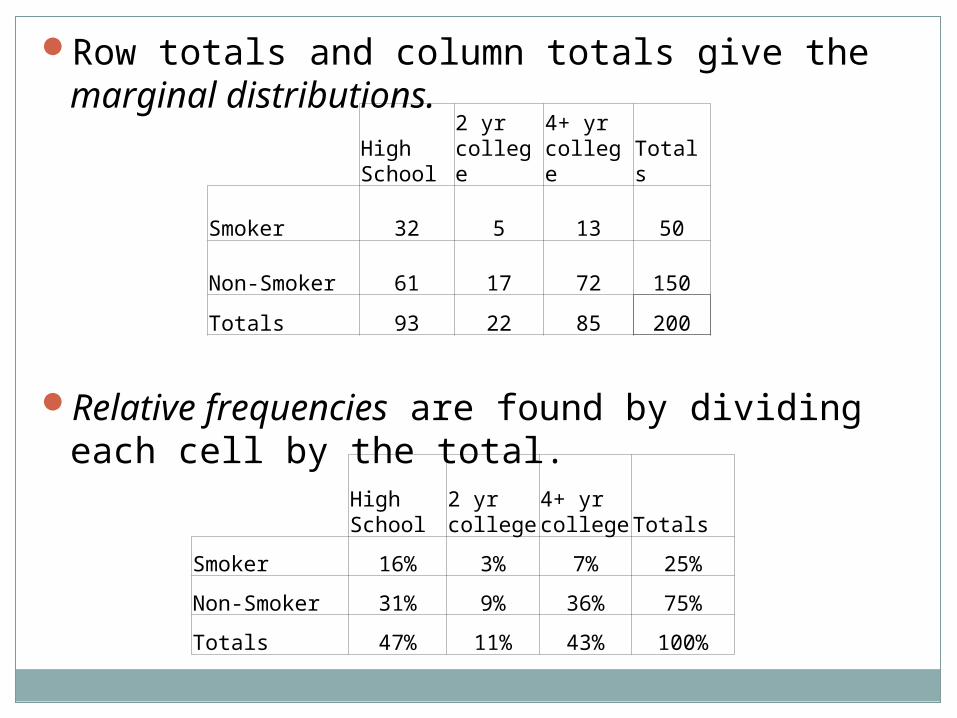
Row totals and column totals give the marginal distributions.
Relative frequencies are found by dividing each cell by the total.
High School
2 yr college
4+ yr college Totals
Smoker 32 5 13 50
Non-Smoker 61 17 72 150
Totals 93 22 85 200
High School
2 yr college
4+ yr college Totals
Smoker 16% 3% 7% 25%
Non-Smoker 31% 9% 36% 75%
Totals 47% 11% 43% 100%
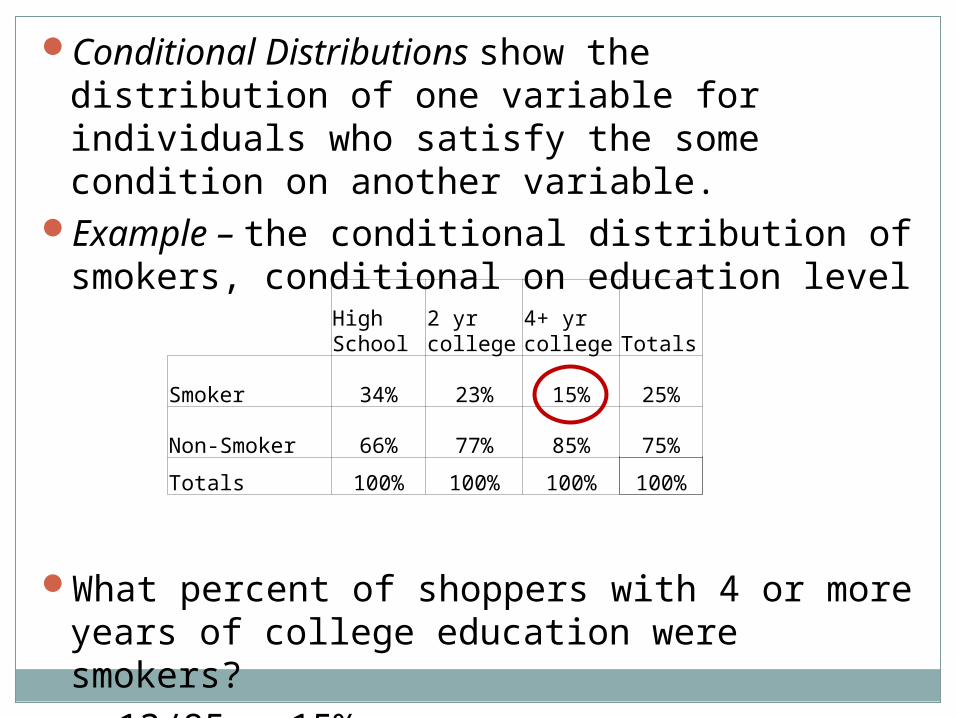
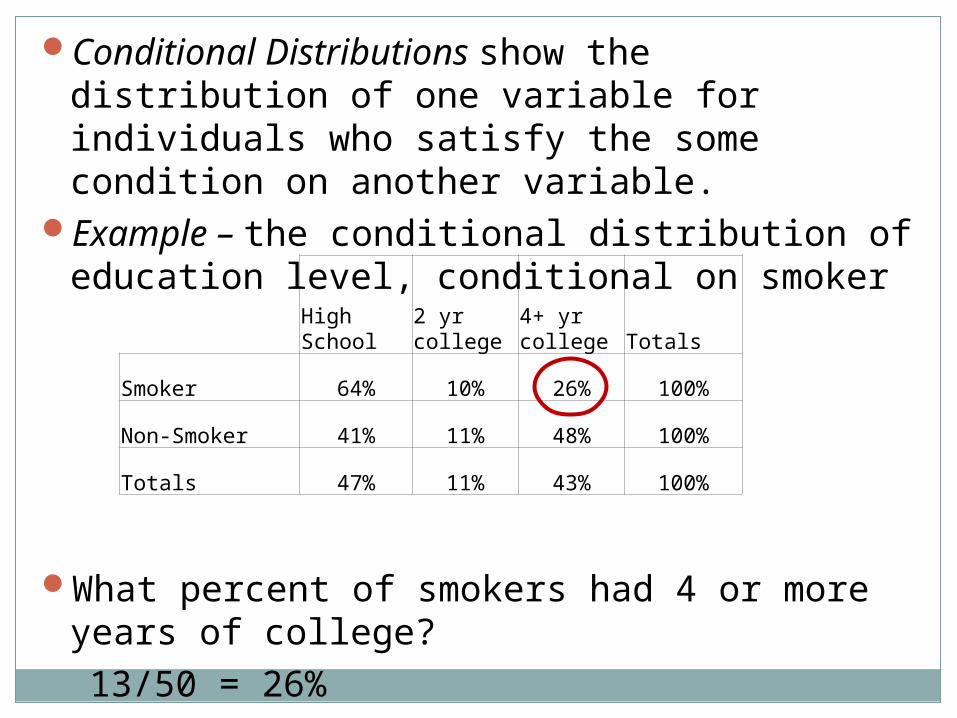
Conditional Distributions show the distribution of one variable for individuals who satisfy the some condition on another variable.
Example – the conditional distribution of smokers, conditional on education level
What percent of shoppers with 4 or more years of college education were smokers?
13/85 = 15%
High School
2 yr college
4+ yr college Totals
Smoker 34% 23% 15% 25%
Non-Smoker 66% 77% 85% 75%
Totals 100% 100% 100% 100%
Conditional Distributions show the distribution of one variable for individuals who satisfy the some condition on another variable.
Example – the conditional distribution of education level, conditional on smoker
What percent of smokers had 4 or more years of college?13/50 = 26%
High School
2 yr college
4+ yr college Totals
Smoker 64% 10% 26% 100%
Non-Smoker 41% 11% 48% 100%
Totals 47% 11% 43% 100%

Conditional Distributions help us determine is there is an association between two categorical variables might exist or if they are independent.
If the distribution of one variable is the same for all categories of another, we say the variables are independent.
Since the percentages for smoking are different for shoppers with high school education only are different, we conclude that some association between smoking and educational level achieved exists.
High School
2 yr college
4+ yr college Totals
Smoker 64% 10% 26% 100%
Non-Smoker 41% 11% 48% 100%
Totals 47% 11% 43% 100%