‘catch and keep’ digital shoppers - cisco.com · these digital shoppers also have new...
TRANSCRIPT
Cisco Internet Business Solutions Group (IBSG) Cisco IBSG © 2013 Cisco and/or its affiliates. All rights reserved. 01/13
Point of View
‘Catch and Keep’ Digital Shoppers How To Deliver Retail Their Way By Lisa Fretwell, Jon Stine, Hiten Sethi, and Andy Noronha
Introduction We have quietly entered a new era in the evolution of shopping behavior.
The majority of consumers now shop digitally: they begin their shopping journeys online; rely primarily on digital sources to make decisions about products and services; and move back and forth across channels of distribution so readily as to erase channel lines.
These digital shoppers also have new expectations for all their shopping experiences—expectations largely shaped by daily use of the Internet. They expect greater visibility into the information that enables calculations of value (product/pricing comparisons, access to promotions, and how-to insights), they want self-service, and they are more interested in personalized offers and promotions.
And, they want a constant connection to the endless information on the Internet. The device that provides the connection is less important than the connection itself.
The implications of this digital evolution have been visible to the retail industry for some time. Yet, the results of a recent worldwide survey on shopper behavior by Cisco IBSG make it clear that the industry must now race to “catch and keep” the majority of consumers who effortlessly mash-up digital and physical shopping.1
3 Years of Consistent Study Three years ago, Cisco IBSG conducted its inaugural study to learn about technology-based shopping behaviors. Specifically, the survey data showed that a broad swath of shoppers had increased their deal-seeking behavior as compared with the prior two years. Although some deal-seeking behavior was no doubt caused by the economic challenges of the time, the research found that regular users of technology were much more aggressive in seeking lower prices and finding better values. In addition, the data showed a surprising reliance among shoppers upon Internet-based sources of decision-making information. Although friends and family were cited as the number-one source of advice for helping to make a purchase decision, online reviews and ratings were preferred over the advice of in-store employees.
Perhaps most important, the first study also showed wide interest among shoppers in new in-store concepts (called “Mashops”) that combine digital content and virtual experiences, and deliver them in the physical store environment.
Cisco IBSG © 2013 Cisco and/or its affiliates. All rights reserved. Page 2
Point of View
Cisco IBSG’s second study, published in January 2012, quantified the growth of cross-channel shopping, and provided the initial framework for today’s “Catch and Keep” strategic challenge. The data showed that: 1) a majority of Americans regularly visited both e-com-merce sites and stores prior to making a purchase decision; 2) smartphones and tablets were an increasingly important part of the shopping journey (though not always in the store); and 3) digital content could be effectively used to create emotional engagement and trigger purchasing behavior. The data also showed a continued decline in the influence of traditional retail decision-shapers such as in-store associates, in-store displays, and print and broadcast advertising.
In October 2012, Cisco IBSG conducted its third annual survey to continue its study of technology-based shopping behavior, cross-channel shopping patterns, device usage, and sources of decision-making content. This iteration of the research added respondents from China, Brazil, and Mexico, in addition to the United States and United Kingdom (see Appendix for highlights of Cisco IBSG’s research for the United Kingdom, China, Brazil, and Mexico).
New Mashop concepts were tested for shopper interest and anticipated frequency of use. As before, these findings were cross-referenced by shopper age, gender, device ownership, and preference by industry segment. We also explored three topics of significance to the retail industry: 1) changes in shopper expectations (especially for the store); 2) demand for personalized experiences, and willingness of shoppers to share information with retailers; and 3) preferences for using digital devices in the store.
Top Research Findings Analysis of this year’s data from the United States revealed the following key findings.
Finding No. 1: Digital Shoppers Are Now the Majority Nearly eight in 10 consumers are digital shoppers who regularly research and purchase products using the Internet. This “Digital Mass Market” accesses the Internet on a daily basis, owns a mobile phone (though not necessarily a smartphone), and regularly researches or purchases products and services online.
By age, the Digital Mass Market is dominated by Generation Y (18-29 years of age) and Generation X (30-39 years of age) males, and Generation X and baby boomer (50-64 years of age) females. The gender split is 50 percent males and 50 percent females.2
The common denominator of the Digital Mass Market’s digital shopping behavior is the home personal computer. However, the Digital Mass Market also shops through other devices:
● 54 percent report they are currently using or would like to use digital touchscreens in the store.
● 48 percent report they are currently using or would like to use a smartphone to shop while in the store or on the go.
● 47 percent report they are currently using or would like to use a tablet to shop while at home.
Cisco IBSG © 2013 Cisco and/or its affiliates. All rights reserved. Page 3
Point of View
Within the Digital Mass Market is a highly technology-savvy group that can be described as the “Über Digitals,” who represent a little more than one in 10 of the total population. These are shoppers who access the Internet daily, own touchscreen smartphones, and use their smartphones to shop in the store. Nearly two-thirds of Über Digitals are members of the 18- to 29-year-old Generation Y, and 56 percent are men. Simply put, they do not shop without technology.
Über Digitals use or are interested in using their smartphones to shop both on the go (93 percent) and from home (90 percent). They shop or are interested in shopping from home using a PC (96 percent); use or are interested in using a tablet to shop from home (95 percent); and use or are interested in using touchscreens provided by retailers in the store (79 percent).
The behavioral picture that emerges from today’s Über Digital consumers is that the shopping journey often begins with a smartphone, but it doesn’t end there. Their use of multiple devices beyond smartphones (PCs, tablets, and in-store screens) indicates an “all-the-time, anywhere” desire for Internet content as a guide to making purchase decisions.
Finding No. 2: Internet Content Drives Decisions Today’s digital shoppers increasingly rely on Internet-based sources of information for making purchase decisions.
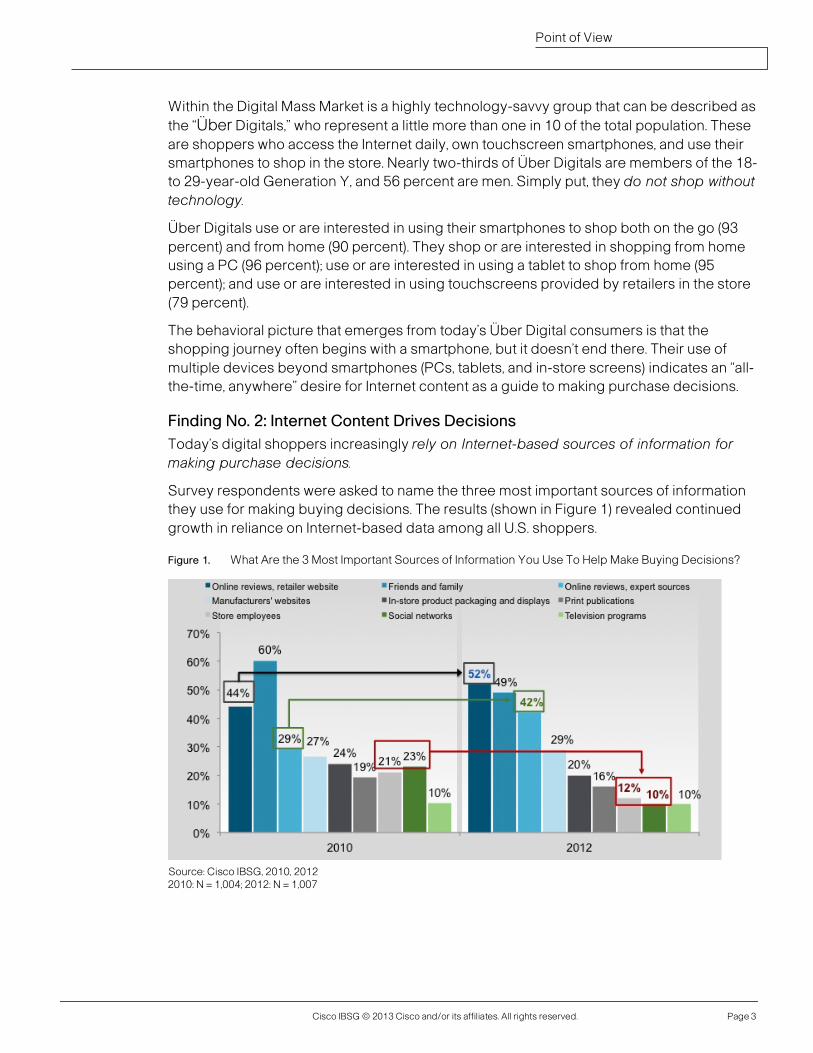
Survey respondents were asked to name the three most important sources of information they use for making buying decisions. The results (shown in Figure 1) revealed continued growth in reliance on Internet-based data among all U.S. shoppers.
Figure 1. What Are the 3 Most Important Sources of Information You Use To Help Make Buying Decisions?
Source: Cisco IBSG, 2010, 2012 2010: N = 1,004; 2012: N = 1,007
Cisco IBSG © 2013 Cisco and/or its affiliates. All rights reserved. Page 4
Point of View
Among all U.S. shoppers:
● There was significant growth in reliance upon digitally sourced reviews and ratings, whether from retailer websites (the leading influencer in this year’s study) or from online third-party experts.
– This reliance is more pronounced among Digital Mass and Über Digital shoppers. Nearly three-fourths of the Über Digitals this year cited a decision-making reliance upon reviews and ratings from retailer websites.
● The influence of friends and family declined. For Über Digitals, friends and family are less important than two digital sources: reviews on retailer websites and reviews from expert sources.
● The influence of social media and store employees declined by roughly half from 2010 to 2012.
Finding No. 3: Most Shoppers Cross Channels The percentage of U.S. shoppers who research products and services on a PC and transact in the store increased from 57 percent in 2011 to 65 percent in 2012. Those who research products and services using a smartphone prior to purchasing in the store increased from 24 percent in 2011 to 29 percent in 2012.
All-digital, cross-device behavior also increased: the percentage researching on a smartphone and purchasing on a PC increased from 26 percent of U.S. shoppers to 33 percent.
The so-called “showrooming” phenomenon of researching in-store and purchasing online increased slightly from 38 percent to 40 percent. This represents a sizable portion of the shopping population.
Finding No. 4: They Come to the Store with New Expectations Compared with two years ago, digital shoppers have higher expectations of retailers. These appear to be shaped largely by their Internet experiences, and are focused first on what might be called value transparency.
When asked to evaluate their expectations of retail shopping as compared with two years ago, more than half of the Digital Mass Market reported that they were somewhat or much more demanding in:
● Obtaining better values overall ● Gaining visibility into pricing information (including comparative information)
● Accessing information about promotions and coupons
In addition:
● 46 percent of the Digital Mass Market reported they are somewhat or much more demanding when it comes to accessing information about promotions and coupons.
● 40 percent of the Digital Mass Market (and 54 percent of Über Digitals) reported heightened expectations for access to all forms of decision-making information.
● More than one-third of the Digital Mass Market now expects greater speed and ease of finding and purchasing products.
Cisco IBSG © 2013 Cisco and/or its affiliates. All rights reserved. Page 5
Point of View
Finding No. 5: They’ll Change Their Minds When Shown Value Value is also essential to understanding which digital content will lead shoppers to shift their focus from one product to another, or to consider new items.
Survey respondents were asked to envision two scenarios in both grocery and general merchandise environments: 1) changing their minds about which products or services to choose, and 2) being inspired to try something new. The survey then asked respondents two questions: 1) Which types of content would cause you to select a different product from the one you were originally considering? 2) Which types of content would lead you to select a product or service that you had not considered before entering the store?
The results related to the grocery segment were not surprising. Four types of information were decisive in both shifting decisions and inspiring impulse purchases:
1. Price comparisons (cited by more than half of all respondents)
2. Information about special deals or promotions (indicated by 54 percent as inspiring a trial)
3. Product availability in nearby stores (selected by more than one-third of respondents)
4. Information about specially priced bundles of products (identified as important in inspiring trials by 32 percent of respondents)
The list of important behavior-changing influencers was much longer for general merchan-dise shopping—and the level of influence was much higher. Roughly two-thirds of shoppers would respond to price comparisons, and more than half to information on special deals and promotions. Large numbers of respondents also pointed to:
● Product ratings and reviews (56 percent noted that these would inspire them to purchase new items)
● Expert recommendations (42 percent) ● Video and images that show product usage (about 40 percent)
Finding No. 6: Your Device or Mine? Digital shoppers want to access content on their own devices as well as on store-provided devices. They also want to access content on their own (as opposed to with assistance from an in-store associate).
Overall, there was equal preference for BYOD (“bring your own device”) and store-provided content. Less than one-fourth of all respondents expressed a preference for using their own device (22 percent), or using a device (or touchscreen) provided by the retailer (21 percent). Slightly more respondents (28 percent) said that they were happy to use either option.
In terms of mobile device content, 21 percent of shoppers preferred browser-based access, only 12 percent preferred brand-specific apps, and 20 percent were happy with either option. In terms of the size of in-store screens, there was a clear preference for a 26-inch diagonal touchscreen over a tablet-size screen (almost 2 to 1). In addition, about three-fourths of respondents expressed a preference for using a touchscreen as compared with a keyboard or gesture-based interface.
Cisco IBSG © 2013 Cisco and/or its affiliates. All rights reserved. Page 6
Point of View
There was a clear desire for what might be called “assisted” self-service. About one in five respondents expressed a desire to access digital content in the store completely on their own. However, two-thirds wanted to access digital content in the store on their own—but with an employee standing nearby to provide assistance if needed.
In summary, access to content is more important than the type of device used. Retailers should provide shoppers with easy access to content through both shopper- and store-owned smart devices. If retailers don’t provide digital shoppers with easy access to content in the store, shoppers will find it on their own.
Finding No. 7: They Want Personalized Experiences (Opt-in, Please) Offering personalized shopping experiences (customized services, offers, and advice) is becoming more important as a way to encourage buying among the Digital Mass Market. The survey findings also highlight the types of data digital shoppers are willing to share in order to receive a personalized shopping experience.
Broadly stated, personalized experiences have the greatest influence on Über Digitals with regard to influencing purchasing behavior. More than one-third (35 percent) of Über Digitals said that a personalized experience would “definitely” encourage making a purchase, and 50 percent said it would “possibly” encourage them to make a purchase. The Digital Mass Market as a whole was a bit more reluctant, with only 18 percent saying that a personalized experience would “definitely” encourage making a purchase. Nonetheless, 52 percent said that it “possibly” would do so.
Digital shoppers are also willing to share their personal information (up to a point) in order to obtain personalized experiences from retailers. In general, shoppers appear willing to grant retailers permission to mine information from transactions, including shopper identification (name, gender, address, email), past purchase history, loyalty points, and on-file warranties. In addition, there is a willingness among some shoppers to share information about potential future purchases, such as likes, dislikes, hobbies, and interests.
However, the data show that shoppers must be given the choice of opting-in or opting-out of personalization. Shoppers also do not want retailers to construct personalized offers from web browsing histories, social media use, mobile phone data, personal financial or credit card data, or visual technologies such as store-entry facial recognition and license plate reading. Even in this era of “big data,” retailers should be extremely transparent with their customers before using this information.
Finding No. 8: It’s Still a Store-Centric World The store will continue to be the site of the vast majority of retail transactions. As noted above, Forrester reported that 90 percent of all 2012 non-grocery retail revenue in the United States and United Kingdom was transacted in a store.3 Although this number is expected to slide to 85 percent by 2015 (a shift that could move nearly $145 billion in non-grocery revenue from brick-and-mortar locations in the United States), the store will continue to be the place where most shopping journeys cross the finish line.4
According to the survey, the most important reasons for shopping in a store are:
● Opportunity to look at, touch, and compare products (important point for “tactile” segments of the industry, such as apparel and domestic): 61 percent
Cisco IBSG © 2013 Cisco and/or its affiliates. All rights reserved. Page 7
Point of View
● Ability to take products and use them immediately: 49 percent
● Ability to try—and try on—products (important for apparel and potentially consumer electronics retailers that are struggling with commoditization and pure-play competition): 41 percent
● Value of receiving advice from store staff: 6 percent
Shopper Preferences for In-Store Mashop Concepts Cisco IBSG tested a number of in-store digital concepts with shoppers to determine their general interest and anticipated frequency of use. For this survey, we tested six concepts (listed below). In terms of driving incremental value for retailers, our work with leading brands suggests that interest and anticipated frequency scores above 30 percent merit strong consideration.
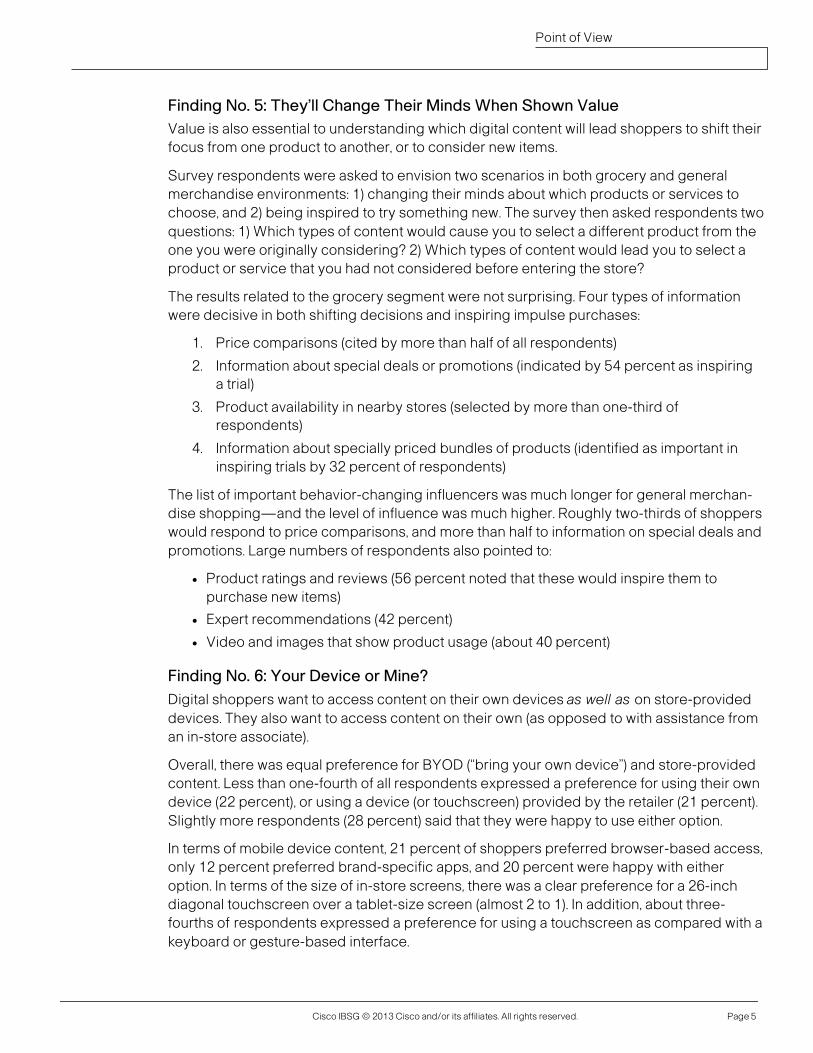
Concept No. 1: Automated Pickup When shopping online, you can use this service to pick up your purchase from a safe locker in the store. You access your purchase by entering a unique code sent to your email address or mobile phone.
Respondents who were “very interested” or “somewhat interested” in this concept: 53 percent.
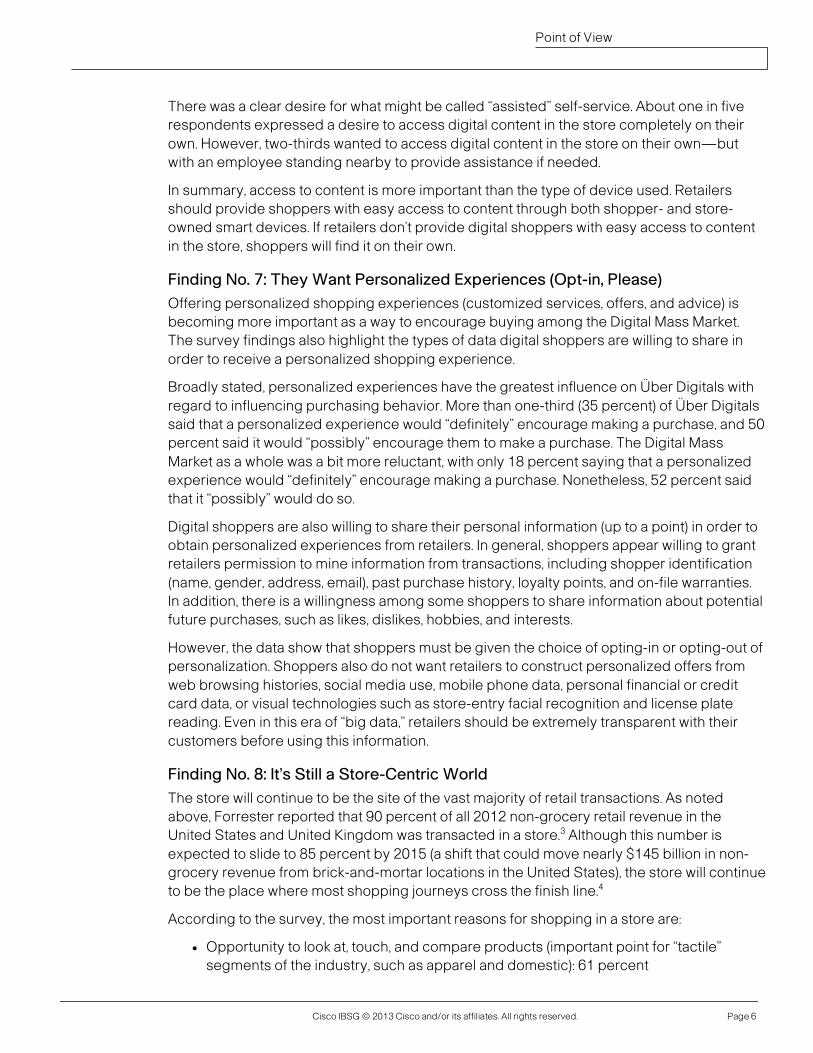
Concept No. 2: Product Selector This service allows you to view entire product ranges and detailed information about specific products (as you do on websites) to help you decide what to buy. It lets you see detailed specifications, ratings and reviews, product images, and product comparisons on price, features, and ratings. You can then use it to buy the product online.
Respondents who were “very interested” or “somewhat interested” in this concept: 53 percent.
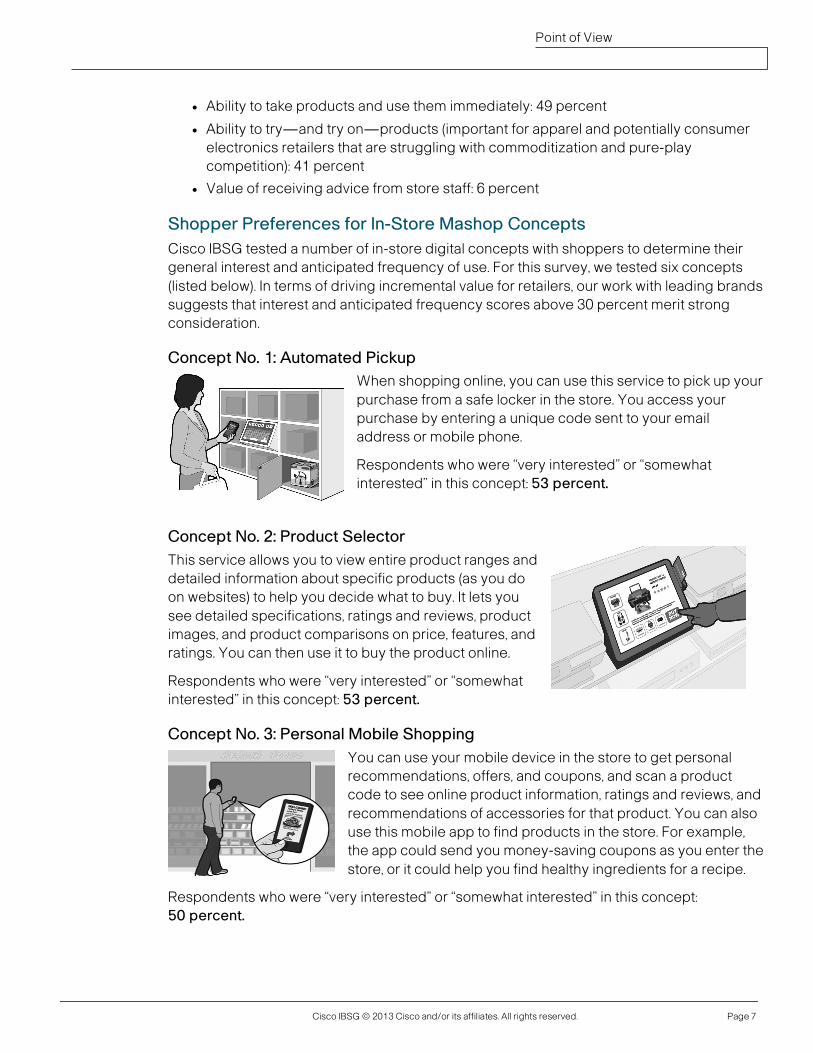
Concept No. 3: Personal Mobile Shopping You can use your mobile device in the store to get personal recommendations, offers, and coupons, and scan a product code to see online product information, ratings and reviews, and recommendations of accessories for that product. You can also use this mobile app to find products in the store. For example, the app could send you money-saving coupons as you enter the store, or it could help you find healthy ingredients for a recipe.
Respondents who were “very interested” or “somewhat interested” in this concept: 50 percent.
Cisco IBSG © 2013 Cisco and/or its affiliates. All rights reserved. Page 8
Point of View
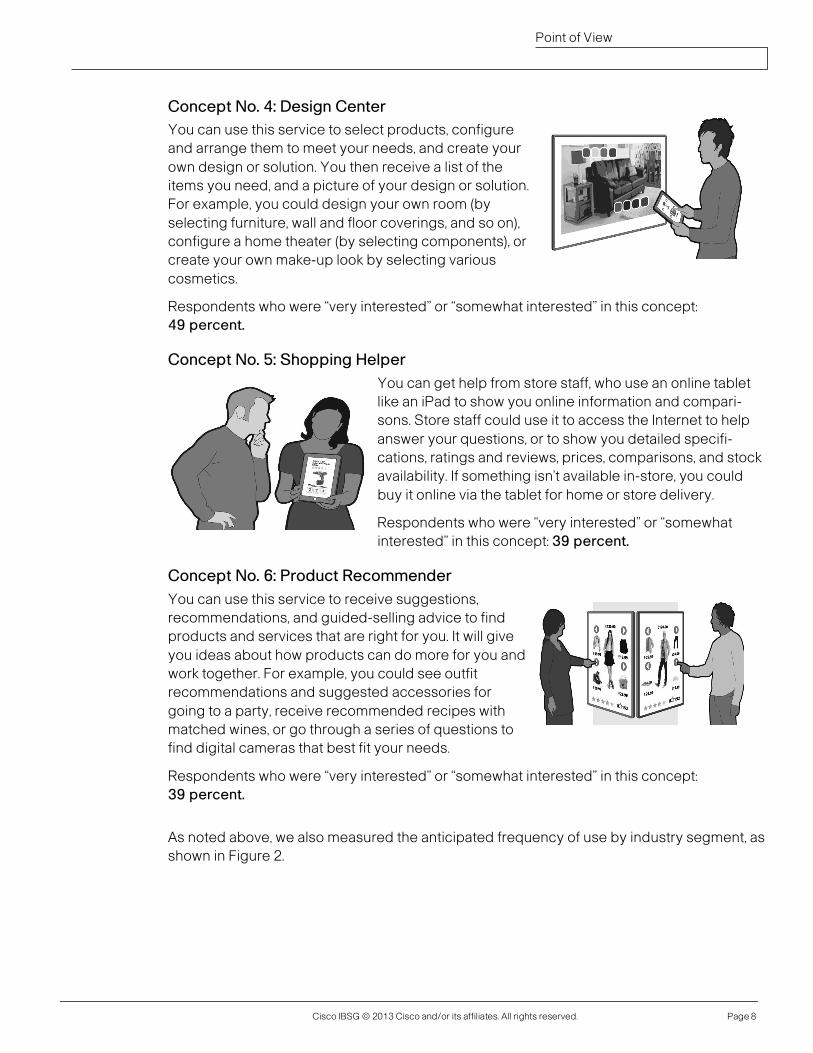
Concept No. 4: Design Center You can use this service to select products, configure and arrange them to meet your needs, and create your own design or solution. You then receive a list of the items you need, and a picture of your design or solution. For example, you could design your own room (by selecting furniture, wall and floor coverings, and so on), configure a home theater (by selecting components), or create your own make-up look by selecting various cosmetics.
Respondents who were “very interested” or “somewhat interested” in this concept: 49 percent.
Concept No. 5: Shopping Helper You can get help from store staff, who use an online tablet like an iPad to show you online information and compari-sons. Store staff could use it to access the Internet to help answer your questions, or to show you detailed specifi-cations, ratings and reviews, prices, comparisons, and stock availability. If something isn’t available in-store, you could buy it online via the tablet for home or store delivery.
Respondents who were “very interested” or “somewhat interested” in this concept: 39 percent.
Concept No. 6: Product Recommender You can use this service to receive suggestions, recommendations, and guided-selling advice to find products and services that are right for you. It will give you ideas about how products can do more for you and work together. For example, you could see outfit recommendations and suggested accessories for going to a party, receive recommended recipes with matched wines, or go through a series of questions to find digital cameras that best fit your needs.
Respondents who were “very interested” or “somewhat interested” in this concept: 39 percent.
As noted above, we also measured the anticipated frequency of use by industry segment, as shown in Figure 2.
Cisco IBSG © 2013 Cisco and/or its affiliates. All rights reserved. Page 9
Point of View
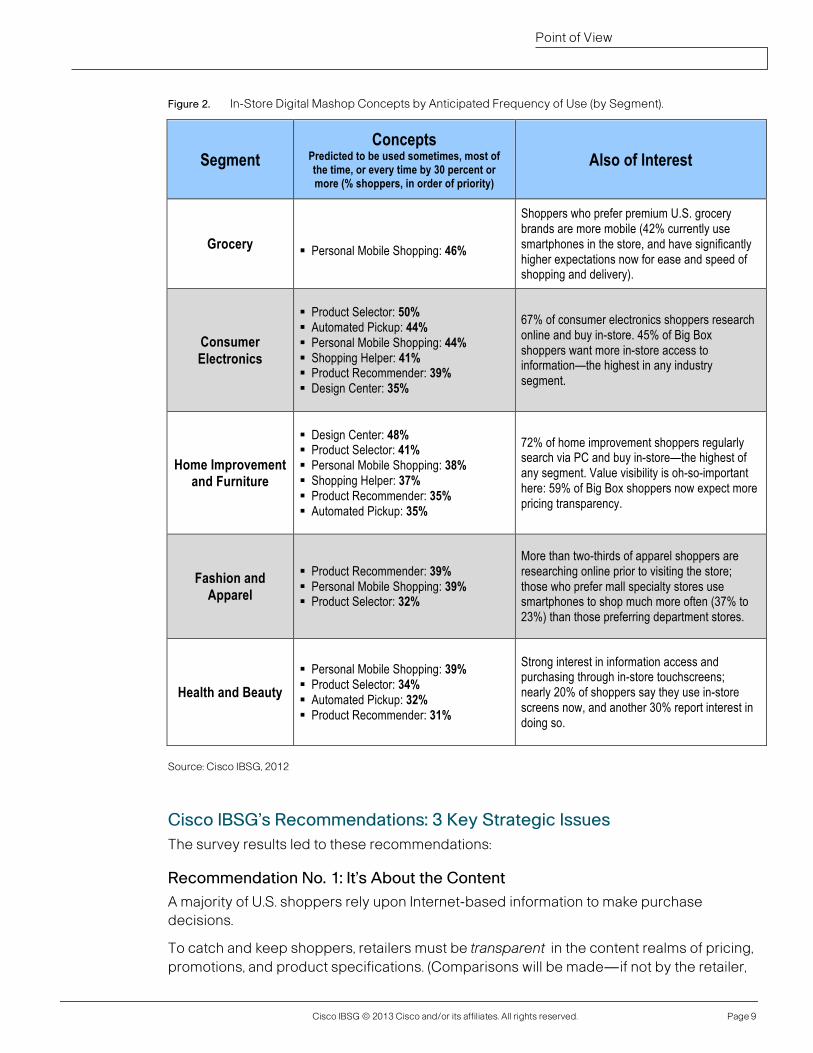
Figure 2. In-Store Digital Mashop Concepts by Anticipated Frequency of Use (by Segment).
Segment Concepts
Predicted to be used sometimes, most of the time, or every time by 30 percent or more (% shoppers, in order of priority)
Also of Interest
Grocery § Personal Mobile Shopping: 46%
Shoppers who prefer premium U.S. grocery brands are more mobile (42% currently use smartphones in the store, and have significantly higher expectations now for ease and speed of shopping and delivery).
Consumer Electronics
§ Product Selector: 50% § Automated Pickup: 44% § Personal Mobile Shopping: 44% § Shopping Helper: 41% § Product Recommender: 39% § Design Center: 35%
67% of consumer electronics shoppers research online and buy in-store. 45% of Big Box shoppers want more in-store access to information—the highest in any industry segment.
Home Improvement and Furniture
§ Design Center: 48% § Product Selector: 41% § Personal Mobile Shopping: 38% § Shopping Helper: 37% § Product Recommender: 35% § Automated Pickup: 35%
72% of home improvement shoppers regularly search via PC and buy in-store—the highest of any segment. Value visibility is oh-so-important here: 59% of Big Box shoppers now expect more pricing transparency.
Fashion and Apparel
§ Product Recommender: 39% § Personal Mobile Shopping: 39% § Product Selector: 32%
More than two-thirds of apparel shoppers are researching online prior to visiting the store; those who prefer mall specialty stores use smartphones to shop much more often (37% to 23%) than those preferring department stores.
Health and Beauty § Personal Mobile Shopping: 39% § Product Selector: 34% § Automated Pickup: 32% § Product Recommender: 31%
Strong interest in information access and purchasing through in-store touchscreens; nearly 20% of shoppers say they use in-store screens now, and another 30% report interest in doing so.
Cisco IBSG’s Recommendations: 3 Key Strategic Issues The survey results led to these recommendations:
Recommendation No. 1: It’s About the Content A majority of U.S. shoppers rely upon Internet-based information to make purchase decisions.
To catch and keep shoppers, retailers must be transparent in the content realms of pricing, promotions, and product specifications. (Comparisons will be made—if not by the retailer,
Source: Cisco IBSG, 2012
Cisco IBSG © 2013 Cisco and/or its affiliates. All rights reserved. Page 10
Point of View
then by the digital shopper.) Content must be emotionally engaging, connecting to underlying human wants and needs.
And, content must be contextual. What makes a difference is the right information, delivered at the right time, in the right place, and at the right point in the decision journey—whether online, through the mobile device, or in the store.
Action: Focus on the right content at every touchpoint in the shopping journey.
Recommendation No. 2: A New Approach to In-Store Labor As noted above, a majority of shoppers rely on Internet-based information to make purchase decisions. They also increasingly want self-service options in-store. This suggests a new, three-part approach to in-store labor:
1. Self-service options expand in three realms: decision making, service and support acquisition, and checkout. (The Mashop concept tests provide several ideas for self-serve decision making.)
2. A majority of the store labor force focuses upon operational effectiveness, with an emphasis upon fast checkout and maintenance of key SKU stock levels.
3. A minority of the labor force—those with strong interpersonal skills, subject-matter expertise, and career aspirations—focuses upon customer engagement and sales. The expertise of top associates is scaled to other stores through the use of today’s mobile collaboration technologies.
Action: Map your current shopper engagement practices to the behaviors of today’s Digital Mass Market. Respond to gaps that emerge.
Recommendation No. 3: Personalize—but Only with Opt-in Digital shoppers (especially Über Digitals) are willing to trade certain types of information for personalized offers and services. Even so, it is important to proceed with caution. Digital shoppers are quite willing for retailers to mine basic transactional data (name, age, gender, past purchases) and survey-style information directly relevant to a future transaction, such as likes, dislikes, and future purchase needs—but only if retailers ask opt-in permission.
The survey shows that web browsing history, parking lot visits (through license plate reading), and store visits (through facial recognition) should not be used to create personalized offers.
Action: Personalization is first about permission. Give shoppers a reason to opt-in, then focus upon smart use of data that’s obtained through the transactional relationship.
Achieving the Potential of ‘Catch and Keep’ Retailing Given these findings, what can you do to “catch” channel-hopping customers and keep them within your brand during the shopping journey? Here are several of the lessons Cisco IBSG gleaned from our work with leading retailers.
Cisco IBSG © 2013 Cisco and/or its affiliates. All rights reserved. Page 11
Point of View
Follow a Proven Recipe To Create Digital Mashops that Trigger Buying The creation of a Mashop concept goes well beyond simply integrating a website into an in-store kiosk or interactive screen. To help you create and deploy effective Mashop solutions that trigger buying, Cisco IBSG recommends the following steps:
● Define your primary business objective, such as increasing in-store conversions or expanding basket size.
● Focus on delivering the right content, on the right devices, at the right point in the omnichannel customer journey. How much does your target shopper likely know when he or she enters the store?
● Design a user experience that is easy, inviting, and intuitive. Cisco IBSG’s work with leading retailers shows that this type of development results from a carefully researched and incremental process.
● Make sure the physical design is inviting to shoppers and catches their attention. Our research clearly indicates that shoppers prefer midsized, self-service touchscreens.
● Rethink the merchandising and return-on-investment (ROI) implications of in-store digital content delivery. While in-store screens take up room that can be used for merchandise and cost money to implement, the benefits should outweigh the costs.
● Enable social interaction by allowing customers to post on Facebook with a single touchscreen action.
● Use clear and concise signage to call attention to your Mashop solution. Explain how to use it, and describe the value shoppers receive. Don’t assume shoppers will know what your Mashop does or how it operates.
● Enlist associate support by placing badged, uniformed personnel at interactive screens and Mashops to assist shoppers, especially in the early phases of adoption.
Operationalize with Business and Technology Enablers Once your Mashop concept has been defined and designed, it is important to consider the following business and technology enablers to scale it across your operation.
Business Enablers ● Knowledge and content management, including content generation, refresh cycles,
decision rights and responsibilities, and content security.
● Operational processes and procedures, including associate roles and responsibilities, labor and expertise management and optimization, and revenue recognition.
● Channel management, including data integration, cross-channel inventory fulfillment, and revenue recognition.
Technology Enablers ● Content management and delivery, including security, bandwidth capacity and
optimization, and the architecture required to deliver reliable, high-bandwidth, low-latency experiences at peak traffic times.
● Store architecture, including bandwidth capacity, CPU optimization and virtualization, and total thin-store opportunities.
Cisco IBSG © 2013 Cisco and/or its affiliates. All rights reserved. Page 12
Point of View
● Data integration that enables a single view of on-order and on-hand inventory, customer profiles, and flexible fulfillment.
Leading retailers are actively developing and testing omnichannel digital experiences to differentiate and revitalize their brands. Given consumers’ new channel-hopping behavior, what will you do to “catch” customers and “keep” them within your brand during the shopping journey?
For more information, please contact: Lisa Fretwell Senior Director, Global Retail Practice Cisco Internet Business Solutions Group +44 7879 436 114 [email protected] Jon Stine Director, Global Retail Practice Cisco Internet Business Solutions Group +1 503 598 7156 [email protected]
Cisco IBSG © 2013 Cisco and/or its affiliates. All rights reserved. Page 13
Point of View
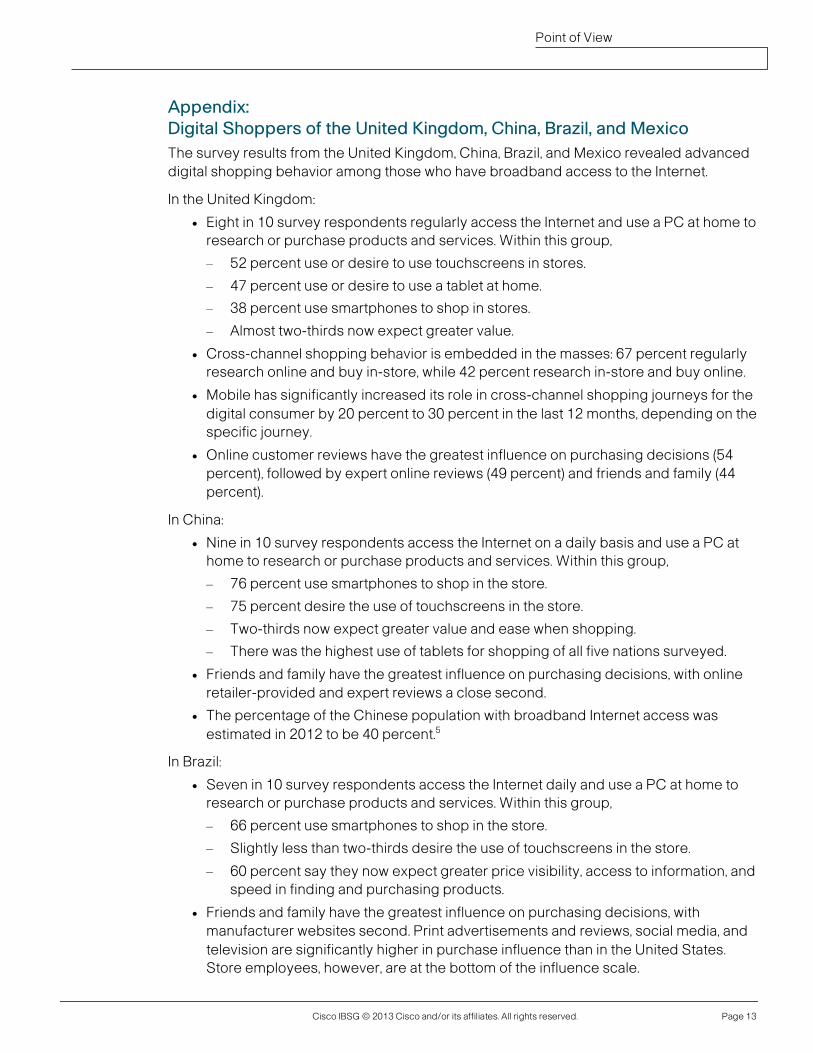
Appendix: Digital Shoppers of the United Kingdom, China, Brazil, and Mexico The survey results from the United Kingdom, China, Brazil, and Mexico revealed advanced digital shopping behavior among those who have broadband access to the Internet.
In the United Kingdom:
● Eight in 10 survey respondents regularly access the Internet and use a PC at home to research or purchase products and services. Within this group,
– 52 percent use or desire to use touchscreens in stores.
– 47 percent use or desire to use a tablet at home.
– 38 percent use smartphones to shop in stores.
– Almost two-thirds now expect greater value.
● Cross-channel shopping behavior is embedded in the masses: 67 percent regularly research online and buy in-store, while 42 percent research in-store and buy online.
● Mobile has significantly increased its role in cross-channel shopping journeys for the digital consumer by 20 percent to 30 percent in the last 12 months, depending on the specific journey.
● Online customer reviews have the greatest influence on purchasing decisions (54 percent), followed by expert online reviews (49 percent) and friends and family (44 percent).
In China:
● Nine in 10 survey respondents access the Internet on a daily basis and use a PC at home to research or purchase products and services. Within this group,
– 76 percent use smartphones to shop in the store.
– 75 percent desire the use of touchscreens in the store.
– Two-thirds now expect greater value and ease when shopping.
– There was the highest use of tablets for shopping of all five nations surveyed.
● Friends and family have the greatest influence on purchasing decisions, with online retailer-provided and expert reviews a close second.
● The percentage of the Chinese population with broadband Internet access was estimated in 2012 to be 40 percent.5
In Brazil:
● Seven in 10 survey respondents access the Internet daily and use a PC at home to research or purchase products and services. Within this group,
– 66 percent use smartphones to shop in the store.
– Slightly less than two-thirds desire the use of touchscreens in the store.
– 60 percent say they now expect greater price visibility, access to information, and speed in finding and purchasing products.
● Friends and family have the greatest influence on purchasing decisions, with manufacturer websites second. Print advertisements and reviews, social media, and television are significantly higher in purchase influence than in the United States. Store employees, however, are at the bottom of the influence scale.
Cisco IBSG © 2013 Cisco and/or its affiliates. All rights reserved. Page 14
Point of View
● The percentage of the Brazilian population with broadband Internet access was estimated at year end 2011 to be 39 percent.6
In Mexico:
● Five in 10 survey respondents access the Internet daily and use a PC at home to research or purchase products and services. Within this group,
– 75 percent use smartphones to shop in the store.
– Interest in personalized offers and services is much higher than in the United States.
– More than 70 percent now expect better values, increased price transparency, and greater ease and speed.
– Interest in the in-store Mashop concepts was the highest of the five surveyed nations.
● Friends and family have the greatest influence on purchase decisions, followed by manufacturer websites, in-store displays, and social media.
● The percentage of the Mexican population with broadband Internet access was estimated at year end 2011 to be 37 percent.7
Cisco IBSG © 2013 Cisco and/or its affiliates. All rights reserved. Page 15
Point of View
Endnotes 1. The research findings described in this paper build on the original Mashop research
introduced at the 2011 and 2012 National Retail Federation (NRF) Annual Convention & Expo. Please contact the authors to receive copies of the last two years’ Mashop thought leadership materials.
2. For the purposes of this survey, ages for each generation are:
– Gen Y: 18-29
– Gen X: 30-49
– Boomers: 50-64
– Silvers: 65 and older
3. Percentage of non-grocery revenue transacted online in 2012 and 2015: Forrester, 2012.
4. Forrester, 2012; Statista.com, 2012; Cisco IBSG, 2012. 5. World Internet Statistics, U.S. Census Bureau. 6. Ibid.
7. Ibid.