catalyst synthesis under co2 electroreduction favours
TRANSCRIPT

Articleshttps://doi.org/10.1038/s41929-019-0397-1
1Department of Electrical and Computer Engineering, University of Toronto, Toronto, ON, Canada. 2Department of Mechanical and Industrial Engineering, University of Toronto, Toronto, ON, Canada. 3Advanced Photon Source, Argonne National Laboratory, Lemont, IL, USA. 4Department of Chemistry, University of Toronto, Toronto, ON, Canada. 5Department of Pharmaceutical Sciences, Leslie Dan Faculty of Pharmacy, University of Toronto, Toronto, ON, Canada. 6These authors contributed equally: Yuhang Wang, Ziyun Wang, Cao-Thang Dinh, Jun Li. *e-mail: [email protected]
The utilization of CO2 contributes to closing the anthropogenic carbon cycle. Electrochemical reduction is a promising strat-egy to fulfil this goal by converting CO2 to fuels and value-
added feedstocks using renewable electricity1. Among the products, C2+ hydrocarbons and oxygenates—such as ethylene (C2H4), ethanol (EtOH) and n-propanol (n-PrOH)—are attractive in view of their major roles in the chemical industry2. However, it remains challeng-ing to catalyse the formation of these multicarbon compounds with high selectivity via the CO2 reduction reaction (CO2RR). The multi-step nature of the reaction and multiple competing pathways make the design of catalysts for desired C2 products a challenging problem3–5.
Copper-based materials have so far been the most efficient in electrocatalysing the conversion of CO2 to C2+ hydrocarbons and oxygenates6–9. Tailoring the copper surface using materials chemis-try with the goal of directing the binding of the intermediate in each reaction step offers routes to improve selectivity further towards desired multicarbon products9,10.
Electrochemical reduction of high-oxidation-state copper spe-cies offers one avenue to realize selective and active C2+ product for-mation7,11–14. However, the Faradaic efficiency (FE) for C2+ products has until now remained near or below 80% (refs. 7,8,10). We sought further means to tune the exposed active sites in a polycrystalline copper catalyst to enhance the selectivity towards C2+ products.
Cu(100) and step facets such as Cu(211) are active for CO dimerization, a key elementary step in producing C2+ products15–18. Colloidally synthesized copper nanocubes—which are rich in Cu(100) facets—have been shown to achieve a ~76% FE towards C2+ products (Supplementary Fig. 1).
Capping agents that adsorb on Cu(100) facets were used in pre-vious approaches to Cu(100)-rich catalyst syntheses, lowering their surface energy19,20. We reasoned an approach to Cu(100)-rich cop-per synthesis, in which the CO2RR intermediates would have strong interactions with Cu(100) facets, could increase the exposure of surface Cu(100). We pursued the in situ favouring of copper fac-ets during copper catalyst synthesis by ensuring the presence of the CO2RR intermediates during the electrodeposition of copper and developed an approach that considerably improves selectivity at high current densities. We increased the proportion of Cu(100) facets by 70% and consequently achieved a 90% FE for C2+ products at a partial current density of 520 mA cm−2, a full-cell C2+ power conversion efficiency (PCE) of 37% and nearly constant C2H4 selec-tivity for over 65 h of operation.
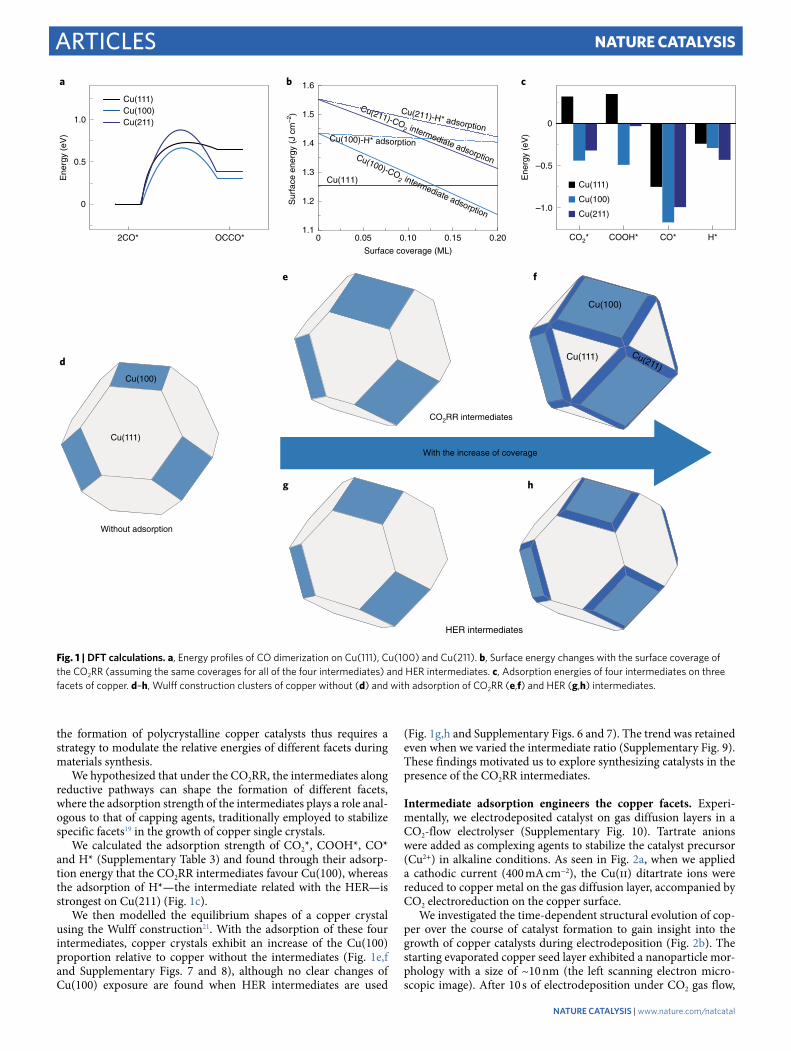
ResultsDensity functional theory calculations. We first investigated the energetics of copper facets with low Miller indices by calculating the surface energies using density functional theory (DFT). The activa-tion energy and enthalpy change of CO dimerization on Cu(100) are 0.66 eV and 0.30 eV, respectively, which are lower than in the case of Cu(111) (0.72 and 0.65 eV) and Cu(211) (0.87 and 0.39 eV) (Fig. 1a, Supplementary Figs. 2–4 and Table 1). Similar trends are seen across relevant applied potentials (Supplementary Table 2). According to the calculated surface energies (1.25 J cm−2 for Cu(111), 1.43 J cm−2 for Cu(100) and 1.55 J cm−2 for Cu(211)), the most stable facet in polycrystalline copper is Cu(111) (Fig. 1b, Supplementary Figs. 5 and 6, and Table 3–5). Stabilizing the less-favoured Cu(100) during
Catalyst synthesis under CO2 electroreduction favours faceting and promotes renewable fuels electrosynthesisYuhang Wang 1,6, Ziyun Wang 1,6, Cao-Thang Dinh 1,6, Jun Li 1,2,6, Adnan Ozden2, Md Golam Kibria1, Ali Seifitokaldani1, Chih-Shan Tan1, Christine M. Gabardo 2, Mingchuan Luo1, Hua Zhou3, Fengwang Li 1, Yanwei Lum 1, Christopher McCallum2, Yi Xu 2, Mengxia Liu 1, Andrew Proppe 1,4, Andrew Johnston 1, Petar Todorovic1, Tao-Tao Zhuang1, David Sinton 2, Shana O. Kelley4,5 and Edward H. Sargent 1*
The electrosynthesis of C2+ hydrocarbons from CO2 has attracted recent attention in light of the relatively high market price per unit energy input. Today’s low selectivities and stabilities towards C2+ products at high current densities curtail system energy efficiency, which limits their prospects for economic competitiveness. Here we present a materials processing strategy based on in situ electrodeposition of copper under CO2 reduction conditions that preferentially expose and maintain Cu(100) facets, which favour the formation of C2+ products. We observe capping of facets during catalyst synthesis and achieve control over faceting to obtain a 70% increase in the ratio of Cu(100) facets to total facet area. We report a 90% Faradaic efficiency for C2+ products at a partial current density of 520 mA cm−2 and a full-cell C2+ power conversion efficiency of 37%. We achieve nearly constant C2H4 selectivity over 65 h operation at 350 mA cm−2 in a membrane electrode assembly electrolyser.
NATuRE CATALYSiS | www.nature.com/natcatal
Articles Nature Catalysis
the formation of polycrystalline copper catalysts thus requires a strategy to modulate the relative energies of different facets during materials synthesis.
We hypothesized that under the CO2RR, the intermediates along reductive pathways can shape the formation of different facets, where the adsorption strength of the intermediates plays a role anal-ogous to that of capping agents, traditionally employed to stabilize specific facets19 in the growth of copper single crystals.
We calculated the adsorption strength of CO2*, COOH*, CO* and H* (Supplementary Table 3) and found through their adsorp-tion energy that the CO2RR intermediates favour Cu(100), whereas the adsorption of H*—the intermediate related with the HER—is strongest on Cu(211) (Fig. 1c).
We then modelled the equilibrium shapes of a copper crystal using the Wulff construction21. With the adsorption of these four intermediates, copper crystals exhibit an increase of the Cu(100) proportion relative to copper without the intermediates (Fig. 1e,f and Supplementary Figs. 7 and 8), although no clear changes of Cu(100) exposure are found when HER intermediates are used
(Fig. 1g,h and Supplementary Figs. 6 and 7). The trend was retained even when we varied the intermediate ratio (Supplementary Fig. 9). These findings motivated us to explore synthesizing catalysts in the presence of the CO2RR intermediates.
Intermediate adsorption engineers the copper facets. Experi-mentally, we electrodeposited catalyst on gas diffusion layers in a CO2-flow electrolyser (Supplementary Fig. 10). Tartrate anions were added as complexing agents to stabilize the catalyst precursor (Cu2+) in alkaline conditions. As seen in Fig. 2a, when we applied a cathodic current (400 mA cm−2), the Cu(ii) ditartrate ions were reduced to copper metal on the gas diffusion layer, accompanied by CO2 electroreduction on the copper surface.
We investigated the time-dependent structural evolution of cop-per over the course of catalyst formation to gain insight into the growth of copper catalysts during electrodeposition (Fig. 2b). The starting evaporated copper seed layer exhibited a nanoparticle mor-phology with a size of ~10 nm (the left scanning electron micro-scopic image). After 10 s of electrodeposition under CO2 gas flow,
Cu(111)
Cu(100)
Cu(111)
Cu(100)
Cu(211)
Without adsorption
2CO* OCCO*
Cu(111)Cu(100)Cu(211)1.0
0.5
0
Ene
rgy
(eV
)
a
Cu(111)
Cu(100)
Cu(211)
CO2* COOH* CO* H*
–1.0
–0.5
0
Ene
rgy
(eV
)
b
0 0.05 0.10 0.15 0.201.1
1.2
1.3
1.4
1.5
1.6
Cu(100)-H* adsorption
Cu(211)-H* adsorption
Sur
face
ene
rgy
(J c
m–2
)
Surface coverage (ML)
Cu(111)
Cu(100)-CO2 intermediate adsorption
Cu(211)-CO2 intermediate adsorption
c
CO2RR intermediates
HER intermediates
With the increase of coverage
d
e f
g h
Fig. 1 | DFT calculations. a, Energy profiles of CO dimerization on Cu(111), Cu(100) and Cu(211). b, Surface energy changes with the surface coverage of the CO2RR (assuming the same coverages for all of the four intermediates) and HER intermediates. c, Adsorption energies of four intermediates on three facets of copper. d–h, Wulff construction clusters of copper without (d) and with adsorption of CO2RR (e,f) and HER (g,h) intermediates.
NATuRE CATALYSiS | www.nature.com/natcatal

ArticlesNature Catalysis
copper with a particle size of ~20 nm was formed (labelled Cu-CO2 in Fig. 2b). Cross-sectional secondary electron and backscattered electron images confirmed a ~200 nm thickness of this copper layer (Supplementary Fig. 11a). Extending the deposition time to 60 s increased the size to ~50 nm, with dendritic structures form-ing simultaneously. The thickness of the 60 s copper catalyst layer (labelled Cu-CO2-60) is ~600 nm (Supplementary Fig. 11b).
As a control experiment to check whether CO2 played a role during catalyst synthesis, we grew catalysts whose synthesis was accompanied by H2 evolution only (labelled Cu-HER) by replacing CO2 with N2 gas at the same flow rate. The copper catalyst layer that was formed in 10 s under N2 gas exhibited a grain size of ~20 nm with a ~300 nm thickness (Supplementary Fig. 12a). After 20 s, we observed an aggregate size of ~200 nm, with larger dendrites form-ing (Supplementary Fig. 8a); the catalyst layer exhibited a thickness of ~500 nm, which is similar to the thickness of Cu-CO2 formed in 60 s (Supplementary Fig. 13b). After 60 s, the Cu-HER crystals were predominantly dendritic structures (Fig. 2b) with lengths ranging from 0.5 to 2 μm (Supplementary Fig. 12b).
Cu(111) and Cu(100) coexist on both Cu-CO2 and Cu-HER catalysts, as evidenced by high-resolution transmission electron microscopy (Supplementary Figs. 14–16) and grazing-incidence wide-angle X-ray scattering (GIWAXS, Fig. 2c, and Supplementary Figs. 17 and 18). However, the Cu-CO2 catalysts exhibited a lower X-ray diffraction peak intensity than the Cu-HER counterparts did in the same deposition time (Supplementary Fig. 18). The results indicate qualitatively that less copper was deposited in the presence of CO2 gas. We further checked the crystal structure of the catalysts using dark-field high-resolution transmission electron microscopy (Supplementary Figs. 14–16). The results show that the Cu-CO2-60 catalysts exhibit less Cu(111) facet exposure compared with Cu-HER-20.
We then sought to quantify the difference in the catalyst for-mation and facet exposure. We performed a series of operando studies for real-time monitoring of catalyst formation. Using operando Raman spectroscopy, we observed chemisorbed inter-mediates when CO2 was present (Supplementary Fig. 19) and we used operando hard X-ray absorption spectroscopy (hXAS)
2
3
4
5
6
7
89
q (A
–1)
Cu (200)
Cu (111)
Cu (220)
Cu (311)
9 s 18 s 27 s 36 s 45 s 63 s
Cu-CO2
Evaporated Cu
Cu-CO2
Cu-HER
60 s
60 s
b10 s
10 s
CO2
Cu(II) ditartrate
Cu
Cu(II) ditartrate
CO2
Cu (100)
Cu(II) ditartrate
CO2
CO*Cu
Intermediate induced Cu catalyst formation
a
c
Fig. 2 | The influence of intermediate adsorption on copper clustering. a, A schematic illustration of intermediate adsorption controlling which copper facets are exposed. The chemisorbed intermediates (for example, CO*) act as capping agents, leading to a high portion of Cu(100) in the forming catalyst. b, The time-dependent morphological change of Cu-CO2 (upper arrows) and Cu-HER (lower arrows) during electrodepositions at 400 mA cm−2 in 1 M KOH containing the copper precursor. The scale bars are 100 nm for the evaporated copper seeds and 10 s samples, and 200 nm for the 60 s copper samples. c, Two-dimensional GIWAXS patterns of the Cu-CO2 catalysts with respect to the deposition time.
NATuRE CATALYSiS | www.nature.com/natcatal

Articles Nature Catalysis
to track the electrochemical formation of copper as a function of time (Fig. 3a,b). We analysed the X-ray absorption near-edge structure of the copper crystals by linear combination fitting (Supplementary Figs. 20 and 21, and Tables 6 and 7). The starting spectrum exhibits a Cu2+ complex feature ascribed to the Cu(ii) ditartrate ions in the electrolyte. The ratio of metallic copper to Cu(ii) ditartrate for Cu-CO2 reaches roughly 50:50 after 60 s (Fig. 3c, upper panel); however, for Cu-HER, a similar ratio of ~53:47 is obtained at 27 s, and it further increases to ~88:12 fol-lowing 60 s (Fig. 3c, lower panel).
As different copper facets feature distinctive (and previously documented22) OH− electrochemical adsorption behaviour, we sought to quantify Cu(100) exposure using the OH− electroadsorp-tion technique (Supplementary Fig. 22)23. Linear sweep voltam-metry profiles reveal electrochemical OH− adsorption peaks (the oxidation of surface copper) on Cu(100), Cu(110) and Cu(111) at potentials ~0.37, 0.43, 0.48 V versus the reversible hydrogen elec-trode (RHE), respectively23. We calculated the surface area of each facet (see Methods) for copper catalysts that are deposited for dif-ferent time using these peaks (Fig. 3e,f). The growth of Cu(111) is substantially suppressed in the Cu-CO2-60 sample, with a Cu(111)
surface area of less than 0.9 cm2 per 1 geometric cm2 electrode (Fig. 3e). The Cu(100)-to-Cu(111) surface area ratio of Cu-CO2 is >1.7-times that of Cu- HER (Fig. 3f).
We also used lead underpotential deposition (UPD, another surface-sensitive electrochemical technique) and witnessed similar Cu(100):Cu(111) ratios for Cu-CO2 and Cu-HER cata-lysts (Supplementary Fig. 23). We extended the deposition time to 90 s for Cu-CO2 catalysts, and continued to observe a high Cu(100):Cu(111) ratio of ~0.9 ± 0.2 (Supplementary Fig. 24). From reaction-diffusion modelling, we estimate that the local pH for Cu-CO2 and Cu-HER are ~14.9 and ~14.7 (Fig. 3g), respec-tively, which argues against a considerable differential impact of local OH− on the catalyst surface structure.
We conclude that synthesis under the CO2RR reduced the amount of copper deposited and changed the surface structure. We propose a role for facet-selective capping by CO2RR interme-diates: the adsorption of the CO2RR intermediates lowers the sur-face energy of high-energy copper facets, for example Cu(100) and Cu(211). This capping effect is similar to that in colloidal crystal synthesis24,25, which modulates copper growth and increases the fraction of Cu(100) facets.
Cu formation75%
HER25%
Cu formation25%
CO2RR
69%
HER6%
d
Cu-CO2 Cu-HER
b
0 1 2 3 4 5 6
FT
[k2 *χ
(k)]
FT
[k2 *χ
(k)]
Radial distance (Å)
Cu foil
63 s
54 s
45 s
36 s
27 s
18 s
9 s
0 s
Cu-CO2 Cu-HER
a
0 10 20 30 40 50 60 70
1.0
0.8
0.6
0.4
0.2
0
Rat
io o
f met
allic
Cu
Time (s)
Met
allic
Cu
Cu(
II)M
etal
lic C
uC
u(II)
1.0
0.8
0.6
0.4
0.2
0
Cu-C
O2
Cu-H
ER
c
0 1 2 3 4 5 6
Radial distance (Å)
14.0
14.2
14.4
14.6
14.8
15.0
Loca
l pH
0 0.2 0.4 0.6 0.8 1.0
Distance to support (µm)
g
CO2 with 10 nm Cu
N2 with 10 nm Cu
CO2 with 300 nm Cu
N2 with 300 nm Cu
Cu(
100)
Cu(
100)
Cu(
111)
Cu(
111)
Cu-CO2 Cu-HER
20 40 600
1
2
3
4
5
6
Are
a (c
m2 )
Deposition time (s)
e f
20 40 600
0.5
1.0
1.5
Cu(
100)
/Cu(
111)
Deposition time (s)
Cu-CO2
Cu-HER
Cu–Cu
Cu–O
Cu–Cu
Cu–O
Fig. 3 | Analysis of the catalyst formation and the surface structures. a,b, Fourier-transformed operando hXAS spectra of the formations of intermediate Cu-CO2 and Cu-HER with respect to time at 400 mA cm−2 in 1 M KOH containing the copper precursor. c, The ratio of metallic copper to copper precursor over the course of catalyst formation. d, Charge distribution during the electrochemical catalyst synthesis. e,f, The surface area (e) and ratio (f) of Cu(100) and Cu(111) facets, quantified by OH− electroadsorption. Error bars correspond to the s.d. of three independent measurements. g, Local pH modelling during catalyst growth.
NATuRE CATALYSiS | www.nature.com/natcatal

ArticlesNature Catalysis
CO2 electroreduction performance. We evaluated the catalytic performance of Cu-CO2 catalysts in 7 M KOH electrolyte (Fig. 4), a catholyte in which the energy barrier for CO–CO dimerization is considerably reduced26. Using samples having similar mass load-ings, particle sizes, electrochemically active surface areas (ECSAs) (Supplementary Figs. 25–27 and Table 8) and Brunauer–Emmett–Teller surface areas (Supplementary Table 9), we tested Cu-CO2-60 and Cu-HER-20 catalysts in a 1 cm2 active area CO2RR flow cell.
To characterize the intrinsic activity of the catalysts, we nor-malized current densities using their ECSAs (Supplementary Fig. 27 and Table 6). The ECSA-normalized C2H4 and C2+ partial
current densities of Cu-CO2-60 are 1.3-times higher than those of Cu-HER-20 (Fig. 4b).
On Cu-CO2-60, the FE for C2+ products reaches its peak value of 90 ± 1% (Fig. 4c) at −0.67 V versus RHE (at a full-cell voltage of 2.85 V without iR correction, Supplementary Fig. 28), with a C2+ partial current density of ~280 mA cm−2. The C2+ liquid prod-ucts include EtOH, PrOH and acetate (AcO−, Supplementary Fig. 29). This result translates to a ~37% C2+ full-cell PCE (Fig. 4d and Supplementary Table 10). At −0.71 V, Cu-CO2-60 exhibits a partial current density of ~520 mA cm−2 with a similarly high FE and a 29% PCE for C2+ products (Fig. 4c).
–0.8 –0.6 –0.4 –0.2–600
–500
–400
–300
–200
–100
0
j (m
A c
m–2
)j (
mA
cm
–2)
Potential (V versus RHE)
–0.4 –0.5 –0.6 –0.70
20
40
60
80
100
Far
adai
c ef
ficie
ncy
(%)
Far
adai
c ef
ficie
ncy
(%)
Potential (V versus RHE)
H2COHCOO-CH4
AcO-PrOHEtOHC2H4
–0.4 –0.5 –0.6 –0.70.1
1
10
EC
SA
nor
mal
ized
j (m
A c
m–2
)
Potential (V versus RHE)
jC2+
jC2H4
Cu-CO2-60
jC2+
jC2H4
Cu-HER-20
a b c
ed
–0.2 –0.3 – 0.4 –0.5 –0.6 –0.7 –0.8 –0.9
0
20
40
60
80
100
Potential (V versus RHE)
C O
C2+
C2H4
Cu-CO2-60
Cu-HER-20
f
0 10 20 30 40 50 60–500
–400
–300
–200
–100
0
Time (h)
20
30
40
50
60
70
C2 H
4 Faradaic efficiency (%
)–3.7 V full-cell voltage in a 5 cm2 MEA electrolyser
C2H4
C2+ C2+
Cu-CO2-60 C2H4
Cu-HER-20
100 200 300 400 500 600 700 8000
10
20
30
40
Ful
l-cel
l PC
E (
%)
jtotal (mA cm–2)
jC2+
jC2H4
Cu-CO2-60
jC2+
jC2H4
Cu-HER-20
Fig. 4 | CO2 electroreduction performance. a, j–V plots of the partial current densities of the C2H4 and C2+ products versus the potential (with 90% iR correction) on Cu-CO2-60 and Cu-HER-20 in 7 M KOH. b, The ECSA-normalized partial current densities of the C2H4 and C2+ products. c, The Faradaic efficiencies for each CO2RR product and H2 on Cu-CO2-60 at various potentials ranging from −0.38 to −0.74 V versus RHE in 7 M KOH. d, A comparison of full-cell PCEs of C2H4 and C2+ on Cu-CO2-60 and Cu-HER-20 in the current density range of 130−780 mA cm−2 without iR correction in 7 M KOH. e, A comparison of the Faradaic efficiencies of C2H4, C2+ and CO on Cu-CO2-60 and Cu-HER-20 catalysts in 7 M KOH. f, The stability obtained at −3.7 V (without iR correction) in a 5 cm2 MEA electrolyser. The anolyte was 0.15 M KHCO3. Error bars in c–e correspond to the s.d. of three independent measurements.
NATuRE CATALYSiS | www.nature.com/natcatal
Articles Nature Catalysis
By contrast, the highest C2+ FE and partial current density on the Cu-HER-20 catalyst are 77 ± 2% and 337 mA cm−2 (Fig. 4c and Supplementary Fig. 30); the corresponding C2+ full-cell PCE is 31% (Fig. 4c).
Considering the similarity of CO2 and CO reduction reac-tions, we also electrodeposited copper under CO gas and obtained 68 ± 4% and 83 ± 2% FE for C2H4 and C2+ products (Supplementary Fig. 31a,b). The CO2RR performance on the 50 nm copper seeds were also investigated (Supplementary Fig. 32). A detailed perfor-mance of the CO2RR for each catalyst is shown in Supplementary Tables 13–17.
As the chemisorbed CO is further converted to C2+ products11,27, we plotted the potential-dependent CO and C2+ selectivity trend (Fig. 4e). Compared with Cu-HER-20, Cu-CO2-60 exhibits a higher CO selectivity, peaking at 35 ± 1% at lower overpotentials, which is ~1.7 times as high as that on Cu-HER-20 (Supplementary Tables 11 and 14). The higher CO production on the Cu-CO2-60 catalyst at lower overpotentials agrees with a picture of higher CO* inter-mediate availability when we move to higher overpotentials. As the Cu-CO2-60 catalysts differs from the Cu-HER-20 principally in terms of the surface exposure of Cu(100) and Cu(111) facets, this selectivity difference at lower potentials agrees with the view that the higher performance on Cu-CO2 arises from optimized facet exposure.
Alkaline conditions provide high selectivity for C2+ products (Supplementary Fig. 33) and reduce overpotentials for the CO2RR and oxygen evolution at the anode, which lowers the full-cell volt-age (Supplementary Fig. 28). However, CO2 reacts with KOH and forms carbonates under alkaline conditions, which requires addi-tional energy costs for its regeneration (Supplementary Fig. 34). Neutral CO2RR reduces the carbonate formation problem. We developed Cu-CO2-60 catalysts with a 5 cm2 active area integrated with a membrane electrode assembly (MEA) and used these in an electrolyser with 0.15 M KHCO3 anolyte. We achieved 65 h of stable operation with constant C2H4 FE of 60 ± 2% at an applied full-cell voltage of −3.7 V and current density of 350–300 mA cm−2 (Fig. 4f and Supplementary Fig. 35). This translates to a 25-fold increase in stability at current densities higher than 300 mA cm−2 compared with the best past reports of high-current-density CO2-to-C2+ prod-uct electroreduction6,7,9,10,12 (Supplementary Table 10).
Following a 1000 s CO2RR operation, we found that the Cu(100):Cu(111) ratio was well retained (Supplementary Fig. 36), while destructive morphological changes to the copper nanocu-bes were seen after the CO2RR (Supplementary Fig. 37). Higher overpotentials and current densities cause more frequent electron exchanges between the catalyst and intermediates, different surface energies for the different facets and increased diffusion of copper atoms and surface bubble formation. Copper nanocubes could also be susceptible to morphological reconstruction as high alkaline conditions may culminate in regions that are less accessible to CO2 at the catalytic interface26.
When a catalyst is operated under the CO2RR, the intermedi-ate coverages on Cu(111), Cu(100) and Cu(211) facets are 0.01, 0.33, and 0.29 ML (Supplementary Figs. 6 and 9a)—these coverages are based on a previous study of Nørskov and co-workers28. With a 0.01 ML CO2RR intermediate coverage, the Cu(111) facet has a surface energy of 1.25 J cm−2 and is 0.16 J cm−2 more stable than Cu(100) with the same coverage (Fig. 1a and Supplementary Fig. 6). The direct conversion of Cu(111) to Cu(100) is therefore not favoured under CO2RR conditions.
By contrast, when we electrodeposit under CO2-rich conditions, we are no longer required to convert non-(100) facets to Cu(100); instead, we redirect Cu2+-to-Cu electroreduction towards Cu(100). The surface energy associated with Cu(100) decreases to 1.0 J cm−2, which is 0.26 J cm−2 more stable than that of Cu(111), due to a 0.33 ML CO2RR intermediate coverage (Supplementary Fig. 9a).
The Wulff constructions present the thermodynamic equilib-rium shapes of copper crystals with different intermediate cover-ages (Fig. 1d–h and Supplementary Figs. 7–9). The experiments agree with this picture, with a Cu(100):Cu(111) ratio up to 1.4:1 in the Cu-CO2 catalyst (Fig. 3f).
Over the course of CO2 electroreduction, the Cu2O feature that results post-oxidation (Supplementary Fig. 38) diminishes quickly once the potential is applied (Supplementary Figs. 39–42). This, when combined with the operando Raman results (Supplementary Fig. 19), indicates that the CO2RR activity on both catalysts origi-nates from metallic copper. As a similar coordination number was observed for the two catalysts (Supplementary Tables 18 and 19), neither the size effect29 nor the subsurface oxygen of copper seems to determine the differences in selectivity and activity7. Catalysts with different deposition times under the same gas also exhibit sim-ilar FE for C2H4 product (Supplementary Figs. 31b,c and 43). This result further argues against a major effect of size on the CO2RR selectivity reported herein.
To explore the wider application of this CO2RR-tailored cata-lyst synthesis strategy, we further prepared oxide-derived sil-ver under CO2RR and HER conditions (Ag–CO2 and Ag–HER, Supplementary Fig. 44). We observed a ×1.5 increase in the area of Ag(110) facet (~3 cm2)—the most active facet for CO2-to-CO on Ag (ref. 5)—on Ag-CO2 (Supplementary Fig. 44g,h). The maximum FE for CO was ~92% on Ag-CO2, 1.4-times higher than on Ag–HER (~66%) (Supplementary Fig. 44i).
ConclusionThis work presents a catalyst materials synthesis strategy that seeks to expose and maintain C2+-selective Cu(100) facets preferentially, and thereby selectively produce C2+ products at high current via the CO2RR. We capitalized on CO2RR intermediate adsorption to tune which copper facets are exposed. We demonstrate that CO2RR intermediates (for example, CO) can be used to regulate the crystal-lization of materials beyond noble metals30–32. We offer a physical picture in which the intermediates function in analogy with cap-ping agents, regulating the growth of catalysts to produce a highly active catalyst with a high proportion of Cu(100). Only as a result do we achieve high-selectivity-at-high-current-density CO2 electro-reduction to C2+ products and C2H4 on copper catalysts. Specifically, we obtain a FE for total C2+ products of ~90% at current densities exceeding 580 mA cm−2 and full-cell PCE for C2+ products of ~37%. We achieved a constant C2H4 FE for 65 h of operation. We dem-onstrated the wider applicability of this CO2RR-processed cata-lyst-faceting strategy, increasing Cu(110) facet exposure on silver catalysts and achieving as a result 92% CO FE. In situ materials pro-cessing provides an avenue to expose preferentially and maintain the active sites needed in reactions, contributing additional prin-ciples for designing selective and active catalysts. The topic warrants further study to deepen and extend physical models of capping using intermediates during catalyst synthesis versus catalyst opera-tion, including through the use of advanced operando methods that simultaneously monitor both the presence of intermediates, and of catalyst facets and shape, in situ.
MethodsDFT calculations. All of the DFT calculations in this work were carried out with a periodic slab model using the Vienna ab initio simulation program33–36. The generalized gradient approximation was used with the Perdew–Burke–Ernzerhof exchange-correlation functional37. The projector-augmented wave method38,39 was used to describe the electron–ion interactions and the cut-off energy for the plane wave basis set was 450 eV. To illustrate the long-range dispersion interactions between the adsorbates and catalysts, we employed the D3 correction method used by Grimme et al.40 with Becke–Jonson damping41. Brillouin zone integration was accomplished using a 3 × 3 × 1 Monkhorst-Pack k-point mesh. The atomic coordinates of the optimized models are provided in Supplementary Data 1.
Adsorption geometries were optimized using a force-based conjugate gradient algorithm, whereas transition states were located with a constrained minimization
NATuRE CATALYSiS | www.nature.com/natcatal

ArticlesNature Catalysis
technique42–44. For the modelling of copper, the crystal structure was optimized and the equilibrium lattice constants were found to be aCu = 3.631 Å. Three low Miller index planes were cleaved, including Cu(100), Cu(111) and Cu(211). For Cu(100), a periodic six-layer model was used, with the three lower layers fixed and two upper layers relaxed, and a p(3 × 3) super cell was chosen. For Cu(111), we used a four-layer model with a p(3 × 3) super cell, with the two upper layers relaxed and the two lower layers fixed. Cu(211) was modelled with a periodic 12-layer p(1 × 3) model with the six lower layers fixed and six upper layers relaxed. Convergence tests of the different layers are detailed in Supplementary Table 5. At all intermediate and transition states, one charged layer of water molecules was added to the surface to take the combined field and solvation effects into account45. The charged layer of water molecules was optimized at all intermediate and transition states. There is no proton or electron transfer in the CO dimerization, thus the computational hydrogen electrode was not used in this work.
For the full solvent calculations, the total number of waters considered is 25 Cu(100), 21 for Cu(111) and 21 for Cu(211), as seen in Supplementary Fig. 4. We used the reactive force-field to run a 1 ns molecular dynamic on all facets. The force-field developed by van Duin and co-workers46 was chosen as it was also used by Goddard and co-workers to describe the conditions of the water–surface interface47.
We used the charge-asymmetric non-locally determined local-electric solvation model to describe the effect of applied potentials on adsorption and reaction energies48. We used the same settings as Goddard and co-workers in their study of the CO2RR mechanism49. For the effect of potential, we used the grand canonical electronic DFT50 implemented in JDFTX (v. 1.4.2)51 to evaluate the adsorption energies at different applied potentials.
To evaluate the stability of one surface, the surface energy was used as defined below:
Esurface ¼Etotal � nEref � Eads
2Að1Þ
where Etotal is the total energy of this surface from DFT calculations; Eref is the reference energy of unit composition from bulk calculation; Eads is the sum of the adsorption energies of the intermediates at given coverages; A is the surface area; and n is the number of unit composition in this surface. Given this definition, the more positive the surface energy is for a surface, the less stable this surface is.
Wulff constructions were performed using the Python Materials Genomics (pymatgen) materials analysis library52. In this work, CO2RR intermediates refer to CO2*, CO*, COOH* and H*, whereas HER intermediates are H*. Surface energies with adsorption of four intermediates states were calculated by assuming that the coverages are the same for all of the four intermediates; for example, the coverage was assumed to be 0.05 ML for all of the four intermediates at 0.2 ML total coverage. The total coverage value of CO2RR intermediates (0.2 ML) is chosen because it is the total coverage of each intermediate adsorbing on one side of a 3 × 3 surfaces. To maintain consistency with Cu(111) and Cu(100), the Cu(211) surface was assumed to have nine sites. In a realistic system the coverage of the species should be larger and the values for different intermediates should be diverse. Nørskov and co-workers reported that the coverage of CO is ~0.3 ML on copper surfaces on the basis of a microkinetic modelling28. The value of 0.2 ML is considered only to show the trend that the Cu(100) concentration increases even at a low coverage of intermediates. The surface energies with intermediates are calculated in respect of Cu(111).
Catalyst preparation. Cu-CO2 catalysts were prepared through an electrodeposition approach under CO2 gas flow (50 standard cubic centimetres per minute, s.c.c.m.). Catalysts were electrodeposited at a constant current of −0.4 A cm−2 for 60 s on a gas diffusion layer (Freudenberg H14C9, for characterizations) or a polytetrafluoroethylene (PTFE) membrane (pore size of 450 nm) with 50 nm sputtered copper seeds (for electrochemical tests). The solution consisted of 0.1 M copper bromide (98%, Sigma-Aldrich), 0.2 M sodium tartrate dibasic dihydrate (purum pro analysis ≥ 98.0% non-aqueous titration (NT), Sigma-Aldrich) and 1 M KOH. For Cu-CO and Cu-HER, the catalyst was synthesized under identical conditions as Cu-CO2, but with CO and N2 or argon at the same flow rate instead of CO2.
For copper nanocubes, 46 mg hexadecyltrimethylammonium chloride (≥98.0% NT, Sigma-Aldrich) was dissolved in 9.8 ml deionized water; 50 μl 0.1 M copper acetate (97%, Sigma-Aldrich) and 0.2 ml 0.5 M (+)-sodium l-ascorbate (≥98.0% NT, Sigma-Aldrich) aqueous solution were then added. The solution was transferred into a gas-light vial and kept in a 100 °C oven for 1 h. The reddish copper nanocubes were then centrifugated, washed using deionized water and dried in vacuum; 6 mg copper nanocubes were obtained in 200 ml precursor solution. The copper nanocubes were then mixed with 10 μl Nafion resin solution in 1 ml methanol, sonicated for 30 min and then sprayed onto a 5 × 5 cm2 PTFE membrane with the 50 nm sputtered copper layer.
For the silver catalysts, the Ag2O precursor was prepared by mixing 25 ml 0.05 M AgNO3 (98%, Sigma-Aldrich) with 1.4 g KOH. The as-made Ag2O particles were then spray coated onto a 1 cm2 gas diffusion layer with a mass loading of 0.3 mg cm−2; Ag–CO2 and Ag–HER catalysts were prepared by electroreducing Ag2O nanoparticles at a constant current of −0.2 A cm−2 for 30 s under CO2 and N2, respectively.
Materials characterization. Scanning electron microscopy (Hitachi S-5200) and transmission electron microscopy (Hitachi HF3300) were employed to observe the morphology of the samples. X-ray photoelectron spectroscopy (XPS) measurements were carried out on a K-Alpha XPS spectrometer (PHI 5700 ESCA System), using aluminium Kα X-ray radiation (1486.6 eV) for excitation. Operando hard X-ray absorption measurements were performed at the 9BM beamline and GIWAXS measurements were conducted at the 12-ID-D beamline of the Advanced Photon Source (APS) located in the Argonne National Laboratory (Lemont). Raman measurements were conducted using a Renishaw inVia Raman microscope and a water immersion objective (×63) with a 785 nm laser.
Electrochemical OH− adsorption, Pb UPD and ECSA evaluation. Electrochemical OH− adsorption was performed in a N2-saturated 1 M KOH electrolyte with a linear sweep voltammetry method at a sweep rate of 100 mV s−1 for copper and 20 mV s−1 for silver catalysts. The potential ranged from −0.2 to 0.6 V versus RHE for copper. All copper catalysts were reduced at −0.6 V versus RHE for 2 min before performing the OH− adsorption measurement. The single-crystal Cu(100) and Cu(111) substrates were measured using the same method. The facet area was calculated by normalizing the OH− adsorption charge of each facet on copper catalysts to that on the single crystals. For silver, catalysts were first reduced at −0.6 V versus RHE for 30 s, and the potential range was 0.83 to 0.93 V versus RHE; N2 was kept being purged during the measurement.
For the lead UPD, a N2-saturated 0.1 M HClO4 aqueous solution with 10 mM Pb(ClO4)2 was used as the electrolyte. The potential was first set at −0.15 V versus RHE for 150 s. Linear sweep voltammetry with a sweep rate of 10 mV s−1 was used for measurements. The potential ranged from 0.17 to 0.2 V versus RHE; N2 was purged during these measurements. The facet area was calculated by normalizing the lead UPD charge of each facet on copper catalysts to that on copper single crystals.
The electrochemical double-layer capacitance method was employed for the ECSA evaluation. All of the catalysts were reduced at −0.6 V versus RHE for 2 min and scanned in the potential range of −0.07 to 0.13 V and 0.83 to 0.93 V versus RHE for the copper and silver catalysts, respectively, in N2-saturated 1 M KOH for ten cycles at sweep rates of 20, 40, 60, 80 and 100 mV s−1; N2 was purged during the measurement. The anodic and cathodic current densities (Δj) at 0.03 V versus RHE for copper and 0.88 V versus RHE for silver were recorded in the last scan cycle. The differences in these two values of Δj at different sweep rates were then calculated and plotted against the sweep rates for each catalyst. By linear fitting, we calculated the slopes of the Δj values versus sweep rate curves, which are the double-layer capacitances for different catalysts. The double-layer capacitance of electropolished copper foil was obtained from previous reports53.
Local pH simulation. The local pH was simulated based on previous reports54, accounting for CO2(aq.), CO3
2−, HCO3− and OH− evolution as CO2(aq.) is
reduced via electrocatalysis in 1 M KOH. We modelled the four ionic species using the Transport of Dilute Species physics in COMSOL Multiphysics55 in a two-dimensional rectangular domain. A time-dependent study was performed to simulate species evolution away from the interface. At the left boundary (that is, the gas-catalyst-electrolyte interface) the CO2(aq.) concentration was the equilibrium concentration in the bulk electrolyte (defined as [CO2]aq,0), which was specified according to Henry’s Law and the Sechenov effect56–58, with zero flux imposed for CO3
2−, HCO3−, and OH−. The top and right boundaries
allow for species outflow, and the bottom boundary concentrations are those of the bulk solution.
To model CO2RR, a thin vertical catalyst layer was imposed over which CO2(aq.) is reduced and OH− is produced according to the reactions:
RCO2 ¼CO2½ aqCO2½ aq;0
jF
ϵ
Lcat
1 CO2
2e�ð2Þ
ROH ¼ jF
ϵ
Lcat
2OH�
2e�ð3Þ
where [CO2]aq is the equilibrium concentration of aqueous CO2 in the bulk electrolyte, RCO2
I and ROH are the reaction rates determined by carbonate acid–base
equilibria and by CO2RR for CO2(aq) and OH−, j is the current density applied, F is the Faraday constant, ϵ is the catalyst porosity (0.6) and Lcat is the size of the catalyst layer (varied from 10 nm to 300 nm). The left CO2(aq.) boundary condition in conjunction with OH− production in the catalyst layer supports carbonate formation, producing a diffusion layer that grows away from the left boundary. We assume a 2e− process for the reduction of CO2 (equation (2)) to CO with 100% Faradaic efficiency. The production of OH− (equation (3) depends only on the current density as both CO2RR and HER produce OH−. The species’ diffusion coefficient, as well as the chemical dissociation reaction equations of CO2(aq.) were found in previous literature59.
XAS fitting. An IFEFFIT (v. 1.2.11) package was used to analyse the hXAS spectra60,61. Standard data-processing, including energy calibration and spectral normalization of the raw spectra, was performed using Athena (v. 0.8.056)
NATuRE CATALYSiS | www.nature.com/natcatal

Articles Nature Catalysis
software. To track the copper valence distribution, a linear combination fitting analysis, included in Athena, was carried out using the hXAS spectra of various copper-based standards. To extract the copper bonding information, a Fourier transform was applied to convert the hXAS spectra from an energy space to a radial distance space. A standard fitting analysis of the first shell between 1.6 and 3.0 Å was then carried out using Artemis software. The phase and amplitude functions of Cu–Cu were calculated with FEFF6; a S20=σ2
I value of 0.89/0.00825 (S20
I
is the amplitude reduction factor, whereas σ2 is the Debye–Waller factor of the first atomic shell of Cu–Cu) was determined for copper from copper foil, which then was applied to the copper hXAS fitting.
GIWAXS measurements. GIWAXS measurements were performed at 12-ID-D beamline of the APS at the Argonne National Laboratory. The catalyst samples were mounted on a Huber six-circle diffractometer that can precisely control the X-ray angle of incidence to achieve the grazing-incidence condition for GIWAXS. The scattering patterns were obtained at an incident angle of 0.3°. The X-ray diffraction measurements were conducted at the X-ray energy of 20 keV with the beam profile of 500 μm (horizontal) × 70 μm (vertical). The sample stage was rotated by 180° along the out-of-plane axis during the measurement and scattering patterned were recorded at every 2°. Ninety patterns were acquired and integrated to obtain a single scattering pattern for each sample.
Electrocatalytic measurement of CO2 reduction. The electrocatalytic measurements were carried out in a 1 cm2 electrochemical flow cell using a three-electrode configuration with 90% iR correction. The flow cell was connected to an electrochemical workstation (Autolab PGSTAT204) equipped with a 10 A current booster. The flow cell consisted of three compartments: gas chamber, catholyte chamber and anolyte chamber. The gas and cathodic compartments were separated by the copper (or silver) electrode. Catholyte and anolyte chambers were separated by an anion-exchange membrane (Fumapem FAA-3-PK-130). The CO2RR catalyst, Ag/AgCl electrode (3.5 M KCl used as the filling solution) and NiFe hydroxides on a nickel mesh were employed as working, reference and counter electrodes, respectively. The full-cell voltages were tested in a two-electrode configuration. The thickness of the catholyte chamber was ~5 mm. Carbon/Nafion and graphite/Nafion mixtures were sequentially sprayed on the catalyst layer on PTFE support. The applied potentials were converted to the RHE scale through the following equation:
ERHE ¼ EAg=AgCl ð3:5MKClÞ þ 0:059 ´ pHþ 0:205 ð4Þ
Aqueous KOH (7 M or 1 M), K2CO3 (0.5 M) or KHCO3 (1 M) electrolyte was used as the both catholyte and anolyte. The flow rate of the CO2 gas was fixed at 50 s.c.c.m. The gaseous products were separated by gas chromatography (PerkinElmer Clarus 600) and detected by a thermal conductivity detector and a flame ionization detector. High-purity argon (99.99%) was used as the carrier. Liquid products were quantified by 1H-NMR (Agilent DD2 600) using dimethyl sulfoxide as the internal standard. The Faradaic efficiency of the gas product was calculated on the basis of the following equation:
Faradaic efficiency ¼ ixitot
¼ nxvgascxF
itotVmð5Þ
where ix is the partial current of product x, itot is the total current, nx represents the number of electrons transferred towards the formation of 1 mol of product x, vgas is the CO2 flow rate (s.c.c.m), cx represents the concentration of product x detected by gas chromatography (ppm), F is the Faraday constant (96,485 C mol−1), and Vm is the unit molar volume, which is 24.5 l mol−1 at room temperature (298.15 K).
The PCE was defined as the ratio of fuel energy to applied electrical power, which was calculated with the following equation:
PCEx ¼ Pchem
Papplied¼ ð1:23� E0
xÞFExApplied voltage
ð6Þ
where Pchem is the power used for the CO2RR; Papplied is the input electrical energy; E0xI
represents the equilibrium potential of CO2 electroreduction to each C2+ product, which is 0.08 V for ethylene, 0.09 V for ethanol and −0.26 V for acetate; and FEx is the Faradaic efficiency for each C2+ product.
For tests in MEA electrolysers, the experimental set-up used was a commercial MEA electrolyser (Dioxide Materials, 5 cm2 active area). The MEA consisted of a cathode electrode, anion-exchange membrane (Sustainion X37-50 grade 60) and anode electrode (IrO2–Ti mesh). The anode electrode was prepared by following a methodology similar to that described in the previous report62. The resulting cathode and anode electrodes were then mounted on their respective flow fields, separated from each other via the anion-exchange membrane and assembled in the MEA electrolyser; CO2 was then supplied with a flow rate of 80 s.c.c.m. through the flow channels in the cathode flow field, whereas 0.15 M KHCO3 was fed into the anode flow channels with a flow rate of 20 ml min−1. The applied potential was increased gradually from −3.0 V to −4.2 V, with constant negative potential increments of −0.1 V. Stability tests were performed at a constant full-cell potential of −3.7 V.
Data availabilityThe datasets generated and/or analysed during the current study are available from the corresponding author on reasonable request.
Received: 5 April 2019; Accepted: 11 November 2019; Published: xx xx xxxx
References 1. Bushuyev, O. S. et al. What should we make with CO2 and how can we make
it? Joule 2, 1–8 (2018). 2. Mistry, H., Varela, A. S., Kühl, S., Strasser, P. & Cuenya, B. R. Nanostructured
electrocatalysts with tunable activity and selectivity. Nat. Rev. Mater. 1, 16009 (2016).
3. Schouten, K., Kwon, Y., Van der Ham, C., Qin, Z. & Koper, M. A new mechanism for the selectivity to C1 and C2 species in the electrochemical reduction of carbon dioxide on copper electrodes. Chem. Sci. 2, 1902–1909 (2011).
4. Hori, Y. Modern Aspects of Electrochemistry 89–189 (Springer, 2008). 5. Wang, Y., Liu, J., Wang, Y., Al-Enizi, A. M. & Zheng, G. Tuning of CO2
reduction selectivity on metal electrocatalysts. Small 13, 1701809 (2017). 6. Hoang, T. T. H., Ma, S., Gold, J. I., Kenis, P. J. A. & Gewirth, A. A.
Nanoporous copper films by additive-controlled electrodepsition: CO2 reduction catalysis. ACS Catal. 7, 3313–3321 (2017).
7. De Luna, P. et al. Catalyst electro-redeposition controls morphology and oxidation state for selective carbon dioxide reduction. Nat. Catal. 1, 103–110 (2018).
8. Mistry, H. et al. Highly selective plasma-activated copper catalysts for carbon dioxide reduction to ethylene. Nat. Commun. 7, 12123 (2016).
9. Hoang, T. T. H. et al. Nano porous copper-silver alloys by additive-controlled electro-deposition for the selective electroreduction of CO2 to ethylene and ethanol. J. Am. Chem. Soc. 140, 5791–5797 (2018).
10. Zhuang, T.-T. et al. Steering post-C–C coupling selectivity enables high efficiency electroreduction of carbon dioxide to multi-carbon alcohols. Nat. Catal. 1, 421–428 (2018).
11. Li, C. W., Ciston, J. & Kanan, M. W. Electroreduction of carbon monoxide to liquid fuel on oxide-derived nanocrystalline copper. Nature 508, 504–507 (2014).
12. Jiang, K. et al. Metal ion cycling of Cu foil for selective C–C coupling in electrochemical CO2 reduction. Nat. Catal. 1, 111–119 (2018).
13. Li, C. W. & Kanan, M. W. CO2 reduction at low overpotential on Cu electrodes resulting from the reduction of thick Cu2O films. J. Am. Chem. Soc. 134, 7231–7234 (2012).
14. Reller, C. et al. Selective electroreduction of CO2 toward ethylene on nano dendritic copper catalysts at high current density. Adv. Energy Mater. 7, 1602114 (2017).
15. Pérez Gallent, E., Marcandalli, G., Figueiredo, M. C., Calle-Vallejo, F. & Koper, M. Structure- and potential-dependent cation effects on CO reduction at copper single-crystal electrodes. J. Am. Chem. Soc. 139, 16412–16419 (2017).
16. Pérez Gallent, E., Figueiredo, M. C., Calle-Vallejo, F. & Koper, M. Spectroscopic observation of a hydrogenated CO dimer intermediate during CO reduction on Cu(100) electrodes. Angew. Chem. Int. Ed. 56, 3621–3624 (2017).
17. Hori, Y., Takahashi, I., Koga, O. & Hoshi, N. Electrochemical reduction of carbon dioxide at various series of copper single crystal electrodes. J. Mol. Catal. A: Chem. 199, 39–47 (2003).
18. Roberts, F. S., Kuhl, K. P. & Nilsson, A. High selectivity for ethlyene from carbon dioxide reduction over copper nanocube electrocatalysts. Angew. Chem. Int. Ed. 54, 5179–5182 (2015).
19. Jin, M. et al. Shape-controlled synthesis of copper nanocrystals in an aqueous solution with glucose as a reducing agent and hexadecylamine as a capping agent. Angew. Chem. Int. Ed. 50, 10560–10564 (2011).
20. Huang, J. et al. Potential-induced nanoculstering of metallic catalysts during electrochemcial CO2 reduction. Nat. Commun. 9, 3117 (2018).
21. Tran, R. et al. Surface energies of elemental crystals. Sci. Data 3, 160080 (2016).
22. Droog, J. M. M. & Schlenter, B. Oxygen electrosorption on copper single crystal electrodes in sodium hydroxide solution. J. Electroanal. Chem. 112, 387–390 (1980).
23. Raciti, D. et al. Low-overpotential electroreduction of carbon monoxide using copper nanowires. ACS Catal. 7, 4467–4472 (2017).
24. Yin, Y. & Alivisatos, A. P. Colloidal nanocrystal synthesis and the organic–inorganic interface. Nature 437, 664–670 (2005).
25. Zhuang, T.-T. et al. 1D colloidal hetero-nanomaterials with programmed semichonductor morphology and metal location for enhancing solar energy conversion. Small 13, 1602629 (2017).
26. Dinh, C.-T. et al. CO2 electroreduction to ethylene via hydroxide-mediated copper catalysis at an abrupt interface. Science 360, 783–787 (2018).
NATuRE CATALYSiS | www.nature.com/natcatal
ArticlesNature Catalysis
27. Cheng, T., Xiao, H. & Goddard, W. A. III Nature of the active sites for CO reduction on copper nanoparticles; suggestions for optimizing performance. J. Am. Chem. Soc. 139, 11642–11645 (2017).
28. Liu, X. et al. Understanding trends in electrochemical carbon dioxide reduction rates. Nat. Commun. 8, 15438 (2017).
29. Reske, R., Mistry, H., Behafarid, F., Roldan Cuenya, B. & Strasser, P. Size effects in the catalytic electroreduction of CO2 on Cu nanoparticles. J. Am. Chem. Soc. 136, 6978–6986 (2014).
30. Huang, X. et al. Freestanding palladium nanosheets with plasmonic and catalytic properties. Nat. Nanotechnol. 6, 28–32 (2011).
31. Kang, Y., Ye, X. & Murray, C. B. Size- and shape-selective synthesis of metal nanocrytals and nanowires using CO as a reducing agent. Angew. Chem. Int. Ed. 49, 6156–6159 (2010).
32. Cui, C. et al. Carbon monoxide-assisted size confinement of bimetallic alloy nanoparticels. J. Am. Chem. Soc. 136, 4813–4816 (2014).
33. Kresse, G. & Furthmüller, J. Efficient iterative schemes for ab initio total-energy calculations using a plane-wave basis set. Phys. Rev. B 54, 11169–11186 (1996).
34. Kresse, G. & Furthmuller, J. Efficiency of ab-initio total energy calculations for metals and semiconductors using a plane-wave basis set. Comp. Mater. Sci. 6, 15–50 (1996).
35. Kresse, G. & Hafner, J. Ab-Initio molecular-dynamics simulation of the liquid-metal amorphous-semiconductor transition in Germanium. Phys. Rev. B 49, 14251–14269 (1994).
36. Kresse, G. & Hafner, J. Ab initio molecular dynamics for liquid metals. Phys. Rev. B 47, 558–561 (1993).
37. Perdew, J. P., Burke, K. & Ernzerhof, M. Generalized gradient approximation made simple. Phys. Rev. Lett. 77, 3865–3868 (1996).
38. Kresse, G. & Joubert, D. From ultrasoft pseudopotentials to the projector augmented-wave method. Phys. Rev. B 59, 1758–1775 (1999).
39. Blöchl, P. E. Projector augmented-wave method. Phys. Rev. B 50, 17953–17979 (1994).
40. Grimme, S., Antony, J., Ehrlich, S. & Krieg, H. A consistent and accurate ab initio parametrization of density functional dispersion correction (DFT-D) for the 94 elements H–Pu. J. Chem. Phys. 132, 154104 (2010).
41. Grimme, S., Ehrlich, S. & Goerigk, L. Effect of the damping function in dispersion corrected density functional theory. J. Comp. Chem. 32, 1456–1465 (2011).
42. Michaelides, A. et al. Identification of general linear relationships between activation energies and enthalpy changes for dissociation reactions at surfaces. J. Am. Chem. Soc. 125, 3704–3705 (2003).
43. Liu, Z. P. & Hu, P. General rules for predicting where a catalytic reaction should occur on metal surfaces: A density functional theory study of C–H and C–O bond breaking/making on flat, stepped, and kinked metal surfaces. J. Am. Chem. Soc. 125, 1958–1967 (2003).
44. Alavi, A., Hu, P. J., Deutsch, T., Silvestrelli, P. L. & Hutter, J. CO oxidation on Pt(111): an ab initio density functional theory study. Phys. Rev. Lett. 80, 3650–3653 (1998).
45. Montoya, J. H., Shi, C., Chan, K. & Nørskov, J. K. Theoretical insights into a CO dimerization mechanism in CO2 electroreduction. J. Phys. Chem. Lett. 6, 2032–2037 (2015).
46. van Duin, A. C. T. et al. Development and validation of a reaxFF reactive force field for Cu cation/water interactions and copper metal/metal oxide/metal hydroxide condensed phases. J. Phys. Chem. A 114, 9507–9514 (2010).
47. Cheng, T., Xiao, H. & Goddard, W. A. Full atomistic reaction mechanism with kinetics for CO reduction on Cu(100) from ab initio molecular dynamics free energy calculation at 298 K. Proc. Natl Acad. Sci. USA 114, 1795–1800 (2017).
48. Sundararaman, R. & Goddard, W. A. III The charge-asymmetric nonlocally determined local-electric (CANDLE) solvation model. J. Chem. Phys. 142, 064107 (2015).
49. Xiao, H., Cheng, T. & Goddard, W. A. III Atomistic mechanisms underlying selectivities in C1 and C2 products from electrochemical reduction of CO on Cu(111). J. Am. Chem. Soc. 139, 130–136 (2017).
50. Sundararaman, R., Goddard, W. A. II & Arias, T. A. Grand canonical electronic density-functional theory: algorithms and applications to electrochemistry. J. Chem. Phys. 146, 114104 (2017).
51. Sundararaman, R. et al. JDFTx: software for joint density-functional theory. SoftwareX 6, 278–284 (2017).
52. Ong, S. P. et al. Python Materials Genomics (pymatgen): a robust, open-source python library for materials analysis. Comp. Mater. Sci. 68, 314–319 (2013).
53. Verdaguer-Casadevall, A. et al. Probing the active surface sites for CO reduction on oxide-derived electrocatalysts. J. Am. Chem. Soc. 137, 9808–9811 (2015).
54. Millero, F. J. & Rabindra, N. R. A chemical equilibrium model for the carbonate system in natural waters. Croat. Chem. Acta 70, 1–38 (1997).
55. COMSOL Multiphysics v. 5.3a (COMSOL AB, 2017); www.comsol.com
56. Millero, F. J., Graham, T. B., Huang, F., Bustos-Serrano, H. & Pierrot, D. Dissociation constants of carbonic acid in seawater as a function of salinity and temperature. Mar. Chem. 100, 80–94 (2006).
57. Weisenberger, S. & Schumpe, A. Estimation of gas solubilities in salt solutions at temperatures from 273 K to 363 K. AIChE J. 42, 298–300 (1996).
58. Mehrbach, C., Culberson, C. H., Hawley, J. E. & Pytkowicx, R. M. Measurement of the apparent dissociation constants of carbonic acid in seawater at atmospheric pressure. Limnol. Oceanogr. 18, 897–907 (1973).
59. Burdyny, T. et al. Nanomorphology-enhanced gas-evolution intensifies CO2 reduction electrochemistry. ACS Sustain. Chem. Eng. 5, 4031–4040 (2017).
60. Ravel, B. & Newville, M. ATHENA, ARTEMIS, HEPHAESTUS: data analysis for X-ray absorption spectroscopy using IFEFFIT. J. Synchrotron Rad. 12, 537–541 (2005).
61. Li, J. et al. Revealing the synergy of mono/bimetallic PdPt/TiO2 heterostructure for enhanced photoresponse performance. J. Phys. Chem. 121, 24861–24870 (2017).
62. Luc, W., Rosen, J. & Jiao, F. An Ir-based anode for a practical CO2 electrolyzer. Catal. Today 288, 79–94 (2017).
AcknowledgementsThis work was supported financially by TOTAL American Services, the Connaught Fund, the Ontario Research Fund: Research Excellence Program, the Natural Sciences and Engineering Research Council of Canada and the CIFAR Bio-inspired Solar Energy programme. This research used synchrotron resources from the Advanced Photon Source (an Office of Science User Facility operated for the US Department of Energy) Office of Science by Argonne National Laboratory, supported by the US Department of Energy under contract no. DE-AC02-06CH11357) and the Canadian Light Source and its funding partners. All DFT computations were performed on the IBM BlueGene/Q supercomputer with support from the Southern Ontario Smart Computing Innovation Platform and Niagara supercomputer at the SciNet HPC Consortium. Southern Ontario Smart Computing Innovation Platform is funded by the Federal Economic Development Agency of Southern Ontario, the Province of Ontario, IBM Canada, Ontario Centres of Excellence, Mitacs and 15 Ontario academic member institutions. SciNet is funded by the Canada Foundation for Innovation; the Government of Ontario; Ontario Research Fund—Research Excellence; and the University of Toronto. We acknowledge the Toronto Nanofabrication Centre and the Ontario Centre for the Characterization of Advanced Materials for sample preparation and characterization facilities. The authors thank T. P. Wu, Z. Finfrock and L. Ma for technical support at 9BM beamline of the Advanced Photon Source. The authors also thank D. Jiang, N. Chen, C. Kim and W. Chen for their assistance at the HXMA beamline at the Canadian Light Source. D.S. acknowledges the Natural Sciences and Engineering Research Council of Canada—E.W.R Steacie Memorial Fellowship. A.S. acknowledges Fonds de Recherche du Quebec-Nature et Technologies for the postdoctoral fellowship award. J.L. and M.G.K. acknowledges the Banting postdoctoral fellowship from the Government of Canada. C.M.G. acknowledges Natural Sciences and Engineering Research Council of Canada for funding in the form of a postdoctoral fellowship. We acknowledge L. Huang and G. Zheng for the help in Brunauer–Emmett–Teller measurements and data analysis. We acknowledge D. Kopilovic for designing flow electrolysers. We thank M. Chekini and E. Kumachev for the help in dynamic light scattering measurements.
Author contributionsE.H.S. supervised the project. Y.W. and C.-T.D. designed the experiments. Y.W. carried out the catalyst synthesis, electrochemical tests, electrocatalysis tests and SEM measurements. Z.W. performed DFT calculations. J.L. performed all the XAS measurements and analysed the results. A.O. performed the tests in MEA electrolysers. M.G.K. prepared evaporated copper seeds. Y.L. and F.L. prepared sputtered copper seeds. C.-S.T. performed TEM measurements and data analysis. A.S. and C.M.G. carried out the operando Raman measurements. M. Luo synthesized copper nanocubes. C.M. performed the local pH simulations. Y.W., H.Z., M.Liu, A.P. and A.J. performed GIWAXS measurements and data analysis. Y.X. designed flow channels for electrolysers. A.P. and P.T. carried out the XPS measurements. T.-T.Z., S.O.K. and D.S. contributed to manuscript writing. All authors discussed, commented on and revised the manuscript.
Competing interestsY.W. and E.H.S. of the University of Toronto have filed provisional patent application no. 62/844,482 regarding the preparation of in-situ synthesized catalysts for CO2 reduction.
Additional informationSupplementary information is available for this paper at https://doi.org/10.1038/s41929-019-0397-1.
Correspondence and requests for materials should be addressed to E.H.S.
Reprints and permissions information is available at www.nature.com/reprints.
Publisher’s note Springer Nature remains neutral with regard to jurisdictional claims in published maps and institutional affiliations.
© The Author(s), under exclusive licence to Springer Nature Limited 2019
NATuRE CATALYSiS | www.nature.com/natcatal