catalogue of discordant redshift associations - isidore.co halton-catalogue of... · arp, halton...
TRANSCRIPT

Catalogue of Discordant Redshift
Associations
H al t on Ar p
Apeir on Mon tr ea l

Published by C. Roy Keys Inc. 4405, rue St-Dominique Montreal, Quebec H2W 2B2 Canada http://redshift.vif.com
© C. Roy Keys Inc. 2003
First Published 2003
National Library of Canada Cataloguing in Publication
Arp, Halton C., 1927- Catalogue of discordant redshift associations / Halton Arp.
Includes bibliographical references and index. ISBN 0-9683689-9-9
1. Galaxies--Catalogs. 2. Galaxies--Clusters. 3. Quasars. 4. Red shift. I. Title.
QB857.A757 2003 523.1'1 C2003-902604-3
Cover design by
Cover Image
The cover picture shows a Hubble Space Telescope image of the disturbed, low-
redshift galaxy NGC 4319 connected by a thin filament to the high redshift qua-
sar/AGN, Mrk 205. In 1971 a photograph with the Palomar 200-inch telescope dis-
covered this as a somewhat broader connection. Despite vigorous contentions to the
contrary, further photographs have confirmed it (e.g., see Fig. 13 in Introduction).
In 2002 an organization associated with NASA issued a press release with an HST
picture, claiming disproof of the connection. However, many amateur astronomers
processed the same picture and showed the connection clearly. One of these pictures,
processed in false color by Bernard Lempel, is shown here on the cover. It is interest-
ing that the smaller aperture Space Telescope does not show the broader connection
as well as large-aperture ground-based telescopes, but its higher resolution shows for
the first time a narrow filament inside that connection. In addition, the contouring in
the processed picture emphasizes the disturbed nature of the ejecting galaxy and the
alignment of the inner and outer cores of NGC 4319 and Mrk 205 and the filament, a
circumstance that clearly precludes an accidental background projection.
Even though this latest evidence has still not been acknowledged by mainstream as-
tronomy, it is very satisfying to me in view of the fact that the Kitt Peak National
Observatory 4-meter image of the connection was shown on the cover of my first
book, Quasars, Redshifts and Controversies. The explosive, ejecting, X-ray nature of
Mrk 205 was shown on the cover of my next book, Seeing Red: Redshifts, Cosmol-
ogy and Academic Science. Now the conclusive, thin aspect of the connection is
shown by Space Telescope and furnishes an appropriate introduction to this Cata-
logue, which presents much further evidence for the ejection of active, high-redshift
objects from lower-redshift galaxies.

Table of Contents
INTRODUCTION
The Fundamental Patterns of Physical Associations 1
Quasars 2-16
The 3C sample of Active Galaxies and Quasars 17-21
Ejection Origin of Quasars 22-26
Intrinsic Redshifts of Galaxies 27-37
Toward a More Correct Physics 38
THE CATALOGUE
About the Catalogue 41-42
What to Look For 43-46
Maps of Associations with Comments 48-143
APPENDIX A
The Neighborhood of the Nearby Galaxy M 101 146-163
The Sunyaev-Zeldovich Effect 164-165
Conclusion 166
APPENDIX B
Filaments, Clusters of Galaxies and The Nature of Ejections from Galaxies 169-179
Elongated X-ray Clusters 180-185
Additional Elongated Clusters Aligned with Galaxies of Lower Redshift 186-195
Summary and Interpretation 195-199
Young Galaxies in Spiral Arms 199-207
A Bullet to a Gamma Ray Burst 208-210
A Quasar With an Ablation Tail 211-215
A Mechanism to Produce Galaxy Clusters 215-217
Glossary 219-223
INDEX 225-226
COLOUR PLATES 227-234


1
Introduction
T he F un damen t al P at t er n s of P hys ical As s ociat ion s
Empirical evidence which is repeatable forms the indispensable basis of
science. The following Catalogue of Discordant Redshift Associations
applies this principle to the problem of extragalactic redshifts. The Cata-
logue entries establish unequivocally that high redshift objects are often
at the same distance as, and physically associated with, galaxies of
much lower redshift. It is thus appropriate to start with a short history of
high redshift quasars aligned with low redshift galaxies.
It has long been accepted that radio-emitting material is ejected, usually
paired in opposite ejections, from active galaxies. The material is there-
fore aligned and points back to the galaxy of origin. But, and this is the
major additional property of the associations, the ejected material fre-
quently has a much higher redshift than the central galaxy. The proto-
typical pairs and alignments of higher redshift objects in this introductory
section are taken from a body of data which is now too large to present
completely. Nevertheless, it is hoped that the sample presented here will
fix firmly the result that redshifts do not generally indicate recession veloc-
ity and are not reliable distance indicators. Even more importantly, the
empirical data contained in these discordant associations is perhaps the
only evidence capable of leading to a fundamental physical under-
standing of the origins of quasars and galaxies and the cause of intrinsic
redshifts.

2
Quas ar s
a. S t r on g P air s of R adio Quas ar s
It was a strong pair of radio sources, the famous 3C 273 and 3C 274
across the brightest galaxy in the Virgo Cluster (Arp 1967), which first indi-
cated that a quasar could be at the same distance as a nearby, low-
redshift galaxy, rather than at the much larger distance indicated by its
redshift. In Fig. 1 here we show a pair of very bright Parks radio sources
across the disturbed IC 1767 (Arp, Astrofiz ika, 1968). Both of these later
turned out to be quasars of strikingly similar redshift.
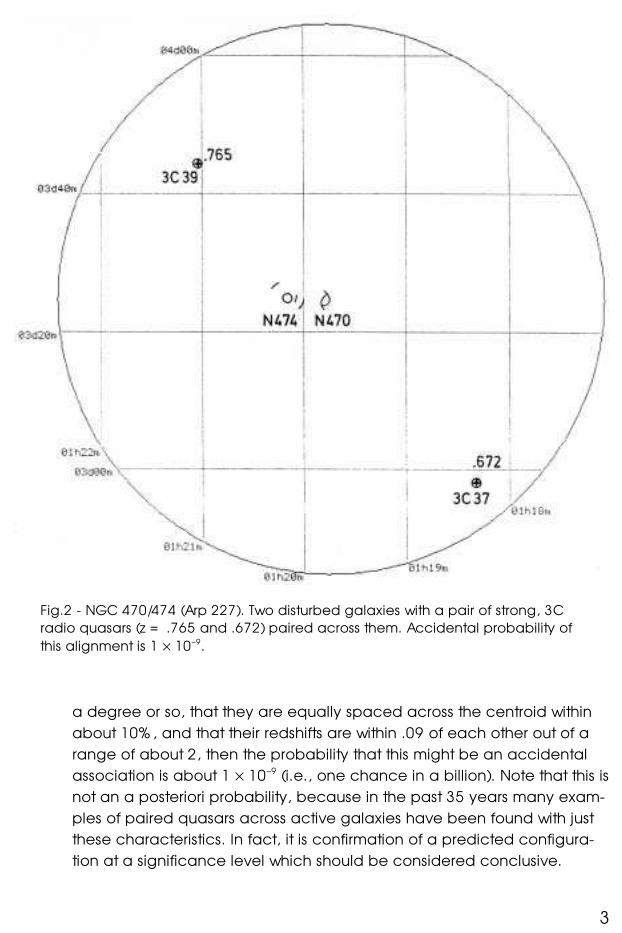
Fig. 2 shows a pair of 3C radio quasars across the disturbed pair of galax-
ies NGC 470/NGC 474 (Arp, Atlas of Peculiar Galaxies No. 227). Quasars
this radio bright are very rare (a total of 50 over the northern hemisphere).
This yields a frequency of only one per 320 sq. deg., and a chance of
only 5 × 10⁻⁶ of finding both so close to an arbitrary point in the sky. If we
then calculate the chance that they are also accidentally aligned within
Fig.1 - 1968 - Radio quasars across disturbed galaxies. This very strong pair fell
across a galaxy with z = .018 and later turned out have redshifts z = .616 and
.669.
3
a degree or so, that they are equally spaced across the centroid within
about 10% , and that their redshifts are within .09 of each other out of a
range of about 2, then the probability that this might be an accidental
association is about 1 × 10⁻⁹ (i.e., one chance in a billion). Note that this is
not an a posteriori probability, because in the past 35 years many exam-
ples of paired quasars across active galaxies have been found with just
these characteristics. In fact, it is confirmation of a predicted configura-
tion at a significance level which should be considered conclusive.
Fig.2 - NGC 470/474 (Arp 227). Two disturbed galaxies with a pair of strong, 3C
radio quasars (z = .765 and .672) paired across them. Accidental probability of
this alignment is 1 × 10⁻⁹.
4
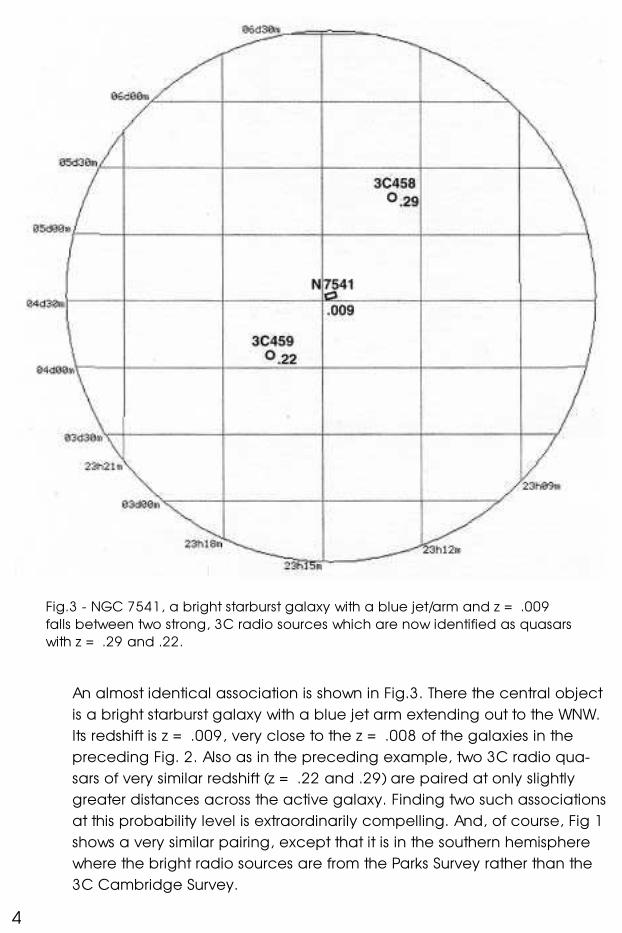
An almost identical association is shown in Fig.3. There the central object
is a bright starburst galaxy with a blue jet arm extending out to the WNW.
Its redshift is z = .009, very close to the z = .008 of the galaxies in the
preceding Fig. 2. Also as in the preceding example, two 3C radio qua-
sars of very similar redshift (z = .22 and .29) are paired at only slightly
greater distances across the active galaxy. Finding two such associations
at this probability level is extraordinarily compelling. And, of course, Fig 1
shows a very similar pairing, except that it is in the southern hemisphere
where the bright radio sources are from the Parks Survey rather than the
3C Cambridge Survey.
Fig.3 - NGC 7541, a bright starburst galaxy with a blue jet/arm and z = .009
falls between two strong, 3C radio sources which are now identified as quasars
with z = .29 and .22.

5
b. S t r on g X-r ay P air s
When the X-ray satellites started reporting point sources that were fre-
quently identified with blue stellar objects (BSO’s), it quickly became clear
that this was a much more certain way of discovering new quasars. As
Fig. 4 shows, a strong pair of X-ray sources were observed closely across
NGC 4258, a galaxy noted for its ejection activity. Before they were con-
firmed as quasars (E.M. Burbidge 1995), it was suggested that these X-ray
sources had been ejected outward, closely along the minor axis of
NGC 4258. (Pietsch et al. 1994).
Another very strong X-ray pair (119 and 268 cts/ks) was discovered
bracketing the bright Seyfert galaxy NGC 4235. Fig. 5 reinforces an addi-
tional property of the quasar pairs, namely, that they tend to lie along the
minor axis direction of the central galaxy. This seems logical in the sense
Fig.4 - 1994 -The famous active Seyfert NGC 4258 was found to have ejected
two strong X-ray sources nearly along its minor axis. They turned out to be qua-
sars of z = .65 and .40.

6
that proto quasars would be able to exit the galaxy along the path of
least resistance, i.e., the minor axis. The present Catalogue does not
promote scientific theories. But as an aid in understanding the pictured
relationships, it should be mentioned that in the variable-mass hypothesis
(Narlikar and Arp 1993) the quasar starts as a low particle-mass plas-
moid*, which would make it prone to interact with material at low latitudes
in disk galaxies. Radio plasma, being more diffuse, would tend to be
stripped away from a more compact X-ray emitting core through interac-
tion with a galactic or intergalactic medium. Some observational evi-
* See Glosssary for definitions of plasmoid and other technical terms.
Fig.5 - 1997 - Two very strong X-ray sources (268 and 119 cts/ks) along the mi-
nor axis of an edge on Seyfert 1 galaxy. From a 7.5 sigma association of Sey-
ferts with higher redshift quasars (Radecke 1997; Arp 1997).

7
dence which may support this suggestion has been reported (Arp 2001).
See also Appendix B at the end of this Catalogue.
c. Mut ipl e Quas ar Al ign men t s
Fig. 6 shows what I would nominate as the Rosetta Stone of quasar asso-
ciations. Its validity is ensured by the fact that around this famous active
Seyfert galaxy, NGC 3516 (Ulrich 1972), all the brightest X-ray sources
have been identified optically and observed spectroscopically (Chu et
al. 1998). They have been confirmed as quasars with the redshifts labeled
in Fig. 6. It is readily apparent that they are distributed along a line drawn
Fig 6. - 1998 - The Rosetta Stone. The brightest X-ray sources in the field are
aligned along the minor axis in descending order of quantized redshift. The very
active Seyfert has z = .009.

8
in the Figure. This line turns out to be the minor axis of NGC 3516. More-
over they are ordered in redshift, with the highest redshifts falling closest
to the galaxy and the lowest redshifts furthest away. The numerical value
of each of the six quasar redshifts falls very close to one of the six most
prominent quantized peaks of the Karlsson formula.
The next example of quasar alignments is almost as impressive, with five
quasars aligned very accurately along the minor axis of the bright ap-
parent magnitude Seyert galaxy NGC 5985. Fig. 7 shows that 4 of the 5
fall close to the redshift peaks, yielding, together with the previous asso-
ciation, nine out of ten redshifts that obey the formula.
However, another aspect to the NGC 5985 alignment is very important for
understanding the many regions presented in the following Catalogue.
Fig.7 - 1999 - Five quasars falling along the minor axis of the bright Seyfert
NGC 5985. Same descending order of quantized redshifts. Note low-redshift
companions appearing along ejection line.

9
My attention was drawn to this object by the fact that a low-redshift gal-
axy lay only 2.4 arcsec away from one of the quasars. It turns out that a
total of four companion galaxies are found to lie along this same narrow
quasar line. Their redshifts are only a few hundred km/sec higher than the
redshift of NGC 5985 (Arp, IAU Symp. 194 p. 348-349), close enough to
ensure they would be classed as physical companions, but with system-
atically higher redshifts, as has been found to be characteristic of groups
dominated by large galaxies (Arp 1998a; 1998b).
The companions to spiral galaxies were long ago (Holmberg 1969) found
to lie preferentially along the minor axis of the dominant galaxy, leading
to the suggestion that the companions were formed in the parent galaxy
and ejected outward. Their slightly higher redshifts would now imply that
they were the end products of evolution from quasars where the intrinsic
redshift component has decayed almost to zero.
Empirically, the observations of aligned companions at various redshifts
are capable of explaining the persistent mystery of multiply interacting
groups with discordant redshifts, such as Stephan’s Quintet, and many
other famous groups which often contain discordant redshifts. If the ejec-
tion direction stays relatively fixed in space, then ejecta in various stages
of evolution and redshift can interact as they travel out along this line. But
it is also possible—and probably observed here in the Catalogue exam-
ples—that material from the parent galaxy can be entrained along the
supposed ejection path, thus furnishing another explanation of how low-
redshift material could be found far from the central galaxy and aligned
with higher redshift material.
One comment on why this picture has developed so slowly over the years
is in order: The NGC 3516 paper was rejected by Nature magazine with-
out being sent to a referee. Later it was demoted from the important short
papers in Astrophysical Journal Letters to the not-so-pressing short papers
in the main Journal. The data on systematic redshifts of companion gal-
axies was scarcely debated in the Astrophysical Journal main journal,
and systematically rejected by referees and editors of the European Main
Journal, Astronomy and Astrophysics.

10
d. Al ign men t s R ot at in g w it h E poch
One example of an ejection axis that appears to have rotated with time is
shown here in Fig. 8. The two brightest X-ray sources in the NGC 2639
field turn out to be quasars with redshifts differing by only .018 (Burbidge
1997). This would make it essentially impossible to argue that they were
unrelated projections from the background. Their alignment is somewhat
rotated from the minor axis of the central Seyfert. But closer to the galaxy,
there is an extension of X-ray sources lying directly along the minor axis
(Fig. 9).
Fig. 8 - A pair of X-ray bright quasars across the Seyfert NGC 2639. Their redshifts
differ by only .018.

11
The only plausible explanation would seem to be that these sources rep-
resent a more recent ejection when the minor axis has rotated slightly
from its earlier position. Obviously redshift measurements of the optical
identifications in this more recent ejection would be invaluable aids to
studying the evolution and interaction properties of these apparently
younger quasars. The relatively short time allocations on moderate sized
telescopes needed for these measurements have, however, not been
forthcoming.*
* Four of the X-ray sources along the line in Fig. 9 have finally been confirmed as quasars with z from
0.337 to 2.63 by E.M. Burbidge in part of a night at the Keck 10 meter telescope in Hawaii.
Fig. 9 - Fainter X-ray sources, some identified as BSO’s, lie precisely along the
minor axis of NGC 2639 which has apparently rotated some degrees from the
earlier ejection of the outer pair.

12
e. D is t ur bed Mor phol ogy of U l t r al umin ous In f r a R ed Gal axies (U L IR G’s )
One of the supposedly most luminous nearby galaxies known is Arp 220
(Arp, Atlas of Peculiar Galaxies No. 220). The X-ray map in Fig. 10 shows
that a pair of quasars across it have been found to differ by only .009 in
redshift (Arp et al. 2001)! The pair is aligned as exactly as can be meas-
ured across this dust shrouded nucleus, whose activity is masked by an
estimated 50 magnitudes of obscuration. If the two quasars have appre-
ciable ejection velocity at the present time, then it is very unlikely that
they are travelling so exactly across the line of sight that their radial ve-
locity components would show negligible difference.
Fig. 10 - 2001 - X-ray quasars with almost identical spectra exactly aligned
across the dust shrouded nucleus of the ULIRG, Arp 220. At the base of the trail
of X-ray sources a group of z = .09 galaxies are connected by X-ray and ra-
dio material to the disturbed, infrared luminous galaxy (Arp 2001, Arp et al.
2001).

13
As suggested by previous cases, however, if the quasars have interacted
strongly with the galaxy on their way out, they could have lost most of
their ejection velocity. This explanation for the closely matching redshifts
is attractive, because it also accounts for the extremely disrupted state of
the ejecting galaxy. In turn, this may also be connected with the abun-
dance of fine, solid-particle dust which results in the strong infrared radia-
tion.
A second inference from the X-ray map in Fig. 10 arises from the fact that
at the base of the southerly trail of X-ray sources which leads back to Arp
220 is a group of three or more galaxies with a redshift of z = .090. They
are connected to the active galaxy by radio and X-ray bridges (Arp
2001). At their conventional redshift distance, these galaxies would be
suspiciously bright, close to having the conventional luminosities of qua-
sars, but they appear as elliptical and lenticular cluster galaxies. If they
were younger, intrinsically redshifted ejecta which had been stopped,
and then evolved close to Arp 220, they would instead represent higher
redshift companion galaxies such as are found in many groups of galax-
ies. More discussion of this process can be found at the end of this Cata-
logue in Appendix B. But it is very important for the following Catalogue to
introduce at this point empirical evidence that would support the cases
where higher redshift clusters of galaxies appear physically associated
with low-redshift, presumably ejecting, central galaxies.
f . P r ef er r ed val ues of r eds h if t
Starting with Burbidge and Burbidge (1967), quasar redshifts in general
were shown to occur in discrete values. Later Karlsson discovered that
they obeyed the empirical law:
(1 + z i + 1) = 1.23(1 + z i)
z = .06, .30, .60, .96, 1.41, 1.96, 2.64, 3.48 ...
Quasar redshifts in many of the associations in the present Catalogue fall
very close to these preferred values. Because it is unlikely that we are at
the center of expanding shells, this would seem to require the dominant
component of the redshift to be intrinsic. At some level, however, there
should exist a component of peculiar velocity. Since the spread around
the quantized values is observed to be of the order of ∆z = ± 0.1 (Arp
et al. 1990), it is natural to suggest that the latter represents the (Doppler)
velocity component of the redshift.
In the following section we actually compute the speed with which the
quasars are moving through space. Indeed it turns out that the quasars

14
appear to be moving with respect to their parent galaxy with velocities
from 10,000 km/sec at intrinsic redshift z = 0.3, to 30,000 km/sec at intrin-
sic redshift z = .96. The velocity of separation from the ejecting galaxy
appears to fall as lower intrinsic redshifts are considered.
g. E j ect ion Vel ocit ies
To make this calculation we restrict ourselves to pairs of quasars. They are
the most common association, and their approximately equal spacing
across the central galaxy implies that they were ejected simultaneously
with equal velocities. If momentum is conserved, one of the objects
should have a component of velocity away from the observer, and the
other toward the observer. We can test whether these expectations
match observations.
Table 1 lists the best determined pairs of quasars lying across active gal-
axies for which redshifts have been measured. (There are more apparent
pairs awaiting measurement.) The table lists the redshifts of the central
galaxies (zG) and the measured redshifts of the paired quasars (z1, z2).
These observed quasar redshifts are then corrected to the galaxy center
by means of (1 + zQ) = (1 + z1)/(1 + zG), and compared to the nearest
T abl e 1 . W el l Def in ed P air s w it h R eds h if t s . F ir s t 7 obj ect s ar e dis cus s ed in Ar p (1 9 9 8 ) an d l as t t h r ee in Ar p (1 9 9 8 b).
Galaxy zG z1 (peak) z2 (peak) velej velej
NGC4258 0.002 0.653 (0.60) 0.398 (0.60) 0.031 –0.128
NGC4235 0.007 0.334 (0.30) 0.136 (0.30) 0.019 –0.132
NGC1068 0.0038 0.655 (0.60) 0.261 (0.30) 0.030 –0.034
NGC2639 0.0106 0.3232 (0.30) 0.3048 (0.30) 0.007 –0.007
IC1767 0.0175 0.669 (0.60) 0.616 (0.60) 0.025 –0.007
Mark205 0.070 0.464 (0.30) 0.633 (0.60) 0.052 –0.046
PG1211+ 143 0.085 1.28 (0.96) 1.02 (0.96) 0.072 –0.050
A/H\ # 1 0.51 2.15 (0.96) 1.72 (0.96) 0.064 –0.081
A/H\ # 2 0.54 2.12 (0.96) 1.61 (0.96) 0.034 –0.135
Her 0.55 2.14 (0.96) 1.84 (0.96) 0.034 –0.065

15
peak of quantized redshift given by the Karlsson series. The difference be-
tween zQ and the nearest peak is assumed to represent the true ejected
velocity of ejection vej (in units of c), i.e., (1 + zej) = (1 + zQ)/(1 + zp). These
values are listed in the velej columns, 7 and 8, of Table 1.
As Table 1 shows, the only ambiguous cases are the low-redshift members
of the NGC 4258 and NGC 4235 pair which would be closer to a peak if
they were falling back in, rather than still moving outward. In all the other
cases the zQ’s associated with the nearest peak denote one object mov-
ing away from the observer and one toward the observer. This result
alone (8 out of 10) would confirm the hypothesis of ejection in opposite
directions with the magnitude of velocities listed in Tables 1 and 2.
Prior confirmations of the peaks in redshift have been made on large
samples. Nevertheless, it is impressive to see the conformity of the pairs
listed in Table 1.
In addition to this quantization of the intrinsic redshifts, it is readily notice-
able that the ejection velocities in the pairs are fairly well matched, with
the away velocity about the same size as the toward component. This is
very impressive because there are several factors which could cause a
mismatch even if the quasars were ejected initially at the same instant
with the same velocity. One factor is that the initial ejection might not be
exactly in opposite directions. That would cause different projections of
ejection velocities to be observed in the toward and away directions.
More importantly, however, the quasars have to penetrate through differ-
ent amounts of galactic and intergalactic medium in different directions.
For pairs along the minor axis these considerations should be less impor-
tant, although they could be involved in the few cases where the match
is not as good as the average. Of course, the intrinsic redshifts must
evolve downward in steps as the ejecta travel outward. Depending on
how fast they make the transition from peak to peak, there will be a
chance of catching some redshifts in transition between peaks.
An important quantity derived so far from the group of pairs in Table 1,
then, is the average velocity of separation from the ejecting galaxy as a
function of redshift. This is summarized in Table 2. In terms of an empirical
model this means that the ejected quasar must have slowed down from
its original velocity, assumed close to c, to about 28,000 km/s by the time
the redshift has evolved into the z = 0.96 peak. After that it must slow to
about 10,000 km/s by the time the z = 0.30 peak is reached. If the qua-
sars are then to evolve into bound companion galaxies, they must essen-
tially lose all their velocity by an apogee of about 500 kpc. Galaxy red-
shifts, although they have much smaller intrinsic components, have also

16
been shown to fall at certain preferred values. The most conspicuous are
the 72 km/sec Tifft quantization and the 37.5 km/sec Napier quantization.
Another peak is apparent in the redshift of the Perseus-Pisces cluster,
which can be seen all over the sky at z ~ .017. In the latter case, we are
forced to ask whether these galaxies form an expanding shell with us at
the center, or, alternatively, they are all at the same age and evolution-
ary stage distributed throughout a static volume at different distances
from us.
T abl e 2 . E j ect ion Vel ocit ies
Peak Projected ∆zAverage absolute
value
Deprojected Average Velocity
(× √2) (kms–1)
0.30 0.026 –0.021 0.023 9,729
0.60 0.029 –0.060 0.045 19,077
0.96 0.051 –0.083 0.067 28,405

17
T he 3 C S ampl e of Act ive Gal axies an d Quas ar s
The 3C Cambridge Survey lists between 400 and 500 of the brightest ra-
dio sources in the sky north of Dec. = –5 deg. Of those which are extra-
galactic, only 50 are quasars. The spectroscopic observation of the 3C
sources was already complete enough by 1971 to show that these qua-
sars fell closer to bright, low-redshift galaxies. For the whole sample of 3C
sources the probability that this result was accidental is < 10–3 (Burbidge,
Burbidge, Strittmatter & Solomon 1971—the famous B2S2 paper).
This result, however, was based solely on the criterion of nearness on the
sky. In subsequent years some of the closest pairs have shown other evi-
dence for association, and a number of additional high significance as-
sociations with 3C objects have been found. (Arp 1996; 1998b; 2001). If
we ask what determines the probability of an association we can list five
empirical criteria: nearness, alignment, centering, similarity of ejecta
(usually z’s or apparent mag.) and connections (bridges, jets and fila-
ments). With these criteria, we can add at least 17 more associations of
3C quasars with low-redshift galaxies having chance probabilities rang-
ing from 10–3 to 10–9. This seems to take the case for physical association
beyond sensible calculation. We briefly discuss three individual cases be-
low because of the strong evidence they contribute for ejection and
quantization.

18
a. 3 C 3 4 3 ,1
In March 2002 Marshall Cohen called Margaret Burbidge’s attention to a
3C radio source that had two redshifts. The abstract of the paper report-
ing this (Tran et al. 1998) ended with the statement: “Our data reveal a
chance alignment of 3C 343.1 with a foreground galaxy, which domi-
nates the observed optical flux from the system.” It was a simple matter,
however, to look up the high resolution radio map (Fanti et al. 1985) and
find the two objects linked together by a radio bridge, as shown here in
Fig. 11. We now calculate some probabilities of this being a chance
alignment and show how the configuration follows the rules of many pre-
vious physical associations.
A circle of 0.25 arcsec radius subtends an area of 1.5 × 10⁻⁸ sq. deg. on
the sky. In the now essentially completely identified 3C Catalogue there
are about 50 radio quasars. Assuming 23,000 sq deg. to Dec. = –5 deg.
we compute 2.2 × 10⁻³ such quasars per sq. deg., giving a probability of
Fig. 11 2002 - Radio map at 1.6Ghz of 3C343.1 by Fanti et al. 1985. Separa-
tion of sources is only 0.25 arcsec. Note the opposite ejections from the radio
galaxy, the western of which leads directly into the quasar. The compression
of the radio contours on the west side of the quasar attests to its motion di-
rectly away from the galaxy.

19
3 × 10–11 of accidentally finding the z = .750 quasar within 0.25 arc sec of
the z = .344 galaxy.
However, even if we do not consider the radio material linking them a
bridge, we must still estimate the possibility that the radio tail from the
galaxy points within a few degrees to the quasar and, similarly, from the
quasar back to the galaxy. This would give a further improbability of
(± 2/90)2 = 5 × 10⁻⁴. The combined probability of this configuration being
chance is of the order of 10–14.
Because the galaxy and quasar together are faint, apparent mag. 20.7,
it may be that the galaxy is fairly normal and lies at its considerable red-
shift distance. That would also help explain the exceedingly small, ap-
parent separation of the objects. There remains, however, an intriguing
question about the numerical value of the redshift. The Karlsson preferred
redshift values in this interval are shown below. (For references to the deri-
vation of these peaks see Arp et al. 1990; Burbidge and Napier 2001 and
also Section D in the description of the Catalogue which follows.) In this
range the peaks are:
z = ... .30, .60, .96, 1.41, ...
The galaxy at z = .344 is close to the z = .30 value. But the quasar at
z = .750 is about midway between the next preferred values. The solution
to this apparent discrepancy is to compute the redshift of the quasar as
seen from the rest frame of the galaxy:
(1 + z0) = (1 + zQ)/(1 + zg) = 1.750/1.344 = 1.302
Hence the redshift of the quasar is z = .302, an almost perfect fit!
If the quasar were not physically associated with the galaxy this, of
course, would be an additional improbable accident. This calculation is
also important when samples of fainter quasars are considered, as noted
in Arp et al. (1990). As for the distance of the z = .344 galaxy, it might, of
course be closer than its redshift distance. Of interest in this connection is
a pair of UGC galaxies a little over a degree away with z = .032 and
.033. Moreover, in the direction of this pair from the z = .344 object are a
quasar of z = 1.49 and the quasar 3C 343, with z = .99.
We have discussed this pair of objects from the standpoint of whether
there could be any “a posteriori quality” to the extraordinarily small prob-
ability of a coincidental association. In fact, we have found that they
were just more extreme values of the same properties that have charac-
terized so many other physical associations of high significance—
nearness, alignment, disturbances, connections. It is also striking to note

20
that this case has been circulating in the published literature for more
than 4 years, and was even described as a foreground galaxy coinci-
dentally close to a background quasar. One wonders how many other
decisive pieces of information have gone unrecognized.
b. 3 C3 4 4 1
Fig.12 shows the area around 3C 441. About 36 arcsec from this 3C gal-
axy a quasar of z = 4.399 was accidently discovered (McCarthy et al.
Fig. 12 - R band images of the field of 3C 441 from McCarthy et al. 1988. The
galaxy at z = .202 appears either to have its west end occulted and/or a lu-
minous connection to the quasar 2203+ 29, which has z = 4.399.

21
1988). The chance of this being coincidental was estimated at a few
times 10–3. But what was ignored was that the quasar, at R = 20.8 mag.,
was either partially obscuring the end of, or exhibiting a luminous bridge
to, a relatively bright galaxy at z = .202. (The image appeared at the
limit of resolution, but apparently no effort was ever made to get a better
picture.) What has been apparent for some time, however, is that the
z = 4.399 redshift fits the Karlssson peak redshift in its vicinity fairly well…
1.96, 2.64, 3.48, 4.51... But in the rest frame of the z = .202 galaxy it fits
almost perfectly at z = 3.49!
c. 3 C 4 3 5
This 3C source turned out to be two sources about 12 arcsec apart, one
of z = .461 and one of z = .865. The latter source appears to be exactly
and indistinguishably superposed on a galactic star of about zero redshift
(McCarthy et al. 1989). Apparently no attempt has been made to
straighten out this intriguing situation by getting images with higher resolu-
tion telescopes. But putting that matter aside, it appears that the z = .865
object in the rest frame of the z = .461 object is z = .28—very close to
the peak redshift value of z = .30.
d. A 2 dF Gal axy
Not a 3C galaxy, but a composite spectrum reminiscent of the situations
described above appeared recently among 55 quasars with z > .3 in the
2 degree Field Galaxy Redshift Survey (Madgwick, D. et al. 2001). The two
spectra, appearing in a seemingly single object, have z = .1643 and
z = .87. In the reference frame of the galaxy the quasar would go from
.87 to .61!

22
E j ect ion Or igin of Quas ar s
Because radio sources and X-ray jets are believed to be ejected from
galaxy nuclei, it was reasoned in the beginning of this Introduction that
radio quasars and X-ray loud quasars were also ejected. The observed
pairings in all these sources was strong support for this conclusion. The po-
tential violation of redshift as a distance indicator, however, has caused
opinion leaders in the field to demand ever more proof of the physical
association of such discordant redshift objects. One form such proof
could take is luminous connections from galaxies to higher redshift ob-
jects. There are a few cases where optical bridges and filaments are
seen. One famous connection is between a low-redshift galaxy,
NGC 4319 and an AGN/Quasar, Mrk 205. The progressive evidence from
Fig. 13 (Plate 13 Intro) – The famous debate between big telescopes in the
1970’s as to the reality of the connection between the galaxy NGC 4319 and
the quasar/AGN Markarian 205 has been settled by these CCD frames taken by
D. Strange with a 50cm telescope in the English countryside.

23
optical to X-ray was featured on the covers of my first two books, Qua-
sars, Redshifts and Controversies and Seeing Red: Redshifts, Cosmology
and Academic Science (Arp 1987; 1998b). The optical connection at
least, once hotly debated by big telescope observers, appears to have
been settled by an amateur in the English countryside with a 50 cm tele-
scope (Fig. 13, and color Plate 13 Intro).* It is also interesting to note that
the redshift of Mrk 205 (z = .070), when transformed to the rest frame of
the disturbed galaxy (z = .006), becomes z = .064. This is very close to
the first quantized redshift of z = .06.
We have seen evidence in radio contours for ejection of quasars. A par-
ticularly conclusive case was 3C 343.1 (preceding section). M 87 in the
Virgo Cluster is a well-known case where a strong radio jet and enclosed
inner X-ray jet, together, point along galaxy alignments to bright quasars.
In other 3C objects such as 3C 275.1 and 3C232, X-ray jet/filaments have
been found to point from the nearby active galaxy to the quasar (Arp
1996). But in the case of a very active object like M 82 (3C 281), it has
been stated in numerous papers that X-rays are being ejected along the
minor axis of this explosive galaxy. A very dense group of quasars is found
in this direction immediately SE of M 82 (Arp 1999), and more BSO X-ray
candidates are found NW, in the other minor axis direction, (G.R., E.M.
Burbidge, H. Arp and Z. Zibetti, ApJ in press).
* Not yet! In Oct. 2002 a Hubble Space Telescope image (and press release) claimed no connetion. But
many independent researchers printed the same picture and strikingly confirmed the bridge!! See cover pic-
ture and caption for further discussion.

24
A recent case where X-ray observers have identified ejection along the
minor axis, however, is the bright galaxy in the Leo triplet, NGC 3628.
There neutral hydrogen flow out of the galaxy is observed, as well as X-
ray ejection. An excess of quasars detected by objective prism observa-
tions as well as X-ray quasars has been discovered in this ejection along
the minor axis of NGC 3628. X-ray quasars of z = .981 and .995 are
paired across the galaxy and aligned along this minor axis. But the most
decisive observation establishing ejection is the fact that two of the qua-
sars along the minor axis fall exactly in, and at the terminus of, an X-ray
Fig. 14 - Quasars of z = .981 and .995 are paired across the minor axis of the
bright, low-redshift galaxy NGC 3628. The isophotes show that an X-ray jet from
the center of the galaxy contains the z = .995 quasar and ends on the
z = 2.15 quasar. (see Arp et al. 2002 for other features of this association.)

25
jet emerging from the nucleus of NGC 3628. They have been, so to
speak, caught in the act of departure! One Figure is shown here (Fig.14),
but the published paper contains diagrams and pictures of the various
kinds of material outflowing from the galaxy (Arp et al. 2002). This should
unequivocably settle the fact that quasars are ejected from galaxies.
a. Gamma R ays —t he Mos t E n er get ic Con n ect ion
In 1995 an X-ray survey map of the Virgo Cluster was published. It showed
X-ray connections between the dominant galaxy in the center (M49) and
the radio galaxy 3C 274 to the north and the quasar 3C 273 (z = .158) to
the south. This result was denied publication in major journals and ig-
nored. But then Hans-Dieter Radecke (1997) courageously published the
gamma ray map, confirming the connections with ≥100 MeV photons,
except that the bridge was now much stronger in the southern connec-
tion to 3C 273, and continued on unmistakably to join the quasar 3C279
(z = .538). The extremely high energy radiation was interpreted as the
ejection of proto quasar material from the active nuclei of the older gal-
axies (Arp, Narlikar and Radecke 1997). The original Radecke map can
also be seen in Seeing Red Plate 5-18 where more details of the events
connected with it can be consulted.
In my opinion Radecke’s gamma ray map of the Virgo Cluster is one of
the most important and unequivocal findings in the subject of the dis-
tances, nature and origin of quasars. Yet it has been deliberately ig-
nored, and Radecke himself is no longer involved in professional re-
search.

26
Perhaps the most important confirmation of this discovery is the fact that
slightly lower energy gamma rays, 10-30 MeV, showed the same unmis-
takable connection between the quasars of z = .158 and z = .538! This
latter result, shown here in Fig. 15, was obtained with a completely differ-
ent instrument, the Compton scattering COMPTEL, as opposed to the pho-
ton counting EGRET. Even with further observations added, the lower en-
Fig. 15 - The quasar 3C273 (z = .158) is connected by 10-30 MeV gamma rays
to the quasar 3C279 (z = .538). This is the latest COMPTEL map as published in
“Research 2000-2001, a book of posters,” Max-Planck-Institut für Extrater-
restrische Physik. (See Radecke 1997b; Arp et al. 1997; 1998b for even higher
energy maps.)

27
ergy gamma rays confirmed the highest energy connection. The abso-
lutely crucial question for the profession of science then is posed: Why is
this high-energy photon map, which overturns the most basic assumption
in extragalactic astronomy, suppressed and ignored?
In t r in s ic R eds h if t s of Gal axies
The evidence from the associations in the Catalogue can best be inter-
preted as high-redshift quasars evolving to lower redshift, then into active
galaxies and finally into normal, low-redshift galaxies. It is instructive,
therefore, to study the intermediate phases in this evolution by examining
physical companions of variously higher redshifts associated with low-
redshift parent galaxies. It has been found that the former tend to be
higher surface brightness, active, non-equilibrium forms. This supports their
classification as the next stage of the compact, energy dense quasars.
Of course, establishing even one or two cases of galaxies which have
clearly non-velocity redshifts raises the question of a physical mechanism
that can account for such a redshift. Moreover, a non-velocity redshift of
an extended, well resolved companion rules out mechanisms which are
frequently proposed, such as gravitational redshift or tired light. This is be-
cause the light travels essentially the same path to us from both the high
and low-redshift galaxy—and, further, all parts within the high-redshift
galaxy—the stars, gas, dust etc.—are redshifted about equally.
In the time taken to evolve from quasar to normal galaxy the objects can
drift from their original ejection patterns. The average cone angle for
companions around the minor axis of parent galaxies is ± 35 deg., as
opposed to ± 20 deg. for quasars (see “The Origin of Companion Galax-
ies,” Arp 1998a.) As a result, the identification of excess redshift compan-
ions becomes more of a statistical calculation based on their nearness or
grouping around the parent galaxy. On the other hand, if distances in-
dependent of redshift can be established for such galaxies, they can be
compared directly to their redshift distances. These cases, as well as in-
teraction evidence, can establish individually the presence of non-
velocity redshifts.
The observational evidence on discordant redshifts in groups is volumi-
nous and goes back to 1961 when Geoffrey and Margaret Burbidge took
spectra of the components of Stephan’s Quintet (see e.g., Arp 1987;
1998b). But here I would like to start with recent results on the distances of
galaxies and trace their connection to some of the highlights of past dis-
tance discrepancies.

28
Cepheid D is t an ces an d t he H ubbl e Con s t an t
In the early 1950’s the Period-Luminosity law of Cepheid variable stars
was calibrated in open clusters in our galaxy. It was used to obtain dis-
tances to galaxies in neighboring groups to our own. Dividing the redshifts
of those galaxies by their distances yielded a Hubble constant near
H0 = 50 km/sec/Mpc. There was always controversy over this value, how-
ever, with some investigators getting larger values. Since this constant was
supposed to represent the expansion velocity of our universe, the larger
values lead to an expansion age of our universe that was younger than
or uncomfortably close to the age of the oldest stars in our galaxy.
In an effort to minimize the effect of possible peculiar (non systematic ex-
pansion) velocities on the determination of H0, fainter Cepheids in higher
redshift galaxies were measured with Hubble Space Telescope (HST). But
Fig. 16 here shows that the H0 = 72 ± 8 which was officially celebrated,
actually means serious trouble. The reason for this is that the majority of
points define a nice, low dispersion line at about H0 = 55. This is in keep-
ing with Sandage/Tamman estimates of a Hubble flow which is quiet to
about 50 km/sec dispersion in velocity, and also in consonance with
quantization of galaxy redshifts at 37.5 km/sec which would be washed
out with larger peculiar velocities.
But more distant than about 15 Mpc the relation explodes! The peculiar
velocities jump to 1,000 km/sec and become overwhelmingly positive!
The Hubble constant, used in standard cosmology to measure the expan-
sion age of the universe, is clearly indeterminate. Since, however, dis-
crepancies between expansion ages and oldest star ages have now
been overridden by stepping on the “dark energy” gas pedal or apply-
ing the “dark matter” brakes, the value of H0 has therefore become irrele-
vant in conventional cosmology.
Could these discrepancies be velocity caused? The answer is no on four
counts:
1. The low velocity dispersion in the rather large (r ≤ 15 Mpc ) local
neighborhood should not suddenly increase by an unacceptable
amount.
2. Peculiar velocities should not be predominantly positive.
3. Tully-Fisher distances for much larger samples of galaxies all over the
sky show the same effect.

29
4. Evidence from associations of galaxies has been showing intrinsic red-
shifts for these same kinds of galaxies for over 30 years.
Fig. 16 - The redshift-distance plot that defines the Hubble constant. The dis-
tances are from HST measures of Cepheid variables and the redshifts are cata-
logued, galactocentric values (v0) from Sandage and Tamman (1981). (See Arp
2002 for original paper.)

30
a. T ul l y-F is her D is t an ces
As is well known, the only major alternative to Cepheid or bright star dis-
tances to galaxies is to measure their rotational velocities, infer their mass
and thus luminosity, and then use the difference between their apparent
and absolute magnitudes to calculate their distance. Fig. 17 shows the
same result as Fig. 16, namely, that the galaxies of less than redshift
about 1000 km/sec are well behaved with the Tully-Fisher (dTF) distance,
giving closely the same distance as the redshift distance (dz). Above red-
shifts of 1000 km/sec the redshift distances become vastly greater than
the TF distances. But these are the same kind of galaxies that violate the
redshift-distance relation in Fig. 16.
One of the most active researchers in this field, David Russell, has
checked the rotational distance criteria with another distance criterion—
diameter as a function of morphological type. He finds very close support
for the TF distances. But when he uses the redshift distances for these
Fig. 17 - Absolute blue magnitudes plotted against the redshift distances minus
Tully-Fisher distances (dz – dTF). Redshift distances for Sc galaxies are much
greater than Tully-Fisher distances for Sc’s with redshifts z ≥ 1000 km/sec (filled
circles).

31
same galaxies, he gets unprecedentedly large diameters. These are all
luminosity class ScI-II galaxies (ScI being a classification based on strong,
well defined spiral arms which I would identify as recently formed in ejec-
tion events and therefore generally younger galaxies.) The luminosity
class I galaxies are the ones that deviate the most from the average line
in Figs. 16 and 17. What this is telling us is that there is something wrong
with the redshifts of these kinds of galaxies. They must contain a large in-
trinsic component!
b. W hat do t hes e Gal axies L ook l ike?
As a last resort, some astronomers might actually look at the objects they
are using to calculate numbers. An example is NGC 309. It is an ScI,
which is shown in Fig. 18. At its redshift distance, it is compared to a gal-
Fig. 18 - At its supposed redshift distance, the ScI galaxy NGC 309 is compared
to M81, one of the largest galaxies of whose dimensions we can be sure.
NGC 309 would be so enormous that it would make M81 look like a knot in one
of its spiral arms.

32
axy to which we really know the distance. We see that the giant in our
neighborhood, known as M 81, is swallowed like a knot in the arm of this
supposedly monstrous NGC 309. This revelation usually shocks astrono-
mers, because they never think about how they casually accept objects
which contradict their empirical picture, but for which there is no prece-
dence or independent observational support.
In fact NGC 309 looks rather like an ordinary spiral, of which there are
many examples that are fainter and smaller than galaxies like M 81 and
M 31. If NGC 309 was really as large as its redshift distance would have
us believe, it should furnish a supernova about every three years—a fre-
quency amateur supernovae observers could easily testify is not seen.
Fig. 19 - Galaxies whose redshift distances are the most excessive happen to
fall in the direction of our Local Group. They are shown with optical boundaries
as a solid line and Hydrogen by a dashed line. They are so big at their sup-
posed redshift distances that they would fill the whole Local Group (from Bertola
et al. 1998).

33
Are there other examples of galaxies that would have improbable dimen-
sions if situated at their redshift distances? Fig. 19 shows an array of gal-
axies, three ScI spirals: UGC 2885, NGC 753 (33 Mpc more distant based
on its redshift than its 47 Mpc TF distance) and the bright apparent mag-
nitude spiral NGC 628. If it were at its redshift distance, however,
NGC 262 (Mrk 348) would have a diameter large enough to encompass
the whole center of the Local Group. It would subtend more than 30 deg.
on the sky! Yet it appears to be a dwarf spiral and has hardly more than
100 km/sec internal redshift differences. If the objects in Fig. 19 were
really the sizes given by their conventional redshift distances, they would
produce from 5 to 50 supernovae a year! As one might guess from their
NGC numbers, these galaxies are actually located at the pictured posi-
tions in the sky. They could be high intrinsic redshift members of the Local
Group. There are many groups in the following Catalogue which contain
even larger ranges of redshift.

34
c. Compan ion Gal axies an d L at e T ype S pir al s
As early as 1970, when Nature magazine was still publishing observa-
tional tests of astronomical assumptions, data appeared which showed
that companion galaxies and spirals had sytematically excess redshifts
relative to earlier type galaxies (Arp 1970; Jaakkola 1971; Arp 1990). Fig.
20 above shows a quintessential ScI galaxy, NGC 4156, which has been
Fig. 20 - The ScI galaxy NGC 4156 (cz = 6,700 km/sec) is only about 5
arcmin NE of the bright Seyfert NGC 4151 (z = 964 km/sec). A deep photo-
graph with the 200-inch at Palomar shows outer spiral arms leading toward
the NGC 4156 at + 5,700 km/sec excess redshift, and also to a companion
SW at + 5,400 km/sec. (See also Fig. 18 in Appendix B, Arp 1988b and Arp
1977 for original paper.)

35
known for decades to have a large excess redshift at the distance of its
parent Seyfert Galaxy. Both are X-ray sources, while the companion at
the end of the opposite arm is also an X-ray source and has the same
large, excess redshift as NGC 4156.
Sc galaxies in particular showed this effect, and the most extreme form—
ScI’s with sharply defined arms—showed it the most conspicuously. The
latter, including such ScI’s as NGC 309 and NGC 753, have the greatest
excess redshifts over HST Cepheid and TF distances, as shown in Figs. 16
and 17. There are even more extreme cases, as shown in Fig. 20, an ScI
of cz = 6,700 km/sec on the end of the arm from NGC 4151 (an Sb with
cz = 964 km/sec). (See even deeper images of NGC 4151 in Fig. 18 in
Appendix B.)
However, the diffuse, low surface brightness X-ray galaxy on the SW arm
shows that material with this intrinsic redshift can occasionally be dis-
rupted and spread out into a non-spiral, non ScI form.

36
Here Fig. 21 shows another ScI of cz = 29,400 km/sec connected to a
nearby galaxy of cz = 1,045 km/sec. In a short span one observer found
38 more examples of excess redshift companions reaching up to
∆cz = 36,000 km/sec (Arp 1982). Unfortunately the latter discoveries have
been consistently ignored in the last two decades.
As mentioned above, with the advent of X-ray and gamma ray observa-
tions, hard energy jets and connections were found from low-redshift
Fig. 21 - A dwarf galaxy north of NGC 4151 which has cz = 1,045 km/sec, with
a ScI spiral of cz = 29,400 km/sec attached. (See Arp 1977 for original paper).

37
galaxies to high-redshift quasars and ejected companions. The care with
which these observations were reduced and presented to the astronomi-
cal readership can be judged by following some of the references in
papers appearing since the 1970’s. (Arp, 1996; Arp, Narlikar and
Radecke, 1997; Arp, Burbidge, Chu, Flesch, Patat and Ruprecht, 2002).
In the following Catalogue companion galaxies and quasars are seen
strung out over generally larger arcs in the sky. Gradations and similarities
of redshift usually form the evidence for physical association with central
galaxies. It may be that deep, wide-field imaging can furnish further
connective evidence for association. But it may also be profitable to look
close to the central galaxies with deep imaging in various wavelengths to
capture associations in earlier stages. It is perhaps serendipitous that so
many large telescopes and advanced detectors have already been
built, which could be eventually be used to investigate a more sophisti-
cated and complete physics.

38
Cr os s in g t he B r idge t o a mor e Cor r ect P hys ics
It is now 30 years since Fred Hoyle gave his Henry Norris Russell Prize Lec-
ture before the American Astronomical Society in Seattle. Earlier in the
meeting I had given a short resumé of the evidence for birth of quasars
and their evolution into galaxies. It was therefore a thrill for me to later lis-
ten to Sir Fred outline a broad and insightful analysis of the kind of physics
that we would need in order to deal with these observations in extraga-
lactic realms. I was surprised to hear him offer, as a proof for the need to
consider fundamental particle masses evolving from zero, my observa-
tions of the 16,000 km/sec companion attached by a filament to the
8,000 km/sec Seyfert galaxy NGC 7603. (The latest exciting news on this
object is discussed at the at the end of Appendix B.) Five years later his
former student, Jayant Narlikar, made a more general solution of the field
equations than the Friedmann solution, which had launched the Big Bang
in 1922 (see Narlikar 1977; Narlikar and Arp 1993; Arp 1998b.). The newer
solution with evolving particle masses, I believe, elegantly explains the
redshift associations which are still so disturbing to cosmologists and
physicists.
But the subsequent story of what happened to Fred’s lecture illuminates
the situation of cosmology today. One leading astronomer came up to us
as we were talking after the lecture and blurted out, “You are both crazy.”
His prestigious Russell lecture, which was traditionally published in the As-
trophysical Journal, was inexplicably sent to a referee. Fred was out-
raged (as were others when they heard about it) and refused to proceed
with publication. I endeavoured to convince him that it should be pub-
lished, and he agreed to let me publish it in the book called The Redshift
Controversy (ed. George Field, 1973). This book records the debate be-
tween myself and John Bahcall held at the American Association for Ad-
vancement of Science in Washington on December 30, 1972. If I had not
been able to include it in this book, this seminal path to the future
mapped out by one of the most eminent scientists of this era would have
never even been available in the recorded literature.
In that lecture, entitled “The Developing Crisis in Astronomy,” he ended by
saying “...[the observations are] forcing us, whether we like it or not,
across this exceedingly important bridge [to a more fundamentally cor-
rect physics]...” I now personally regret that a generation has passed and
we are further than ever from making that advance. I hope that the fol-
lowing Catalogue of extragalactic objects will direct our feet back onto
that bridge to a better future.

39
R ef er en ces
Arp, H. 1967, ApJ 148, 321
Arp, H. 1968, Astrofizika (Armenian Acad. Sci.) 4, 49
Arp, H. 1970, Nature 225, 1033
Arp, H. 1977, ApJ 218, 70
Arp, H. 1982, ApJ 263, 54
Arp, H. 1987, Quasars, Redshifts and Controversies (Interstellar Media, Berkeley)
Arp, H. 1990, Astrophys. and Space Science 167, 183
Arp, H. 1996, A&A 316, 57
Arp, H. 1997, A&A 328, L17
Arp, H. 1998a, ApJ 496, 661
Arp, H. 1998b, Seeing Red: Redshifts, Cosmology and Academic Science (Apeiron, Montreal)
Arp, H. 1999, ApJ 525, 594
Arp, H. 2001, ApJ 549, 780
Arp, H. 2002, ApJ 571, 615
Arp, H., Bi, H.G., Chu, Y., Zhu, X. 1990, Astron. Astrophys. 239, 33
Arp, H., Burbidge, E.M., Chu, Y. Zhu, X. 2001, ApJ 553, L11
Arp, H. Burbidge, E.M., Chu, Y, Flesch, E., Patat, F., Rupprecht, G. 2002, A&A 391, 833..
Arp, H, Narlikar, J., Radecke, H.-D. 1997, Astroparticle Physics 6, 387
Bertola, F., Sulentic, J. Madore, B. 1988, New Ideas in Astronomy, Cambridge University Press
Burbidge, G.R., Burbidge. E.M. 1967, ApJ 148, L107
Burbidge, G.R., Burbidge. E.M., Solomon, P.M., Strittmatter, P.A. 1971, ApJ 170, 233
Burbidge. E.M. 1995, A&A 298, L1
Burbidge, E.M. 1997, ApJ 484, L99
Burbidge, G.R., Napier, W. 2001, AJ 121, 21
Chu, Y., Wei, J., Hu J., Zhu, X., Arp, H. 1998, ApJ 500, 596
Fanti, C., Fanti, R., Parma, P., Schilizzi, R., van Breugel, W. 1985, A&A 143, 292
Field, G., Arp, H., Bahcall, J. 1973, The Redshift Controversy, W.A. Benjamin Co., reading, Mass.
Holmberg, E. 1969, Ark. Astron. 5, 305
Jaakkola, T. 1971, Nature 234, 534
Madgwick, D., Hewett, P., Mortlock, D., Lahav, O. 2001, astro-ph/02033307
McCarthy, P., Dickinson, M., Filippenko, A., Spinrad, H., van Breugel, J. 1988, ApJ 328, L29
McCarthy, P., van Breugel, J., Spinrad, H. 1989, AJ 97, 36
Narlikar, J. 1977, Ann. Physics 107, 325
Narlikar, J. Arp, H. 1993, ApJ 405, 51
Pietsch, W., Vogler, A., Kahabka, P., Jain A., Klein, U. 1994, A&A 284, 386
Radecke, H.-D. 1997a, A&A 319, 18
Radecke, H.-D. 1997b, Astrophys. Space Sci. 249, 303
Sandage, A., Tamman, G. 1981. A Revised Shapley Ames Catalogue of Bright Galaxies, Carnegie
Institution of Washington.
Tran, H., Cohen, M., Ogle, P., Goodrich, R., di Serego Alighieri 1998, ApJ 500, 660
Ulrich, M.-H. 1972, ApJ 174, 483


41
The Catalogue
About t he Cat al ogue
The Catalogue is a picture book that shows distributions of extragalactic
objects in various sized regions of the sky. The maps presented here de-
pict associations of quasars, galaxies, clusters of galaxies and related ob-
jects in patterns which are characteristically repeated. I believe it is pos-
sible for non-specialists and even specialists to simply glance at this suc-
cession of maps to understand the essential principle involved—
alignments of higher redshift objects originating from larger, usually ac-
tive, galaxies of lower redshift. If desired, from there it is a matter of each
individual’s judgement to consider models of ejection and evolution, with
their consequences for physical processes such as the nature of redshifts,
mass, time, gravity and cosmology.
The second purpose of these pictures is to furnish key objects for further
observations. In almost all cases more redshifts, direct images, X-ray and
IR observations would further test the validity or non-validity of the asso-
ciations and also furnish important new information on their nature and
origins. Having independent observers confirm new evidence on the
processes which give rise to these patterns is perhaps the only way in
which the majority of scientists will be led to accept the new paradigm
they represent.
I hesitate to call this a Catalogue because it is not complete. Indeed,
wherever I look in the sky—for example to discover where a certain ac-
tive galaxy cluster, quasar or proposed gravitational lens came from—I
am likely to find its source plus other families of extragalactic objects, with
a large, low-redshift galaxy and associations of higher redshift compan-
ions. There are many more examples of this basic pattern to be discov-
ered, so this is merely a sample. And again, their acceptance will be has-
tened by independent discovery.
About t he L is t ed As s ociat ion s
The examples are listed in order of increasing right ascension (R.A. epoch
2000). This is to facilitate observers finding the kind of association they
want to study in a region of the sky accessible to them. Each association

42
is generally named according to the brightest object or the object con-
sidered to be the origin of the higher redshift objects. The picture is dis-
played on the right hand page with the most important information la-
belled. The title object is described at the top of the left hand page, its
apparent magnitude and redshift if known, and any indications of an
energetic nucleus, for example: Seyfert, infrared, X-ray activity or mor-
phological distortion.
Next are listed the most significant objects for the association, usually
bright or unusual, higher redshift objects which are aligned. Such objects
are usually rare and completely surveyed, or readily assigned a uniform
limiting magnitude. Since the brightest objects in a given class are the
nearest to us, their associations stand out most conspicuously against
background objects. Thus each field represents the starting information to
launch a more complete investigation; for example whether there are
somewhat fainter or different classes of objects in the field which rein-
force the connection with the proposed object of origin. Many of these
further observations can be carried out with small to medium aperture
telescopes. This opens a critically important field of investigation to as-
tronomers who do not have access to large telescopes and to amateurs
who have modern CCD detectors and spectroscopic capabilities.
S ugges t ed U s e
Further investigations are most easily initiated with the aid of computer
archives. The currently available data for any plotted object in a field
can be obtained from SIMBAD or NED. The R.A., Dec. and apparent
magnitude can be used to target any galaxies that require redshifts. In-
frared catalogues can be used to study IRAS sources. Catalogues such
as NVSS and FIRST can be used to locate radio sources. For X-ray sources,
the ROSAT archives from Max-Planck-Extraterrestriche (MPE) give X-ray
measures in all-sky, PSPC and high resolution (HRI) modes (both sources
and browser, the latter of which gives standard reduction maps under the
click marked b). The X-ray sources are particularly important because
point X-ray sources are often associated with blue stellar objects (BSO’s).
These, in turn, invariably turn out to be quasars that are easily identifiable
spectroscopically. Optical identifications can be made through the
automatic plate measuring surveys of blue and red Schmidt Sky Surveys
(APM) and U.S. Naval Observatory (USNOA). Finding charts can be
downloaded from the ESO digitized sky survey. The latter are useful for
identifying bright extended X-ray sources (EXSS) as galaxy clusters and
obtaining a first impression of their shapes.

43
No attempt has been made in the current sample of associations to list
published references or their authors except in rare cases where previous
studies might not be listed in the abstract data services (ADS). Any objects
identified in either SIMBAD or NED will have references appended if they
appear in modern, standard journals.
One must be wary of selection effects. In any given field the recording of
any given type of object may be incomplete. For example, galaxy sur-
veys might have a border passing through the field. Quasars could be
sampled in a small, deep field or within an approximately 1 degree ra-
dius PSPC field.
But for objects like NGC galaxies, Abell galaxy clusters (ACO), 3C radio
sources and bright apparent magnitude quasars, I assume essentially
uniform and complete sky coverage. When it comes to fainter objects,
e.g., 16th mag. galaxies or emission line objects, we might see clusters,
but immediately ask if galaxies in the surrounding regions have been
completely observed. If we can see the cluster elongated, however, we
tend to believe that to be real, because there is no reason for catalogu-
ers to measure along a line and no reason for them to be aware that the
line pointed to a nearby, low-redshift galaxy, as occurs in a number of
cases. The challenge that immediately presents itself is to observe more
objects along this line—to test, for example, whether objects of similar
redshifts support the conclusion that it is neither accidental nor a back-
ground feature. As observations on any candidate association are com-
pleted new objects will need to be investigated, and if they add to the
understanding of the origin of the association they will represent impor-
tant new, first hand discoveries.
W hat t o l ook f or
a. P air s an d al ign men t s
A sample of some of the best cases of quasars aligned across active,
ejecting galaxies is discussed in the Introduction (prototypical aligned
pairs). The purpose of that section was to establish firmly the pattern of
high-redshift objects paired across a low-redshift, usually bright galaxy. It
also established that the high-redshift objects tend to come out along the
minor axis (when that is measurable), that they tend to resemble each
other in redshift and other properties, and that redshifts tend to fall near
preferred, quantized values (Arp 1998).

44
When young objects leave the galaxy of origin unimpeded, say along
the minor axis, the the lowest redshift objects tend to be observed most
distant, and higher redshift objects closer to the galaxy of origin. This is
expected if the intrinsic redshift diminishes as a function of age, because
the more distant ones would have been travelling longer. On the other
hand, when they exit through an appreciable part of the galaxy, they
tend to disrupt the galaxy, and the ejecta tend to fragment and stay
closer to the galaxy of origin (see e.g., Arp 1999). Moreover, remnants of
the original galaxy which have the same redshift as or slightly larger red-
shifts than the ejecting galaxy can be entrained along the ejection path
leading to much higher redshift ejecta.
b. New eviden ce f r om el on gat ion s of gr oups of X-r ay s our ces
As the data on the present associations was being collected, X-ray ar-
chives revealed that many of the apparently ejected higher redshift ob-
jects had been observed as X-ray sources. Simply looking at the plots in
the ROSAT X-ray source or sequence browsers frequently showed that the
recorded sources in the field were conspicuously distributed in elongated
patterns, often across a central source. The fact that in a number of
cases they were aligned toward a central object of origin would seem to
be decisive proof that they originated in the (usually lower redshift) ob-
ject.
In one key case a high resolution X-ray observation showed a cold front
(in the nature of a bow shock) moving down the elongated X-ray cluster
Abell 3667 at 1400 km/sec directly away from the central, X-ray ejecting,
lower redshift galaxy. (This association is not presented in the main body
of the present Catalogue; but see Appendix B here, and full details are
given in Arp 2001 + note added in manuscript.) All the cases in the pre-
sent Catalogue should be checked for X-ray properties. Since the ener-
getic X-ray activity tends to decay, it should be indicative of younger ob-
jects and hence higher redshifts. The configurations also apparently can
be relatively unrelaxed and therefore record the directions and proc-
esses involved in their origins. Chandra and XMM observations would be
particularly valuable in this respect.

45
c. E vol ut ion
One of the most valuable types of data to be obtained from the present
Catalogue associations is the behaviour of the ejected objects as they
progress further from their galaxy of origin. Generally they reduce in red-
shift, presumably as they grow older and evolve. The morphological and
energetic continuity as they transform from compact high energy density
quasars to more quiescent, relaxed normal galaxies is very important in
justifying the conclusion that quasars are continually evolving into normal
galaxies. It also represents the best opportunity to obtain data on what
fundamental physical processes are taking place. The associations pre-
sented in this Catalogue will, I hope, furnish the empirical data with which
to trace and understand this evolution. (We should also be aware, how-
ever, that entrained or ablated material can exhibit different redshift pro-
gressions.)
d. Quan t iz ed R eds h if t s in t he R es t F r ame of t he P ar en t Gal axy
The Karlsson redshift quantization values were found for bright quasars
mainly associated with low-redshift galaxies. But when associations are
found with fainter apparent magnitude quasars around higher redshift
galaxies, one has to correct for the redshift of the parent galaxy. To find
the redshift of the quasar in the reference frame of the ejecting galaxy
one needs to divide by the redshift of the galaxy, i.e.,
(1 + zQ) = (1 + z1)/(1 + zG).
Failure to realize this led some to reject the quantized redshift values be-
cause “the values drifted away from the peaks for larger samples at
fainter apparent magnitudes.” But, as cautioned in the early papers,
proper analyses in any sample should calculate the redshift values as a
function of the galaxies from which they originated.
For ejecta originating from low-redshift galaxies, this correction is not sig-
nificant. But in the following Catalogue there are a number of examples
where correction for an appreciable redshift of the parent galaxy moves
the corrected quasar redshift onto, or much closer to, the expected peak
redshift. I often point out these cases because I argue that if the quasar
were not associated with the galaxy the correction would not, in general,
move it onto the peak. If the correction moves the redshift particularly
close, this is evidence for the physical association of this particular galaxy
and quasar.

46
e. H ier ar ch ical As s ociat ion s
Finally there is the question of how large and nearby associations can
get. Can one always trace back an even earlier origin from an even
brighter, lower redshift galaxy? M 101 is a case in point, with higher red-
shift galaxies and secondary and tertiary ejections extending out possibly
to a radius of ~ 15 deg. The brightest objects, like M 101, of course, are
generally the closest to us and subtend the greatest angles on the sky.
Are fainter associations less luminous hierarchical generations within the
nearby structure or are they more distant copies of the nearby system?
The evidence that many objects previously believed to be at great dis-
tances are actually much closer confronts us with the most drastic possi-
ble revision of current concepts. Because this point needs to be explored
in more detail, M 101 is treated in a separate section at the end of the
Catalogue (Appendix A).
One specific question to which this leads is: How many of the observed
extragalactic objects in fact belong to the Local Supercluster and how
many lie beyond? In this regard, readers will notice that cases of associa-
tion in this Catalogue tend to avoid that part of the sky in the general di-
rection of the center of the Local Supercluster. Clearly that is where the
highest density of potential parent galaxies in the sky is encountered. It is
suggested, however, that the associations are too intermingled there,
and that they simply stand out more clearly in areas of sparser bright
galaxy population. This is one of the more difficult questions that is left for
future analysis.
R ef er en ces
Arp, H. 1998, Seeing Red: Redshifts, Cosmology and Academic Science (Montreal,
Apeiron)
Arp, H. 1999, ApJ 525, 594
Arp, H. 2001, ApJ 549, 802
Burbidge, E.M., Burbidge G.R., 1967, ApJ 148, L107.
Burbidge, G.R. 2001, AJ 121, 21.

47
Catalogue Entries

48
NGC 7817 00h 03m 59.0s 20d 45m 08s
mpg = 12.7 mag. z = .0077 Sb/Sc, IRAS, Radio Source
There are three bright X-ray sources within 60 arcmin aligned across
NGC 7817, as shown in the adjoining figure (filled circles marked with an
x). The minor axis of N7817 is p.a. = 135 deg., just in the direction of Mrk
335. One of the absorption line systems in Mrk 335 is at z = .0076, com-
pared to z = .0077 for N7817. A compact blue X-ray object lies about
half way along the line to the z = 1.11 quasar (at 00h02m53.5s
+ 21d01m10s). A fourth galaxy is near this same line, just out of the frame to
the NW. It is an IRAS, UV excess galaxy of z = .035 and forms a good pair
with Mrk 335 at z = .026.
A cluster of X-ray sources lies about 40 arcmin NE of Mrk 335 and to the
ESE of NGC 7817. It contains a rather dense group of quasars in the re-
gion indicated in the figure by dashed lines. They include the rather in-
triguing redshifts of z = 1.38 and 1.40 and z = .77 and .75. There is also
an X-ray luminous quasar at z = .389 in this group which is an almost per-
fect match for the nearby ASCA quasar of z = .388 which is shown in the
figure.
Mrk 335 is surrounded by many UV bright objects. It arouses curiosity as to
what the fainter ones might be.
Al ign ed Obj ect s
z = .026 Sey1 V = 13.85 Mrk 335, 1RX
z = .388 QSO V = 18.1 EXOSAT 0003.4+ 2014
z = 1.106 RSO O = 19.1 TEX 2358+ 209, 1RX
z = .035 Gal m = 15.3 IRAS F23569+ 2108
Needed
Deep wide field images, identification of UV objects, some redshifts.

49

50
NGC 68 00h 18m 18.5s 30d 04m 17s
mpg = 14.5 mag. z = .019 S0:
The Perseus-Pisces filament is very large, stretching across almost a quad-
rant of the sky. The figure here shows a portion of the western part. Sub-
filaments are conspicuous in the figure, but the interesting aspect is that
along the major filaments of z = .023 galaxies there are, defining the
same filaments, galaxies of z = .08 to .10. There are some groups and
clusters along these lines: for example Abell 21 at z = .095, which ap-
pears to stretch up to the Zwicky cluster at z = .023 in the center of the
field. There are also an X-ray BSO and a z = .51 Seyfert, which may be
associated with the latter filament. Near the NGC 68 group there is a BL
Lac object with no present redshift.
Fig. 1
51
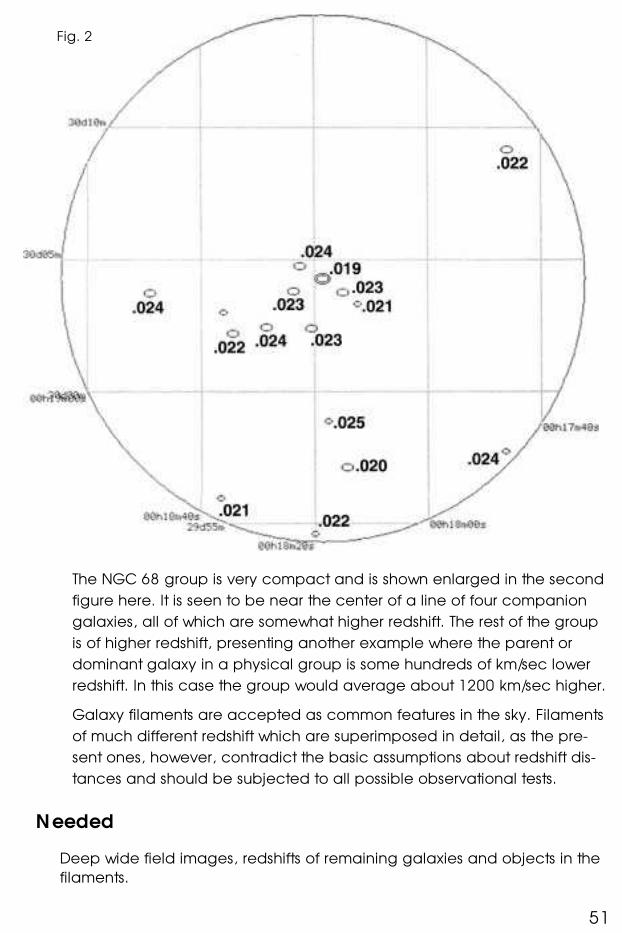
The NGC 68 group is very compact and is shown enlarged in the second
figure here. It is seen to be near the center of a line of four companion
galaxies, all of which are somewhat higher redshift. The rest of the group
is of higher redshift, presenting another example where the parent or
dominant galaxy in a physical group is some hundreds of km/sec lower
redshift. In this case the group would average about 1200 km/sec higher.
Galaxy filaments are accepted as common features in the sky. Filaments
of much different redshift which are superimposed in detail, as the pre-
sent ones, however, contradict the basic assumptions about redshift dis-
tances and should be subjected to all possible observational tests.
Needed
Deep wide field images, redshifts of remaining galaxies and objects in the
filaments.
Fig. 2

52
NGC 214 00h 41m 27.9s 25d 30m 01s
BT = 13.0 mag. z = .015 ScI: Perseus-Pisces Filament
The X-ray cluster CLG J0030+ 2618 contains an X-ray luminous galaxy of
z = .516. The CRSS* measures of X-ray sources in the PSPC† observations
which include this cluster reveal a number of quasars in the range mostly
from z = .5 to 1.7. The question arose as to where the parent galaxy to
this unusual grouping might be. As the accompanying figure shows, there
is a line of galaxies leading from NGC 214 directly toward the cluster.
The remarkable feature of this line of galaxies is that their redshifts in-
crease monotonically as they leave NGC 214 and approach the cluster
(z = .015, .02, .. .03, .. .07). The cluster itself has a wide range of quasar
redshifts, and to quote Brandt et al., AJ 119, 2359, an X-ray background
source density more than 4.5 times expected! This strongly suggests an
aggregate of different redshifts at the same distance.
Looking in the opposite direction from NGC 214, there is, amazingly, a
string of galaxies leading to another cluster of galaxies, Abell 104. The
same kind of progression of redshifts is observed (z = .015, 03,.. .05, ..
.04, .. .05, .. .08, .. .09). The Abell Cluster has z = .082. The Abell cluster it-
self is also extended along the line back to NGC 214 as if its original ma-
terial had been ablating as it moved outward. For further discussion see
Appendix B, Ejection Figs. 9, 10 and 11.
Needed
Deep wide field images, redshifts of X-ray sources and further galaxies
along the lines.
* Cambridge ROSAT Serendipity Survey (Mon. Not. Roy. Astr. Soc. 272, 462, 1995). † ROSAT, low resolution X-ray photon counter.

53

54
ESO 476-20 01h 31m 40.0s –25d 32m 41s
V = 15.0 z = .020 E gal, IRAS Source
The bright apparent magnitude quasars at 16.6 and 17.6 mag. are
aligned accurately across the central galaxy which is also an infrared
source. They are also equally spaced at 1.14 and 1.18 degrees. The SE
quasar is a strong radio source and the NW quasar is probably to be
identified with the strong, 1RX, X-ray source.
Closely along this line are a number of objects indicated in the adjoining
plot. Firstly there are four galaxies all of z = .071 and .070. This is close to
the quantized value of z = .062. Also aligned are Abell Clusters 214 and
possibly 210. Abell 214 is apparently a strong X-ray cluster and there is an
all sky survey X-ray source falling along this line which is identifed as a
blue stellar object of R = 17.4 mag. and is a good quasar candidate.
In the accompanying figure there is a brighter galaxy plotted to the east
of ESO 476-20 which has a redshift 229 km/sec less. This suggests that it is
the parent galaxy of ESO 476-20 and that the latter is its active compan-
ion. Along this E-W line are found two clusters of fainter galaxies and a
gamma ray burster (GRB). On the other side is Abell 206, all of which may
indicate a second line of ejection of somewhat different kinds of objects
(see ejection lines from M 101 in Appendix A).
Al ign ed Obj ect s
z = 1.20 QSO V = 16.6 GD1357,1RX:
z = 1.53 QSR O = 17.6 1Jy 0133-266
z = .160 GCl m10 = 17.5 ACO 214,1RX
z = .--- BSO R = 17.4 1RXS
Needed
Spectrum of BSO, direct images of clusters, spectra of additional objects
along alignment.

55

56
NGC 613 01h 34m 18.2s –29d 25m 02s
V = 10.3 mag. z = .005 SBbpec, Arp/Madore 0132-294 multi armed spiral with strong radio ejection
This is a new and particularly striking example of ejected quasars from an
active galaxy and supports the long standing suggestion that spiral arms
are caused by compact ejections from the nuclei of sprial galaxies (Arp,
Sci. American, 1963).
The radio map (Fig. 3, NVSS, Condon et al. 1998) indicates ejection along
the narrow bar of this active galaxy. The bar and this presumed radio
ejection (possibly two sources on either side) point directly to quasars
from the 2dF survey of z = 2.22 and z = 2.06 as shown on the accompa-
nying map. As for the quasars further out, they also tend to be placed
along the ejection direction, particularly the z = 1.86 and z = 1.48 qua-
sars. So there are two sets of quasars suggesting a match with the two in-
ner pairs of radio sources. The numerical value of the quasar redshifts
also argue against their being accidental background projections. We
note particularly the the average redshift of the nearest two on the NW as
being z = 2.04 closely matching the z = 2.06 of the ones on the SE. The
two in the outer most pair are also very similar at z = 1.41 and z = 1.48.
There is a quasar 13.6’ E of NGC 613 in the Fig. which is very bright at
15.7 apparent magnitude and is a very strong X-ray source. Quite closely
aligned on the other side of NGC 613 is a gamma ray burster, 4B 940216,
(located 17.2’ W, just beyond the z = 1.69 quasar in the Fig.). This pair of
unusual objects fits the distance and alignment criteria of ejected objects
from bright galaxies. Association of GRB’s with active, low redshift galaxies
has been pointed out in this Catalogue and by G. Burbidge (2003).
It is also notable that the bright quasar has z = .699 and only 17” N of it
there is a quasar of z = 1.177. When the latter redshift is transformed into
the rest frame of the brighter object it becomes z0 = .28—very close to
the Karlsson preferred redshift peak of z = .30. If physically associated it
would suggest a secondary ejection.
Fig. 2 shows a IIIa-J Sky Survey picture NGC 613, a multi arm spiral. Im-
ages of the interior regions and infra red wavelengths show a narrow bar
running in the direction of the two nearest quasars.

57
Fig. 2
Needed
Higher resolution, deeper, radio and optical mapping of the narrow bar
in NGC 613.
Fig. 1
Fig. 3

58
NGC 622 01h 36m 00.2s 00d 39m 48s
mpg = 14.1 mag. z = .017 SBb, Mrk 571, em line with straight arm to QSO
and UM 341 01h 34m 18.2 00d 15m 37s
V = 16.9 mag. z = .399 Sey1, QSO, PHL 1037
The great importance of this particular field is to show how large scale
surveys of quasars should be examined in order to study the redshift
peaks at the Karlsson values of ... .30, .60, .96, 1.42, 1.96, .2.64, 3.48 ...
We start by looking at NGC 622, an active Markarian galaxy with two
quasars only 71 and 73 arcsec away. At such close separation it is clear
that they are associated, even if one did not notice the straight arm com-
ing out of the galaxy and ending almost on the z = 1.46 quasar. (see
Quasars, Redshifts and Controversies, 1987, Interstellar Media, Berkeley,
p. 9-11.)
But this is part of a region which has recently been scanned for quasars in
the Sloan Digital Sky Survey (SDSS). The quasars now known are shown in
the accompanying figure with their redshifts written next to their plotted
positions. One first notices that there is a loose group of quasars about 35
arcmin SW of NGC 622 (filled circles). Four of them have closely the same
redshift, between z = .72 and .78. Generally, inside this group are higher
redshift quasars, all roughly centred on a relatively bright, active
Sey1/QSO. But, distressingly, all nine of these quasars fall not only off the
predicted peaks—but fairly exactly between the peaks. If one transforms
them, however, to the reference frame of the central UM 341, which has
z = .399 they magically fall remarkably close to the expected peaks!
Quas ar s As s ociat ed w it h U M 3 4 1
Name mag. (g) z z0 ∆z peak Remarks
UM 341 16.6 .399 Seyfert parent
SDSS 18.4 1.666 .91 –.05
SDSS 18.6 .718 .23 –.07
4C V = 21.7 .879 .34 + .04 PKS B–V = .84
SDSS 19.0 .745 .24 –.06
UM 18.2 1.31 .65 + .05
SDSS 19.3 1.805 1.01 + .05 Radio Gal
SDSS 21.9 3.183 1.99 + .03
SDSS 19.1 .734 .25 + .05
SDSS 19.1 .781 .27 + .03

59
What about the remaining 7 quasars around the eastern circumference
of the field (open circles)? They turn out to fit the Karlsson peaks very well
when transformed to the z = .017 galaxies like NGC 622, which are pre-
sent over the field. It is noticeable that many active galaxies—not only in
the Perseus-Pisces filament, but all over the sky—have this ~ 5000 km/sec
redshift.
Quas ar s As s ociat ed w it h NGC 6 2 2
Name mag. (g) z z0 ∆z peak Remarks
NGC 622 m = 14.1 .017 Mrk 571
UB1 18.4 .91 .88 –.08
BS01 19.0 1.472 1.43 + .02
SDSS 18.9 1.501 1.46 + .05
SDSS 19.3 2.749 2.69 + .05
FIRST 17.8 .344 .32 + .02 Radio Gal
SDSS 18.6 1.522 1.48 + .07
SDSS 19.2 1.049 1.01 + .05
Fig. 1

60
The important point demonstrated above is that if the quasars
are simply analyzed without inspection of the field, no redshift
periodicity will be found. If parent galaxies are identified, the
periodicity will be conspicuously observed. Unfortunately fail-
ure to actually look at the data in detail resulted in a press re-
lease by Hawkins, Maddox and Merrifield (M.N.R.A.S. 336, L13,
2002) which publicized widely the conclusion that the largest
body of data on quasars proved that there was no quantiza-
tion present in the redshifts.
One might ask if UM 341 and NGC 622 are related. It can be seen that
UM 341 falls only about 35 arcmin from the very active NGC 622. This is
typically the distance for ejected QSO/AGN’s, and UM 341 then would
represent a case where the QSO was in turn ejecting QSO’s. The clinching
evidence in this case lies in the nvss radio map (NGC 622 Fig. 3). There it
is seen that a radio jet stretches about 5 arcmin to the SW at a position
angle about p.a. = 236 deg. Since UM 341 is located at p.a. = 228 deg.
This is strong supporting evidence that the it has been ejected in this di-
Labeled are redshifts in rest frame of UM 341 and
delta z’s.
Fig. 2

61
rection from NGC 622. (The first concentration to the SW in the jet repre-
sents the z = 1.46 quasar.) The fact that the QSO’s ejected from the
younger object (UM 341) are on average only slightly fainter in apparent
magnitude than the quasars associated with NGC 622 then furnishes im-
portant clues for the nature of the nucleus ejecting the object.
It is very important to note that when the quasars form apparent pairs
across the ejecting galaxy, as they do around UM 341, the small devia-
tions from the redshift peaks (listed as ∆z peak in Table 1) are usually plus
and minus, representing a small velocity of ejection away from and to-
ward the observer: 1 + zv = (1 + z0)/(1 + zpeak). This pattern is shown in Fig.
2 here. We will see more examples of this throughout the Catalogue, par-
ticularly in the SDSS field around NGC 3023 and the mixed SDSS and 2dF
field around UM 602. An example of redshift periodicity at the 10–4 level
of being accidental will be shown for the 2dF field around NGC 7507.
Fig. 3
Radio map of NGC 622 and z = 1.46 quasar.

62
NGC 632 01h 37m 17.7s 05d 52m 38s
mpg = 13.5 mag. z = .011 S0pec, Mrk 1002, IRAS
This central galaxy was brought to my attention by Fernando Patat, who is
studying it in detail with the VLT. It is the center of an exactly aligned,
equally spaced pair. The SW member of the pair is NGC 631 at
∆v = + 2,362 km/sec. The NE member of the pair is a moderately bright
quasar at z = .615. Since the central galaxy is low redshift, it is expected
that the quasar redshift would be near the quantized peak of z = .60. But
if it is corrected into the rest frame of the z = .011, galaxy it comes ex-
tremely close at z = .597.
There are numerous other PHL candidate quasars in the more extended
area around NGC 632.
Al ign ed Obj ect s
z = .011 Gal m = 13.5 NGC 632
z = .019 Gal m = 15.0 NGC 631
z = .615 QSO V = 18.2 PHL1072
Needed
X-ray observations of field.

63

64
NGC 720 01h 53m 00.4s –13d 44m 17s
BT = 11.15 z = .0057 E5 gal, strong X-ray source
About 14 arcmin SW of NGC 720 is one of the most luminous X-ray clusters
known, RXJ 0152.7-1357. The cluster is very elongated, both optically and
in X-rays, and points in the direction of the very bright Shapley-Ames Gal-
axy. (see Arp 2001, ApJ 549, p. 816). NGC 720 is active, with an X-ray
filament extending from the nucleus and curving southward as it emerges
(Buote and Canizares 1996).
There are two further intriguing aspects of this region: One is the two ex-
tended X-ray sources, one of which is diametrically opposite to the
z = .83 X-ray cluster. Such objects usually turn out to be identified with
clusters of galaxies. Are these two clusters? And if so are they elongated?
Secondly the Palomar Schmidt deep (dss2) survey seems to show at the
limit, two very elongated groups of galaxies, closer to NGC 720 and
aligned closely along the minor axis (see dashed contours in the accom-
panying figure). Possibly associated with the SW candidate cluster is an X-
ray source, emission line galaxy of z = .17. A deep, fairly wide field expo-
sure is needed to confirm the important possibility of these two candidate
clusters and their possible elongation.
There is a strong radio, strong X-ray source which has been identified with
a z = 1.35 quasar and is closely along the extension of the line from
NGC 720 beyond the powerful X-ray cluster. It is faint in optical wave-
lengths (R = 20.4, B = 20.2 mag.). This is typical of Bl Lac type objects
and reminds one of the object just N of NGC 4151 and other similar cases
(Arp 1997).
From the PSPC observation of this field, a strong X-ray BSO exactly across
NGC 720 from the z = .83 X-ray cluster is plotted in the accompanying
figure. It is No. 11 in the ROSAT 2RXP Source Catalogue and is identified
with a very blue BSO in the next to last line of the table below. (See Ap-
pendix B for a position of this X-ray BSO and Ejection Figs. 7 and 8).

65
Al ign ed Obj ect s
z = .83 GCl V = -- RXJ 0152.7-1357
z = 1.35 QSR R = 20.4 1REXJ015232-1412.6
z = .--- EXSS m = ? extended X-ray source
z = .--- EXSS m = ? extended X-ray source
z = .--- PSPC R = 19.0 C = 5.8 cts/ks, BSO
z = .17 emGal V = 19.2 1RXS
U r gen t l y Needed
Deep, wide field (about 30 arcmin radius) imaging to identify suspected
galaxy clusters in the field, particularly along minor axis of NGC 720. Also
redshifts of the X-ray BSO and 4-5 “blue” objects in the field.

66
A 27.01 (ESO 359-G019) 04h 05m 01.7s –37d 11m 01s
V = 15.4 z = .056 Seyfert 1, very bright nucleus
The extremely rapid (≤ 1hr) radio variable, QSO 0405-385, is one of a pair
of strongly radio emitting QSO’s centered on an unprecedentedly ener-
getic X-ray emitting (~ 4000 cts/ks) active galaxy. The most unusual as-
pect of this galaxy is that even with its bright nucleus, it is optically several
magnitudes fainter than active galaxies which have comparably huge X-
ray fluxes such as NGC 1275, NGC 4253 and NGC 7213.
The chance of accidental pairing of background objects, despite the
wide separation, is ≤ 10–5. In addition, the objects are extremely unsual,
very strong radio quasars and X-ray sources, one of them a rapid radio
variable with implied excessive brightness temperature and also de-
tected in gamma rays!
There are a moderate number of galaxies in the field, but two have al-
most exactly the same redshift at z = .059 and are aligned either side of
the central Seyfert and closely along the line of the two quasars. They are
only slightly greater redshift than A 27.01, at z = .056. They may represent
entrained material.
Note: The association was discovered when G. Burbidge noted the report
of an unusually fast variation for the quasar and asked Arp if he could
suggest a distance for the quasar. The pairing of the quasar with another
bright quasar across the unusual Seyfert was then discovered. The con-
figuration was conservatively estimated to have only about a 10–5
chance of being accidental. But this did not take account of the ex-
tremely unusual nature of the objects involved.
A detailed account of the discovery of this extraordinary X-ray galaxy
was submitted to the Pub. Astron. Soc. Pacific (PASP). A referee recom-
mended rejection of the paper on the grounds that it had not calculated
the probablility of the configuration being accidental. Arp replied by
pointing out the page and paragraph where the calculation had been
made. The editors then rejected the paper on the grounds that no
changes had been made to accommodate the referee. Arp resigned
from the ASP on grounds of editorial misconduct and suppression of sci-
entific information to its members/readers.
I mention this history for two reasons:

67
1) To demonstrate that many professional astronomers not only disbelieve
the significance of the associations presented in this Catalogue, but they
oppose their publication.
2) To stress the fact that readers must draw their own conclusions from the
data. If the conclusion is that the data is of significance, then the most
important question then becomes: “Does academic science require fun-
damental reform?”
Al ign ed Obj ect s
z = .056 Sey1 V = 15.4 ESO 359-G019
z = 1.417 QSR V = 17.2 PKS 0402-362
z = 1.285 QSR V = 18 PKS 0405-385
z = .059 gal B = 15.56 APMBGC
z = .059 gal m = --- APMBGC
Needed
Deep, high resolution images of the extreme X-ray Seyfert, data on sur-
rounding cluster.

68
NGC 2435 07h 44m 13.7s + 31d 39m 02s
m = 13.5 IRAS source z = .0140
companion 07h 43m 33.0s + 31d 32m 06s
m = 15.7 (UGC 3986) sf of pair z = .0125
Two very bright quasars, from among about 100 individually imaged by
HST, form an obvious pair across NGC 2435. They are better aligned,
however, across a close pair of companions, as shown in the opposite
Figure. Companion galaxies are previously identified sources of quasar
ejection (ApJ 271, 479, 1983). But usually the companions have slightly
higher redshift than the main galaxy. In this case the companion whose
redshift has been measured has about 450 km/sec less redshift, suggest-
ing it was the originally larger galaxy but fragmented in the process of
ejecting the quasars. Supporting this scenario are two higher redshift qua-
sars, still very bright for their redshift, which are aligned exactly across the
z = .0125 companion.
The z = .46 quasar is interesting because there are much fainter galaxies
around it of roughly the same redshift. But the brightest of the galaxies
within this cluster are about .06 less redshifted than z = .46. The fainter
galaxies in the cluster, including the quasar, thus appear to have higher
intrinsic redshifts. One of these fainter galaxies, however, has z = .607—
very close to the redshift of the z = .63 quasar on the opposite side of the
NGC 2435 group.
Note: The redshifts of the two brightest quasars across the low redshift
galaxy are intriguingly close to the redshifts paired across the famous
Seyferts Mrk 205 and NGC 4258:
NGC 4258 z1 = .40 z2 = .65
Mrk 205 z1 = .46 z2 = .64
NGC 2435 z1 = .46 z2 = .63
Al ign ed QS O’s
z = .462 RSO V = 15.63
z = .630 RSO V = 16.14
z = 1.531 QSO V = 18.1
z = 1.909 QSO V = 17.56

69
Needed
There is only a relatively short HRI X-ray exposure available on the z = .63
quasar, but it records 4 or 5 sources leading accurately back in the direc-
tion of the NGC 2435 companion. Deeper X-ray exposures should be ob-
tained on all the quasars.

70
Mrk 91 08h 32m 28.2s + 52d 36m 22s
mpg = 14.7 mag. z = .017 IRAS source in Zwicky Cluster 0829+ 5245 08h33m18s + 52d35m
m = 13.9 and fainter, z = .016
Two Markarian objects and one UGC galaxy form the core of this Zwicky
cluster. A bright apparent magnitude quasar of z = 3.91 falls in the clus-
ter. Even when gravitational lensing is hypothesized the quasar is still de-
rived to be among the most luminous known. The Sloan Digital Sky Survey
(SDSS) screening for quasars with z > 3.94 turns up two more close by the
z = 3.91 quasar at z = 3.97 and 4.44.
Mrk 91 is a fairly bright, active galaxy near the center of this Zwicky Clus-
ter, and there are indications of alignments of z = 2.06 and .34 quasars
to the SW of it plus a tight group of NGC galaxies at z = .045 to the NE.
The quasars (filled circles), and Zwicky cluster and NGC 2600 cluster
(open circles ), at z = .016 and .04 are first shown alone in order to em-
phasize their association. The next Figure adds many of the details of the
objects in the region.
Al ign ed Obj ect s
z = 3.91 QSO R = 15.2 QSO B0827.9+ 5255
z = 3.97 QSO SDSS J083324.57+ 523955.0
z = 4.44 QSO SDSS J083103.00+ 523533.6
z = 4.02 QSO SDSS J083212.37+ 530327.4
z = 2.06 QSO CLASS B0827+ 525
z = .34 AGN V = 20.3 87 GB 08241+ 5228, radio
z = --- Gal: V = 17.5 1RXS J083010.5+ 523031
Needed
Deep images, spectra of X-ray object, additional galaxies along line.

71

72
NGC 2649 08h 44m 08.5s 34d 43m 01s
mpg = 13.1 mag. z = .014 SBb/Sc, IRAS Source
As a sample of what might be contained in the NORAS survey of X-ray
galaxy clusters (Böhringer et al. ApJS 129,435), it was noted that two RXC
clusters of z = .38 and .41 fell close together on the sky. The Simbad plot
shows that they are contained in a long, conspicuous string of galaxies.
Of those that have been measured, there are 7 with .050 ≤ z ≤ .057.
Also along this line, just NE of the z = .41 RXC cluster is a radio loud, X-ray
Gal/QSO? at z = .43. At the NE end of this same line there is an Abell Clus-
ter of z = .093 and a neighboring ACO at z = .095. Another Abell Cluster,
ACO 710 lies nearer the center of the line close to the z = .38 RXC clus-
ter.
The only large, active(?) galaxy in this line is NGC 2649 at the end of the
line.
Al ign ed Obj ect s
z = .378 GCl ------- RXC J0850.2+ 3603
z = .411 GCL ------ RXC J0856.1+ 3756
z = .43 G: O = 19.4 B3 0854+ 384, X-ray
z = .095 GCl m = 16.7 ACO 727
z = .093 GCl m = 16.7 ACO 724
z = .--- GCl m = 17.9 ACO 710
Needed
Redshifts of more objects along the line, analyses of neighborhoods of the
378 X-ray clusters in the NORAS Catalogue.

73

74
NGC 3023 09h 49m 52.6s 00d 37m 06s
mpg = 13.3 mag. z = .0056 Spiral, pair with NGC 3018 Mrk 1236 (z = .0061) part of disturbed spiral arm
The importance of this particular field is that it again demonstrates that
the SDSS and other recent large scale surveys of quasars show many
concentrations of quasars which are not only at the redshift peaks of
...30, .60, .96, 1.42, 1.96, 2.64, 3.48... but that these quasars are paired
across large and/or active galaxies in such a way as to preclude acci-
dental association.
The Figure shows six quasars in a field of radius 30 arcmin which are cen-
tered on the active triplet of galaxies around NGC 3023. The outstanding
pair consists of z = .640 and z = .584 quasars which fall zv = + .02 and –
.02 from the major redshift peak at z = .60. It would be difficult to avoid
the implication that they had been ejected from one of the central gal-
axies and were now travelling with a radial component of velocity .02c,
one away from, and one toward the observer.
Moreover, there are two other pairs of quasars in approximately the same
direction. One pair has apparent velocity deviations from the redshift
peaks of + .09 and –.07 and the other + .03 and –.06. This pattern is
characteristically encountered (e.g., see UM 341 in the NGC 622 field
and pairs analyzed in the introduction). The chances would seem vanish-
ingly small to find repetitions of such patterns in random associations of
background objects. In the present case, however, there is even more
evidence for association in the fact that both members of the major pair
at z = .60 are strong radio sources. The central galaxies are both NVSS
radio sources and the the two quasars are each double radio sources.
The latter is quite unusual and represents additional evidence against
accidental association.
It should be noted that the central galaxies here are low redshift so that
only small corrections to their rest frames are needed. But in cases where
the ejecting galaxy has appreciable redshift it is critical to correct the
observed redshifts. Failure to do this has led to some well publicized
claims of non-quantization of quasar redshifts. There is now available,
however, a computer program by Christopher Fulton which plots on the
surveyed sky regions, quasars in specified redshift intervals. The few sam-
ples presented in this Catalogue indicate that the surveys contain a rich

75
harvest of associations with the potential of yielding data on the associa-
tions the nature of the redshifts.
Needed
Spectroscopy and imaging of the Mrk object which is involved in the dis-
turbed spiral arm of NGC 3023.

76
ESO 567-33 10h 15m 47.1s –21d 44m 10s
B = 13.24 V = 12.50 mag. Elongated gal with minor axis pointing NW-SE very bright stellar nucleus
QSO (HE 1013-2136)
B = 16.9 mag. z = .785 long curved filament extending from QSO (see fig.)
This morphologically unusual, bright quasar is roughly along the minor
axis direction from a nearby bright galaxy. Much more widely separated,
but still along this line are a pair of quasars with closely matching red-
shifts.

77
Al ign ed QS O’s
z = 1.53 QSO O = 18.1 CTS J03.17
z = 1.55 QSO O = 20.9 MC1019-227
Of In t er es t
z = 2.47 QSO R = 17.4 CTS J03.14
z = 2.545 QSO R = 16.7 CTS J03.13
z = ------ GCl m = 17.4 Abell 3441
Needed
1) Spectra and images of ESO galaxy
2) Redshift of Abell Cluster

78
MCG+ 01-27-016 10h 33m 28.1s + 07d 08m 05s
m = 15.2 z = .044 IRAS source (double galaxy in a small group aligned NE)
A supposed gravitational lens of z = .599 has a z = 1.535 image only
1.56 arcsec away. The MCG galaxy is 3.6 arcmin distant and is an IR
source. Other objects are aligned on either side of this apparently active
galaxy, including radio sources (the lens also). Note that in the reference
frame of the z = .60 object the z = 1.535 quasar would represent an
emitted object of z = .585, both being close to the z = .6 quantized red-
shift peak.
Al ign ed Obj ect s
z = .599 lens V = -- EQ 1030+ 074
z = 1.535 compn V = --
z = .-- gal m = -- NPMIG gal
z = .-- rad 87GB rad source
z = .-- rad 87GB rad source
z = .-- EUV m = -- EUV emission
Needed
Deep images and spectra of objects in alignment.

79

80
MCG-02-27-009 10h 35m 27.3s –14d 07m 47s
m = 14 z = .0151 SBb, IRAS Source, Sey 2
NEARBY BRIGHT QUASAR z = .086 QSO v = 13.86 HE 1029-1401
In 1991 a quasar was discovered at V = 13.86 mag. which was “among
the three brightest quasars in the sky” (A & A 247, L17). Inspection of the
region reveals a 14th mag. Seyfert galaxy 52 arcmin away with some in-
dication of alignment of objects back toward the Seyfert. There is a group
of X-ray sources around the very bright quasar. There are also some
fainter galaxies of the same redshift which form a group or cluster around
it. Recent measures of the 1REX source (radio emitting X-ray source) show
that it is a BL Lac type object at z = .367. The z = .367 BL Lac and the
z = .393 quasar fall accurately aligned across the bright, z = .086 qua-
sar. The latter redshifts, in the reference frame of the bright z = .086 qua-
sar, would fall closer to the Karlsson, preferred redshift peaks.
Note: In the following Fig. 2 the original map of this field is shown. At that
point it looked as if all the quasars originated from the z = .016 Seyfert,
But when the southernmost X-ray source was measured it turned out to
have a z = .367 (ApJ 556, 181, 2002). This clearly changed the interpre-
tation to a pair of quasars in a secondary ejection across the bright QSO
as shown in Fig. 1. The redshifts in this pair then came closer to the ex-
pected periodicity as well. The point in showing the development in this
particular case is that sometimes just one single measure of an object in
some of the fields can strongly reinforce the association and/or clarify the
interpretation.
Additional comments can be made that in the reference frame of the
z = .016 Seyfert, the (presumably) ejected bright quasar has a z = .069.
This is close to the lowest quasar quantization of z = .062. It is similar to
the famous case of NGC 4319/Mrk 205 where the latter QSO/AGN has
z = .070. Mrk 205 has ejected quasars of z = .46 and .64. We might also
note that z = .06 to .07 is a frequent redshift of X-ray galaxy clusters and
galaxies in lines such as from M 101 and other cases in this Catalogue.
Finally, as to the question of a quasar ejecting other quasars instead of
active galaxies ejecting quasars, the definition that separates a “quasar”
and an “AGN” at –23 mag. has no operational meaning because it is

81
based on an assumption about redshift distances. Spectral character-
isitics are continuous. Moreover an object which varies above and below
the arbitrary luminosity cannot change discontinuously from one kind to
another.
Fig. 1

82
Al ign ed Obj ect s
z = 1.039 Blazar R = 18.4 TEX 1029-137
z = .393 QSO V = 18.3 RXJ102938-134620
z = .367 BLLac B = 20.2 1REX J103335-1436.4
z = .652 QSO O = 17.2 HE 1031-1457
z = .-- GRB GRB 4B950226
z = .-- BSO R = 19.1 1H 1032-14.2
Needed
Spectrum of X-ray BSO, optical identification of X-ray sources, checking of
UV sources in the area.
Fig. 2


84
NGC 3312 10h 37m 02.7s –27d 33m 54s
BT = 13.96 z = .0086 Sab, LINER, AGN, Sey3, IRAS, disturbed morphology
NGC 3312 is the nearest candidate for the dominant galaxy in the fa-
mous Hydra Cluster of Galaxies (ACO 1060). The center of the cluster lies
about 5 arcmin NW, is very dense and a strong X-ray emitter. The plot
shown here has radius of only 10 arcmin. The brighter galaxies listed in
Simbad are shown with their redshifts noted where known. Some galaxies
of roughly the cluster redshift extend to the SW, reinforcing the impression
that NGC 3312 is the center of a cluster whose redshifts range from
z = .009 to .019.
The fainter cluster members are close enough in redshift to qualify con-
ventionally as physical companions to the central galaxy. But in every
case in the Figure they are from slightly to about 3,000 km/sec larger. This
is another demonstration of the excess redshifts of companions in groups
which has been reported extensively over the years (ApJ 430,74, 1994;
ApJ 496,661, 1998). I cite this here as an example of a rich galaxy cluster
showing the same effect. It is a prediction of this Catalogue that when
more rich clusters are studied in a redshift-apparent magnitude diagram,
they will systematically demonstrate this intrinsic redshift effect. (Note:
There are now many more redshifts known in this cluster. A few are near or
slightly less than the redshift of NGC 3312, but most are higher.)
There is a strong pair of radio sources across NGC 3312 and also a strong
pair of infrared sources, both roughly within the frame we have shown
here. A little more than 10 arcmin SSE of NGC 3312 is a spectacular pair
of overlapping spirals (NGC 3314 A and B) with redshifts of 2,872 and
4,426 km/sec. Such differences in redshift for apparently interacting ob-
jects are reminiscent of Stephan’s Quintet. Perhaps the same explanation
obtains here—that they are of different ages but were ejected along the
same path from the Sab NGC 3312 (this origin was suggested for the
NGC 7331(Sb) in the Quintet).
I also note that within the large extent of the Hydra Cluster (over a de-
gree) there are some subclusters which form a tight line of higher redshift
galaxies. (Information courtesy of Daniel Christlein.)

85
Needed
Studies of more clusters around dominant galaxies.
I am grateful to Alberto Bolognesi for calling my attention to this associa-
tion.

86
NGC 3593 11h 14m 37.1s + 12d 49m 03s
BT = 11.7 z = .0021 Sa pec (peculiar absorption), IRAS, radio and X-ray source, Liner/HII
This large, bright spiral is nearly edge on and has a cluster of galaxies
(ACO 1209) extending from its projected edge northward along its minor
axis. There is a radio source reported between the cluster and the galaxy.
The absorption is so peculiar, cutting sharply through the northern half of
the galaxy, that one might consider the possibility of dust from the cluster
obscuring part of the galaxy. Intriguingly, there are also two EXSS (ex-
tended X-ray sources) to the SW. Such sources often turn out to be faint X-
ray galaxy clusters.
Less than 40 arcmin, also due north, are four quasars ranging from
z = 2.14 to 2.49. They are part of a Weedman, CFHT objective prism field,
but represent about an 8 times increase in average density (even though
that survey’s average density includes some fields centered on active
galaxies and some low density fields discarded from the average).
Al ign ed Obj ect s
z = .-- Cl m10 = 17.2 ACO 1209
z = .-- extend X-ray EXSS 1111.2+ 1303
z = .-- extend X-ray EXSS 1110.8+ 1253
z = 2.14 QSO’s Weedman objective
to 2.49 prism field
Needed
Deep images of exterior of NGC 3593, A 1209 and EXSS’s. Redshifts of clus-
ter galaxies.

87

88
UGC 6312 11h 18m 00s + 07d 50m 41s
m = 14.68 z = .021 SBa, peculiar spectrum minor axis p.a. = 135 deg.
The most interesting object in this field is a supposed gravitationally
lensed object with components ranging from z = 1.718 to 1.728. This
group of quasars, however, is located only about 6 arcmin away from a
14.7 mag. UGC galaxy. About 7 arcmin on the other side of the UGC
galaxy is a strong X-ray (1WGA) quasar of z = .70. After this initial pattern
was noticed, additional quasars were discovered, paired at about 8 and
9 arc minutes each across UGC 6312 and having very similar redshifts of
z = .81 and .85.
The supposed lensing galaxy, m = 19.0, z = .31, is in a group of galaxies
which forms perhaps the original pair with the z = .70 quasar across UGC
6312.
Al ign ed Obj ect s
z = .698 S1/QSO V = 21.5 1WGA
z = 1.728 QSO V = 16.22 PG A(grav lens?)
z = 1.722 QSO V = 17.6 PG C(grav lens?)
z = 1.722 QSO V = 18.1 PG B(grav lens?)
z = 1.618 QSO R = 19.2 1WGA
z = .812 QSO R = 19.8 1WGA
z = .847 AGN/QSO R = 20.7 1WGA
z = .-- galaxy m = -- IR source
z = .31 G m = 18.96 YDG81
Needed
Better spectra of UGC 6312, IR galaxy, deep images and identification of
further X-ray sources.

89

90
NGC 3865 11h 44m 52s –09d 14m 01s
B0 = 12.3 z = .018 disturbed morphology
A very high redshift QSO (z = 4.15) lies about 1.5 deg. NNE of the bright,
disturbed NGC 3865. Very closely along this same line is a binary quasar
from a bright radio survey with z = 1.342 and 1.345. Also along this line is
the galaxy cluster A 1375. About the same distance on the other side of
of NGC 3865 is the cluster A 1344 which has its 10th brightest galaxy at
exactly the same m10 = 16.6 mag. They form an obvious pair across the
NGC galaxy. Along the alignment on this same SSW side lie two strong,
survey X-ray sources. One can be identified with a bright, blue stellar ob-
ject, and the other with a medium bright, blue galaxy. A supercluster
(SCL, Einasto) lies slightly further along this line. Also, of the galaxies lying
along this line, two which have redshifts are plotted with z = .020 and
.022, implying physical association with the central NGC 3865. Bright
QSO’s (17.1 mag., z = .425, PKS, 16.2 mag., z = .554, and A 1348,
m10 = 17.0 mag.) lie SSW, out of the frame of the plot and may also be
associated.
The strongest support for the physical association of these different red-
shift objects comes from the PSPC observations of X-ray sources around
the NNE quasars which the accompanying plot shows are distributed in
an elongated pattern toward the proposed galaxy of origin.
Al ign ed Obj ect s
z = 4.15 QSO R = 18.6 BR 1144-0723
z = 1.342 bin QSO V = 18.7 PKS 1145-071
z = 1.345 bin QSO V = 18.7 PKS 1145-071
z = .-- ACO m10 = 16.6 A1375
z = .-- BSO V = 17.8 1RXS
z = .-- Bcg V = -- 1RXS
z = .076 ACO m10 = 16.6 A1344
Needed
1) Spectra of 1RXS candidates
2) Redshift of A1375 and deep images A1375 and A1344
3) Deep X-ray and optical images of objects along line
4) Redshifts of more galaxies along line (and in field).

91
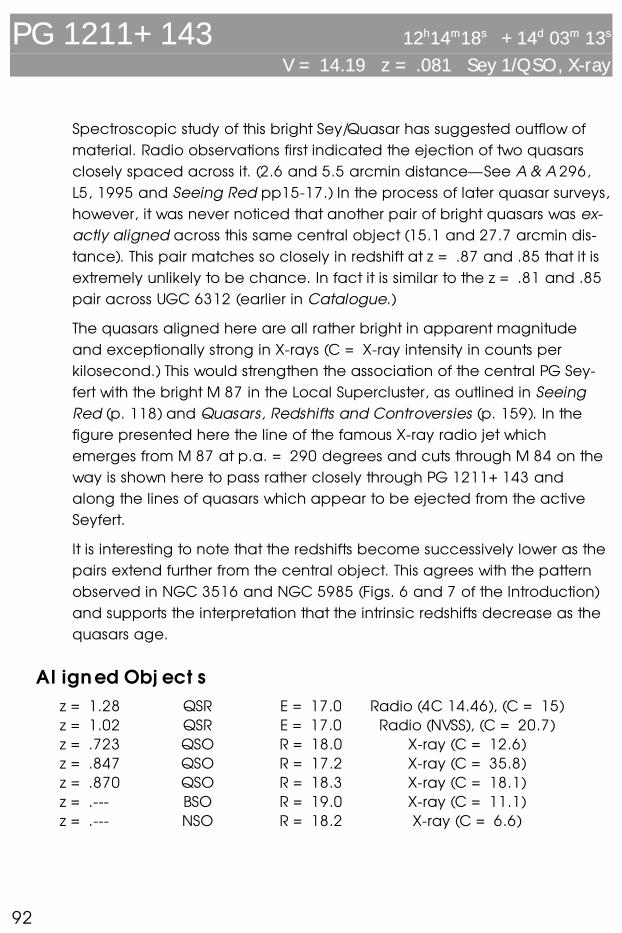
92
PG 1211+ 143 12h14m18s + 14d 03m 13s
V = 14.19 z = .081 Sey 1/QSO, X-ray
Spectroscopic study of this bright Sey/Quasar has suggested outflow of
material. Radio observations first indicated the ejection of two quasars
closely spaced across it. (2.6 and 5.5 arcmin distance—See A & A 296,
L5, 1995 and Seeing Red pp15-17.) In the process of later quasar surveys,
however, it was never noticed that another pair of bright quasars was ex-
actly aligned across this same central object (15.1 and 27.7 arcmin dis-
tance). This pair matches so closely in redshift at z = .87 and .85 that it is
extremely unlikely to be chance. In fact it is similar to the z = .81 and .85
pair across UGC 6312 (earlier in Catalogue.)
The quasars aligned here are all rather bright in apparent magnitude
and exceptionally strong in X-rays (C = X-ray intensity in counts per
kilosecond.) This would strengthen the association of the central PG Sey-
fert with the bright M 87 in the Local Supercluster, as outlined in Seeing
Red (p. 118) and Quasars, Redshifts and Controversies (p. 159). In the
figure presented here the line of the famous X-ray radio jet which
emerges from M 87 at p.a. = 290 degrees and cuts through M 84 on the
way is shown here to pass rather closely through PG 1211+ 143 and
along the lines of quasars which appear to be ejected from the active
Seyfert.
It is interesting to note that the redshifts become successively lower as the
pairs extend further from the central object. This agrees with the pattern
observed in NGC 3516 and NGC 5985 (Figs. 6 and 7 of the Introduction)
and supports the interpretation that the intrinsic redshifts decrease as the
quasars age.
Al ign ed Obj ect s
z = 1.28 QSR E = 17.0 Radio (4C 14.46), (C = 15)
z = 1.02 QSR E = 17.0 Radio (NVSS), (C = 20.7)
z = .723 QSO R = 18.0 X-ray (C = 12.6)
z = .847 QSO R = 17.2 X-ray (C = 35.8)
z = .870 QSO R = 18.3 X-ray (C = 18.1)
z = .--- BSO R = 19.0 X-ray (C = 11.1)
z = .--- NSO R = 18.2 X-ray (C = 6.6)

93
Needed
The Blue Stellar Object (BSO) and Neutral Stellar Object (NSO) are in the line
of the z = 1.28 and 1.02 quasars and require spectra. Their positions are:
12h15m01.82s + 14d01m13.0s and 12h13m27.7s + 14d04m 38.9s. The X-ray
flash in the figure represents a highly probable event (Gotthelf et al., ApJ
466,729, 1996). No optical identification was made, but the position is not
highly accurate.
Note: A recent XMM measure (Pounds et al. astro-ph 03036030) shows gas
being expelled from the central AGN with velocities of .08 to .10 c. But this
just about the ejection velocity (+ .08, –.05 c) measured for the pair of qua-
sars at z = 1.28 and 1.02. This would seem direct and quantitative evi-
dence that these quasars originated in the observed ejection.

94
NGC 4410 12h26m28.3s + 09d01m 08.7s
m = 13.6 z = .025 Sab interacting with Mrk 1325, Sey 3, as a double nucleus
This very disturbed pair of interacting galaxies—one of which is a Mark-
arian object with compact nucleus—has seven bright quasars within 60
arcmin radius. The closest pair is exactly aligned across the central ob-
ject and the next closest pair is aligned within 30 deg.
Al ign ed obj ect s
z = .731 d = 17.5’ m = 18.73 z0 = .689 mean z0 = .594
z = .535 d = 23.6 m = 17.87 z0 = .498
z = 1.456 d = 25.4’ m = 18.37 z0 = 1.397 mean z0 = 1.404
z = 1.471 d = 48.9 m = 17.83 z0 = 1.411
When corrected to the central galaxy (z0), one quasar in each pair should
have a component of ejection velocity toward, and the other an equal
velocity away, from the observer. Then the mean of these two redshifts
should represent the intrinsic redshift of the ejected quasar. It is seen
above that intrinsic redshift is only –.006 away from a Karlsson peak in
both cases! If the test of a physical law is to make numerically accurate
predictions then the quantization low of quasar redshifts has just passed
an especially crucial test.
Additionally, there is a bright quasar of z = .681 exactly on the same line
but further away than the z = 1.456 quasar. It would have a corrected
redshift of z0 = .64.
The NGC 4410 association is a Bonanza in other respects as well. For one,
in the closer regions recent Chandra images (Nowak, Smith, Doanahue
and Stocke, 2003) have shown that there is a “possible population of ULX
sources” (Ultra Luminous X-ray Sources). One is associated with a radio
point source and the “brightest ULX may also be associated with radio
emission.” This would fit perfectly the assignment of ULX’s to early stages
of ejected quasars where the strong X-ray, radio emission characteristics
of BL Lac objects are most prevalent (Burbidge, Burbidge and Arp 2003,
A&A 400, L17).

95
NGC 4410 is projected near the center of the Virgo Cluster but at
cz = 7400 km/sec would be conventionally considered a backgound
object. However, it appears associated with a large galaxy cluster, Abell
1541 at z = .09, which has been shown to be extended in X-rays away
from the putative center of the Virgo Cluster, Messier 49. Along this same
line from the active M 49 are a cone of bright quasars which pass over
the region of NGC 4410 (Seeing Red, Apeiron, 1988, pp. 121 & 142).
There is a line of galaxies and some X-ray sources passing nearly NE-SW
through NGC 4410 and the region would be a challenging and reward-
ing study for more spectroscopic and imaging studies.

96
UM 602 13h 41m13.9s –00d 53m 15s
V = 17.9 mag. z = .236 Sey/QSO, 1RXS, First (radio source)
This field was located by means of the plotting program of Chris Fulton
where a string of quasars with 2.54 ≤ z ≤ 2.74 was evident at 13h41m–
00d45m. The Sey/QSO was identified at the center of the field and a 40
arcmin radius was searched in NED for quasars with z ≥ 2.5. Six 2dF qua-
sars were found and they are plotted and labeled in Fig. 1.
It is seen that the closest pair across the active central objects has
∆z = + .04 and –.10. The second closest pair has ∆z = + .05 and –.10.
Overall there are six quasars running NE to SW through UM 602 which fall
close to the z = 2.64 quantization value (with accidental probabilities
ranging from 0.28 to .10.)
Now, however, a very disturbing point arises. If these high redshift quasars
are really associated with the central UM 602, their redshifts must be
transformed to its z = .236 rest frame. That surely must destroy the coinci-
dence with the z = 2.64 quantization value. Gritting our teeth we make
the transformation, and lo and behold, we calculate z = 1.92, 1.99, 2.02
1.86, 2.01 and 1.86. The mean of these redshifts is z = 1.94! The most
conspicuous and first discovered redshift peak for bright quasars is 1.96
(originally discovered as 1.95).
One interesting implication is that if the z = 2.64 quasars evolve a step
down to z = 1.96, then UM 602 should step down to near z = 0. There are
other lower redshift galaxies in the field, but their connection to UM 602
would be a subject for further investigation.

97

98
Mrk 463 13h 56m 02.8s 18d 22m 17s
m = 14.8 z = .050
Only X-ray sources are plotted in this radius = 40 arc min plot. As has
been noted, Markarian galaxies tend to have numerous X-ray sources
nearby which are often elongated in their distribution. In this case there is
an elongation of sources to the SW, in the same direction as the optical
streamer emerging from this disturbed system. Further along this line is a
fairly bright quasar at V = 18.0 mag. and z = .977. Finally at the end of
the line is a good optical candiate for an X-ray QSO at R, B = 18.8, 19.0
mag. The X-ray source just to the NE of the latter seems to have no opti-
cal I.D.
Al ign ed Obj ect s
z = .977 QSO V = 18.0 PB 4145
z = 1.196 gal R = 21.6 RX J135529.59+ 182413.6
z = .152 QSO V = 15.71 J135435.6+ 180518
z = .217 emgal V = 18.15 1 SAX J13539+ 1820
Needed
Deeper images of central galaxy. Further optical identification of objects
SW of Mrk 463 and along the line.

99

100
Mrk 478 14h 42m 07.5s 35d 26m 23s
m = 14.58 z = .077 QSO/Sey1n, Radio, X-ray, Infrared
Mrk 478 is very similar to PG 1211+ 143 (discussed earlier) in having ex-
ceptionally strong soft X-ray excess and an abundance of observations
and analyses in various wavelengths. Like many other Markarian galaxies
it shows lines of X-ray objects emanating from it. The circled crosses in Fig.
2 are predominantly survey (1RXS) sources, and therefore very bright X-
ray sources. The blue stellar objects identified with these sources are also
relatively bright, and presumably will turn out to be rather bright apparent
magnitude quasars.
The innermost pair of candidates has the highest significance, as shown
in the High Resolution X-ray map of Fig. 1. Fig. 1 also shows four fainter
sources roughly orthogonal to the main pair, a characteristic seen in
other examples in this Catalogue. The SW identification in the main pair is
a blue galaxy, and possibly also a BSO aligned about p.a. = 52 deg. The
NE candidate in the pair is accurately aligned, and the two are nearly
equally spaced across the central Markarian galaxy.
Further along this direction Fig. 1 shows a remarkable X-ray cluster con-
taining several blue objects that are elongated accurately back toward
the Mrk object (p.a. = 46 deg.). I consider this strong support for the evi-
dence presented in Appendix B for the ejection origin of galaxy clusters.
Just to the E of this cluster are two more strong, bright quasar candidates
also aligned back toward Mrk 478. These (and other 1RXS, PCPS and HRI
X-ray candidates shown) remain to be investigated. Radio (NVSS) sources
seem aligned acrosss Mrk 478.
Al ign ed Obj ect s
z = .--- BGal V = 15.0 1RXS, ASCA
z = .--- BSO V = 16.7 close to above
z = .--- BSO V = 17.6 1RXS
z = .--- Gal V = --- Radio(FIRST) gal
z = .--- GalCL V = --- 1RXS Cluster, BSO’s
z = .--- BSO V = 18.3,18.7 1RXS,Two BSO’s
z = .--- CSO m = 17 Case Blue Object
Needed
Spectra of BSO’s, deep image of elongated cluster.
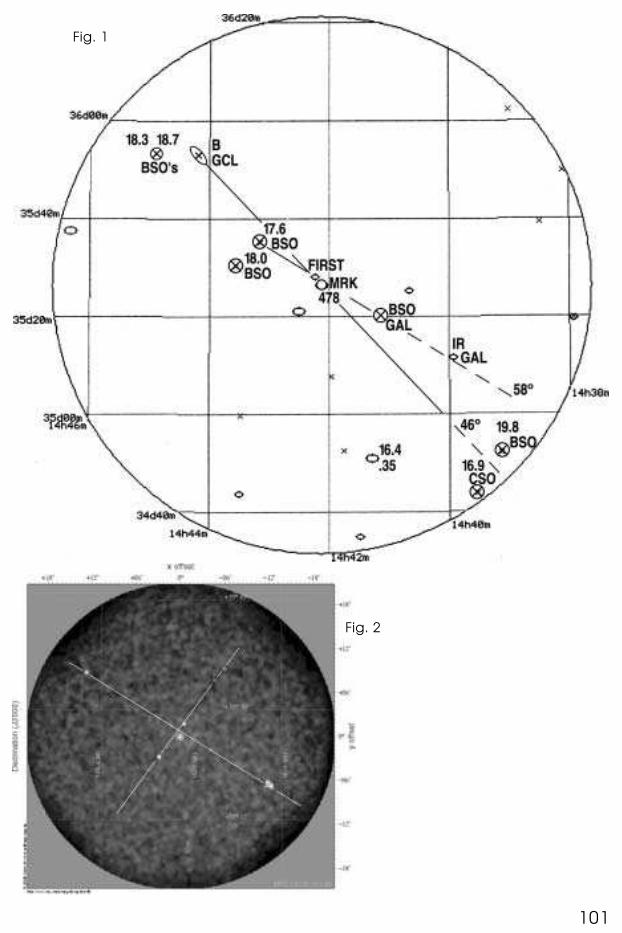
101
Fig. 1
Fig. 2
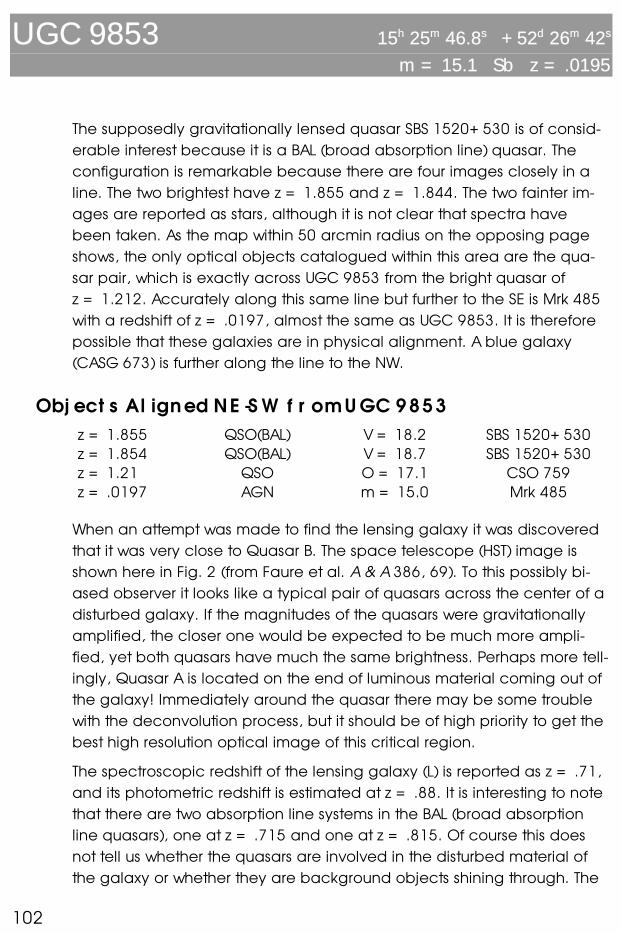
102
UGC 9853 15h 25m 46.8s + 52d 26m 42s
m = 15.1 Sb z = .0195
The supposedly gravitationally lensed quasar SBS 1520+ 530 is of consid-
erable interest because it is a BAL (broad absorption line) quasar. The
configuration is remarkable because there are four images closely in a
line. The two brightest have z = 1.855 and z = 1.844. The two fainter im-
ages are reported as stars, although it is not clear that spectra have
been taken. As the map within 50 arcmin radius on the opposing page
shows, the only optical objects catalogued within this area are the qua-
sar pair, which is exactly across UGC 9853 from the bright quasar of
z = 1.212. Accurately along this same line but further to the SE is Mrk 485
with a redshift of z = .0197, almost the same as UGC 9853. It is therefore
possible that these galaxies are in physical alignment. A blue galaxy
(CASG 673) is further along the line to the NW.
Obj ect s Al ign ed NE -S W f r om U GC 9 8 5 3
z = 1.855 QSO(BAL) V = 18.2 SBS 1520+ 530
z = 1.854 QSO(BAL) V = 18.7 SBS 1520+ 530
z = 1.21 QSO O = 17.1 CSO 759
z = .0197 AGN m = 15.0 Mrk 485
When an attempt was made to find the lensing galaxy it was discovered
that it was very close to Quasar B. The space telescope (HST) image is
shown here in Fig. 2 (from Faure et al. A & A 386, 69). To this possibly bi-
ased observer it looks like a typical pair of quasars across the center of a
disturbed galaxy. If the magnitudes of the quasars were gravitationally
amplified, the closer one would be expected to be much more ampli-
fied, yet both quasars have much the same brightness. Perhaps more tell-
ingly, Quasar A is located on the end of luminous material coming out of
the galaxy! Immediately around the quasar there may be some trouble
with the deconvolution process, but it should be of high priority to get the
best high resolution optical image of this critical region.
The spectroscopic redshift of the lensing galaxy (L) is reported as z = .71,
and its photometric redshift is estimated at z = .88. It is interesting to note
that there are two absorption line systems in the BAL (broad absorption
line quasars), one at z = .715 and one at z = .815. Of course this does
not tell us whether the quasars are involved in the disturbed material of
the galaxy or whether they are background objects shining through. The

103
BAL absorption shortward of C IV probably tells us more about material of
intermediate redshift in the lensing galaxy.
UGC 9853 is our proposed origin of both the z = .715 galaxy and its
z = 1.855 quasars. About 2 arcmin north, along its minor axis, it has an
apparent cluster of galaxies containing some blue objects. Some brighter
blue objects trail away from UGC 9853 to the SE, but any moderately
bright AGN’s should have been detected by the objective prism, Second
Byurakan Survey (SBS).
Needed
Deep optical images around UGC 9853, X-ray images of the fields sur-
rounding the components of the association, maximally deconvolved im-
ages of quasar pair and the apparently interacting galaxy.
Fig. 1

104
Fig. 2


106
MCG+ 08-29-005 15h 42m 18s + 48d 12m 56s
m = 15.7 z = --- compact gal
There are two very bright quasars within the pictured field of 60 arcmin
radius. The next brightest in the field is R = 18.55 at z = 3.155 and it is
close to the bright, active PG quasar with z = .77. The only candidate for
the origin of the brightest pair is the compact galaxy MCG+ 08-29-005,
which is of unknown redshift and spectral characteristics. The z = .400
quasar has a number of z = .075 galaxies close around it and a line of X-
ray sources across it.
As indicated in the figure, the MCG galaxy is located between MCG gal-
axies to the N and a ZW Cluster and UGC galaxy to the S. It would be in-
teresting to have their redshifts. It is also interesting to note that there are
five high redshift quasars just to the east of the z = .772 PG object, found
in the small area, Palomar Grism Survey (1999, AJ 117, 40). They are very
bright for their redshift, especially the one at z = 3.115. This group is not
plotted in the Figure because of the narrow, 8.5 arcmin, strip surveyed.
Al ign ed Obj ect s
z = .400 S1/QSO V = 16.65 PG 1543+ 489, 1RX
z = .772 S1/QSO V = 15.81 PG 1538+ 477 rad, X-ray
Obj ect s of In t er es t
z = 3.155 QSO R = 18.55 Q 1539+ 4746
plus slightly fainter, high redshift QSO’s near the above
Needed
Spectra of the central and adjoining galaxies.

107

108
NGC 6140 16h 20m 57.5s + 65d 23m 24s
m = 12.6 SBc z = .0026 IRAS source semi-circled by radio sources
Fig.1: Extension of the line through Mrk 876 leads to a cluster centered on
3C 330. Roughly across 3C 330 are a pair of unusual, clustered objects
at z = .63 and .65. X-ray sources in this area are all extended, suggesting
their identity as further clusters. Note the Gamma Ray Burster farther out
along the line. (Only brightest and most active objects plotted.) Fig.2:
PSPC X-ray sources join Mrk 876 with z = .65 cluster and 3C 330 (two
crosses to upper right). Fig.3: Radio overlay of HST optical image shows
luminous extensions either side of z = .63 galaxy, one of which connects
to luminous arc with z = 1.39 (from Jackson et al. A & A 334, L33).
Fig. 1

109
Needed
Investigation of numerous additional extended X- ray sources in region.
Fig. 2

110
Note: Luminous arcs are conventionally attributed to degenerate Einstein
rings in gravitational lensing. But in Fig. 3 the image obtained with the
Hubble Space Telescope (grey scale) shows luminous extensions coming
out radially on either side of the central z = .63 galaxy. This is the classic
ejection pattern (e.g., the optical jets emerging from NGC 1097, as in
Plate 2-7 of Seeing Red). The optical extensions include radio sources on
either side of the central galaxy and the extension to the ENE ends on a
luminous arc with a redshift of z = 1.394. This lensed “galaxy” is reported
to have an A star spectrum and a very high luminosity. This is an unlikely
combination. But, in addition, as in many arcs interpreted as lensed
background galaxies, the nucleus of the supposed lensed galaxy is at
one or both ends of the arc. Another way of putting it is that the brightest
part of the galaxy, the nucleus, has somehow gotten lost in the lensing!
For more on gravitational lenses see Seeing Red (p. 173 ff.).
Fig. 3


112
NGC 6257 16h 56m 03.6s + 39d 38m 43s
mpg = 15.5 mag. z = .016 (em lines in red) Galaxy is IRAS source
Al ign ed AGN ’s
z = .033 BL LAC V = 13.78 Mrk 501
z = .034 Sey 2 V = 17.7
Of In t er es t
z = 1.75 QSO V = 18.3
z = .692 QSO V = 20.5
z = .340 QSO V = 19.2
z = .579 QSO V = 17.9
z = .151 ACO 2235 m = 17.1
There is a tight cluster of X-ray sources around the famous Mrk 501 (≤ 15
arcmin, Fig. 2). There are strings and lines of sources, one of which ex-
tends toward Abell 2235. Such X-ray associations seem to be characteris-
tic of Markarian objects.
Note: Similarity of these AGN redshifts to Mrk objects aligned through
M 101 (Mrk 273, 231, 66, 477 and 474 at z = .038, .041, .035, .038, .041).
See Part B.
When this field was first investigated little was known about the central
galaxy. But just as the present Catalogue was being submitted for publi-
cation, E. M. Burbidge abtained a spectrum of it. It showed emission lines
in the red at z = .016. (An apparent broad blue line at 4000 A is not iden-
tified.) It is intriguing to note that when the two AGN’s are now transformed
to the rest frame of the central galaxy they turn out to have z = .017. This
is the ubiquitous 5,000 km/sec redshift found all over the sky and particu-
larly in the Perseus-Pisces filament.
Even though the spectrum needs further investigation, this is again an ex-
ample of how one additional measurement in a field like this can add
immeasurably to the interest and value of the association.

113
Needed
1) Images of NGC galaxy
2) Spectra of X-ray sources near Mrk 501
3) Images and spectra in Abell Cluster
Fig. 1
Fig. 2

114
Mrk 892 17h 06m 15.7 s + 60d 42m 18s
m = 15.7 stellar nuc. z = .012
Fig. 1: Five NGC galaxies are within 31 arcmin of this Markarian galaxy,
plus quasars of z = 1.14, 1.36, 1.42, 1.47, 1.54, and 3.23. Fig. 2: Inside a
radius of only 10 arcmin appears a line of objects, higher redshift than
Mrk 892, leading to the strong radio radio quasar 3C 351, which is em-
bedded in a cluster of objects near its own redshift of z = .37. There is a
line of X-ray sources leading W from Mrk 892 into the 3C 351 cluster.
There are also apparent clumpings of lower redshift galaxies within this
concentration. Note the BL Lac object at z = .280 and the AGN on the
other side of the cluster at z = .284.
Fig. 1

115
Obj ect s of Maj or In t er es t
z = .012 AGN m = 15.7 Mrk 892
z = .372 QSR V = 15.3 3C 351
z = .280 BL Lac V = 19.4 X-ray
z = .080 AGN V = 17.7 X-ray
z = .284 AGN V = 18.9 X-ray
Needed
Identification of additional, numerous X-ray sources in the field. Systematic
spectra of galaxies as a function of apparent magnitude. Plots of all galax-
ies within certain redshift ranges.
Fig. 2

116
NGC 6965 20h 47m 34.1s + 00d 24m 41s
V = 12.8 mag. z = .0122 Seyfert 2, IRAS source
One of the close pairs of X-ray clusters in NORAS (Northern ROSAT all sky
survey, ApJS 129,435) is shown here at z = .32 and .33. In looking for a
possible origin of this pair we find a very compact cluster of NGC galax-
ies about 1.5 degrees away. One of the brighter members of this group is
NGC 6965, an active Seyfert 2 Galaxy. In the neighborhood of the two
RXC clusters are found quasars of z = 3.80, 3.21, 1.40 and an AGN of
z = .06. All of these were discovered in an emission line survey by Peim-
bert and Costero.
Roughly the same distance on the other side of the NGC galaxies is a
group of quasars and AGN’s ranging from z = 2.78 to .14. They are mostly
from samples of Anderson and Margon plus radio objects. Aside from
these compact pairings of unusually compact groups of quasars across
the NGC Seyert, the numerical values of the redshifts are intriguing. The
Karlsson values of z = .30, .60, 1.41, 1.96 , 2.64 and 3.48 are noticeable,
particularly when small corrections are made into the rest frames of the
probable parent galaxies.
P air of X-r ay Cl us t er s
z = .333 X-ray cluster m = --- RXC J2050.7+ 0123
z = .321 X-ray cluster m = --- RXC J2051.1+ 0216
Al ign ed H igh R eds h if t Obj ect s
z = 3.799 QSO m = 19.7
z = 3.214 QSO m = 20.7
z = 1.397 QSO m = 18.5
z = .060 AGN m = 21.2
z = 2.783 QSO V = 19.1 2038-012
z = 2.260 QSO V = 20.4
z = 2.3 QSO V = 19.9
z = 2.100 QSO m = --- X-ray quasar
z = .609 QSO V = 18.39 MS 20373-0035
z = .142 S1 V = 18.60 MS 20395-0107
Needed
Spectra of objects along the line between the two high redshift groups.
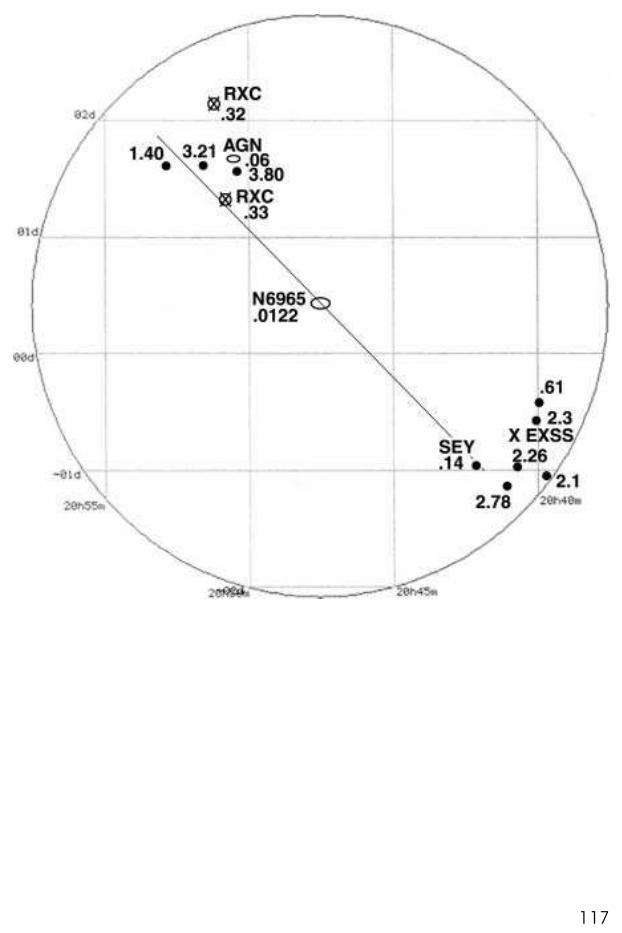
117

118
MCG-04-51-007 21h 39m 59.3s –22d 41m 32s
(AM 2137-225) m = 15.0 z = .030
also MS 2137.3-2353
Fig.1: At about the center of this elongated cluster lies this moderately
bright z = .030 galaxy. A line of fainter galaxies extends NW from it with
redshifts z = .031 to .036. The cluster AS 963 (Abell southern extension) in-
cludes NGC 7103, N7104 and two IC galaxies (redshifts unknown). An-
other cluster, S85 426 (Shectman) lies a little further out.
Fig.2: In the opposite direction A 2357 lies along the line with z = .123.
Note the galaxy further out along this line with z = .125. Note also the
three galaxies with z = .055 to .057. There are many PHL BSO candidates
in the area. The shaded area represents the region which is confused by
the globular cluster NGC 7099.
Obj ect s of Maj or In t er es t
z = .646 QSO V = 17.0 X-ray
z = .313 ClGal V = 18.5 X-ray
z = .123 ClGal m = 17.0 A 2357
z = .81 RadGal m = -- Radio
z = .033 ClGal m = -- AS 963
z = .-- ClGal V = -- S85 426
Needed
Redshifts of galaxies SW of MCG-04-51-007, redshifts within, and deep im-
ages of clusters.

119
Fig. 1

120
A Gr avit at ion al L en s ?
About 43’ S of the z = .030 central galaxy in Fig. 2 is a very strong X-ray
cluster of galaxies at z = .313. Fig. 3 here shows the Hubble Space Tele-
scope image of the central galaxy (Sand, Treu and Ellis 2002, ApJ 574,
L129). The picture features a supposed double gravitational arc just
above it and a supposed radial (!!) arc emerging from this active central
galaxy. It has been argued elsewhere (Seeing Red, Chap 7 and Fig. 7-
10) that so called gravitational arcs in galaxy clusters are actually due to
material ejected outwards meeting previously ejected shells. In this par-
ticular case of MS 2137.3-2353 the high resolution HST image in Fig. 3
confirms by simple inspection that the feature emerging directly toward
the tangential arc is a high surface brightness, linear jet. As for tangential
arcs, it has been obvious since the beginning of this subject that they
Fig. 2

121
show no nucleus—as they must show if they are the lensed images of a
background galaxy.
What is new in this MS object is that the arcs have been measured at
z = 1.501 and the jet at z = 1.502. Obviously this is the same material
ejected from the center of the active galaxy and not the fortuitous ar-
rangement of identical redshift background galaxies. As a finishing touch
we note a newly discovered quasar only about 11’ away with z = 4.93
(Fig. 2). Transformed to the rest frame of the central galaxy (which is al-
ready close to the quantized redshift peak of z = .30) this quasar then has
a redshift of z0 = 3.52. The quantized peak for the latter is zp = 3.48
where the adjoining peaks are at zp = 2.64 and 4.51.
Fig. 3

122
NGC 7107 21h 42m 26.6s –44d 47m 25s
BT = 12.93 SBc/Ir z = .007 IRAS source nucleus elongated SW-NE, comps in disk
Two very high redshift (and hence rare) QSO’s are closely aligned with,
and only 7.9 arcmin distant from the peculiar galaxy NGC 7107. A com-
panion-like object NW in the disk of the galaxy has exactly + 72 km/sec
relative redshift. Within 20 arcmin of NGC 7107 there are two quasars of
z = 1.64 and 2.38 to the NNE and four quasars of z = 1.39, 2.01, 2.21
and 2.16 to the SSW. The quasars were identified in UKSTU fields monitored
for variability.
Al ign ed Obj ect s
z = 3.06 QSO V = 20.2 Q2139-4504A
z = 3.25 QSO V = 20.3 Q2139-4504B
z = .16 GAL m = --
z = .00749 GAL m = --
Note: In a large region around here are numbers of bright NGC galaxies.
About 30 arcmin N of NGC 7107 lies the “Francis filament” of galaxies
with z = 2.38 and two quasars of z = 3.22 and 3.23. There are also
groups and filaments of galaxies from the Las Campanas redshift survey
and Abell 3800. The z = 2.38 objects are uncannily close in redshift to the
cluster of z = 2.38 QSO/AGN’s discovered by Windhorst and Keel (see ApJ
525, 594)
Needed
Deeper, higher resolution images of NGC 7107. More extensive study of
redshift content of filaments.

123

124
NGC 7131 21h 47m 36.2s –13d 10m 57s
m = 14 z = .018
The galaxy cluster Abell 2361 (extending into 2362 and 2360) is strikingly
elongated (see included Simbad map, Fig. 1). Following the direction of
the elongation leads to NGC 7131. This same direction leads to another
galaxy cluster, Abell 2400, exactly the same distance on the other side of
the central galaxy. It is also elongated along this same direction. There is
even a kink in the elongation which accurately matches the same fea-
ture in the NGC 2361 galaxy cluster. The whole configuration suggests a
schematic of rotating arms in a barred spiral. In this case, however, they
would be galaxy forming ejections instead of star forming ejections.
At the beginning of the kink in the A 2400 cluster there is a galaxy of
z = .018, establishing a link with NGC 7131. In the A 2361 elongated
complex, a sampling of galaxies shows z = .05 to .08, which is too much
spread in velocity for a stable cluster, particularly one of such non-
equilibrium shape.
The brightest galaxy in the field is NGC 7171 at B = 13.0, z = .009. There
is a O = 18.6, z = .73 quasar very near it. This galaxy could be the oldest
in the field, with NGC 7131 being the younger, more active source of
ejection. There is a PKS quasar with O = 19.5, z = 1.80 immediately to the
NE of N7131 on the path to A 2400.
See Appendix B at end, Ejection Fig. 14, for a different presentation of this
cluster configuration.
Obj ect s of Maj or In t er es t
z = .061 C(luster) m = 16.7 A 2361
z = .088 C m = 16.5 A 2400
z = .018 gal m = 14 NGC 7131
z = 1.80 QSR O = 19.5 near N7131
z = .009 SbI B = 13.0 NGC 7171
z = .73 QSO O = 18.6 near N7171
Needed
Systematic spectra of galaxies as a function of apparent magnitude. Plots
of all galaxies within certain redshift ranges should help clarify the relation
of the central galaxy to these two extremely elongated clusters.

125
Figures 1 and 2 show expanded plots of the clusters on either side of
NGC 7131. The galaxies are so dense that even on an expanded scale
some of the symbols do not plot completely. See Appendix B, Fig. 14 for
a representation of galaxy density which best shows the overall outline of
the clusters.
Fig. 1

126
A 2400
Fig. 2

127
A 2361
Fig. 3

128
NGC 7351 22h 41m 27.0s –04d 26m 41s
m = 13 spiral z = .003 On the end of a rich l ine of clusters, QSO’s and BSO’s.
The Abell Cluster 2464 has a surprisingly large redshift z = .56. Within it, a
proposed gravitational “arc” of z = 1.116 was discovered and later an
apparently associated “arc” of z = 1.334. The latter two objects would
seem more naturally ejected from cluster galaxy C, but the reader should
consult the images shown in A & A 290, L25, 1994.
The question asked here is whether there is any evidence for the ejection
of this unusual cluster from a nearby, low redshift object. The
accompanying map shows that the supposed lens indeed lies in a
narrow string of objects extending about 1.4 deg. to the NE of NGC 7351.
This line consists of radio sources and mostly associated clusters of gal-
axies and some BSO candidates for quasars.
Starting from the NW, there is a cluster of galaxies elongated along a line
at about p.a. 130 deg., or accurately back toward NGC 7351. Next there
is the survey X-ray source, 1RXS J223732.3-033805 which has been
measured by Y. Chu to be a quasar of z = .35. Then there is the survey X-
ray source 1RXS J223826.3-034356 which lies between 2 BSO’s of
R = 18.8 and 18.1 mag. The next galaxy inward on this line was meas-
ured to have a redshift z = .06. An unidentified emission line at about
8771 Angstroms was also present in this spectrum and needs to be con-
firmed and identified. Next comes the Abell cluster at z = .56 which is
supposed to be lensing the apparently connected higher redshift ob-
jects. A short distance SE of this cluster is a radio source which has ap-
parently been measured twice as PMN J2239-0402 and Cul 2236-042. It
lies close to two BSO’s of R = 18.2 and 18.9 mag. Next comes the radio
source 4C-04.85 which appears to be a Blue compact galaxy in a rich
cluster (Bcg). Finally near NGC 7351 is a PHL BSO (at 22/41/04.8, –
04/18/10) and another small elongated cluster. The latter, as well as other
clusters along this line, are visible on Digital Sky Survey (dss) downloads.
Needed
Verification of clusters along the line.
Redshifts and deep images.

129
Obj ect s Al ign ed NW -S E t ow ar d NGC 7 3 5 1
z = .-- RadCl m = --- PMN J2237-030
z = .35 QSO V = 16.3 1RXS
z = .-- BSO R = 18.8, 18.1 1RXS, 2 BSO’s?
z = .06 GAL m = 16: DBL z?
z = .56 C(luster) m = 17.8 A(bell) 2464
z = 1.12 grav. lens m = ? Cl 2236-04
z = .-- BSO R = 18.2, 18.9 PMN, CUL in Cl
z = .-- RadCl m = --- 4C-04.85
z = .024 GAL m = 14 NGC 7344
z = .-- BSO R = 16.8 PHL 372
z = .-- Cluster m = --- sm cl NNW of N7351

130
NGC 7378 22h 47m 47.7s –11d 48m 59s
m = 13 z = .0086 Seyfert 2
The BL Lac object shown in this figure was discovered as a hard ROSAT X-
ray source. The only bright, nearby galaxy is NGC 7378, which turns out
to be a Seyfert 2. Surprisingly, an almost equally active radio quasar of
z = .630 lies on a line back to NGC 7378 from the BL Lac. The latter qua-
sar is radio and X-ray bright and is highly polarized—all marks of a BL Lac
type object. The two aligned objects therefore show a similar type of ac-
tivity. (The apparent magnitude of the z = .226 BL Lac is uncertain, Sim-
bad listing it as 15.9 and NED as 20.0. The discrepancy may be caused
by an error or the nebulous character of the image or variability). There is
a PKS quasar S of NGC 7378 and an AGN to the W (z = .117 not shown)
which may also originate in the Seyfert 2 NGC galaxy.
Al ign ed Obj ect s
z = .226 BLLac m = ? RBS 1888
z = .630 QSO V = 16.45 rad, X-ray source
Of In t er es t
z = 1.892 QSR O = 19.1 J 224752.6-123720
Needed
Deeper, higher resolution images of central galaxy. More extensive search
for quasars in the field and objects along the line.
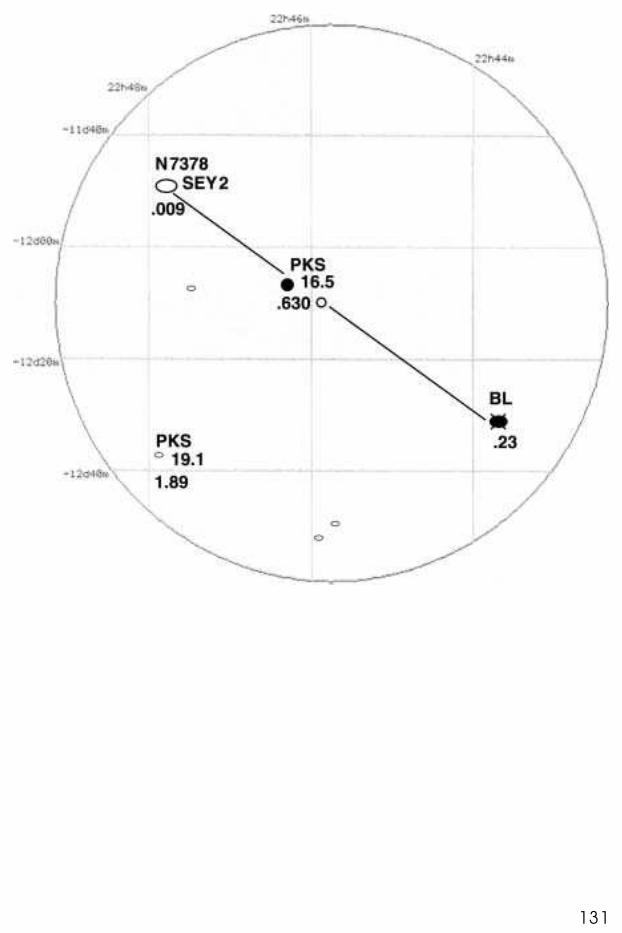
131

132
UGC 12346 23h 05m 12.6s 00d 50m 03s
m = 15.7 z = .025 Sc
A pair of Sloan Digital Survey (SDSS) quasars at z = 3.64 and 3.68 fall
quite close to each other in the sky. Well centered between them is a
UGC spiral of z = .025. Also striking is a z = 2.65 quasar, previously dis-
covered, which falls in the same alignment. Perhaps most interesting of all
are the redshifts of these three quasars. When transformed into the rest
frame of the central galaxy they come out z = 3.53, 2.56 and 3.57. The
quantized redshifts in this range are z = 3.48 and z = 2.64. In turn this
means the observed redshifts fall within cz = + .01c, –.02c and + .02c of
the predicted redshifts, implying quite small radial velocity components.
Note the two gamma ray bursters (GRB’s) apparently belonging to the as-
sociation.
Al ign ed Obj ect s
z = 3.64 QSO m = -- SDSS J230639.65+ 010855.2
z = 2.647 QSO V = 22.45 J230414.6+ 003739
z = 3.68 QSO m = -- SDSS J230323.77+ 001615.2
z = ---- BSO V = 16.6 X-ray source (see below)
z = ---- GRB m = -- GRB 991217, 230315+ 0015
z = ---- GRB m = -- GRB 00519, 230439+ 0110
Needed
Deeper images of central galaxy. More extensive search for quasars in the
field and objects along the line. An X-ray source between the z = 2.65 and
3.68 quasar is close (30 arcsec) from a BSO (R,B = 16.6, 16.6) at
23/03/41.2+ 00/27/09.4.

133

134
NGC 7507 23h 12m 07.5s –28d 32m 26s
BT = 11.43 mag. z = .005 S0, Arp/Madore 2309-284
The plotting program by Chris Fulton indicated a concentration of quasar
redshifts with Karlsson values at a position around 23h12m–28d10m. View-
ing these 2dF quasars as listed by Simbad shows the elongated grouping
of quasars pictured in here in Fig. 1. It is apparent that this rather dense
grouping forms a cone-like distribution having at its apex the very bright
NGC 7507 and the companion galaxies that make up its group
(Arp/Madore 2309-284). In Fig. 1 the observed redshifts are written next to
each quasar, filled circles for redshifts falling close to the ...30, .60, .96,
1.42, 1.96, 2.64, 3.48... quantized peaks and open circles for redshifts fal-
ling between these peaks. It is clear that the quasars stretching up and to
the NW from NGC 7507 are almost all near the quantized peak values.
(Since the galaxy of origin, NGC 7507, is such low redshift no correction
has been applied to the observed redshifts, i.e., z0 = z).
In order to make a pure test of the quantization in this 35 arcmin radius
region, without reference to the presumed galaxy of origin, the histogram
in Fig. 2 has been constructed. Each quasar redshift has been differ-
enced with its nearest quantized peak (∆z = zpeak – z0). This number is di-
vided by half the interval to the next nearest peak, yielding the probabil-
ity of a random point falling this close to the peak. If the redshifts are dis-
tributed randomly with respect to the peaks then we would expect a flat
distribution of points in Fig. 2. In fact there is a strong excess of redshift
values much closer to the peaks than would be expected by chance. A
simple estimate can be made that the uncorrelated points in Fig. 2 num-
ber 2 × 6 = 12 leaving 13 redshifts with Pav ≤ .25 in excess. The probability
is about Ptot = .5013 = 1.2x10⁻⁴.
As extreme as this result is, the actual association is even more significant
because it is possible to draw a cone shaped perimeter, with NGC 7507
at one end, which contains 15 quasars, only one of which does not fall
near a Karlsson peak. It seems that this would strongly support the ejec-
tion origin for the excess number of quasars from this very low redshift,
bright galaxy.

135
Fig. 1
Fig. 2

136
NGC 7541 23h 14m 43.9s + 04d 32m 03s
B = 12.45 ScII z = .009
This is a nearby star burst galaxy, surrounded by radio sources, with a
blue jet/arm which has an early type spectrum.
Fig. 2 shows a Palomar 200-inch photograph of NGC 7541 which is
aligned between two very strong radio sources (from Astrofiz ika 4, 59,
1968). The blue jet/arm is an important feature because it may represent
that brief period when the track of an ejected quasar is being turned into
a spiral arm by the rotation of the disk of the galaxy. The high surface
brightness, early spectrum of this feature would suggest intense recent
star formation along this ejection track.
The two very strong radio sources across NGC 7541 have been known
since 1968. Only recently, however, has the second one, 3C 458, been
measured to be a quasar at z = .29. As a consequence we now have a
close pair of strong radio quasars across the active galaxy seen in Fig. 1.
This almost exactly duplicates the configuration across Arp 227. (The latter
was discussed in the introductory section, Intro Fig. 1 and 3, and calcu-
lated to have a probability of accidental occurrence of 2 × 10⁻⁹.)
Fig. 3 shows a larger area around NGC 7541, where Abell galaxy clusters
are aligned in roughly the same direction as the 3C quasars. There is also
evidence for ejection of quasars perpendicular to this direction. (Note the
correspondence between quasar redshifts and Karlssson formula peaks,
z = .30, .60, .96, 1.41 and 1.96.)
Perhaps the most crucial result, however, is shown in the last map (Fig.4).
The Abell cluster 2552 is believed to be centered on an X-ray, radio AGN
of z = .30 (although there are some brighter galaxies at z = .13). But the
X-ray sources in this cluster, in the 1 RXH reduction, are distributed line-
arly and accurately back to NGC 7541!
In Appendix B also see Figs 3 and 4 and discussion therein.

137
Fig. 2
Fig. 3
Fig. 1

138
As nearly as can be determined a galaxy in this cluster, Abell 2552, was
measured at redshifts of z = .128 and.137 (Struble and Rood 1999). There
is a dominant X-ray galaxy at the center of the cluster, however, that
causes the cluster to be classified as a strong X-ray cluster at z = .300
(Böhringer et al. 2000; Ebeling et al. 2000). In the interim the z = .133
galaxy was reported as having a peculiar emission line spectrum, pecu-
liar morphology and judged too bright to be the dominant galaxy for the
surroundingcluster (Crawford et al. 1999)! What appears to this writer is
that active, and perhaps interacting, galaxies of much different redshift
have been ejected from the parent galaxy NGC 7541.
Cases of ejection of different redshift objects in the same line are preva-
lent—e.g., the PG 1244+ 026 example discussed in Appendix B, the
z = .008 and .81 objects only 2.4 arcsec apart in the line from NGC 5985
(A&A 341, L5), the z = .34 and .75 objects, which are separated by only
.25 arcsec in 3C 343.1 (Intro Fig. 11) and the various members of
Stephan’s Quintet associated with NGC 7331 (e.g., as revealed by vari-
ous observations discussed in Seeing Red). The cluster shown in Fig. 4
would seem like another elongated cluster composed of galaxies with
different redshifts pointing back to their active galaxy of origin.
Al ign ed S t r on g R adio Quas ar s
z = .22 QSR V = 16.7 3C459
z = .29 QSR m = 20.0 3C458
Out er Al ign men t s
z = 1.97 QSR V = 18.9 R(adio)
z = .62 QSO O = 19.0 R
z = .64 AGN R = 20.4
z = 1.05 QSO V = 15.8 R
z = .30 AGN m = ----- R + X (Cluster)
z = .13 ? C(luster) m = 18.0 A(bell) 2552
z = -- C m = 17.6 A 2545
z = -- C m = 17.6 A 2582
Needed
More data on galaxy jet/arm and clusters.

139
Fig. 4

140
Sey 23409-1511 23h 43m 28.5s –14d 55m 31s
r = 15.4 z = .137 Sey 1n, X-ray and EUV source
On the facing page, active and unusual objects are plotted in a field ra-
dius of 1.9 degrees around this active Seyfert/Quasar. There are a pair of
bright X-ray quasars diametrically across it at about 20’ and 40’ with
z = .72 and 1.35. There are also two BL Lac objects and a ULIRG to the
SE. A pair of Abell clusters brackets the Seyfert in approximately the same
direction.
A group of X-ray sources forms a rough arc between the Seyfert and Abell
2659 (small dots in the Figure). Near the center of these X-ray sources
some very red objects have been recorded by HST. The 12 X-ray sources
are from a ROSAT HRI exposure on the galactic variable R Aquarii. They
do not show on the PSPC image.
Al ign ed Obj ect s
z = .137 Sey r = 15.4 MS 23409-1511
z = .718 QSO r = 17.4 RXJ 23408-1426
z = 1.347 QSO r = 17.7 RXJ 23447-1500
z = .224 BL Lac V = 19.2 MS 2343-151
z = .-- BL,HP V = 19.22 MS 23427-1531
z = .241 ULIRG m = 19.26 IRAS F23451-1538
z = .-- GCl m10 = 17.6 Abell 2648
z = .-- GCl m10 = 17.0 Abell 2659
Needed
I.D. of X-ray sources near ACO 2659 and Sey.
Note: As discussed in the Introduction, quasars associated with galaxies
of appreciable redshift need to have their redshifts transformed into the
redshift frame of the parent galaxy. In the present case, (1 + .72)/
(1 + .14) = 1 + .51 and (1 + 1.35)/(1 + .14) = 1 + 1.06. The deviations
then from the quantized, intrinsic values of z = .60 and .96 are cz = –.06
and + .05. These values ostensibly represent the ejection velocities,
cz = –18,000 km/sec toward the observer and + 15,000 km/sec away
from the position of the central galaxy. It is very encouraging to note that
these are very close to the ejection velocities calculated from the best
pairs in the Introduction (section d, ejection velocities) which did not have

141
appreciable corrections for the redshift of the central galaxy. See also
quasars in NGC 622 field discussed earlier in the Catalogue.
These corrections should be made throughout the associations pictured
in this Catalogue. For example, in the pair across A 27.01 (ESO 359-G019)
the values come out ∆z = –.05 and + .11.

142
HCG 97 23h 47m 26s –02d 18m 36s
Hickson compact Group No. 97 consists of 5 galaxies of mixed type with
mags. B = 14.2 to 16.3 mag. The redshift of the brightest is z = .023. The
X-ray map here shows sources extending to the NE in the direction of PKS
2349-014, a very bright radio quasar (z = .17). The X-ray sources around
the quasar are conspicuously extended, closely along a line back to-
ward HCG 97. In exactly the opposite direction and distance from HCG
97 we find the very bright radio quasar PKS2340-036 (z = .896). Slightly
further along this line we find the linked, double galaxy Arp 295 with
z = .023.
Suggested interpretation: This group of IC galaxies was previously a lar-
ger, brighter galaxy which broke apart in the ejection of the higher red-
shift material. Some of the original material (z = .023) was carried along.
A number of z = .02 galaxies are in the vicinity—and HCG 97 (and asso-
ciated Shakbazian very compact objects) may have originally been part
of a chain including NGC 7738 and NGC 7739 (to the NNW, just out of
the frame).
To the SW is seen the edge of an Abell cluster ACO 2656 containing an
RXJ source at z = .079. Further to the SW in this direction is an IRAS galaxy
with z = .080 and 48 arc min SW of the cluster along the same line is a
1RXS source which is a 17.2 mag Seyfert 1 of z = .076. These are also
candidates for ejection from HCG 97, along with ACO 2644 to the NW at
z = .070, a cluster which also appears to have higher redshifts associated
with it.
Al ign ed S t r on g R adio Quas ar s
z = .174 QSR V = 15.33 PKS 2349-01
z = .896 QSR V = 16.02 PKS 2340-036
Out er Al ign men t s
z = .023 dbl gal m = 14.5 Arp 295
z = .993 QSO V = 16.91 UM 186
The quasar UM 186 at z = .993 is very near PKS 2349-01 and forms a simi-
lar redshift pair with PKS 2340-036 at z = .896. The mean is very close to
the redshift peak of z = .96.

143
P os s ibl e As s ociat ion
z = .079 C(luster) m = 16.2 A(bell) 2656
z = .070 C m = 16.6 A 2644
z = -- C m = 18.0 A 2631
The bright quasar PKS 2349-01 appears to be a very active object. UK
Schmidt objective prism and CFHT slitless spectrograph (or “grens”) identi-
fications in this area record at least 10 quasars from z = 3.0 to z = .45 dis-
tributed within 30 arcmin along an axis through it at about p.a. = 355
deg. This would be a rich field for further investigation.


145
Appendix A
The following two Appendices were originally written as Journal papers.
But when the Catalogue turned out to introduce so many associations of
different kinds of objects, it was felt that going into detail in some particu-
larly key cases could illustrate their possible relation to each other and
also give an example of the potential information contained in the Cata-
logue associations. The following advantages to presenting this material
together in book form were then envisaged:
1) A large amount of material bearing on the subject of associations of
different redshift objects could be published together instead of being
spread out through a voluminous literature, which is for the most part
based on antithetical assumptions.
2) The struggle to overcome inevitable resistance by referees and editors
could be avoided. The evidence could be presented uncensored
and discussed more frankly. Of course readers have to be their own
referees.
3) People who were interested in this particular kind of evidence could
obtain the book and use it as a condensed working reference.
4) A large enough body of data would be in one place so physical in-
terpretation could be attempted and relation to theory initiated.
5) Since the Catalogue is only a sample of many associations yet to be
found, readers would be better able, with this added discussion, to se-
lect the kinds of further associations that promise the most progress.
146
T he Opul en t Neighbor hood of t he Near by Gal axy M 1 0 1
In t r oduct ion
As an example of how one of the associations in the main Catalogue
might be analyzed from many different aspects, the ScI galaxy, M 101 is
treated here as a separate investigation. Of course M 101 is one of the
nearest galaxies that can be examined, so we are able to deal with
brighter apparent magnitude objects than in most fields in the Cata-
logue. Further, because of its closeness, 6.7 Mpc, (or perhaps even as
close as 3.6 Mpc) an extended area needs to be studied. In the end we
will see strings of galaxies, galaxy clusters, bright Markarian and 3C radio
objects and bright quasars extending from the central galaxy out to over
10 degrees radius on the sky. These alignments appear to point to past,
recurrent ejection of high redshift objects. It is suggested that these proto-
galaxies have evolved to lower redshift with time, giving rise to linear dis-
tributions of galaxies of similar redshifts, which are nevertheless still higher
today than the low redshift of their galaxy of origin.
It will be seen that galaxy clusters paired and aligned across M 101 ex-
tend along lines back to M 101. This supports previous evidence on asso-
ciations of higher redshift galaxy clusters with low redshift galaxies. In con-
junction with similar evidence for high redshift quasars, this suggests that
high redshift ejecta can fission into smaller pieces and evolve into clusters
of lower redshift galaxies.
The findings in the M 101 region here are bolstered by similar examples
from the Catalogue where filaments of galaxies stretch away on either
side of the central galaxy, ending in elongated, higher redshift clusters.
Of course, placing clusters so nearby yields lower luminosities for the clus-
ter galaxies—in contrast to the unreasonably high luminosities calculated
for cluster galaxies on the usual redshift-distance law. Larger galaxy clus-
ter distances calculated from the Sunyaev-Zeldovich effect are briefly
considered.

147
Gen es is of t he M 1 0 1 In ves t igat ion
A recent investigation (Arp and Russell 2001) reported a number of cases
of galaxy clusters paired across large, nearby galaxies. The reality of
these physical associations was reinforced by similarities in the redshifts of
paired clusters, the distribution of X-ray and radio quasars along the di-
rections to the clusters, in many cases the activity of the central galaxy,
and in some cases elongation of the clusters back toward the central
galaxies.
One of the cases presented in the above reference was that of two bright
clusters of z = .070 and z = .071 aligned diameterically across the ScI
spiral, M 101. (They are more exactly aligned and remarkably well cen-
tered when plotted in the polar coordinates of Fig. 6.) I had known that
Mrk 273, regarded as one of the extreme “ultra luminous” infrared galax-
ies, was relatively close to M 101 on the side toward the z = .070 galaxy
cluster (Fig. 1). I then happened to notice the Hickson Compact Group
No. 66 at z = .070. It too turned out to be in the direction of M 101 from
the cluster, with z = .070. While I was considering this development, an
astronomer who has extensive knowledge of the field, Amy Acheson, sent
me a question: “Why do the famous, active objects like 3C 295 tend to
fall close to bright galaxies?” I plotted the position of 3C 295, as in Fig. 1
here, and therepon decided that I had to investigate in detail all the
various kinds of objects around this particularly large, nearby galaxy.

148
T he E xt en ded R egion ar oun d M 1 0 1
The filled circles in Fig. 1 plot of all galaxies between cz = 1500 and 2500
km/sec over a large area around M 101. They are very sparse on the
edges of the region but increase steadily toward the center, to the posi-
tion where M 101 is located. It is difficult to see how this concentration
toward M 101 could be a selection effect, since galaxies of both higher
Fig. 1 - Companions around the nearby galaxy, M101 (200-500 km/sec) are
plotted over a wide area. M101 has a redshift of 251 km/sec, but galaxies of
redshift 1500-2500 km/sec also appear concentrated around it, many in a
predominantly NW–SE line. The circled plus signs represent all Abell clusters
with m10 brighter than 16.3 mag. The clusters which pair NW-SE across M101
have mean redshifts of z = .070 and .071. The plus signs designate special
objects described in text. The plus symbol SE from M101 marks the brightest
gamma ray burst in the sky reported so far.

149
and lower redshift are scattered more or less uniformly throughout the
area. (See Arp 1990 for details of the original analysis.) Moreover, these
galaxies form lines radiating from the position of M 101 outwards. The line
radiating NW-SE from M 101, however, is the most populated. The open
circles show low redshift companions, near the z = .0008 of M 101,
reaching out into the same areas—demonstrating that physical associa-
tion with M 101 reaches out to this distance.
The latest update in Fig. 1, shown here, has marked the positions of the
brightest Abell Clusters (as in the earlier Fig. 7 of Arp and Russell 2001). But
also added are three plus signs showing the positions of Mrk 273, HCG 66
and 3C 295. These three objects, along with two bright Abell clusters, fall
roughly in the filament of galaxies which extend in the NW–SE direction
which was identified in 1990.
Mrk 273 is one of the three major, ultra luminous infrared galaxies known
(Arp 2001). It is remarkable that it falls this close to, and with this orienta-
tion with respect to M 101. It is a strong X-ray and radio source and in this
respect is similar to higher redshift, active objects ejected from more dis-
tant central galaxies. In the present case, however, the apparent bright-
ness of both the central galaxy and the AGN implies a lesser distance
and accounts for the larger apparent separation (~ 3 deg.).
Further along in this direction we encounter HCG 66 (Hickson 1994). This is
a compact chain of six galaxies, four of which have redshifts which aver-
age to z = .070. As a group it is like a small cluster, or sub-cluster (albeit
in a non equilibrium configuration). It would seem to be related to Abell
1767 just to the NNW, which has an identical redshift. In this respect it
would seem to be an extension of Abell 1767 in the general direction of
the filament of objects leading back to M 101. This will be an important
property of galaxy clusters which appear to be involved in alignments
with a central galaxy. Further evidence of this effect will be discussed
later in this paper.
T he Gamma R ay B ur s t
The plus sign in the SE corner of Fig 1 marks the location of a gamma ray
burst which has been identified with an optical transient showing a blue
continuum in which metal lines of z = 1.477, 1.157 and possibly 0.928
are observed (Jha et al. 2001). It is apparent that this object lies along
the SE extension of the line of active objects coming from M 101, which
includes Abell 1904 and 3C 295. The feature which identifies it most
strongly with M 101, however, is that it was, up to June of 2001, the

150
brightest GRB detected with Beppo Sax. Although a number of alignments
in the Catalogue associate gamma ray bursters with active galaxies, it is
certainly impressive that the brightest one is here associated with the
nearest active galaxy ever investigated.
3 C 2 9 5
To the SW of M 101 in Fig. 1 the famous radio galaxy 3C 295 is plotted.
The remarkable property of this location is that it has nearly the same
separation, but on the other side of M 101 from Mrk 273. Most striking,
however, it is almost exactly on a line to the SE Abell cluster, at z = .071. I
Fig. 2 - An X-ray image of 3C295 from Chandra showing X-ray hot spots being
ejected at about p.a. = 144 deg. Radio contours from MERLIN are overlayed
showing radio ejection in the same direction (Harris et al. 2000).

151
remember the excitement at Mt. Wilson and Palomar observatories when
the redshift of 3C 295 was first measured. It was among the strongest ra-
dio sources discovered in initial radio surveys, and Minkowski’s 1960 red-
shift of z = 0.46 remained the highest redshift measured until after 1975.
(See Sandage 1999 for a history of major events over 50 years at Palo-
mar.)
The most recent observation of 3C 295 is in X-rays by Chandra. Fig. 2
shows a pair of X-ray condensations coming out of the nucleus at a posi-
tion angle of about p.a. = 144 deg. This is the same alignment as the ra-
dio lobes shown as overlayed contours in Fig. 2. Since the ejection origin
of radio lobes has long been accepted, and X-ray jets often are found at
their core, the X-ray sources in 3C 295 are indicated to be in the process
of ejection. It is perhaps significant that the position angle of the X-ray
source ejection in 3C 295 is about p.a. = 144 deg., not far from the di-
rection to Abell 1904 which is about p.a. = 153 deg. There is no appar-
ent reason why they should be so aligned, but we have seen similar
alignment of radio lobes from 3C 321 along the direction back to Arp
220, the third major ultraluminous galaxy (Arp 2001).
Fig. 3 - Photograph of the central galaxies in 3C295 on a IIIaJ 4m Mayall re-
flector plate taken by H. Spinrad. No. 41 is the radio galaxy at z = .461, No. 52
is an emission line companion at z = .467. The brighter galaxy falling exactly
between them has z = .285.

152
Even more curious is the fact that, at a very small scale, between 3C 295
at z = .461 and its closest major companion at z = .467, there is a bright
galaxy at z = .285 (marked G2 in Fig. 3). The two higher redshift galaxies,
as shown in Fig. 3, are almost perfectly aligned across the lower redshift
galaxy at only 11 arcsec on either side of it. There is only a very small
a priori chance of a galaxy this bright accidently occurring at this exact
spot. This of course is the quintessential pattern of AGN’s ejected from a
lower redshift galaxy (often interpreted as gravitational lensing). There is
some hint of luminous material connecting the central galaxy to 3C 295,
and deeper, high resolution images should be obtained to check this
possibility.
A Gal axy of z = 2 .7 2
Not conspicuously associated, but in the general SW direction from
M 101, is another example of the 3C 295 kind of configuration, shown in
Fig. 4. There it is seen that the starbursting galaxy cB58 (MS 1512+ 36) has
an extraordinarily large redshift for a galaxy, z = 2.72. But it is one mem-
Fig. 4 - The galaxy cluster MS 1512+ 36 imaged in co-added V and R. (The
central portion of the field is reproduced from Seitz et al. 1998 who analyzed
the system as a gravitational lens.) The central, large galaxy has z = .372 and
the high surface brightness starburst, galaxy cB58 has z = 2.72. The latter is 5
arcsec from the central galaxy. The irregular galaxy 3 arcsec on the other side
has no reported redshift.

153
ber of a conspicuous pair across a central galaxy of z = .373. The galaxy
that is the other member of the pair is thought to be a spiral (although in
the Figure it seems to have more of a crab-like shape). Its spectrum was
taken, but no redshift has been reported (Abraham et al. 1998). The
z = 2.72 galaxy is only 5 arc sec from the z = .373 galaxy on the sky. The
chance of finding such an unusual galaxy accidentally this close with this
alignment is ridiculously small. It might also be remarked that just a
glance at the numerous redshifts measured in this cluster will reveal that
they range from .2 ≤ z ≤ .6. It would seem on the face of it to be a cluster
of discordant redshift galaxies.
This system has only been interpreted in terms of gravitational lensing
(Seitz et al. 1998). Aside from the criticisms implicit in the associations of
supposed gravitational lenses in the present Catalogue, however, the
lensing deformations expected in the z = 2.72 galaxy do not appear to
match the observed form of the galaxy. The published lensing calcula-
tions are discussed elsewhere (Arp and Crane 1992).

154
T he D is t r ibut ion of B r igh t Mar kar ian Gal axies
Because of the provocative location of Mrk 273, it was tempting to see if
there were similar objects within the extended field of M 101. A SIMBAD
screen was set up to tabulate objects brighter than about 15.5 mag. with
redshifts between 0.35 and 0.41. A field of radius 10 degrees was arbi-
trarily set. Fig. 5 shows that a total of five Markarian galaxies were found.
Unexpectedly, the exceptionally active Mrk 231 showed up near the NW
edge of the field. Mrk 231 is the second of what are believed to be the
three most luminous infrared galaxies in the sky (Arp 2001). Finding it here
by chance, close to Mrk 273, and in the same NW direction from M 101
would appear to be quite unlikely.
The second point Fig. 5 illustrates is that the five Markarian galaxies are
distributed roughly along a NW–SE line which, as we shall continue to see,
Fig. 5 - Within a radius of 10 deg., all Markarian galaxies brighter than 15.3
magnitude and z between .035 and .045 are plotted.

155
is where most of the galaxies and active objects are situated. But these
Markarian galaxies are all exceptional objects. The intensity with which
they have been studied attests to their importance—for example the
number of literature references for Mrk 231 is 509, for Mrk 273, 274; for
Mrk 477, 126; for Mrk 474, 60 and even for the least studied, Mrk 66,
there are 32 references.
Perhaps even more impressive, however, is that this is a general align-
ment, over almost 20 degrees in the sky, of exceptionally active objects
with nearly the same redshift: z = .041, .041, .038, .038, .035. In terms of
conventional redshift distance, this would represent a narrow filament of
physically related galaxies spanning an enormous distance in space. The
conventional view would be that these are all galaxies at one particular
time in their evolution. Associated with M 101, however, they could have
an origin in a single ejection event. Such events are recurrent and could
later furnish different lines of objects at different discrete stages of evolu-
tion.

156
T he D is t r ibut ion of B r igh t Quas ar s
In order to separate background quasars from candidates for association
with M 101 another SIMBAD screen was set at the relatively bright appar-
ent magnitude of V = 17.1 mag. The search was supplemented by visual
search of the Veron and Veron Catalogue and checks with NED lists of
high redshift quasars. The quasars found are plotted in Fig. 6. The first im-
pression is that these brightest quasars are distributed along the same
general line of Markarian galaxies as just discussed. On closer inspection,
there are quasars near each of the plus signs that represent the Mark-
arian galaxies from Fig. 5, suggesting that the quasars may have origi-
nated more recently from these lower redshift, active Markarian galaxies,
and not necessarily as direct ejections from M 101 itself.
Some of the high redshift quasars here have such bright apparent magni-
tudes that, whatever the average luminosity for this redshift may be, they
are certainly bunched closely within this class—if the redshift does not in-
dicate distance (Arp 1998b). Examples are redshifts of z = 2.63 at 17.0
mag., z = 1.86 at 16.6 mag. and z = 3.19 at 15.8 mag. (We should re-
mark that while the z = 3.19 quasar is not near a Markarian galaxy, it is
quite near an infrared, IRAS, galaxy of 15.3 mag. and z = .037, and
therefore similar to the Markarian galaxies plotted here.) The 15.5 mag.
object is a BL Lac type quasar, OQ 530, very bright in apparent magni-
tude for its class, and agreeing with the close association of BL Lac’s with
nearby galaxies, as reported in Seeing Red (Arp 1997 Table 2, and
1998a).
Numer ical Coin ciden ces of R eds h if t s
A number of objects in Fig. 6 show remarkable numerical agreements in
redshifts. The quasars at z = .646, .660 and .656 stand out. It should be
noted that there is an additional quasar at 17.7mag., slightly below the
cutoff of 17.1 mag., which has a z = .646 and falls just SW of M 101. The
latter makes a close apparent pair with the z = .660 quasar directly
across M 101. The wider pair at z = .646 and .656 are very closely
matched in magnitude as well as redshift, but are probably associated
with the two Abell Clusters that are even better centered and aligned
across M 101. As remarked in the previous section, quasars at greater dis-
tances from M 101 may arise from secondary ejections from earlier
ejected, still active galaxies such as Markarian objects or X-ray clusters.
The numerical coincidence of the 3C quasars at z = .961 and .967 also
stands out. Undoubtedly associated with these two is 4C53.28, just SE of

157
M 101 at mag. 17.3 to 17.5 and z = .976. In general many of the red-
shifts in the M 101 extended field agree very closely with peak values of
redshifts in the Karlsson formula, which expresses the empirical relation
found for many years for bright quasar redshifts:
z = .06, .30, .60, .96, 1.41, 1.96, 2.64, 3.48…
The agreement between these predicted values and the values for the
majority of quasars in Fig. 6 is evident. Recently Burbidge and Napier
(2001) have demonstrated a very significant extension of the Karlsson se-
ries to the highest redshifts in various samples of quasars.
Fig. 6 - The plus signs are the same Markarian galaxies from Fig. 6, now with all
QSO’s less than z = 17.1 mag added as filled circles. All known 3C radio ob-
jects in the area are represented by open circles. The two circled plus signs are
Abell Clusters from Fig. 1.

158
T he Near es t , Mos t W idel y S pr ead P air of Quas ar s in t he S ky?
It was the non-professional astronomer Robert Harman who had the
courage to look beyond the 10 degree radius I had provisionally as-
signed as the area of association with M 101. As Figure 7 shows, there is a
pair of extremely bright apparent magnitude quasars (14.0 and 14.3
mag.), closely aligned across M 101 with very closely matching redshifts
of z = .087 and .089. They are at a distance of 9.5 degrees N and 10.5
degrees S of the central M 101. It should be stressed that it is extremely
unusual for such low redshift quasars to have bright enough apparent
magnitudes to place them in the conventional quasar class luminosity. (If
they were at usually supposed redshift distances they would have abso-
lute magnitudes of M = –24.7 and –24.1, where the arbitrary class limit is
–23.) Adopting the usual criteria of closeness for their apparent magni-
tude, centering, alignment, similarity of quasar redshifts and apparent
magnitudes would produce an estimated probability of chance associa-
tion ≤10–7. Together with the many previous cases this would take the
overall probability for physical association of quasars with low redshift
galaxies beyond sensible calculation.
T he 3 C R adio S our ces
Again in Fig. 6 we see that the brightest, earliest discovered, 3C radio
sources fall mostly along the line of objects which passes through M 101
from NW to SE. Apparently 3C277.1 is associated with Mrk 231, and
3C 295 apparently with M 101 itself. Some of the others may also be as-
sociated with nearby active galaxies such as Mrk 477.
3C 303 is a particularly well studied object because it has a prominent
one sided radio jet pointing from a compact radio galaxy of z = .141 to-
ward its double radio lobe, the northern component of which is at
p.a. = 280 deg. (Lonsdale et al. 1983). The direction to M 101 is about
289 deg. The ROSAT PSPC (low resolution X-ray photon counter) observa-
tion shows X-ray sources mildy extended in the NW-SE direction. Of par-
ticular importance, however, are three ultraviolet excess objects appar-
ently associated with the western lobes of 3C 303 (Kronberg et al. 1977).
From the spectrum of one Margaret Burbidge obtained a redshift of
z = 1.57. In spite of the fact that this association was discussed as possi-
ble conclusive proof that quasars are not at great distances, no further
time has been assigned to obtain the spectra of the remaining two can-
didates.

159
With the plot in Fig. 6 now complete, we could now propose that there
was a cone of ejected objects from M 101 in the NW-SE direction. Or we
could interpret the distribution of objects as two rather narrow lines, one
at p. a. = 110 and the other at p.a. = 147 deg. We will prefer the latter
interpretation, because we now wish to examine the possible connection
of the Abell galaxy clusters with these lines of objects.
Fig. 7 - Within a radius of 11 degrees bright apparent magnitude quasars are
plotted. The quasars PG 1411+ 442 and PG 1351+ 64 are at 10.5 and 9.5 deg.
radial separation and aligned at p.a. = 169.5 and 173.3 on either side of
M101.
160
E l on gat ion of Cl us t er s T ow ar d M 1 0 1
From previous evidence we have some expectation of galaxy clusters
being elongated along the line of their apparent ejection. The clusters
Abell 3667 and 3651 have been found to be paired across the central
galaxy, ESO 185-54 (Arp and Russell 2001). The clusters were strongly
elongated along this connecting line, and later Chandra observations
actually showed a bow shock (later described as a “cold front”) moving
outward along just this line in Abell 3667 at 1400 km/sec. (See also Figs. 5
and 6 in the following Appendix B.) The famous “gravitational arc” cluster,
Abell 370 showed elongation back toward its purported galaxy of origin,
the bright Seyfert NGC 1068. Several other similar examples were also
noted in the above reference.
Catalogued galaxies within a radius of 60 arcmin around the cluster
Abell 1904 are shown in Fig. 8. The cluster is noticeably elongated in a
direction leading back to 3C 295, and hence very closely along the line
back to M 101. Inspection of PSPC X-ray measures reveals a flattened
core to the cluster with faint material trailing out perpendicular to this
core in a direction back toward M 101. (See Fig. 13, in Appendix B which
suggests an ablating passage through an intergalactic medium.) Since
that PSPC exposure was only 3.8 kilosec, it would be important and possi-
bly decisive in determining ejection origin from M 101 if a higher resolu-
tion Chandra observation of this cluster could be obtained.
Another cluster of somewhat fainter galaxies, Abell 1738, with z = .115, is
not plotted in Fig. 5 or 6, but lies just N of Mrk 66, and is shown close-up in
Fig. 9. This cluster has relatively few cluster members with measured red-
shifts, but the figure shows that they are aligned back toward M 101. It is
located on the edge of a PSPC exposure which can only establish that it
is also an X-ray cluster. Not much can be said about Abell 1767 except
that it gives some impression of being aligned back toward M 101 at
about 140 deg. The PSPSC X-ray sources around 3C 303 appear inclined
at about p.a. = 110 deg. toward M 101. However, quantitative determi-
nation of optical galaxy isopleths for these last two clusters and/or X-ray
contours of their smoothed distribution would be required.

161
The shapes of the clusters shown In Figs. 8 and 9, however, in conjunction
with similar data in the Catalogue and Appendix B, would seem to furnish
compelling evidence that the cluster originated from a point near the
present M 101. In the conventional view, constraints that give spontaneu-
osly forming, linear, non-equilibrium configurations in deep space would
seem to difficult enough. But when these point back to a large galaxy, a
connection with generally linear, recurrent ejections from that galaxy
seems unavoidable.
Fig. 8 - All catalogued galaxies from SIMBAD within a one deg. radius centered
on Abell cluster 1904. The line at p. a. = 153 deg. points back to 3C295, and
from there to M101. Many of the galaxies in the SW quadrant have redshifts
near z = .07, and there are also some AGN’s and quasars. (See also Fig. 13 in
Appendix B.)

162
S cal e of t he M 1 0 1 As s ociat ion s
The large scale of the associations found around M 101 raises the ques-
tion whether they are compatible with the many similar associations
found around more distant active galaxies. The distance to M 101 is, from
Cepheids, m–M = 29.13 mag., or 6.7 Mpc. (Freedman et al. 2001). If the
majority of the previous associations were made with central galaxies at
about the distance of the Local Supercluster, i.e., 15-16 Mpc, then they
would extend out to a factor of 2.3 greater radius on the sky at the closer
distance of M 101. Since the observed extensions of galaxy clusters and
low redshift AGN’s around central galaxies were in the range of 2-4 de-
grees (Arp and Russell 2001), the range around M 101 would be ex-
pected to be from about 5 to 10 degrees. This is roughly the angular ex-
Fig. 9 - All catalogued galaxies from SIMBAD within a 30 arc min circle cen-
tered between Mrk 66 and Abell 1738. The line at p. a. = 125 deg. points back
to M101.
163
tent of the associations with M 101 which were found in Figs. 1, 4 and 5.
As an aside, it is a general property of the associations that the higher
redshift quasars are found closer to their galaxy of origin and evolve to
lower redshift as they move out to become companions at greater radii.
There can, however, be more recent, secondary ejections from these out-
lying active companions.
It is important to note that the apparent magnitudes of the low redshift
AGN’s around the more distant associations tended to be in the 17 mag
range, the quasars in the 19 mag. range and the very high redshift qua-
sars in the 20th mag. and fainter range. At the closer distance of M 101
they would be expected to be about 2 mags. Brighter; as can be seen
from the figures and text, that is just about what is observed around
M 101. There are arguments, however, that M 101 belongs to the M 81
group at about 3.6 Mpc distance (Arp 2002). In that case the scale factor
would be still larger.
If M 101 is considered as the central galaxy the strongest evidence for
activity in the galaxy is the long straight arm in the outer NE quadrant. It
was classified as a spiral galaxy with one heavy arm—a fact which led to
its identification as No. 26 in the Atlas of Peculiar Galaxies (Arp 1966). At
that time I argued that spiral arms generally represented ejection tracks,
and that ScI galaxies were a younger and particulary active kind of gal-
axy. The nucleus of M 101 is not now particularly active spectroscopi-
cally, but then such activity is probably intermittent. The far-flung streams
of older galaxies and low redshift AGN’s associated with M 101 would
suggest that they originated from activity in the rather distant past.

164
S un yaev-Z el dovich E f f ect
Calculation of the distances of galaxy clusters from their scattering of mi-
crowave background in conjunction with measurements of their X-ray sur-
face brightness seems to rest on such proven physical principles that it is
difficult to see how anyone could accept much closer distances, as the
observations in the present paper claim. If we are, however, to give the
observations even equal consideration we must face the apparent dis-
cordance of nearby galaxy clusters with S-Z distance determinations.
Perhaps the first point to be made is that galaxy clusters which are
nearby would present strongly non-equilibrium physical conditions. If they
were formed in more recent ejections from active galaxies, and they
themselves are ejecting secondarily and in non equilibrium configura-
tions, perhaps it is incorrect to assume equilibrium temperature, radiation
and energy densities. A strong indication that non-equilibrium conditions
apply is provided by cooling flows. In many clusters the densities near the
center are so high that the cooling flows would exhaust the available
heat on much less than a cosmic time scale. The problem is so acute that
suggestions have been made for merging or accretion of companion
objects to resupply the energy in the center (A. Fabian, Moriond Confer-
ence).
Actually the situation in many clusters, especially those dominated by
large central galaxies, is that powerful ejections take place that must in-
termittently add bursts of energy into the surrounding cluster medium.
(See e.g., 3C 295 pictured here in Fig. 2.) The question then becomes: Do
observations of the cluster medium at any given time represent an equi-
librium physical state on which the conventional physical calculations
can be made?
To make this suggestion more specific, consider that in order to account
for the intrinsic redshifts of the objects of various ages associated with an
active galaxy, it has been necessary to make a more general solution of
the general relativistic field equations where particle masses are a func-
tion of time (Narlikar and Arp 1993). This proposal requires initial ejection
a plasma of low mass particles near light velocity. Because of their low
mass, the newly ejected particles can have large scattering cross sec-
tions, enabling microwave photons to be efficiently boosted. The synchro-
tron/bremstrahlung jets, however, are observationally well collimated
which must mean relatively low temperatures orthogonal to the direction
of travel. Their energy is mostly converted to temperature only at the in-

165
teraction surface of the jet cocoon with the surrounding medium. Both of
these—the strong scattering and low temperature effects—would tend to
give a large distance for a small total mass cluster in the S-Z equation.
This proposal can be put in a possibly observable way: even if there were
a nearby cluster in temporary temperature equilibrium with a well-
determined X-ray surface brightness, but no measurable S-Z microwave
depression, could an upper limit for the distance of this cluster be calcu-
lated?

166
Con cl us ion
By now it has been long accepted that radio jets and lobes, often ac-
companied by X-ray jets and X-ray emitting material, are ejected, in
generally opposite directions, from active galaxies. Since compact, en-
ergetic X-ray sources must be relatively short lived, it is natural to suppose
that most of the excess density of X-ray sources around active galaxies
(Radecke 1997) has been ejected recently. Their identification with more
highly redshifted quasars, and subsequent evolution into lower redshift
quasars, compact active galaxies and normal galaxies has been dis-
cussed elsewhere (Arp 1998a). The recently discovered ejection of higher
redshift quasars and X-ray galaxies from Arp 220 further supports this
conclusion. (See Fig. 10 in Introduction and Arp 2001; Arp et al. 2001.)
In the vicinity of M 101, examined in detail in this paper, we have the rare
opportunity to see associations closer than in most nearby galaxies by a
factor of more than 2. Using the principle that the brightest companion
objects will cluster around the brightest parent galaxies, we have identi-
fied lines and filaments of higher redshift and active objects extending
out of, or through, M 101. In the course of this survey we have had the
pleasure of encountering many of the most renowned and intensively ob-
served Markarian and 3C radio objects, and some very bright apparent
magnitude quasars. It is gratifying to rediscover the long strings of low
and intermediate redshift galaxies I first noted in 1984 (Arp 1984) and re-
visited in 1990, shown here in Fig. 1. These conspicuously aligned strings
of galaxies remind one of the features presently explained with various
cold dark matter scenarios. Here, however, their explanation would rely
on evolving high-energy ejections from a variety of central galaxies. The
marked elongation of clusters would then suggest formation by ablation
from ejected plasma knots. The famous M 87 jet visually gives this strong
impression.
We have also seen some striking examples of quantized redshifts around
the low redshift central galaxy M 101. M 101 has such a low redshift that
no corrections are needed. But as noted previously in the Catalogue,
when the parent galaxy has an appreciable redshift, the redshift of the
ejected object must be corrected to its rest frame. The conventional red-
shift-distance interpretation of the quantized redshifts would, of course
lead to a universe of concentric shells centered on our galaxy. The alter-
native interpretation of the redshifts as a measure of evolutionary stage,

167
however, would permit the quasars to be born in separate ejections,
which may take place in periodic events.
R ef er en ces
Abraham, R., Yee, H., Ellingson, E., Carlberg, R., Gravel, P. 1998, ApJS 116, 231
Arp, H. 1966, Atlas of Peculiar Galaxies, California Institute of Technology; ApJS 123, Vol.
XIV
Arp H. 1984, P.A.S.P. 96, 148
Arp H. 1990, J. Astrophys. Astr. (India) 11, 411
Arp, H. 1997, A&A 319, 33
Arp, H. 1998a, Seeing Red: Redshifts, Cosmology and Academic Science, Apeiron,
Montreal
Arp. H, 1998b, ApJ 496, 661
Arp, H. 1999, ApJ 525, 594
Arp, H. 2001, ApJ 549, 780
Arp, H. 2002, ApJ 571, 615
Arp. H, and Crane, P. 1992, Physics Letters A 168, 6
Arp, H. and Russell, D. 2001, ApJ 549, 802
Arp, H., Burbidge, E., Chu, Y., Zhu, X. 2001, ApJL 553
Brandt, W., Hornschmeier A., Schneider, D., et al. 2000, AJ 119, 2349
Burbidge, E. M. 1995, A&A, 298, L1
Burbidge, E. M. 1997, ApJ, 477, L13
Burbidge, E. M. 1999, ApJ, 511, L9
Burbidge, E. M. 1995, A&A, 298, L1
Burbidge, E. M. 1997, ApJ, 477, L13
Burbidge, E. M. 1999, ApJ, 511, L9
Burbidge, G. and Napier W. 2001, AJ, 121,21
Chu, Y., Wei, J., Hu, J., Zhu, X. and Arp, H.C. 1998, ApJ 500, 596
Harris, D. et al. 2000, ApJ 530, L81
Jha, S., Pahre, M., Garnavich, P. et al. 2001, ApJ 554, L155
Kronberg, P., Burbidge, E., Smith, H., Strom, R. 1977, ApJ 218, 8
Hickson, P. 1994, Atlas of Compact Groups of Galaxies, Gordon and Breach
Lonsdale, C., Hartley-Davies R., Morison, I. 1983, M.N.R.A.S. 202, 1L
Narlikar J., Arp H. 1993, ApJ 405, 51
Narlikar, J. and Arp, H. 2001, ApJ, to be submitted
Radecke, H.-D. 1997, A&A 319, 18
Sandage, A. 1999, ARA&A 37, 445
Seitz, S., Saglia, R., Bender, R., Hopp, U., Belloni, P., Ziegler, B. 1998, M.N.R.A.S. 298, 945.


169
Appendix B
F il amen t s , Cl us t er s of Gal axies an d t he Nat ur e of E j ect ion s F r om Gal axies
In t r oduct ion
Classic cases of ejected radio sources were recognized early by the
lobes extending in opposite directions from Virgo A and Cen A (M 87 and
NGC 5128). A good example is Plate 8-18 in Seeing Red (Arp 1998a).
When X-ray observations became available, however, it was seen that
narrower cores of X-ray jets extended inward from these radio jets. Lower
power radio jets are now showing similar X-ray cores (e.g., Pietsch and
Arp 2001), particularly with the higher resolution Chandra observations
(Wilson et al. 2001; Worral et al. 2001). One obvious implication is that the
higher energy density X-ray jets supply synchrotron particles, which be-
come the outer, lower frequency envelope of the radio lobes as they
age.
It was also evident that X-ray jets tended to break up into discrete knots
as they emerged from the nucleus of the ejecting galaxy. The knots re-
sembled the compact X-ray sources that were found farther out, charac-
teristically paired across galaxies with active nuclei (Arp 1998a). These X-
ray sources, when measured spectroscopically, were invariably identified
with medium high redshift quasars. In fact, the number of pairings of radio
quasars was soon outstripped by the more frequent cases of pairing of X-
ray quasars across active galaxies. This result brings us to another empiri-
cal suggestion, namely, that the radio material, being observably more
diffuse than the optical and X-ray material, is stripped away from the
more compact X-ray condensations as it passes through the galactic
and intergalactic medium. Examples of this are well illustrated by 3C 212
(Stockton and Ridgeway 1998) and Mrk 231 (Arp 2001). The clouds of ra-
dio material are then much less accurate markers of the presence of en-
ergetic quasar cores, are generally widely spread around active galax-
ies, and have less frequent optical identifications.
The key to the origin and nature of ejected material must, therefore, lie in
the X-ray jets. The jets are characteristically featureless in optical spectra,

170
but after forming stars, the optical objects observed in the outer exten-
sions of the X-ray ejections invariably show excited atomic spectra of
variously higher redshifts. We discuss here examples of lines of discrete X-
ray sources leading from the centers of large, active, low redshift galax-
ies. If the physical reality of the lines is accepted, then they suggest an
evolutionary sequence originating in the creation of young matter in the
nuclei of large active galaxies and proceeding through maturation into
normal, neighboring companion galaxies.
The final sections of this Appendix give a more detailed examination of
some particularly striking examples of elongated clusters emerging from
low redshift central galaxies. We then conclude with a physical interpre-
tation of the nature of the ejected X-ray plasma which might explain both
the observed behavior of the ejected material and the physical cause of
the time varying, intrinsic redshift.

171
X-r ay s our ces con n ect in g P G 1 2 4 4 + 0 2 6 an d NGC 4 6 3 6
Fig. 1a shows a 5,486 sec ROSAT, PSPC exposure of the AGN/Seyfert,
PG 1244+ 026 (S1n). The color picture is from the standard (ROSAT source
browser) reduction. It can be seen that about a dozen sources form a line
leading from the low redshift, active galaxy NGC 4636 to PG 1244+ 026.
This is the primary observational evidence, and if it is judged to be signifi-
cant, we have a physical connection between an active galaxy at
Fig. 1a (Plate 1a). Full, approximately 50 arcmin radius, X-ray field of the PSPC
detector on ROSAT. A line of bright, compact X-ray sources connects
NGC 4636 (z = .003) at upper right with the object in the center, the AGN
PG1244+ 026 (z = .048). (See Fig. 1b.)

172
cz = 979 km/sec and a quasar-like object of cz = 14,400 km/sec
(z = .003 and .048).
Recent Chandra X-ray observations of NGC 4636 show a spectacular
example of X-ray emitting ejected arms. The connection with the line of
quasars and quasar candidates shown here enables us to study the na-
ture of this ejection. To this end the brightest X-ray sources in the line have
been examined on deep Schmidt survey plates. As the schematic repre-
sentation in Fig. 1b shows, 6 of the brightest sources have been optically
Fig. 1b. A schematic representation of the bright sources in Fig. 1a. Those
sources that have been identified with optical objects are almost all quasar
candidates (BSO’s or blue stellar objects). Their V mag.’s are labelled and
their positions are given in Table 1. Redshifts of known quasars are also la-
belled.

173
identified. Most turn out to be blue stellar objects (BSO’s) of the kind which
can later be confirmed to be quasars or AGN’s. This expectation is rein-
forced by the fact that one of them, PG 1244+ 026, has already been
measured as an AGN of z = .048, and another as a quasar of z = .934.
T AB L E 1 Obj ect s in F ig 1 b.
No R.A. 2000 Dec. Rmag. Bmag.
6 12 44 59.8 02 30 23 -- 21
7 12 45 33.8 02 28 25 18.8 18.9
8 12 45 07.2 02 28 18 19.3 20.0
15 12 46 07.4 02 21 53 19.1 18.8
13 12 45 16.8 02 21 59 18.5 18.1*
4 12 46 50.9 02 36 04 19.0 19.3 *BSO/gal
Of course the redshifts of the remaining candidates should be measured
because they will give further data on the physical composition of the
emerging filament. But some preliminary comments about the nature of
the ejection from the primary galaxy may be permitted here. First, how-
ever, it will be useful to buttress the reality of the physical connection by
presenting some observations of other, independent but similar configu-
rations.

174
Addit ion al X-r ay ej ect ion s f r om NGC 4 6 3 6
NGC 4636 is interesting because it is such a strong X-ray source, and a
long PSPC exposure of 13,070 sec is available. Fig. 2a shows the stan-
dard reduction of this exposure. It is now apparent that there is a line of
about 7 or 8 strong X-ray sources oriented NNE to SSW across the nucleus.
Again, these have been examined; they are listed in Table 2 and tenta-
tive identifications labeled in Fig. 2b.
Several comments can be made at this time. First, recent Chandra ob-
servations (Jones et al. 2002) show strong X-ray ejections from the central
Fig. 2a (Plate 2a). Full, approximately 50 arcmin radius, X-ray field of the PSPC
detector on ROSAT. A line of bright compact X-ray sources extends in either
direction from NGC 4636 (a bright X-ray, E galaxy with z = .003). (See Fig.
2b.)

175
arcmins of NGC 4636 in a roughly NE-SW direction. But earlier, Matsushita
et al. (1998) had shown high energy ASCA X-rays extending just out to the
distance and along the line of the discrete sources shown here in Fig. 2b.
It appears to be a classic ejection in opposite directions across an active
nucleus. Now, however, in the outer reaches, this ejection is seen to con-
tain individual X-ray sources which are identified as probable quasars.
Secondly, NGC 4636 is a bright (BT = 10.50 mag.), nearby galaxy, and its
associated quasars and candidates are rather bright in apparent magni-
Fig. 2b. A schematic representation of the bright sources in Fig. 2a. Those
sources that have been identified with optical objects are almost all quasar
candidates (BSO’s or blue stellar objects). Their V mag.’s are labelled and
their positions are given in Table 2.

176
tude—in the 17.8 to 18.9 mag. range. In Fig. 2b additional non X-ray se-
lected quasars from the LBQS survey in the same apparent magnitude
range can be noted. This is more or less the same range as in the line
leading to PG 1244+ 026. Very intriguing is the presence of a quasar just
S of NGC 4636 at z = .934, and another just next to PG 1244+ 026 at ex-
actly the same z = .934, both having nearly the same apparent magni-
tude. In the same field it is not unusual to detect some quasars as X-ray
sources, as well as some from objective prism and other kinds of surveys,
although it is interesting to note that the candidates strong in X-rays are
closer and better aligned along the X-ray ejection.
Two of the candidate quasars in the NGC 4636 line and one in the PG
1244+ 026 line are optically faint—in the V ≥ 20 and 21 mag. range.
There is precedent for this, for example in the BL Lac object just N of, and
connected to, the nearby Seyfert NGC 4151 (Arp 1997). It is very bright in
X-rays and faint optically, suggesting that this represents a temporary
phase in its evolution, perhaps related to the strong optical variability of
some quasars.
Overall, however, the disposition of strong X-ray sources around
NGC 4636 indicates that this nearby, massive and notably active galaxy
is ejecting AGN’s of higher redshift. A prominent line is shown in Fig. 2a
and b, and another line leading to PG 1244+ 026 is shown in Fig. 1a and
b. A number of cases of nearly perpendicular lines of X-ray sources ema-
nating from active galaxies have been shown in an earlier publication
(Arp 1996: see particularly Figs. 14 and 15 in that reference).
T AB L E 2 Obj ect s in F ig 2 b.
No R.A. 2000 Dec. Rmag. Bmag.
4 12 43 25.9 02 55 49 17.8 17.0
7 12 43 20.0 02 52 56 15.4 16.7*
12 12 43 15.8 02 49 59 --- 20.0
64 12 42 19.1 02 31 19 18.8 18.5
66 12 42 28.4 02 30 44 18.9 18.4
71 12 41 50.2 02 19 31 --- 21 *Galaxy

177
L in e of X-r ay s our ces f r om t he s t ar bur s t gal axy NGC7 5 4 1
NGC 7541 is a B = 12.45 mag. starburst galaxy of redshift z = .009 with a
blue jet/arm emerging from its disk. It is centered between two very bright
radio sources (Arp 1968). Fig. 3 in the Introduction to the Catalogue
shows that the two 3C radio sources were eventually measured at z = .22
and .29. A similar pair of 3C quasars across Atlas of Peculiar Galaxies No.
227 (NGC 470/474) with redshifts z = .672 and .765 (shown in Fig.2 of the
Introduction) was calculated to have only a 2 × 10⁻⁹ probability of
chance occurrence (Arp and Russell 2001). The physical association of
the two radio quasars with NGC 7541 is about the same order of signifi-
cance. But a map of the larger-radius field that follows NGC 7541 in the
Catalogue (R.A. = 23h15m) shows that, at approximately a right angle to
this radio pair, is an X-ray source with a redshift of z = .30 that is intermin-
gled with some galaxies of about z = .13.

178
There is a dominant X-ray galaxy at the center of this cluster, Abell 2552,
that causes the cluster to be classified as a strong X-ray cluster at
z = .300 (Böhringer et al. 2000; Ebeling et al. 2000). But regardless of the
details of this grouping of objects, Fig. 3 in this Appendix shows that the X-
ray sources in the cluster are strung out in a well-defined line. That line, as
illustrated in the present figure, points accurately back to the active gal-
axy NGC 7541. The individual X-ray sources are relatively close together
and faint, so, unlike the previous case of NGC 4636 and PG 1244+ 026, it
is difficult to make probable optical identifications. But it is clear that the
X-ray emission, whatever its exact form, is narrowly spread along the line
back to NGC 7541.
Fig. 3. A ROSAT, high resolution HRI X-ray map centered on Abell 2552. The
compact sources are aligned as exactly as can be judged back toward
NGC 7541. (See Figure for NGC 7541 in the main Catalogue and Fig. 3 in the
Introduction).

179
Further, it is very important to note that the high resolution HRI map of the
central AGN also shows extended emission along p.a. 42 deg. The mate-
rial extending from the active, dominant galaxy is shown well in the
enlargement in Fig. 4 (Plate 4). It is becoming clear that one extreme in a
wide range of cluster morphology is exemplified by a very dominant AGN
surrounded (usually closely) by a large number of much fainter cluster
galaxies. 3C 295, discussed in Appendix A, is perhaps a typical example
of this kind of cluster. Abell 2552 appears to be one of this kind, a domi-
nant radio/X-ray galaxy which is entraining (or ejecting) pieces of itself to
form a cluster of galaxies around it which are much fainter but of roughly
the same redshift.
Fig. 4 (Plate 4). This is an enlarged view from the high resolution, HRI X-ray im-
age. X-ray material appears to emerge from this central galaxy and extend
out along the p.a. = 42 deg. line back toward NGC 7541.

180
E l on gat ed X-r ay cl us t er s
T he el on gat ed X-r ay cl us t er A 3 6 6 7
We can turn the question around and ask: If we look in the vicinity of
strongly elongated X-ray clusters do we find them pointing to lower red-
shift, active galaxies? A systematic survey should be conducted, but
some spectacular examples can already be mentioned. An almost line-
arly elongated cluster pouring out 2440 X-ray counts/ksec is shown in
Fig. 5. The very elongated, very strong X-ray cluster A3667 is shown from
PSPC exposures reduced in the 2RXP mode. See following Figure caption for
further discussion (Arp 2001b).

181
Fig. 5. This cluster, A 3667, is paired with another elongated X-ray cluster,
A 3651, across an active, mB = 11.9 mag. E galaxy. The details of how
the X-ray emission from the central galaxy and the intermingling of the
cz = 4,500 km/sec galaxies with the 17,000 km/sec galaxies define the
line of pairing and elongation are discussed elsewhere (Arp and Russell
2001).
In Fig. 6 here, we emphasize a subsequent result which would seem con-
clusive in showing that the cluster A 3667 has been ejected from the cen-
tral ESO 185-G4. The Chandra measures by Vikhlinin et al. (2001) show
Fig. 6. A3667 is shown here with the PSPC exposures reduced in the 1RXP
mode in order to emphasize the brightest sources in the cluster. The X-ray E
galaxy ESO 185-G4 (mB = 11.19 mag.) is at z = .015 and extends in either
direction towards the A3667 and A3651 clusters at z = .055 and .059. (See
Arp 2001b for further details.) Recent Chandra observations show a cold
front moving down the length of the cluster, away from ESO 185-G4, with a
velocity of 1400 km/sec.

182
that a cold front is moving directly along the line of the extension of
A 3667—away from the z = .015 group with z = 1400 km/sec. This infor-
mation will be useful when we try to construct a model of how the initial
ejection evolves into the objects we observe.
T he el on gat ed X-r ay cl us t er R XJ 0 1 5 2 .7 -1 3 5 7
Fig. 7 (Plate 7) shows another spectacular example of a very elongated
cluster. Could there be clearer evidence for non-equilibrium mass and
radiation distribution? If it were at its redshift distance it would be “one of
Fig. 7 (Plate 7). An optical image, with X-ray contours superposed, of the clus-
ter RXJ0152.7-1357 at z = .83 (Rosati et al.). At its redshift distance it would be
one of the most luminous clusters known. It points, however, nearly at the
strong X-ray E galaxy NGC 720. (See next Figure.)

183
the most X-ray luminous clusters known” (Rosati et al. 2000). It points within
15 deg. of direction to NGC 720, a bright BT = 11.15 mag. galaxy which
is a bright source in the ROSAT all sky survey (148 counts/ks) and has been
studied for its “twisted” central X-ray isophotes (Buote and Canizares
1996).
As noted before (Arp and Russell 2001), the chance of finding a galaxy
this bright so close to an arbitrary point in the sky in the range
20h ≤ R.A. ≤ 4h is less than 10–3. But then we must decrease this further by
the chance of the galaxy being such a strong X-ray source and the clus-
Fig. 8. The neighborhood of NGC 720 showing RXJ0152.7-1357 at only 14 arc
min separation. EXSS sources (extended X-ray sources) which are likely to be
clusters are shown as X’s. Dashed lines indicate possible optical clusters along
the minor axis of the central galaxy. NGC 720 is reported to have “twisted” X-
ray isophotes emerging from its center.

184
ter’s near alignment. The redshift of this very X-ray luminous cluster is
z = .83. Its unusually small (14 arcmin) separation from NGC 720 is in ac-
cord with the tendency for the higher redshift objects to be closer to their
galaxy of origin. This new case agrees very well with the strong X-ray clus-
ter Abell 370 discussed in the earlier paper (Arp and Russell 2001). There
A 370 was conspicuously elongated back toward the very active Seyfert
NGC 1068, 1.7 deg. distant. The greater separation would accord with its
lower, z = .375 redshift.
Fig. 8 (repeated from the main Catalogue) shows that there are addi-
tional EXSS (extended X-ray sources) within about 15 arcmin of NGC 720.
These are likely to be X-ray clusters and should be investigated further.
The dashed ovals indicate candidate optical clusters just at the limit of
the POSS II plates. Deeper optical images would be capable of confirm-
ing their apparent orientation along the minor axis of NGC 720. Finally
there is a strong X-ray source exactly aligned and equidistant on the
other side of the nucleus of NGC 720 from RXJ 0152.7-1357. It is identified
below with its PSPC number; it would be interesting to know its redshift:
No. 1 1 5 3 m2 3 .6 2 s– 1 3 d3 0 m5 9 .2 s 1 9 .0 1 9 .0 (R ,B mag.)
A compilation of ultra luminous X-ray sources (ULX’s) from HRI observations
close to bright galaxies (Colbert and Ptak 2002) shows two roughly on ei-
ther side of NGC 720. They would be good examples of the suggested
identification of ULX’s with recently ejected quasars (G. Burbidge, E. M.
Burbidge and H. Arp, A & A 400, L17). The Colbert and Ptak finding charts
for 87 such ULX’s, when optical candidates are measured, should settle
the association of quasars with active, low redshift galaxies. This, of
course, is the same association demonstrated by Radecke (1997) and
Arp (1997) for PSPC X-ray quasars around Seyfert galaxies.

185

186
Fig. 9. This is the same map of galaxies in the NGC 214 region as presented in
the main Catalogue, but now the 8 x 8 arc min region observed by Chandra is
outlined. This area is shown in detail in Fig. 11. The central galaxy, NGC 214, is
noted at z = .015 and the galaxies with .015 ≤ z ≤ .11 are filled in as solid sym-
bols along the lines.

187
Addit ion al E xampl es of E l on gat ed Cl us t er s Al ign ed w it h Gal axies of L ow er R eds h if t
NGC 2 1 4 an d R XJ 0 0 3 0 + 2 6 1 8
Fig. 9 shows a serendipitously discovered association that illustrates very
clearly the elongation of a cluster back toward a central galaxy over an
extended region of the sky. I discovered it when I investigated the un-
usual galaxy cluster CRSS J0030.5+ 2618. In that cluster the dominant, X-
ray galaxy has z = .516 and a significant excess of Chandra X-ray
sources (Brandt et al. 2000; Cappi et al. 2001). As discussed in the main
Catalogue, it also has two galaxies of redshift z = .247, one of z = .269,
and three quasars of z = .492, 1.665 and 1.372, all within 5 arcmin, and
a further quasar z = 1.094 within 8 arc min.
I asked the question: “Where is the bright galaxy from which all this was
ejected?” I found it about 2.5 degrees away. It was NGC 214, an ScI
galaxy of Bo,iT = 12.48 mag. and a redshift of vo = 4757 km/sec or
z = .016. This redshift indicates it is associated with the ubiquitous Perseus-
Pisces filament (Arp 1990). But the striking feature was that bright
companion galaxies at z = .02 and .03 stretched away to the WNW,
directly toward the cluster of high redshift objects centered around the
CRSS cluster.
Naturally I then asked: “What is on the other side of NGC 214?” As Fig. 9
shows there is an Abell Cluster, ACO 104 about 2 degrees away and
nearly opposite NGC 214 with a redshift of z = .082. The striking feature of
this cluster is that it is clearly elongated back toward NGC 214.

188
Also interesting is the fact that galaxies of z = .04 and z = .05 lead into
the cluster from the direction of NGC 214. (There are even two galaxies of
z = .03 inside the cluster as shown in Fig. 10.)
In all these cases all the galaxies and optical objects in these areas
should be completely measured. But even at this stage it seems clear
that there are strings of objects extending in opposite directions from the
central galaxy NGC 214, and their redshifts continually increase as we
approach galaxy clusters at either terminus.
Fig. 10. Enlarged view of the galaxies with known redshifts in Abell 104. Note the
galaxies at z = .03, one an emission line object. Redshifts similar to that of the
central object, NGC 214, seem to be mixed into the area of this cluster. The line
back to NGC 214 runs at p.a. = 298 deg.

189
Because of the apparent overdensity of bright X-ray sources in the region
of the CRSS (or RXJ) 0030 cluster, it is extremely interesting to examine the
Chandra Exposure in Fig. 11. There is also a well documented excess of
faint Chandra Sources (Cappi et al. 2001). It is intriguing that the excess
of Chandra X-ray sources comes from sources all about the same inten-
sity close to the ESE side of the dominant X-ray source. In fact, these
sources are all strung out in the direction back to NGC 214, about
p.a. = 287 deg.. The strong X-ray galaxy itself is distended in roughly this
same direction. The configuration suggests that the strong X-ray source is
moving out along the line from the central NGC 214 and trailing smaller
sources along its path of travel.
Fig 11. The Chandra observations of the RXJ0030+ 1628 cluster from Cappi et
al. (2001) are shown. The line back to NGC 214 at p.a. = 287 deg. is indi-
cated by the arrow.

190
B ack t o M 1 0 1 w it h t he Cl us t er s 3 C 2 9 5 an d Abel l 1 9 0 4
By an astonishing coincidence (?) two strong X-ray galaxy clusters at
around z = .5 with a reported over density of Chandra sources are pres-
ently known. The second is 3C 295 at z = .461. In Appendix A we identi-
fied it as being ejected SW from M 101 along a direction variously esti-
mated between p.a. = 149 to 151 deg. Fig. 12 here shows that the same
kind of Chandra sources trail out behind its apparent path away from
M 101. Even the dense part of the X-ray image seems to be elongated
roughly along this direction.
Fig. 12. The Chandra observations of the 3C295 cluster from Cappi et al.
(2001) are shown. The line back to M101 at p.a. = 151 deg. is indicated by
the arrow.

191
A further point is, of course, that the overdensities of Chandra sources
around both of these X-ray clusters, found by two independent teams,
have only two possible explanations. Either they turn out to have the
same redshift as the central source, in which case they will have to be
accepted as physical members that are all aligned with a low redshift
galaxy of origin—or they turn out to have widely different redshifts, in
which case the overdensity, already being interpreted as not accidental,
is evidence of different redshifts physically associated long the line.

192
An d Now Abel l 1 9 0 4
Recall that farther out in the field we saw the Abell Cluster 1904. It is elon-
gated along this same line from M 101, and is also a strong X-ray cluster.
Fig. 13. A 3.8 ksec PSPC X-ray exposure of the galaxy cluster Abell 1904. Opti-
cally the cluster is elongated back toward M101 (see M101, Appendix A, Fig.
8). The relatively short X-ray exposure here shows a flattening at the head of
the cluster perpendicular to the inferred motion and faint indications of X-ray
material trailing back toward M101 and 3C295.

193
We do not have high-resolution Chandra images, but we do have a rela-
tively short PSPC exposure. Fig. 13 here shows a flattening at the head of
the cluster perpendicular to the inferred line of motion and faint indica-
tions of X-ray material trailing back toward M 101 and 3C 295. The iso-
photes suggest an ablating central X-ray core, and it would be conclu-
sive if observations by Chandra were to confirm this.
Given all the preceding similar cases discussed in this preliminary sam-
pling of extended clusters, it would seem very unlikely that these align-
ments are due to chance. The evidence also includes multiple cases of
X-ray, quasar and galaxy material originating from an active galaxy and
actually travelling outward along the line of origin from the galaxy.

194
T he P er f ect l y E j ect ed Cl us t er
Another Catalogue entry is shown here in Fig. 14. Because the galaxies
are packed together so closely in the Abell cluster A 2400 (z = .088) and
A 2361 (z = .061) the SIMBAD plot has trouble drawing their individual out-
lines at this scale. In the present Figure they have been blacked in to give
Fig. 14. This is a replot of the lines of galaxies centered on NGC 7131 that was
shown in the main Catalogue. The SIMBAD[0] contours of individual galaxies
interfere with each other because they are so densely packed. As a result, the
galaxies in the line have been blacked in here for better visiblity.

195
the shape of the dense cluster elongations. NGC 7131 (z = .018) at the
center of the line is also blacked in.
The reason I suggest the characterization “perfect” is that the cluster lines
are so thin and so well centered on either side of the central galaxy. They
are even bent in slightly opposite directions at their ends, reminiscent of
the arms in a spiral galaxy. I have long considered the spiral arms to be a
result of ejection combined with rotation of the ejecting core of the gal-
axy (Arp 1963; 1986). I would be pleased to suggest the same explana-
tion for the NGC 7131 configuration. In any case, the observed galaxies
in Fig. 14 do not seem to call for any mathematical computations to es-
tablish the significance of the association. As to its probable cause we
can make the following comments.
S ummar y an d In t er pr et at ion
The observations considered so far suggest:
1) Jets emitting synchrotron radiation are ejected from galaxy nuclei
which are in an active phase.
2) As electrons and protons travel outward they combine into atoms and
evolve into compact sources that show redshifted atomic spectra.
3) When the sources impact galactic or intergalactic medium they slow
and can differentiate into smaller sources.
4) Lines of quasars and AGN’s generally evolve toward lower redshifts at
greater separations from the parent galaxy. But lower redshift material
can be entrained in the ejections and can furnish a gradient or mix of
redshifts out to some higher redshift objects.
The key question that must be answered is: What causes the intrinsic red-
shift of the ejected material? We assume here that the only explanation
which has yet to be empirically refuted is that low particle mass matter is
periodically created in the active nuclei, and that the atomic transitions
which give the observed redshift become more energetic as the particles
age and increase in mass. (Narlikar 1977; Narlikar and Arp 1993; Arp
1998).
What would be the expected consequences of such a model? First, if a
normal, hot plasma is ejected one would expect it to dissipate rather
than condense. In a low mass plasma, however, particle velocities would
slow in order to conserve momentum as particle masses grew. The gravi-

196
tational contraction forces would also increase. We would therefore ex-
pect the plasmoid to cool and condense. (Unlike the hot gas in the Big
Bang which would dissipate, and which therefore requires hypothetical
cold dark matter to form galaxies). At some point in the low mass plasma,
however, the ionized particles would start to combine into atoms. Initially
the redshift would be high, but as time went on stars would form, luminos-
ity would increase and the object would evolve into a normal, slightly
higher redshift companion galaxy.
The trail of X-ray sources that we observed from NGC 4636 to PG
1244+ 026 would then represent successive ejections of low mass plas-
moids which are evolving into the quasars and AGN’s with redshifts that
need now to be measured. The redshift of PG 1244+ 026 is z = .048; it is
important to note that there are three other galaxies within 29 to 38
arcmin of NGC 4636 that have redshifts of z = .046, .048 and .048. Two
of these are centered and aligned accurately across NGC 4636. It is
sugggested that they represent material ejected in diffferent directions
but of the same epoch as PG 1244+ 026.
PG 1244+ 026 is a strong X-ray source, an ASCA source, an infrared (IRAS)
source, and has drawn 65 published references. I should make the point
straightaway that although it is arbitrarily classified as an active galaxy
because of an absolute magnitude which would be MV = –21.2 if it were
at its redshift distance, it is in fact very compact and spectroscopically
continuous with the class of objects routinely called quasars. The fact that
it is much more active than the other galaxies of z = .048 in the vicinity
may reflect a larger initial quantity of ejected material, continuing mate-
rial ejection in this direction, or more interaction with material in its path.
In t er act ion of emer gin g j et w it h medium
Previous observations have shown that strong pairs of X-ray quasars
tended to be ejected along the minor axes of disk galaxies. This seems
natural, because in this direction an ejection would encounter the least
resistance on its way out of the galaxy. It was then shown that in cases of
very disrupted galaxies, the quasars tend to be smaller, more numerous
and closer to the galaxy of origin. It was reasoned that if the ejection was
not along the poles but through the substance of the galaxy, this would
disrupt the galaxy, and slow down and break up the material being
ejected. (See Arp 1998b; 1999a; 1999b.)
Aside from furnishing a satisfying explanation for the class of galaxies
which were obviously very morphologically disturbed in the outer regions

197
as a result of internal activity, this also suggested some physical charac-
teristics of the ejected plasmoids. Qualitatively the variable mass theory
would hypothecize an ionized (normal charges) plasma with near zero
particle masses of relatively large cross section. This substance would be
expected to interact strongly with the gas and/or gas plus magnetic field
of a galaxy or intergalactic medium. In this respect it reminds one of Am-
bartsumian’s “superfluid.” In 1957, by studying the Palomar Sky Survey
images, he suggested that new galaxies were born in this fashion. (See
Arp 1999a, p473.) Since the mass is near zero, the initial state would be
almost pure energy, and the expected initial outward velocity would be
near c. This high velocity would rapidly slow in order to conserve momen-
tum as the mass grew, and also as it pushed aginst the ambient medium.
Perhaps one of the best places to check our predictions against the ob-
servation is in the much-studied jet of M 87. (For a picture see Seeing Red
Plate 8-18.) There some of the smaller knots have translation velocities
along the jet which are very close to the speed of light (e.g., Lorentz fac-
tor 6, Biretta et al. 1999). Even though the channel along the jet must be
almost completely clear of matter between the knots, there is still obvious
ablation on the major knots. This implies that the plasmoids are still quite
fragile at this stage and can easily be disrupted, although they are not
dissipating like a hot gas. Nevertheless the initial energy of a plasmoid
capable of evolving into an average-mass companion galaxy must be
enough to punch through considerable galactic/intergalactic medium. In
the case of M 87 only 1.4 deg. farther out, and exactly along the line of
the jet, is a radio galaxy M 84 whose X-ray contours are compressed,
such that it is obviously moving out directly along the line of the jet. About
4.5 deg. from the center of M 87, and again exactly along the line of the
jet, is a bright quasar of redshift z = .085 with flanking pair of quasars at
z = 1.28 and 1.02 (Arp 1995 and present Catalogue entry for
PG 1211+ 143). As a result, we find objects of variously higher redshifts far-
ther out along the line of the synchrotron knots in the inner M 87 jet.
P er s is t en ce of ej ect ion dir ect ion s
In the interior of most galaxies there is probably ionized gas with embed-
ded magnetic fields. If an ejection entrains this gas, it should elongate
the magnetic lines of force along the length of the ejection. Subsequent
ejections of low particle mass plasmoids would then be guided out along
this same channel. If this channel stays fixed in space, as is apparently
the case with the M 87 jet, it offers an explanation of how we can find

198
lines of objects with a large spread in ages and intrinsic redshifts. Very low
redshift objects (of the same order as the ejecting galaxy) may represent
original material that has been entrained in the ejection.
If ejections take place in the disks of rotating disk galaxies, however, we
would expect the channels to be wound up in spiral form at least to some
extent. Measurements of spiral galaxies show that the magnetic fields ac-
tually do lie along the arms, and this leads to the suggestion that spiral
arms are actually ejection tracks from active nuclei along which stars are
being condensed. (See discussion in Arp 1963; 1969; 1986). This enables
Fig. 15 (Plate 15). The ScI galaxy NGC 1232 with a + 5,000 km/sec companion
off the end of a spiral arm. Farther in along the same arm, near a thickening, is
a small galaxy with a redshift of cz = .1. The image is from the VLT telescope of
the European Southern Observatory.

199
us to account for a baffling class of observations, namely higher redshift
companions attached to the ends of spiral arms of low redshift galaxies.
New Gal axies in t he Ar ms of NGC 1 2 3 2
Fig. 15 shows that NGC 1232 has a companion of + 4,900 km/sec excess
redshift lying off the end of one arm, and in the same arm a disturbed
region harboring a galaxy with a young stellar spectrum of redshift nearly
cz = 0.1c (Arp 1982; 1987). It is amusing to note that in both the
NGC 4151 and NGC 1232 cases the companions were reported as hav-
ing the same redshifts as the main galaxies to which they obviously be-
longed.
Fig. 15a. A long exposure in infrared wavelengths with the VLT shows that the
z = 0.1 galaxy has a tail, presumably due to its interaction with the bright swell-
ing in the spiral galaxy arm.

200
In both cases it was later determined that this was a mistake, and that the
companions actually had + 5,700 and + 4,900 km/sec higher redshifts.
Naturally they were then relegated to the background! But in the case of
NGC 1232B, Fig. 15 shows that an outer spiral arm leads directly to the
companion. The companion and the arm have the same resolution into
stars and HII regions, and this detailed picture seems to show clearly that
the galaxy is an aggregate of the same material as in the arm. Following
this arm back toward the center of the spiral leads to a flat section per-
pendicular to the arm, which looks like the beginning of a channel of just
the size along which the companion could have travelled.
Fig. 15 a-d (UBRI). The exposures, in clockwise order, show the discordant red-
shift galaxy and adjoining spiral arm in Ultraviolet, Blue, Red and Infrared
wavelengths. In U and B large emission regions are seen; in longer wave-
lengths the high surface brightness galaxy becomes dominated by a red nu-
cleus.
U B
R I

201
Farther inward, the brightest, thickest arm section anywhere in the galaxy
is encountered. The object next to this unusual section of the arm aroused
my curiosity, and on one of my last runs on the Las Campanas 2.5 meter
telescope I took its spectrum. It turned out to have a redshift of
cz = 28,000 km/sec or z = 0.1. If it can be demonstrated that it is at the
same distance as the cz = 1,603 km/sec main galaxy, of course, this is ir-
refutable proof of a discordant redshift. It had been noted earlier that it
showed no sign of reddening or obscuration, which would be expected if
it were seen through the dusty plane of the spiral. Because of its impor-
tance we show here a series of magnified views from the 8 meter VLT
which were taken in its commissioning period, I deep (Fig. 15a shows an
interaction tail toward the thickened arm!). In addition, lighter images in
Fig. 15 UBRI (Ultraviolet, Blue, Red and Infrared) show:
a) Fig. 15 U - a faint nucleus to the galaxy and paired knots closely
across it NW-SE.
b) Fig. 15 B - the knots get very large and much brighter, implying per-
haps OII emission at the z = 0.1 redshift.
c-d) Fig. 15 R, I - the knots get fainter and the nucleus gets brighter until
the I wavelength, where the object looks like a high surface bright-
ness dwarf with a red nucleus.
The spectrum I took in 1982 showed a young galaxy. Now we see that it is
morphologically disturbed. Moreover, the HII region in the anomalous
redshift object would be astonishingly large at its redshift distance. It is
absolutely crucial to put the slit of the spectrograph along this galaxy
and register the lines and their redshifts in its various parts. There is an-
other bright emission region in these pictures, just to the ENE of the z = 0.1
object. It may be similar and should also be investigated spectroscopi-
cally.
In fact there are a number of regions in the arms of this galaxy which
could now be systematically investigated with large new telescopes, fast
detectors and multislit spectra. I find it rather shocking that while a galaxy
like NGC 1232 is often observed for its esthetic value, scientists do not
even inspect the objects that are of the most fundamental importance to
astronomy and physics. Detailed papers published in professional jour-
nals and in books calling attention to such objects are ignored. The indi-
cations are that we may encounter in these arms a whole new world of
astronomy and physics that we have not before imagined.

202
Quas ar s in t he Ar m of NGC 7 6 0 3
Another example of high redshift objects in galaxy ejections/arms makes
the previous case especially significant. NGC 7603 (Atlas of Peculiar
Galaxies No. 92) shows a companion on the end of a spiral arm-like con-
nection which is + 8,000 km/sec relative to the parent galaxy (Fig. 16).
Ironically, after 30 years, Fig. 17 (color) shows that the two quasar-like,
high redshift objects (z = .24 and .39) have recently been measured in
this same connecting filament by two young Spanish astronomers in Te-
nerife (López-Corredoira and Gutiérrez 2002). The results, moreover, fit
well with the model we have suggested here, wherein a plasmoid en-
trains a trail of matter from the ejecting galaxy, is slowed and evolves into
a high redshift companion. Subsequent ejections follow this magnetic
tube, and we see two now in an earlier stage of evolution at z = .24 and,
closest to the Seyfert, z = .39. The evidence is summarized in two color
pictures included here as Fig. 16 and 17. It is remarkable that we can
now support the evolutionary sequence in NGC 1232, where the redshifts
drop outward along the arm from the central low redshift galaxy to z = .1
and then to .02. In NGC 7603 they go to z = .39 to .24 to .06.
Fig. 16 (Plate 16). The active Seyfert galaxy NGC 7603 has a + 8,000 km/sec
companion on the end of an arm-like filament.

203
Fig. 17 (Plate 17). After 30 years, the two marked, quasar-like, high redshift ob-
jects have now been discovered in the filament from NGC 7603 with the Nor-
dic Optical Telescope of La Palma (López-Corredoira and Gutiérrez 2002).

204
In all of the above cases we would argue that low particle mass plas-
moids had been guided out along the spiral arms. There is a disturbance
in the NGC 1232 arm where the cz = 0.1 c object lies, and this may be
connected to unexplained “swellings” in the spiral arms of galaxies, as in
NGC 4151, for example. (See Fig. 18a and b in the next section.) It is dif-
ficult to overestimate the rewards that might await some courageous user
of modern big telescopes on these obvious targets.
The story of NGC 7603 just by itself is a poignant example of crucial sci-
entific evidence ignored and fundamental theoretical progress sup-
pressed. As related at the end of the Introduction to this book, Fred Hoyle
in 1972 singled out the discordant companion in 1976 as forcing a crisis
in Astronomy. But the latest observational evidence on the quasar like ob-
jects in the connection to this companion was rejected by several refe-
rees and journals until it was finally published in A & A. Follow-up observa-
tions on this discovery were not allowed by Allocation Committees (TAC’s)
on the Chandra X-ray satellite and the southern Very Large Telescope
(VLT). It reminds one of large corporations whose boards of directors as-
sure the public of large profits while the shareholders are losing large
amounts of money.

205
E j ect ed Obj ect s f r om NGC 4 1 5 1
One of the original active galaxies discovered by Karl Seyfert was
NGC 4151. An extensive study of companion galaxies in its neighborhood
was published 26 years ago (Arp 1977). Detailed morphological evi-
dence was presented at that time to the effect that the companion which
lay off the end of the NE spiral was in fact connected to that arm. On the
end of the opposite, SW arm was a similarly connected peculiar com-
panion. That was before the era of X-ray observations. Today both are
listed as X-ray galaxies with redshifts of z = .022 and z = .022. (Fig. 18a.)
The two companions form a well aligned and centered pair about 4.7
arcmin on either side of this famous active Seyfert Galaxy. The implication
Fig. 18a. Schematic representation of NGC 4151 and companions. Low sur-
face brightness features are marked with a dashed line. Galaxies in the chain
west of NGC 4151 are numbered 1 through 5. The BL Lac quasar is about 4.5
arcmin N of NGC 4151 and has a redshift of z = .615. For more details see
Arp 1977.

206
is that proto galaxies were ejected in opposite directions from the active
nucleus and evolved into young, higher redshift galaxies as they travelled
out along, or drew out, the main spiral arms of NGC 4151. In this regard
they are very much like the configuration shown in NGC 1232. There are
even swellings in the arm of NGC 4151 (Fig. 18b) which resemble the
thickening of the arm in NGC 1232—a thickening which is near the dis-
cordant redshift galaxy of z = 0.1. There is a very powerful (257 X-ray
counts/kilosec) BL Lac object of z = .615 just above a similar point of the
Fig.18b. Sky limited KPNO 4 meter exposures have been stacked to show faint
surface brightness features in the exterior of the famous Seyfert galaxy
NGC 4151. The ScI galaxy NGC 4156 to the NE and the companion to the SW
have excess redshifts of + 5,700 and + 5,400 km/sec. Note the thickening of
the arms in several places, as in NGC 1232 (Fig. 15)

207
arm in NGC 4151. Also in NGC 4151 a straight chain of galaxies leads
back toward the ejecting companion NGC 4156. The chain has redshifts
that range from z = .06 to .24, a configuration that can be better under-
stood now in the context of the galaxy cluster associations presented
here in the main Catalogue of Discordant Redshift Associations. The high
redshift companions on and in spiral arms can also be better understood
as associations where the ejecta have been slowed by interaction with
the parent galaxy, which then slows the ejection speed and causes the
galaxy to evolve close to its parent.
The alarming aspect of all of this, however, is that as the torrent of data
from ever more telescopes and astronomers floods in, it is not placed in
the context of previous results. In the case of NGC 4151, the X-ray nature
of the two companions was treated as if these were just more back-
ground objects to be fitted to the current assumptions about a homoge-
neous universe. If the researchers knew about the extensive results pub-
lished many years previously, they could have considered the possibility
that their results, in fact, disproved those fundamental, current assump-
tions. For example, if the surveys of ultra luminous X-ray sources (e.g.,
Colbert and Ptak 2002; Roberts et al. 2001; Foschini et al. 2002) had ref-
erenced the data on BL Lac objects associated with active Seyferts (Arp
1997), it would have been obvious that the ultraluminous X-ray sources
could be primarily BL Lac type quasars in the process of ejection from low
redshift galaxies. (See G. Burbidge, E.M. Burbidge, H. Arp A & A 400, L17.)

208
A B ul l et t o a Gamma R ay B ur s t
In the main Catalogue and Fig. 1 of the M 101 Appendix we have given
examples of gamma ray bursters aligned with ejection directions from
active centers. We have also shown connections in high energy gamma
rays between galaxies and quasars of vastly different redshifts (Intro Fig.
15 and Arp, Narlikar and Radecke 1997). This evidence strongly indi-
cated that not only high energy X-rays, but even higher energy gamma
rays appeared along the track of the ejection. The nature of the ejection,
however, may have been further elucidated by the recent discovery of
Fig. 19. The “hottest” X-ray cluster known, 1E 0657-56 is pictured here in X-rays
by the Chandra satellite (Markevitch et al. 2002). The bow shock trails the “bul-
let,” which is deduced to be colder material impinging on a warmer environ-
ment. The redshift of the galaxy cluster is 0.296!
277°
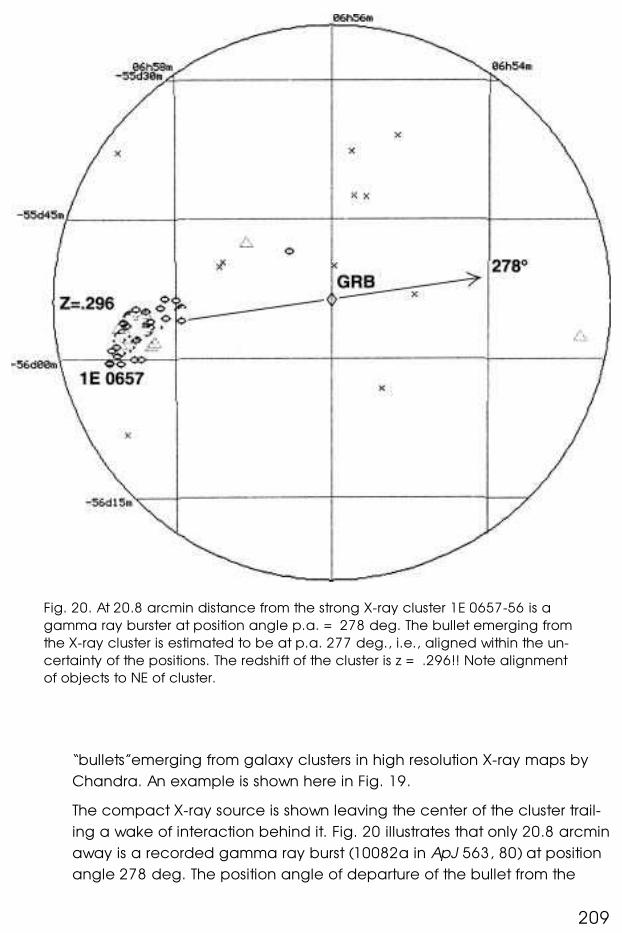
209
“bullets”emerging from galaxy clusters in high resolution X-ray maps by
Chandra. An example is shown here in Fig. 19.
The compact X-ray source is shown leaving the center of the cluster trail-
ing a wake of interaction behind it. Fig. 20 illustrates that only 20.8 arcmin
away is a recorded gamma ray burst (10082a in ApJ 563, 80) at position
angle 278 deg. The position angle of departure of the bullet from the
Fig. 20. At 20.8 arcmin distance from the strong X-ray cluster 1E 0657-56 is a
gamma ray burster at position angle p.a. = 278 deg. The bullet emerging from
the X-ray cluster is estimated to be at p.a. 277 deg., i.e., aligned within the un-
certainty of the positions. The redshift of the cluster is z = .296!! Note alignment
of objects to NE of cluster.

210
galaxy cluster is 277 deg. Within the uncertainty in the gamma ray posi-
tion and the uncertainty of the center of the cluster, the directions are es-
sentially coincident. It appears that the X-ray ejecta has recently pro-
duced a gamma ray outburst, as more famous quasars like 3C279 are
known to do.
What is intensely interesting about the wake that the bullet is leaving is
that, as the discoverers of this phenomenon have emphasized (see sec-
tion 5 here on Abell 3667), the outgoing material is colder than the me-
dium it is passing through. Thus a very compact, cold plasmoid is emerg-
ing from some central object. If it is to evolve into a quasar, and then a
galaxy, this seed must exist in a low entropy, almost massless state. The
charged, initially low particle masses could be frozen into this state by
tangled magnetic fields in their environment, and guided by directional
fields. The initial energy of ejection, however, has to be large enough to
permit escape into the field.
It is intriguing to compare this empirical conclusion with conventional pos-
tulates of cold dark matter (necessary to condense galaxies) and dark
energy (necessary to explain redshift discrepancies with conventional dis-
tances). Cosmologists have had to assume that these undetected sub-
stances were created in the Big Bang and that they permeate the current
universe. In the observations presented here, we would argue that we are
actually witnessing the birth (or perhaps reemergence) of matter, which is
evidently in a cold state. We can then infer that the charged particles
combine into atoms, and observe the sequence of their physical forms as
a function of time. In my opinion the Machian type theory of Hoyle and
Narlikar with variable particle masses (see end of Introduction) would then
be more physically relevant than the current General Relativity theory.

211
A Quas ar w it h an Abl at ion T ail
Fig. 21 presents, on the right, a Chandra X-ray map of a bright, very ac-
tive quasar. It shows what the discoverers call the “longest X-ray jet de-
tected at high redshift” (Siemiginowska et al. 2002). But the HST image on
the left shows at least four very disturbed galaxies just at the tip of the jet. I
would suggest here that it is not a jet at all, but a trail of material ablated
from the quasar as it passed through the denser medium associated with
the interacting group.
In support of this interpretation the following arguments can be made:
1) The interacting group of galaxies is very unusual, and there would be
an extremely small chance of them falling accidentally at just the be-
ginning of the X-ray trail.
2) The “jet” is completely one sided.
3) It originates at the far boundary of the group (Fig. 22).
4) It is broader at its origin at the quasar and narrows down the tail.
5) The X-ray contours are compressed at the head of the quasar in the
direction of the motion (see Fig. 23).
Fig. 21. On the right is the Chandra, X-ray image of the quasar J113007.-
144927 (V = 17.2, z = 1.187) showing the “longest X-ray jet detected at high
redshift” (Siemiginowska et al. 2002). On the left is a Space Telescope (HST)
image, on the same scale, of an interacting quartet of galaxies at the tip of
the “jet.”

212
6) The trail of material does not originate at the center of the quasar
image, but enters it slightly, but definitely to the SSE of center .
7) The relatively lower fequency radio emission at 1.4 GHz trails behind
each of the X-ray knots A, B, C indicating the older radio plasma is
being stripped as the X-ray knots move through the medium in the di-
rection of the quasar. (Fig. 23)
I would attribute the small displacement of the tail from the center of the
quasar to a small counterclockwise rotation of the quasar spinning the
material off to the side as it ablates (like throwing a curve in baseball).
Fig. 22. Overlay of the X-ray contours on the optical image showing relation of
X-ray tail to the interacting quartet at z = .312 (Siemiginowska et al. 2002).

213
If we adopt the low particle mass plasmoid model for the quasar, then for
the first time this object might enable us to make some estimates of den-
sity and cohesion properties of the substance from which the gal-
axy/quasar is actually evolving, and perhaps, very importantly, the slow-
ing effect of the intergalactic medium on ejected quasars. I find that
prospect very exciting.
Fig. 23. X-ray (grey scale) overlayed with 1.4 GHz radio contours (Siemiginowska
et al. 2002) showing displacement of radio knots downstream from the X-ray
knots in the ablating quasar.

214
Fig. 24 shows that the quasar is only 40 arcmin from a large galaxy
(NGC 3715, z = .007). It is a typical configuration, as we have seen here
in many cases in the main Catalogue of Discordant Redshift Associa-
tions, and I would interpret it as an ejected quasar. At this distance from
the main galaxy it has run through a group of earlier ejected galaxies.
(The redshift of the group is .312, or in the reference frame of the galaxy,
z = .302, essentially exactly on a principal quantized redshift peak.) Hy-
drogen absorption lines of this redshift are identified in the quasar, show-
ing that the HI is spread over the area of the group and beyond. A strong
X-ray cluster of galaxies (Abell 1285 at z = .105) extends generally SW in
the direction of the quasar from the NGC galaxy.
Fig. 24. The IRAS galaxy NGC3715 is about 40 arcmin distance from the bright
PKS quasar. The position angle of the minor axis of the galaxy is p.a. = 50
deg.; the direction from the quasar to the galaxy is p.a. = 30 deg.; and its tail
is at p.a. = 44 deg. Abell 1285 is a strong X-ray cluster.

215
T he S un yaev-Z el dovich E f f ect
Near the end of the preceding Appendix A, the conventional large dis-
tances found for galaxy clusters from the S-Z effect are discussed in rela-
tion to the much smaller distances obtained from the observations pre-
sented throughout the current Catalogue. We will now attempt to sketch
a plausible scenario for the formation of nearby clusters of lower luminos-
ity galaxies.
A mechan is m t o pr oduce cl us t er s of gal axies
The best example of quasars that have been stopped near a very dis-
rupted galaxy is the group of 18 quasar/AGN’s of 2.389 ≤ z ≤ 2.397 only
1.5 arcmin S of the extremely disrupted blue radio galaxy 53W003 (Keel
et al. 1998; Keel et al. 1999; Arp 1999b). In this unusual group the objects
are faint, suggesting that a larger object may have broken into smaller
objects. Most noteworthy is his regard is that some of the broad line qua-
sars are not point sources, but HST images show them as almost comet
shaped objects—surely a sign of unusually strong interaction with a me-
dium. The Keel et al. (1999) analysis makes a very cogent remark: “The
objects from our emission candidate list that have been spectroscopi-
cally confirmed are all obvious AGNs, with a mix of broad- and narrow-
lined cases.” Since the broad line-narrow line criterion is usually used to
separate quasar from galaxy spectra, this suggests that if the material in
a normal broad line quasar is spread out, one will get naturally lower gas
densities and hence narrow lines. The difference between a quasar and
a galaxy of the same redshift would then be due only to its interaction his-
tory.
To carry this thought forward to the elongated clusters of galaxies we
have discussed in the present paper, we have remarked that a low parti-
cle mass plasmoid could differentiate into smaller pieces when interact-
ing with a medium or normal mass clouds. In fact an encounter with a
medium of small cloudlets might separate a plasmoid into many smaller
units. These smaller, less compact units would naturally be strung out in a
line in the direction of ejection. We might conclude that this is a possible
way of turning an ejected X-ray quasar, or proto quasar, into an elon-
gated cluster of X-ray galaxies. Since the three principle kinds of extra-
galactic X-ray objects known are X-ray galaxies, X-ray quasars and X-ray

216
clusters, it would be very satisfying to unify the class by positing that the
X-ray ejections come out of the dense, energetic nuclei of galaxies and
evolve into the emission line, X-ray quasars and the non-equilibrium, ac-
tive clusters of galaxies.
One of the most vexing problems in the subject of galaxy clusters has
been “cooling flows.” Why is the strongly radiating gas not cooler near
the center of the clusters? After many complicated models it has finally
been realized that most of these clusters have an active AGN at their
centers. The irony here is that the plasmoids intermittently ejected from
these central AGNs must be cool if we are to identify low particle masses
as the cause of the high redshifts of the proto quasar/galaxies. (The
charged particles would initially be frozen into the plasmoid by the mag-
netic fields.) But the evidence developed in this Catalogue would suggest
that the kinetic energy of the ejected plasmoids could heat the intra-
cluster medium. The tangential arcs observed in clusters then would then
be associated with compression shells generated in explosions from a
spherical nucleus during the process of intermittent ejections.
R ef er en ces
Arp, H. 1963, “On the Evolution of Galaxies,” Scientific American, 208, 70
Arp, H. 1968, Astrofiz ika 4, 59
Arp, H. 1969, “On the Origin of Siral Arms in Galaxies,” Sky and Telescope p. 385, De-
cember 1969
Arp, H. 1977, ApJ 218, 70
Arp, H. 1982, ApJ 263,54
Arp, H. 1986, IEEE Transactions on Plasma Science, 14, 748
Arp, H. 1987, Quasars, Redshifts and Controversies, Interstellar Media, Berkeley
Arp, H. 1995, A & A 296, L5
Arp, H. 1996, A & A 316,57
Arp, H. 1997, A & A 319, 33
Arp, H. 1998a, Seeing Red: Redshifts, Cosmology and Academic Science, Apeiron,
Montreal
Arp, H. 1998b, ApJ496,661
Arp, H. 1999a, IAU Symp 183, 290 and 473
Arp, H. 1999b, ApJ 525,594
Arp, H. 2001, ApJ 549, 780
Arp and Russell. 2001, ApJ 549, 802
Arp, H, Narlikar, J., Radecke, H.-D. 1997, Astroparticle Physics 6, 387

217
Biretta, J. A.; Perlman, E.; Sparks, W. B.; Macchetto, F. 1999, The Radio Galaxy M 87, eds.
Röser, H-J., Meisenheimer, Springer, 210
Böhringer, H. et al. 2000, ApJS 129,435
Buote, D., Canizares, C. 1966, ApJ 457, 565
Brandt, W., Hornschemeier, A., Schneider, D., et al. 2000, AJ 119, 2349
Cappi, M., Mazzotta. P., Elvis, M., et al. 2001, ApJ 548, 624
Colbert, E. Ptak, F. 2002, ApJS 143, 25
Crawford, C., Allen, S., Ebeling, H., Edge, A., Fabian, 1999, MNRAS 306, 857
Ebeling, H., Edge, A. C., Allen, S. W., Crawford, C. S., Fabian, A. C., Huchra, J. P. 2000,
MNRAS 318, 333
Foschini, L., Di Cocco, G., Ho, L., et al. 2002, astro-ph/0206418, /0209298
Jones, C.; Forman, W.; Vikhlinin, A.; Markevitch, M.; David, L.; Warmflash, A.; Murray, S.;
Nulsen, P. 2002, ApJ 567, L115
Keel, W., Windhorst, R. Cohen, S., Pascarelle, S., Holmes, M. 1998, NOAO Newsletter 53,
1
Keel, W., Cohen, S., Windhorst, R., Waddington, I. 1999, AJ 118, 254
López-Corredoira, M. Gutiérrez, C. 2002, astro-ph/0203466 and A&A 390, 15L
Markevitch, M., Gonzalez, A., David, L., Vikhlinin A., Murray S., Forman, W., Jones C.,
Tucker, W. 2002, ApJ 567, 27
Matsushita, Kyoko; Makishima, Kazuo; Ikebe, Yasushi; Rokutanda, Etsuko; Yamasaki, No-
riko; Ohashi, Takaya 1998, ApJ 499, L13
Narlikar, J. 1977, Ann. Physics 107, 325.
Narlikar, J., Arp, H. 1993, ApJ 405, 51
Pietsch, W., Arp, H. 2001, A & A 376, 393
Radecke, H.-D. 1997, A & A 319, 18
Roberts, T., Goad, M. and Ward, M. 2001, MNRAS. 325, L7
Rosati, P., Lidman, C., della Ceca, R.; Borgani, S., Lombardi, M., Stanford, S. A., Eisen-
hardt, P. R., Squires, G., Giacconi, R., Norman, C. 2000, Messenger 99, 26
Röser, H-J., Meisenheimer, K. 1997, The Radio Galaxy M 87, Springer
Siemiginowska, A., Bechtold, J., Aldcroft, T., Elvis, M., Harris, D., Dobrzycki, A. 2002, ApJ
570, 543
Stockton, A., Ridgeway, S. 1998, AJ 115
Struble, M., Rood H. 1999, ApJS, 125, 35
Vikhlinin, A., Markevitch, M., Murray, S. 2001, ApJ 551,160
Wilson et al. 2001, ApJ 546
Worral, D., Birkinshaw, M., Hardcastle, M. 2001, MNRAS.


219
Glossary
Absolute magnitude The brightness (measured in magnitudes) that an object would have if
observed from a distance of 10 parsecs (32.6 light years).
Absorption line Energy missing from the spectrum of an object in a narrow range of
wavelengths, owing to absorption by the atoms of a particular element.
The spectrum shows a black line where a characteristic color line would
appear in case of emission of the same wavelength by the atoms.
Active galaxy A galaxy with extremely high emission of radiation especially in the high-
energy range: UV-radiation, X-rays, Gamma rays. Well-known examples
are Seyfert galaxies, Markarian galaxies, radio galaxies, BL Lac objects,
and quasars.
A posteriori probability The probability, after an event has occurred, that it would occur.
Apparent magnitude The brightness that an object appears to have at its actual distance,
measured in magnitudes. (The faintest stars visible to the unaided eye
are about 6th magnitude, and the faintest stars and galaxies
photographed in large telescopes are about 30th magnitude).
A priori probability The probability, before an event has occurred, that it will occur.
Barred spiral A spiral galaxy in which the spiral arms unwind from a spindle shaped
“bar” of stars that forms the galaxy’s inner region.
Beppo Sax X-ray astronomy satellite initiated by the Italian Space Agency
Big Bang theory The theory that the universe began its expansion at a particular point in
space-time.
BL Lac objects Objects with spectra dominated by non-thermal, continuum radiation.
Morphologically a transition between quasars and galaxies. Marked by
very strong radio and X-ray emission.
BSO Blue stellar (appearing) object.
Bremsstrahlung Radiation emitted by a charged particle which is de- accelerated if it
encounters an atom, molecule, ion etc.
CCD “Charge coupled device”: Light-sensitive electronic chips used in
modern astronomy to record and to measure the light received.
Chain of galaxies A group of four or more galaxies that roughly form a line on the sky.
Chandra X-ray astronomy satellite launched by NSA with highest resolution
Compact source A region emitting large amounts of visible, radio or X-ray energy from a
small apparent area on the sky.
Companion galaxies Smaller galaxies accompanying a large, dominant galaxy in a galaxy
pair or group.
CRSS Cambridge ROSAT Serendipity Survey

220
cz Redshift expressed in units of the speed of light (c = 300,000 km/sec)
Dark matter Matter invisible to present astronomical instruments.
Deconvolution A mathematical operation which helps to restore the true characteristics
of an observed object. If the influence of the instrument (e.g. the point
spread function) is known, the process allows the actual shape and
intensity of the object to be better seen.
Declination An angular positional coordinate of astronomical objects, varying from 0
degrees at the celestial equator to 90 degrees at the celestial poles.
Discordant redshifts Redshifts which are other than expected at the distance of the object.
Dss2 Digital sky survey (from ESO)
∆z The difference between two redshifts: z1 – z2 = ∆z.
Electron An elementary charged particle, a constituent of all atoms, with one unit
of negative electric charge.
Emission line A “spike” of excess energy within a narrow wavelength range of a
spectrum, typically the result of emission of photons from a particular
type of atom in an excited state.
ESO European Southern Observatory
Excited state An orbital state of an atom in which at least one electron occupies an
orbit larger than the smallest allowed orbits. If an electron jumps to a
lower orbit it emits a photon with an energy characteristic of the
separation of both orbits. The result is an emission line in the spectrum of
the atom.
EXSS Extended X-ray Source Survey. From Einstein satellite observations,
usually indicates clusters of X-ray galaxies.
Frequency
(of radiation)
The number of times per second that the photons in a stream of photons
oscillate, measured in units of hertz or cycles per second.
Galactic rotation The collective orbital motion of material in the plane of a spiral galaxy
around the galactic center.
Galaxy An aggregate of stars and other material which forms an apparently
isolated unit in space, much larger than star clusters (which are normal
constituents of galaxies).
Gamma rays A particular type of electromagnetic radiation of very high frequency
and very short wavelength. Its origin is processes within the nucleus of an
atom.
Globular cluster A star cluster of spherical shape containing up to several 100 000 stars
of very high age. Globular clusters form a spherical halo around the
Milky Way and other galaxies.
Gravitational lens An object with a large mass that bends the paths of photons passing
close to it.
H0The Hubble constant defined as the ratio of a galaxy’s redshift to its
distance (distance often estimated from its apparent magnitude); its
value is generally quoted as H0 = 50 to 100 km s–1 Mpc–1.

221
HI Neutral (non-ionized) hydrogen, usually observed by radio telescopes,
which detect the radio emission arising from the transition between
different states of spin alignment of the atom’s electron and the proton
in its nucleus.
HII region A gaseous clump of predominantly ionized hydrogen, excited by young,
hot stars within it, and which therefore shows conspicuous emission lines.
HRI High Resolution Instrument on the ROSAT X-ray Telescope
Hubble constant See H0
Isophotes Lines connecting points of equal intensity on a skymap.
Jet A linear feature, much longer than it is wide, usually straight, and
inferred to arise from collimated ejection of material.
Karlsson formula The mathematical expression for the peaks observed in the redshift
distribution of quasars. (1 + zi + 1) = 1.23(1 + zi) or ∆log(1 + z) = .089.
Late type galaxies Galaxies showing a rotational disk and increasing amounts of young star
population.
Light year The distance light travels in one year, approximately 6 trillion miles or 10
trillion kilometers.
Local Group The small cluster of about 20 galaxies that includes our Milky Way and
the giant spiral (Sb) galaxy, the Andromeda Nebula (M31).
Local Supercluster The largest nearby aggregation of groups and smaller clusters of
galaxies, with the rich Virgo Cluster of galaxies near its center.
Luminosity class Classification scheme of stars according to their luminosity. It extends
from class I for supergiants to class VI for white dwarfs. Also for galaxies I-
IV with I having the best-defined spiral arms.
M “Messier.” A catalogue of nebulae, clusters, and galaxies compiled by
Ch. Messier in 1784 (e.g. M87).
Magnitude A measure of objects’ brightness in which an increase by one
magnitude indicates a decrease in brightness by a factor of 2.512.
Markarian galaxy Galaxy with stron ultraviolet emission discovered in surveys by the
Armenian astronomer B. E. Markarian = Infrared Astronomical Satellite
measuring apparent magnitudes of sources in the infrared at 12, 25, 60
and 100 microns.
MERLIN Multi-Element Radio Linked Interferometer Network at Jodrell Bank,
England
Milky Way Our own galaxy, a spiral galaxy in the Local Group of galaxies.
Minor axis The axis about which a galaxy rotates. (It is perpendicular to the disk).
Mpc (megaparsec) One million parsecs.
NGC “New General Catalogue of Nebulae and Clusters of Stars.” A
catalogue published in 1888 by J. Dreyer. It contained 7840 star
clusters, nebulae, and galaxies. Appendices (called IC = Index
Catalogue) extended it to more than 13,000 objects.

222
Objective prism A wedge-shaped glass that provides small spectra of an entire field of
bright sources.
Parsec A unit of distance, equal to 3.26 light years.
Peculiar galaxy A galaxy which does not have the standard, symmetrical form of most
galaxies.
Photon The elementary particle that constitutes light waves and all other types
of electromagnetic radiation.
Plasmoid A dense cloud of ionized particles.
Point Spread Function
(PSF)
The mathematical function describing now the light of a point-like
source is spread out while passing through an astronomical instrument.
The resulting image is not a point but a small disk whose radius is
determined by the interaction of the radiation with the instrument.
Probability of
association
If no physical association exists between objects, the probability that an
observed configuration is a chance occurrence. Technically it is one
minus the chance probability.
PSPC ROSAT photon counting X-ray telescope with a field about 55 arcmin.
Quantization The property of existing only at certain, discrete values.
Quasar A pointlike source of light with a large redshift, often a source of radio
and X-ray emission as well.
Radio lobe Radio emission from appreciably extended areas on either side of a
galaxy, often connected to the galactic nucleus by a radio-emitting jet.
Radio source An astronomical object that emits significant amounts of radio waves.
Redshift The fractional amount by which features in the spectra of astronomical
objects are shifted to longer (redder) wavelengths.
Redshift-distance law The hypothesis that an object’s distance from us is proportional to its
redshift (the usual interpretation of Hubble‘s law).
Redshift periodicity The tendency of observed redshifts to occur with certain values at
certain well-defined intervals from one another.
REX Radio X-ray source
ROSAT The German built, X-ray (Röntgen) Telescope
Right ascension An angular coordinate of an astronomical object, measured eastward
around the celestial equator (0 to 24 Hours) from the vernal equinox.
Schmidt telescope A telescope with both a reflecting mirror and a correcting plate which
can photograph a relatively large portion on the sky without distortion.
Seyfert galaxy A special type of active galaxy (mostly spirals) detected by C. Seyfert.
Seyfert galaxies are characterized by extremely bright cores whose
luminosity shows extensive variability. They are also bright in infrared
radiation and X-rays.
Spectrum The intensity of light from an object at each wavelength observed, using
a prism or a grating. The result is a sequence of colored lines or strips
characteristic of the chemical elements that emit the light.

223
Spiral galaxy A galaxy in which the bright stars and interstellar gas and dust are
arranged in a rotating, flattened disk within which prominent spiral arms
of young stars and H II regions are visible. Spiral galaxies are classified
as Sa, Sb, Sc (or SBa, SBb, SBc... if they are barred spirals). This sequence
represents decreasing diameters of the central bulge and increasing
separation of the individual spiral arms. An “I” added to the classification
supposedly indicates high luminosity.
Starburst galaxy A galaxy with an exceptionally high rate of star formation.
Supernova An exploding star, which becomes (temporarily) thousands of times more
luminous than the brightest normal star in galaxy.
Synchroton radiation Radiation emitted by charged particles moving at nearly the speed of
light whose trajectories are bent in a magnetic field.
Tully-Fisher distance For rotating galaxies, a correlation found by R.B. Tully and J.R. Fisher
between the luminosity and the width of the 21-cm radio line. It allows,
in principle, to estimate the mass and hence the luminosity of a galaxy
from the profile of its 21-cm line, and hence its distance.
Universe All observable or potentially observable matter that exists.
Wavelength The distance between two successive wave crests in a series of
sinusoidal oscillations.
X-rays A particular type of electromagnetic radiation, of high frequency and
short wavelength.
X-ray source An astronomical object that emits significant amounts of X-rays.
z The symbol for redshift, defined as the displacement of spectral features
in wavelength, expressed as a fraction of the original wavelength
z = ∆λ/λ.
zoMeasured redshift transformed into the rest frame of the parent galaxy,
i.e., (1 + z0) = (1 + z)/(1 + zgal).


225
Index of Objects 3C 273, 2, 25
3C 274, 2, 25
3C 275.1, 23
3C 281, 23
3C 295, 147, 149, 150, 151, 152, 158, 160,
164, 179, 190, 193
3C 303, 158, 160
3C 330, 108
3C 343.1, 18, 23, 138
3C 351, 114, 115
3C 435, 21
3C 441, 20
3C 458, 136
4B 940216, 56
4C-04.85, 128, 129
A 1209, 86
A 1375, 90
A 2361, 124, 126, 194
A 2400, 124, 126, 194
A 27.01, 66, 141
A 3651, 181
A 3667, 180, 181
Abell 1738, 160
Abell 1767, 149, 160
Abell 1904, 149, 151, 160, 190, 192
Abell 214, 54
Abell 2361, 124
Abell 2400, 124
Abell 2552, 138, 178, 179
Abell 3667, 44, 160, 210
Abell 370, 160, 184
Absolute magnitude, 219
Absorption line, 219
ACO 104, 187
ACO 1060, 84
ACO 1209, 86
ACO 2644, 142
ACO 2659, 140
Active galaxy. See Galaxies:active
Apparent magnitude, 219
Arp 220, 12, 13, 151, 166
Arp 227, 136
Arp 295, 142
AS 963, 118
Big Bang, 219
BL Lac, 219
Blue Stellar Object, 219
bremsstrahlung, 219
BSO. See Blue Stellar Object
Cambridge Catalogue of Radio Sources.
See 3rd Cambridge Catalogue of Radio
Sources
CASG 673, 102
Clusters of galaxies
Local Supercluster, 221
Virgo Cluster, 221
CRSS J0030.5+ 2618, 187
dark matter, 220
deconvolution, 220
Dreyer, J., 221
ESO 185-54, 160
ESO 185-G4, 181
ESO 359-G019, 67, 141. See A 27.01
ESO 476-20, 54
ESO 567-33, 76
Fisher, J.R., 223
Galaxies
active, 219
dominant, 219
spiral, 223
HCG 66, 149
HCG 97, 142
HE 1013-2136, 76
Hubble constant, 220
Hubble relation, 220, 222
Hubble, E., 221
Index Catalogue, 221
Local Group, 221
M 101, 46, 54, 80, 112, 146, 147, 148, 149,
150, 152, 154, 155, 156, 157, 158, 159,
160, 161, 162, 163, 166, 190, 192, 208
M 31, 32
M 49, 95
M 81, 32, 163
M 82, 23
M 87, 23, 92, 166, 169, 197, 217
Markarian galaxies, 219
MCG+ 01-27-016, 78
MCG+ 08-29-005, 106
MCG-02-27-009, 80
MCG-04-51-007, 118
Messier
M31, 221
Messier, Charles, 221
Mrk 205, 22, 68, 80
Mrk 231, 154, 155, 158, 169
Mrk 273, 112, 147, 149, 150, 154, 155
Mrk 335, 48

226
Mrk 348, 33
Mrk 463, 98
Mrk 474, 155
Mrk 477, 155, 158
Mrk 478, 100
Mrk 485, 102
Mrk 501, 112
Mrk 66, 155, 160
Mrk 876, 108
Mrk 892, 114, 115
Mrk 91, 70
MS 1512+ 36, 152
MS 2137.3-2353, 118, 120
NGC 1068, 160, 184
NGC 1097, 110
NGC 1232, 199, 201, 202, 204, 206
NGC 1275, 66
NGC 214, 52, 187, 188, 189
NGC 2361, 124
NGC 2435, 68, 69
NGC 2600, 70
NGC 262, 33
NGC 2639, 10
NGC 2649, 72
NGC 3023, 61, 74, 75
NGC 309, 31, 32, 35
NGC 3312, 84
NGC 3314, 84
NGC 3516, 7, 9, 92
NGC 3593, 86
NGC 3628, 24
NGC 3865, 90
NGC 4151, 35, 64, 176, 199, 204, 205, 206,
207
NGC 4156, 207
NGC 4235, 5, 15
NGC 4253, 66
NGC 4258, 5, 15, 68
NGC 4319, 22, 80
NGC 4410, 94, 95
NGC 4636, 171, 174, 175, 176, 178, 196
NGC 470, 2, 177
NGC 474, 2
NGC 5128, 169
NGC 5985, 8, 92, 138
NGC 613, 56, 57
NGC 6140, 108
NGC 622, 58, 59, 60, 74, 141
NGC 6257, 112
NGC 628, 33
NGC 631, 62
NGC 632, 62
NGC 68, 50, 51
NGC 6965, 116
NGC 7099, 118
NGC 7103, 118
NGC 7107, 122
NGC 7131, 124, 195
NGC 7171, 124
NGC 720, 64, 65, 183, 184
NGC 7213, 66
NGC 7331, 84, 138
NGC 7351, 128, 129
NGC 7378, 130
NGC 7507, 61, 134
NGC 753, 33, 35
NGC 7541, 136, 138, 177, 178
NGC 7603, 38, 202, 204
NGC 7738, 142
NGC 7739, 142
NGC 7817, 48
OQ 530, 156
peculiar galaxy, 222
PG 1211+ 143, 92, 100, 197
PG 1244+ 026, 138, 171, 173, 176, 178, 196
PKS 2349-01, 142, 143
PKS 2349-014, 142
QSO 0405-385, 66
QSO B0827.9+ 5255, 70
Redshift, 223
quantized, 222
quasar, 222
ROSAT, 221, 222
RXJ 0030+ 2618, 187
RXJ 0152.7-1357, 64, 65, 182, 184
SBS 1520+ 530, 102
Schmidt, Maarten, 222
Sey 23409-1511, 140
Seyfert galaxies, 219, 222
Starburst galaxy, 223
Stephan’s Quintet, 9, 27, 84, 138
Supergiant, 221
supernova, 223
synchroton radiation, 223
Tully, R.B., 223
Tully-Fisher distance, 223
UGC 12346, 132
UGC 2885, 33
UGC 6312, 88, 92
UGC 9853, 102, 103
UM 186, 142
UM 341, 58, 60, 61, 74
UM 602, 61, 96
Virgo Cluster, 95

227
Colour Plates
Plate 13 Intro - The famous debate between big telescopes in the 1970’s as to the reality of the connection between the galaxy NGC 4319 and the quasar/AGN Markarian 205 has been settled by these CCD frames taken by D. Strange with a 50 cm telescope in the English countryside.

228
Plate 1a - Full, approximately 50 arcmin radius, X-ray field of the PSPC detector on ROSAT. A line of bright compact X-ray sources connects NGC 4636 (z = .003) at upper right with the object in the center, the AGN PG1244+026 (z = .048). (See Fig. 1b.)

229
Plate 2a. Full, approximately 50 arcmin radius, X-ray field of the PSPC detector on ROSAT. A line of bright compact X-ray sources extends in either direction from NGC 4636 (a bright X-ray, E galaxy with z = .003). (See Fig. 2b.)

230
Plate 4. This is an enlarged view from the high resolution, HRI X-ray image. X-ray material appears to emerge from this central galaxy and extend out along the p.a. = 42 deg. line back toward NGC 7541.

231
Plate 7. An optical image, with X-ray contours superposed, of the cluster RXJ0152.7-1357 at z = .83. At its redshift distance it would be one of the most luminous clusters known. It points, however, nearly at the strong X-ray E galaxy NGC 720. (See next Figure.)

232
Plate 15. The ScI galaxy NGC 1232 with a +5,000 km/sec companion off the end of a spiral arm. Further in along the same arm, near a thickening, is a small galaxy with a redshift of cz = .1. The image is from the VLT telescope of the European Southern Observatory.

233
Plate 16. The active Seyfert galaxy NGC 7603 has a +8,000 km/sec companion on the end of an arm-like filament.

234
Plate 17. After 30 years, the two marked, quasar-like, high redshift objects have now been discovered in the filament from NGC 7603 with the Nordic Optical Telescope of La Palma (López-Corredoira and Gutiérrez 2002).