catalogo olson instruments
TRANSCRIPT

7/27/2019 Catalogo Olson Instruments
http://slidepdf.com/reader/full/catalogo-olson-instruments 1/44
C I V I L S T R U C T U R E a n d
INFRASTRUCTURE EQUIPMENT for:
» Nondestructive Evaluation
» Seismic Geophysic
» Structural Health Monitoring
Equipment for Imaging
the Civil Infrastructure
Olson Instruments, Inc .
w w w . O l s o n I n s t r u m e n t s . c o m
7/27/2019 Catalogo Olson Instruments
http://slidepdf.com/reader/full/catalogo-olson-instruments 2/44
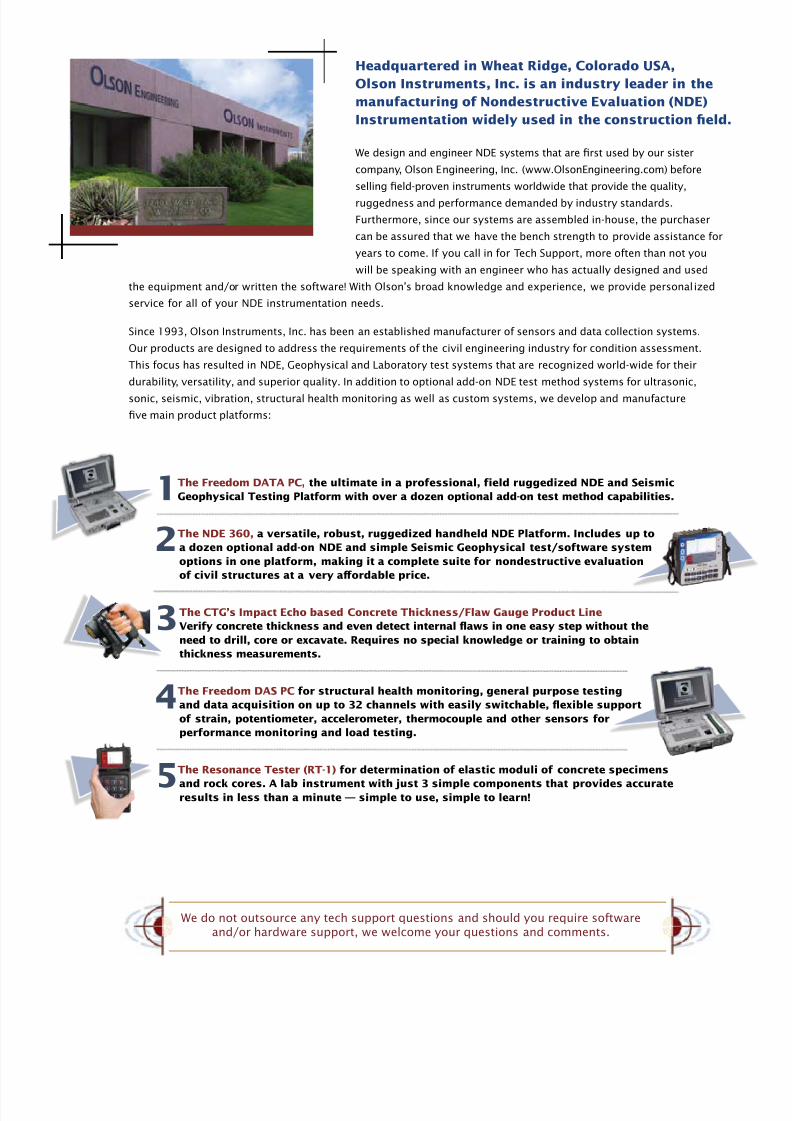
1The Freedom DATA PC, the ultimate in a proessional, ield ruggedized NDE and Seismic
Geophysical Testing Platorm with over a dozen optional add-on test method capabilities.
2The NDE 360, a versatile, robust, ruggedized handheld NDE Platorm. Includes up to
a dozen optional add-on NDE and simple Seismic Geophysical test/sotware system
options in one platorm, making it a complete suite or nondestructive evaluation
o civil structures at a very aordable price.
3The CTG’s Impact Echo based Concrete Thickness/Flaw Gauge Product Line
Veriy concrete thickness and even detect internal aws in one easy step without the
need to drill, core or excavate. Requires no special knowledge or training to obtain
thickness measurements.
4The Freedom DAS PC or structural health monitoring, general purpose testing
and data acquisition on up to 32 channels with easily switchable, exible support
o strain, potentiometer, accelerometer, thermocouple and other sensors or
perormance monitoring and load testing.
5The Resonance Tester (RT-1) or determination o elastic moduli o concrete specimens
and rock cores. A lab instrument with just 3 simple components that provides accurateresults in less than a minute — simple to use, simple to learn!
We do not outsource any tech support questions and should you require sotwareand/or hardware support, we welcome your questions and comments.
Headquartered in Wheat Ridge, Colorado USA,
Olson Instruments, Inc. is an industry leader in the
manuacturing o Nondestructive Evaluation (NDE)
Instrumentation widely used in the construction feld.
We design and engineer NDE systems that are frst used by our sister
company, Olson Engineering, Inc. (www.OlsonEngineering.com) beore
selling feld-proven instruments worldwide that provide the quality,
ruggedness and perormance demanded by industry standards.
Furthermore, since our systems are assembled in-house, the purchaser
can be assured that we have the bench strength to provide assistance or
years to come. I you call in or Tech Support, more oten than not you
will be speaking with an engineer who has actually designed and used
the equipment and/or written the sotware! With Olson’s broad knowledge and experience, we provide personalized
service or all o your NDE instrumentation needs.
Since 1993, Olson Instruments, Inc. has been an established manuacturer o sensors and data collection systems.
Our products are designed to address the requirements o the civil engineering industry or condition assessment.
This ocus has resulted in NDE, Geophysical and Laboratory test systems that are recognized world-wide or their
durability, versatility, and superior quality. In addition to optional add-on NDE test method systems or ultrasonic,
sonic, seismic, vibration, structural health monitoring as well as custom systems, we develop and manuacture
fve main product platorms:

7/27/2019 Catalogo Olson Instruments
http://slidepdf.com/reader/full/catalogo-olson-instruments 3/44
Concrete Thickness/
Flaw Gauges
[page 6]
www.OlsonInstruments.com | www.OlsonEngineering.com
Table o Contents
Olson Instruments, In
12401 W. 49th Aven
Wheat Ridge, CO USA 80033-19
Toll Free: 1.888.423.12
Ph: 303.423.12
Fax: 303.423.60
email: [email protected]
www.OlsonInstruments.com | www.OlsonEngineering.c
Olson Instruments , Inc .
[page 26]
[page 30]
Nondestructive Testing Platorms »
Freedom Data PC ...............................................................................................................................
NDE 360 ..............................................................................................................................................................
Concrete Thickness Gauges (CTG)........................................................................
Freedom DAS PC (Data Acquisition System) .......................................
Lab Testing »
Resonance Tester (RT-1).........................................................................................................
Custom Systems » ......................................................................................................................... 1
Add-On Nondestructive Testing Systems »
Foundation Depth & Integrity Systems1. Crosshole Sonic Logging. ...................................................................................................................1
2. Tomographic Imaging Software. .................................................................................................. 1
3. Parallel Seismic. ........................................................................................................................................ 1
4. Sonic Echo/Impulse Response. ...................................................................................................2
5. Ultraseismic (Developed by Olson). ........................................................................................2
Structural, Pavement, & Tunnel Systems
6. Impact Echo. ................................................................................................................................................2
7. Impact Echo Scanner........................................................................................................................... 2
8. Slab Impulse Response...................................................................................................................... 2
9. Spectral Analysis of Surface Waves-S (Structural) . ..................................................3
10. Ultrasonic Pulse Velocity/Sonic Pulse Velocity . .......................................................... 3
1 1. Multiple Impact Surface Waves . ................................................................................................3
Geophysical Seismic Systems
1 2. Crosshole/Downhole Seismic. ....................................................................................................3
13. Spectral Analysis of Surface Waves-G (Geophysical). ...........................................3
14. Seismic Refraction/Reection. ..................................................................................................4
Lab Testing
1 5. Resonance Testing [NDE 360 and Freedom Data PC Platforms] ....................
7/27/2019 Catalogo Olson Instruments
http://slidepdf.com/reader/full/catalogo-olson-instruments 4/44
nondestructive testing platforms
NDE 360™ » One Platform - Multiple NDE TestsFreedom Data PC »
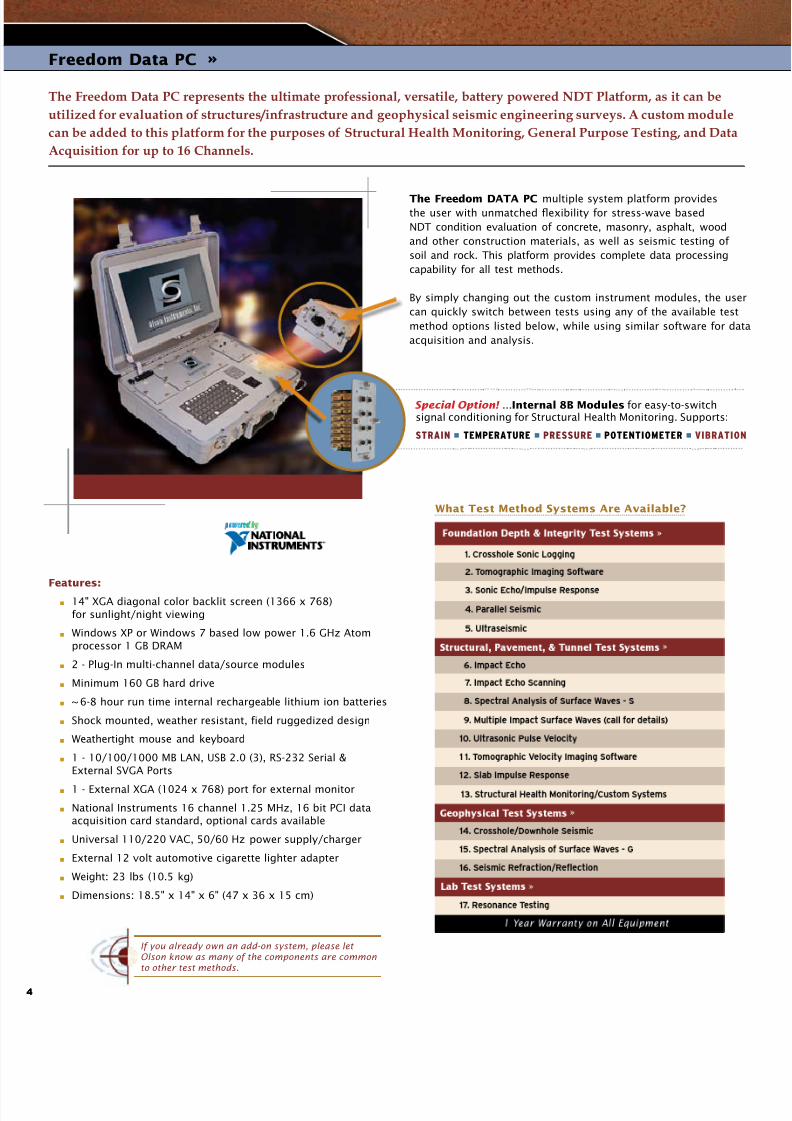
The Freedom Data PC represents the ultimate professional, versatile, battery powered NDT Platform, as it can be
utilized for evaluation of structures/infrastructure and geophysical seismic engineering surveys. A custom module
can be added to this platform for the purposes of Structural Health Monitoring, General Purpose Testing, and Data
Acquisition for up to 16 Channels.
The Freedom DATA PC multiple system platorm providesthe user with unmatched exibility or stress-wave based
NDT condition evaluation o concrete, masonry, asphalt, wood
and other construction materials, as well as seismic testing o
soil and rock. This platorm provides complete data processing
capability or all test methods.
By simply changing out the custom instrument modules, the use
can quickly switch between tests using any o the available test
method options listed below, while using similar sotware or da
acquisition and analysis.
Features:
14" XGA diagonal color backlit screen (1366 x 768)■
or sunlight/night viewing
Windows XP or Windows 7 based low power 1.6 GHz Atom■
processor 1 GB DRAM
2 - Plug-In multi-channel data/source modules■
Minimum 160 GB hard drive■
~ 6-8 hour run time internal rechargeable lithium ion batteries■
Shock mounted, weather resistant, ield ruggedized design■
Weathertight mouse and keyboard■
1 - 10/100/1000 MB LAN, USB 2.0 (3), RS-232 Serial &■
External SVGA Ports
1 - External XGA (1024 x 768) port or external monitor■
National Instruments 16 channel 1.25 MHz, 16 bit PCI data■
acquisition card standard, optional cards available
Universal 110/220 VAC, 50/60 Hz power supply/charger■
External 12 volt automotive cigarette lighter adapter■
Weight: 23 lbs (10.5 kg)■
Dimensions: 18.5" x 14" x 6" (47 x 36 x 15 cm)■
If you already own an add-on system, please let Olson know as many of the components are commonto other test methods.
Special Option! ...Internal 8B Modules or easy-to-switchsignal conditioning or Structural Health Monitoring. Supports:
Strain temperature preSSure potentiometer ViBratio
What Test Method Systems Are Available?

7/27/2019 Catalogo Olson Instruments
http://slidepdf.com/reader/full/catalogo-olson-instruments 5/44
nondestructive testing platforms
NDE 360 »
The NDE 360 multiple system platorm is a compact,
lightweight, but robust battery powered handheld system
oering mobility and simplicity or use in the eld by oneperson. Test data is stored on the compact ash and can be
analyzed on-site. The NDE 360 includes several add-on NDT
test/sotware system options, making it a complete suite or
nondestructive testing and evaluation o civil structures at an
attractive price. This platorm accommodates complete data
processing capability or most test methods. The available test
methods shown below can be added to the NDE 360 without
returning the equipment, except when 8MB memory is required
or the Impact Echo Scanner and MISW systems.
The NDE 360 is eld tested and proven through requent use b
our sister company, Olson Engineering. Optional training or bo
hardware and sotware is available. Check out our website ote
as we are continually adding test capabilities to our platorms.
Features:
High impact ABS plastic case and membrane keypad with■
simple to use Test - Accept - Reject and numeric key buttons
LCD with 1/4 VGA, backlit color touch screen, 4.5" x 3.25"■
(11.4 x 8.5 cm) with QWERTY touchscreen keyboard or
5 character ile names
512 KB standard memory - 8 MB optional memory■
14.4V, 4.5Ah NiMH internal rechargeable battery■
(lasts ~ 8 hours), optional spare battery and charger
Signal Inputs: Up to 4 channels with 16 bit analog/digital■
converters
2 removable compact lash cards (1 backup card)■
Shock mounted, weather resistant, ield ruggedized design■
128, 256, 512, 1024, 2048 data points per channel■
record length
Gains: x1, x10, x100, x1000 in our steps per channel■
Overall Dimensions: 7.5" x 7.5" x 3" (19 x 19 x 7.6 cm)■
Weight: 4.1 lbs. (1.86 kg)■
If you already own an add-on system, please let Olson know as many of the components are commonto other test methods.
Simply put, the NDE 360 is the most versatile and expandable handheld touch screen NDT Platform for Quality
Assurance/Quality Control. Add on NDT System(s) as you need them without having to return the unit.
What Test Method Systems Are Available?
*Requires 8 MB Memory Option
7/27/2019 Catalogo Olson Instruments
http://slidepdf.com/reader/full/catalogo-olson-instruments 6/44
nondestructive testing platforms
NDE 360™ » One Platform - Multiple NDE TestsConcrete Thickness Gauges (CTG) » Standard Models
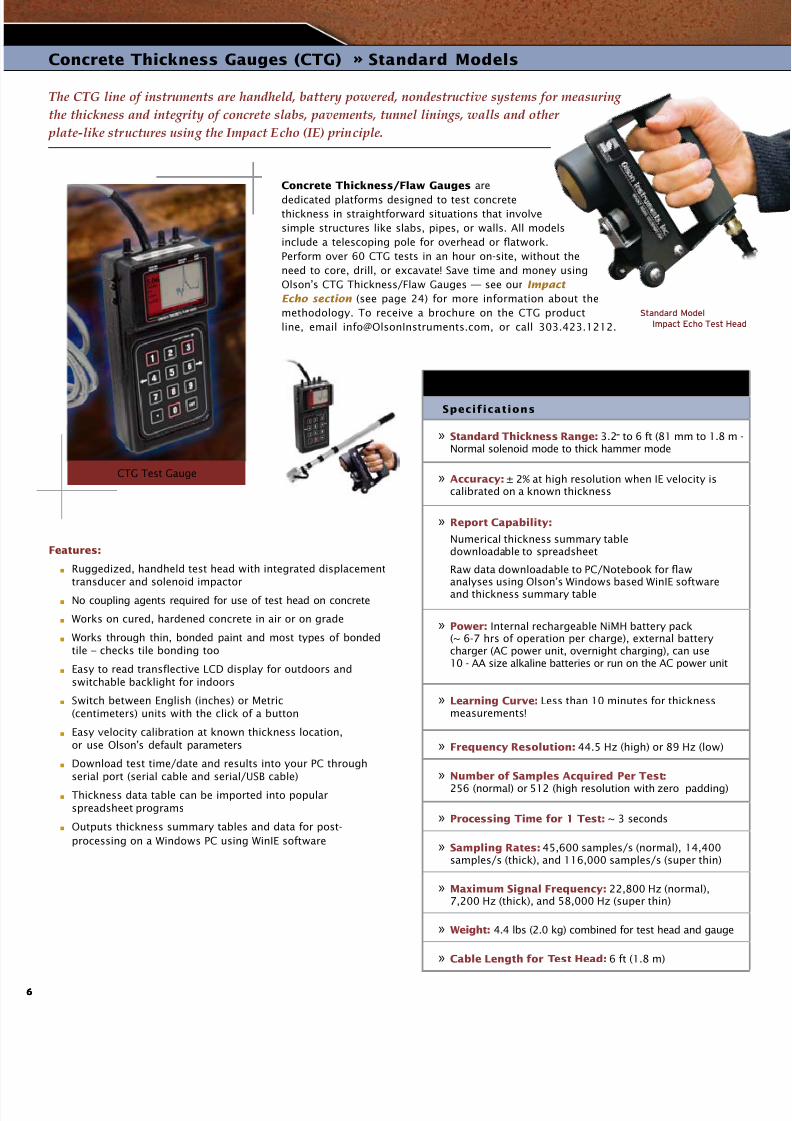
The CTG line of instruments are handheld, battery powered, nondestructive systems for measuring
the thickness and integrity of concrete slabs, pavements, tunnel linings, walls and other
plate-like structures using the Impact Echo (IE) principle.
Concrete Thickness/Flaw Gauges are
dedicated platorms designed to test concrete
thickness in straightorward situations that involve
simple structures like slabs, pipes, or walls. All models
include a telescoping pole or overhead or atwork.
Perorm over 60 CTG tests in an hour on-site, without the
need to core, drill, or excavate! Save time and money using
Olson’s CTG Thickness/Flaw Gauges — see our Impact
Echo section (see page 24) or more inormation about the
methodology. To receive a brochure on the CTG product
line, email [email protected], or call 303.423.1212.
Features:
Ruggedized, handheld test head with integrated displacement■
transducer and solenoid impactor
No coupling agents required or use o test head on concrete■
Works on cured, hardened concrete in air or on grade■
Works through thin, bonded paint and most types o bonded■
tile – checks tile bonding too
Easy to read translective LCD display or outdoors and■
switchable backlight or indoors
Switch between English (inches) or Metric■
(centimeters) units with the click o a button
Easy velocity calibration at known thickness location,■
or use Olson’s deault parameters
Download test time/date and results into your PC through■
serial port (serial cable and serial/USB cable)
Thickness data table can be imported into popular■
spreadsheet programs
Outputs thickness summary tables and data or post-■
processing on a Windows PC using WinIE sotware
CTG Test Gauge
CTG-1TF (Thickness/Flaw Model)
Specifications
Standard Thickness Range:» 3.2" to 6 t (81 mm to 1.8 m Normal solenoid mode to thick hammer mode
Accuracy:» ± 2% at high resolution when IE velocity iscalibrated on a known thickness
Report Capability:»
Numerical thickness summary tabledownloadable to spreadsheet
Raw data downloadable to PC/Notebook or awanalyses using Olson’s Windows based WinIE sotwareand thickness summary table
Power:» Internal rechargeable NiMH battery pack(~ 6-7 hrs o operation per charge), external batterycharger (AC power unit, overnight charging), can use10 - AA size alkaline batteries or run on the AC power unit
Learning Curve:» Less than 10 minutes or thicknessmeasurements!
Frequency Resolution:» 44.5 Hz (high) or 89 Hz (low)
Number of Samples Acquired Per Test:»
256 (normal) or 512 (high resolution with zero padding)
Processing Time for 1 Test:» ~ 3 seconds
Sampling Rates:» 45,600 samples/s (normal), 14,400samples/s (thick), and 116,000 samples/s (super thin)
Maximum Signal Frequency:» 22,800 Hz (normal),7,200 Hz (thick), and 58,000 Hz (super thin)
Weight:» 4.4 lbs (2.0 kg) combined or test head and gauge
Cable Length for Test Head:» 6 t (1.8 m)
Standard Model
Impact Echo Test Hea

7/27/2019 Catalogo Olson Instruments
http://slidepdf.com/reader/full/catalogo-olson-instruments 7/44
nondestructive testing platforms
Concrete Thickness Gauges (CTG) » Enhanced Models
CTG Models with Enhanced Features
CTG-1TF-ST[Super Thin]
Components Thickness Range Report Capability
Test Gauge»
Impact Echo Test Head»
with High FrequencyImpactor or testing thinmembers
Telescoping Pole»
1.5" to 6 t»
(38 mm to 1.8 m)
in Super Thin to
Normal Solenoid
Impactor Modes
to Thick HammerMode
Numerical Thickness
Summary Table,
downloadable to spreadsheet
WinIE analysis sotware
displays phase, velocity, or
modulus data vs. requencyor wavelength o a single
test.
CTG-1TF-SW[Surace Wave Velocity]
Components Thickness Range Report Capability
Test Gauge»
Impact Echo Test Head»
Telescoping Pole»
SW Detachable Arm»
with second transduceror obtaining velocityacross a xed distanceo 8" (203 mm)
3.2" to 6 t»
(81 mm to 1.8 m)
in Normal Solenoid
Impactor mode
to Thick Hammer
Mode
Numerical Thickness
Summary Table,
downloadable to spreadsheet
WinIE & WinSW analysis
sotware displays phase,
velocity, or modulus data vs.requency or wavelength o a
single test.
CTG-1TF-ST-SW[Super Thin + Surace Wave Velocity]
Components Thickness Range Report Capability
Test Gauge»
Impact Echo Test Head»
with High FrequencyImpactor or testing thinmembers
Telescoping Pole»
SW Detachable Arm»
with second transduceror obtaining velocityacross a known distance
1.5" to 6 t»
(38 mm to 1.8 m)
in Super Thin to
Normal Solenoid
Impactor Modes
to Thick HammerMode
Numerical Thickness
Summary Table,
downloadable to spreadsheet
WinIE & WinSW analysis
sotware displays phase,
velocity, or modulus data vs.requency or wavelength o a
single test.
For the standard model, CTG-1TF, the options
of Super Thin [ST] for testing thin members, Surface Wave [SW]
for obtaining velocity across a known distance, or both Super Thin
and Surface Wave [ST-SW] can be added as indicated in the
table below.
CTG-1TF-SW

7/27/2019 Catalogo Olson Instruments
http://slidepdf.com/reader/full/catalogo-olson-instruments 8/44
NDE 360™ » One Platform - Multiple NDE Tests
nondestructive testing platforms
Freedom DAS (Data Acquisition System) »
The Freedom DAS is Olson’s data acquisition system for Structural Health Monitoring (SHM).
The Freedom DAS PC is a eld ruggedized and battery
powered multiple system platorm or structural health
monitoring and other industries.
Applications or this platorm include modal testing/vibration
monitoring or structures and machinery, acoustic measurements,
monitoring temperature changes, strain gages (¼ to ull bridge),
and recording potentiometer/LVDT displacements. In essence,
the Freedom DAS PC can be used to measure/monitor any
voltage or change in resistance that can be recorded. This
platorm has the unique capability o combining data collection
and analyses (both in the eld and in the ofce) into a single
transportable battery operated unit.
Custom Systems Available - Give Olson a call at 303.423.1212 or email [email protected]
Internal Dataforth 8B Modules
for easy-to-switch signal conditioning to
support measurement of strain, temperature,
pressure, potentiometer, etc. National
Instruments™ Labview software based data
acquisition for up to 32 channels.
Features:
14" XGA diagonal color backlit screen (1366 x 768)■
or sunlight/night viewing
Windows XP or Windows 7 based low power 1.6 GHz Atom■
processor 1 GB DRAM
32 slots or Dataorth 8B signal conditioning modules in■
removable module bay, 16 slot option or Dataorth SCM5Bmodules
Minimum 160 GB hard drive■
~ 6-8 hour run time internal rechargeable lithium ion batteries■
Shock mounted, weather resistant, ield ruggedized design■
Weathertight mouse and keyboard■
1 - 10/100/1000 MB LAN, USB 2.0 (3), RS-232 Serial &■
External SVGA Ports
1 - External XGA (1024 x 768) port or external monitor■
National Instruments 16 channel 1.25 MHz, 16 bit PCI data■
acquisition card standard, optional cards available
Universal 110/220 VAC, 50/60 Hz power supply/charger■
External 12 volt automotive cigarette lighter adapter■
Weight: 23 lbs (10.5 kg)■
Dimensions: 18.5" x 14" x 6" (47 x 36 x 15 cm)■
Analog Current (I)»
Analog Voltage (V)»
Linearized 2, 3 or 4 Wire RTD»
8B m f:
Potentiometer»
Strain Gauge (¼ or ull)»
Frequency»
True RMS Voltage»
2 - Wire»
Linearized Thermocouple»
Concrete Strain Gauges
and other sensors availa
(16 Channel Option for Dataforth SCM5B Modules)

7/27/2019 Catalogo Olson Instruments
http://slidepdf.com/reader/full/catalogo-olson-instruments 9/44
nondestructive testing platforms
Resonance Tester RT-1 » ASTM C215 | ASTM C666
Fast digital laboratory testing equipment - get results in seconds! Tests concrete, masonry, stone & rock, carbon &
granite, ceramics and other specimens.
Consisting o three simple components, Olson’s digitally
based handheld Resonance Tester (RT-1) is a dedicated
platorm that is aster, simpler, easier and more economicalthan older analog vibrator technology — get accurate
test results in seconds! Meets ASTM C215 Standard or
Resonance Testing o Concrete or Dynamic Properties and
Freeze-Thaw Durability Testing (ASTM C666). The dynamic
Young’s modulus (E), shear modulus (G) and Poisson’s ratio
( y) o concrete, rock, asphalt, masonry, carbon and other
cylinder, beam and core-shaped specimens can be obtained
seconds. The complete system includes a sample spreadshee
or all moduli calculations or longitudinal, lexural and
torsional tests as shown below.
Features:
Acquires 1024 samples per test with a sampling rate■
o 52,000 samples/second
Quick & Easy Set Up! — uses sponge rubber mat in place■
o metal test rame (per ASTM C215)
Color screen or requency spectra display■
High requency test option or small rock cores■
Learning curve: less than 10 minutes■
Includes sotware or damping calculation■
Download data to your PC via serial port (serial cable and■
serial/USB cable)
Unit will store up to 100 tests or download to optional■
WinRT analysis sotware
AC (100-240 VAC) or rechargeable battery power■
~ 6 hour lie internal rechargeable batteries, can operate■
while recharging
dw y y
pc. e h yw
h h
y (hw
).
Testing a Rock Core
shown: accelerometer
Get Accurate Test Results in Seconds!
Resonance testing is available as an add-onfor the Freedom Data PC and the NDE 360

7/27/2019 Catalogo Olson Instruments
http://slidepdf.com/reader/full/catalogo-olson-instruments 10/44
nondestructive testing platforms
NDE 360™ » One Platform - Multiple NDE Tests
0000
Olson Instruments has developed custom systems for numerous industries in our effort to provide solutions for
unusual testing situations and a broad variety of applications. These types of systems were built for oil and gas
exploration, seismic investigations, mine and mine safety applications, nuclear facility inspections, structural
integrity evaluations, and testing at water and wastewater treatment plants.
Our unique capability to cater to your needs stems rom years
o experience in not only building the equipment, but in using
the equipment in our sister company, Olson Engineering. Both
Olson Instruments and Olson Engineering retain a diverse
engineering sta ready to take on your toughest issues and
cater to all o your NDT and geophysical needs. Please contact
our corporate ofce or urther inormation pertaining to these
types o systems.
Olson’s Custom Systems have been used for:
Rapid integrity testing o pre-stressed concrete cylinder pipes■
Sonic logging o shallow boreholes■
Seismic relection and reraction surveys■
Modal vibration monitoring or industrial buildings■
and bridges
Concrete drill/core guidance systems■ (see photo at left)
A variety o grout integrity investigations including■
pre- and post-tensioned ducts in pre-cast beams
Rapid thickness/integrity scanning o bridge decks■
(see photo below)
Impact Echo Pipe Scanner
Custom Systems »
Bridge Deck Scanner™ (BDS™)
Researched and developed by Olson Engineering, Inc. under NCHRP IDEAS Grant

7/27/2019 Catalogo Olson Instruments
http://slidepdf.com/reader/full/catalogo-olson-instruments 11/44
» Resace Testig.......................................................................................................................................................................9
» Crsshle Sic Lggig....................................................................................................................................12
» Tmgraphic Velcit Imagig Sftware ...........................................................14
» Parallel Seismic ..............................................................................................................................................................................18
» Sic Ech/Impulse Respse ..........................................................................................................20
» Ultraseismic...............................................................................................................................................................................................22
» Impact Ech...............................................................................................................................................................................................24
» Impact Ech Scaer ....................................................................................................................................................26
» Slab Impulse Respse ...........................................................................................................................................28
» Spectral Aalsis f Surface Waves-S .......................................................................30
» Ultrasic Pulse Velcit/Sic Pulse Velcit.............................32
» Multiple Impact Surface Waves ......................................................................................................34
» Crsshle/Dwhle Seismic...............................................................................................................36
» Spectral Aalsis f Surface Waves-G ......................................................................38
» Seismic Refracti/Reecti.........................................................................................................40
Add-On Nondestructive Test Method Systems Section »
NDE 360
nonDESTRUCTIVE TESTInG ADD-on SySTEMS
Concrete Thickness Gauges
» Super Thi opti .........................................................................................................................................................................7
» Surface Wave opti ............................................................................................................................................................7
»
Super Thi ad Surface Wave opti.................................................................................
7
Freedom Data PC
ab sy a-o p
» Resace Testig.......................................................................................................................................................................9
» Tmgraphic Velcit Imagig Sftware ...........................................................14
» Parallel Seismic ..............................................................................................................................................................................18
» Sic Ech/Impulse Respse ..........................................................................................................20
» Ultraseismic...............................................................................................................................................................................................22
» Impact Ech...............................................................................................................................................................................................24
» Impact Ech Scaer ....................................................................................................................................................26
» Slab Impulse Respse...........................................................................................................................................28
» Spectral Aalsis f Surface Waves-S .......................................................................30
» Ultrasic Pulse Velcit/Sic Pulse Velcit.............................32
» Multiple Impact Surface Waves ......................................................................................................34
» Spectral Aalsis f Surface Waves-G ......................................................................38
ab sy a-o p
ab sy a-o p
Olson Instruments , Inc.

7/27/2019 Catalogo Olson Instruments
http://slidepdf.com/reader/full/catalogo-olson-instruments 12/44
Foundation depth & integrity SyStemS
di-12
Crosshole Sonic Logging » ASTM D6760-08 | ACI 228.2R
Crosshole Sonic Logging is the most accurate and reliable technique for assessing the integrity of deep foundation
elements constructed on-site from concrete or grout.
The Crosshole Sonic Logging (CSL) system is designed or
Quality Assurance (QA) testing o newly placed critical drilled
shat oundations and auger cast piles, but can also be applied
to slurry walls, mat oundations, and mass concrete pours. Usingwater-lled access tubes, CSL testing provides assurance that
the oundation concrete is sound with no deects such as soil
intrusions, necking, sand lenses, voids, etc. Where deects exist,
the extent, nature, depth, and approximate lateral location o
the deects can be determined with the CSL method and urther
reined with Tomographic Imaging Software, which is sold by
Olson Instruments (see page 14).
A variation o the CSL method, called Single-Hole Sonic Logging
(SSL) can also be used on smaller diameter drilled mini-piles and
auger cast piles. The Single-Hole Sonic Logging method is used in
cases where only a single access tube can be placed in a deep
oundation, and tests the concrete quality in the region around
the single access tube (see graphic on next page).
Features
One or two logs per pull (CSL-1 or CSL-2)■
System design allows or ast and accurate ield measurements■
Hydrophones (42 KHz) are interchangeable as both source and■
receiver
Tests up to 20 t (6.5m) through concrete■
Real-time waveorm and log results display while testing■
Alternate CSL log display ormats available at a key stroke■
Sensitive enough to detect small deects■
Sotware allows or Automatic Log and optional Report Generation■
in Microsot Word
Capable o identiying multiple deects in a single shat■
Meets ASTM and RILEM standards■
Plastic Test Block to check system operation■
Tomographic Imaging Sotware option available■
Freedom Data PC Required,Sold Separately
ml avs
CSL-1 Model Single Log System
CSL-2 Model Double Log System for large shafts and walls
o avs
Tomo-1 Software Allows the user to perform and display tomographic inversions
of CSL data, giving 2-D or 3-D velocity images of anomalies

7/27/2019 Catalogo Olson Instruments
http://slidepdf.com/reader/full/catalogo-olson-instruments 13/44
Crosshole Sonic Logging » ASTM D6760-02 | ACI 228.2R
Foundation depth & integrity SyStemS
Method
The CSL method is typically perormed in access tubes
(steel or PVC) o 1.5 inch I.D. (35 mm) or greater which are
tied to the rebar cage and cast into the shat at the time o
construction. The test can also be perormed using
coreholes, i available.
Data Collection
The user riendly CSL sotware is written and tested at
Olson Instruments’ corporate oce in Colorado. We do
not outsource any tech support questions and, should
you require sotware support, we welcome your questions
and comments.
Available Models
The Crosshole Sonic Logging system is available
in two dierent models which can be run rom the
Freedom Data PC Platorm:1. Crosshole Sonic Logging - 1 (CSL-1)
2. Crosshole Sonic Logging - 2 (CSL-2)
The CSL-1 Model is the base model and is most
requently used or quality assurance o newly placed
drilled shats. Includes two hydrophones or testing
one tube pair per log pull.
The CSL-2 Model includes three hydrophones or
aster data acquisition by testing two tube pairs per
log pull. This eature provides a signicant advantage
to users who are testing a great number o shats,
large diameter shats involving numerous test tubes,
and slurry/diaphragm walls.
Alternate Log Display Formats
Data Example » 2
The plot on the right is sometimes called a Z-banded plot or waterfall plot. This plot is another way of
showing the CSL results. It is basically a waveform stack plot, but instead of plotting the whole waveform
it plots all the positive values. If the amplitude is positive, it plots a straight line. If the amplitude is
negative, there is no line.
CSLResult–ArrivalTimeandEnergy vs. WaterfallPlot
Data Example » 1
ExampleCSLResult-Anomalies
The image to the left shows a CSL
log with two defects: a major defect
at about 23 ft and a more minor
defect at about 30 ft. The ultrasonic
signals (time vs. voltage) illustrate
the differences between the sound,
major defect and minor defect
results. The defect at approximately
23 ft is considered to be more
severe because the signal is com-
pletely lost between the transmitter
and receiver.
Major Defect
7/27/2019 Catalogo Olson Instruments
http://slidepdf.com/reader/full/catalogo-olson-instruments 14/44
Foundation depth & integrity SyStemS
NDE 360™ » One Platform - Multiple NDE Tests
di-14
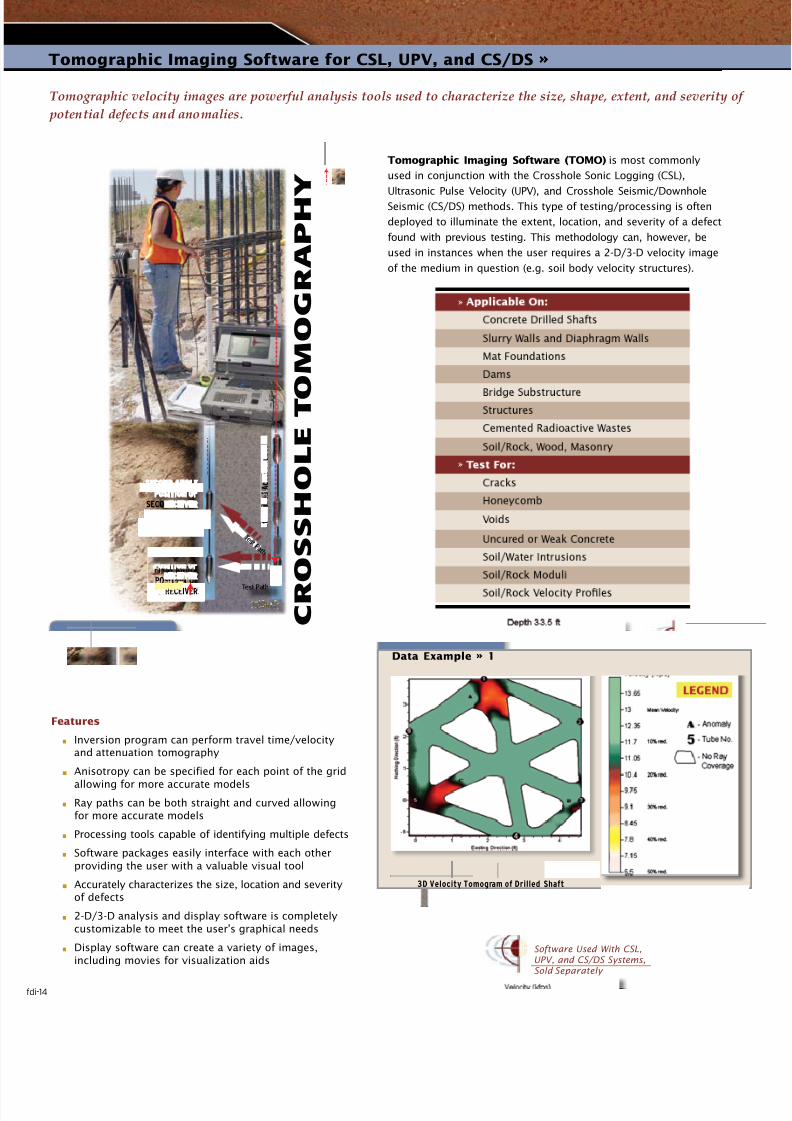
Tomographic Imaging Software for CSL, UPV, and CS/DS »
Tomographic Imaging Software (TOMO) is most commonly
used in conjunction with the Crosshole Sonic Logging (CSL),
Ultrasonic Pulse Velocity (UPV), and Crosshole Seismic/DownholeSeismic (CS/DS) methods. This type o testing/processing is oten
deployed to illuminate the extent, location, and severity o a deect
ound with previous testing. This methodology can, however, be
used in instances when the user requires a 2-D/3-D velocity image
o the medium in question (e.g. soil body velocity structures).
Tomographic velocity images are powerful analysis tools used to characterize the size, shape, extent, and severity of
potential defects and anomalies.
Features
Inversion program can perorm travel time/velocity■
and attenuation tomography
Anisotropy can be speciied or each point o the grid■
allowing or more accurate modelsRay paths can be both straight and curved allowing■
or more accurate models
Processing tools capable o identiying multiple deects■
Sotware packages easily interace with each other■
providing the user with a valuable visual tool
Accurately characterizes the size, location and severity■
o deects
2-D/3-D analysis and display sotware is completely■
customizable to meet the user’s graphical needs
Display sotware can create a variety o images,■
including movies or visualization aidsSoftware Used With CSL,UPV, and CS/DS Systems,Sold Separately
C R O S S H O L E T O
M O G R A P H Y
SOURCE
FIRST ANGLE
POSITION OF
RECEIVER
a t e e r F i i l l l e d d
A c c c e s s
T u b b e s
SECOND ANGLE
POSITION OF
RECEIVER
T e s t P a t h
Test Path
Data Example » 1
PSresultsshowinggoodqualitydata
3DVelocityTomogramofDrilledShaft
7/27/2019 Catalogo Olson Instruments
http://slidepdf.com/reader/full/catalogo-olson-instruments 15/44
Foundation depth & integrity SyStemS
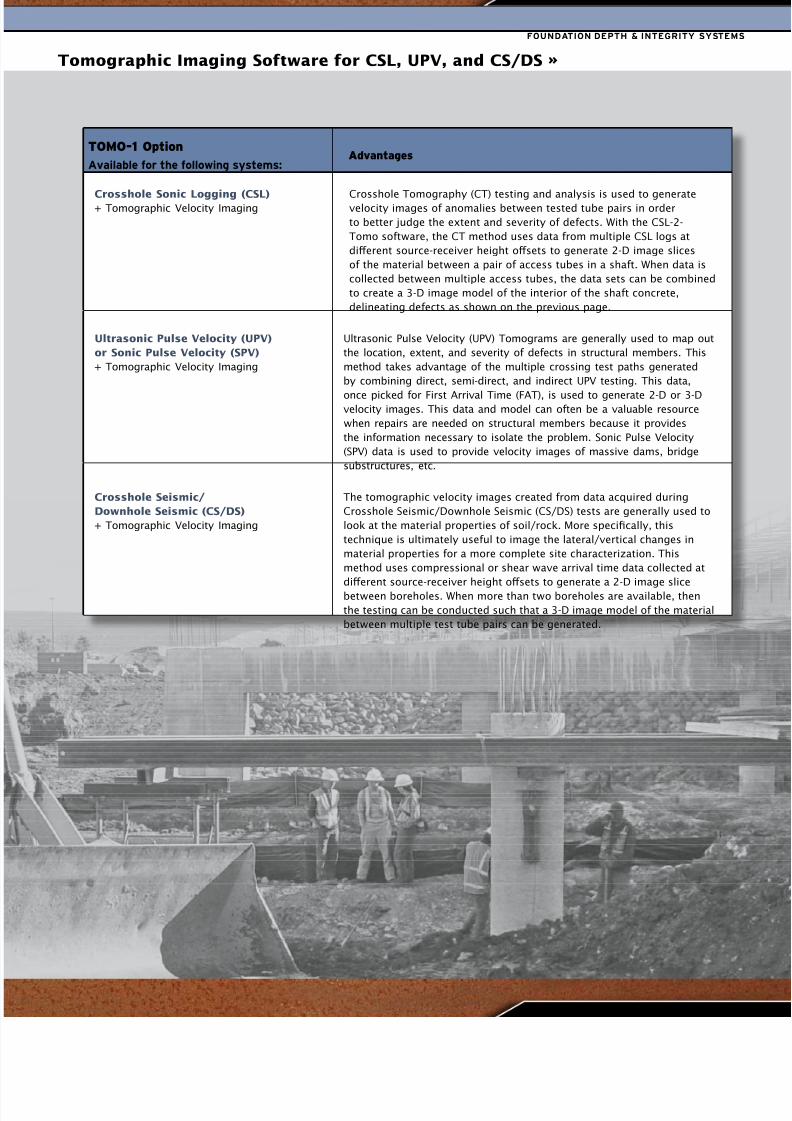
Tomographic Imaging Software for CSL, UPV, and CS/DS »
TOMO-1 Option
avlbl f fllw sss:Advantages
Crosshole Sonic Logging (CSL)+ Tomographic Velocity Imaging
Crosshole Tomography (CT) testing and analysis is used to generatevelocity images o anomalies between tested tube pairs in order
to better judge the extent and severity o deects. With the CSL-2-
Tomo sotware, the CT method uses data rom multiple CSL logs at
dierent source-receiver height osets to generate 2-D image slices
o the material between a pair o access tubes in a shat. When data is
collected between multiple access tubes, the data sets can be combined
to create a 3-D image model o the interior o the shat concrete,
delineating deects as shown on the previous page.
Ultrasonic Pulse Velocity (UPV)
or Sonic Pulse Velocity (SPV)
+ Tomographic Velocity Imaging
Ultrasonic Pulse Velocity (UPV) Tomograms are generally used to map out
the location, extent, and severity o deects in structural members. This
method takes advantage o the multiple crossing test paths generated
by combining direct, semi-direct, and indirect UPV testing. This data,
once picked or First Arrival Time (FAT), is used to generate 2-D or 3-Dvelocity images. This data and model can oten be a valuable resource
when repairs are needed on structural members because it provides
the inormation necessary to isolate the problem. Sonic Pulse Velocity
(SPV) data is used to provide velocity images o massive dams, bridge
substructures, etc.
Crosshole Seismic/
Downhole Seismic (CS/DS)
+ Tomographic Velocity Imaging
The tomographic velocity images created rom data acquired during
Crosshole Seismic/Downhole Seismic (CS/DS) tests are generally used to
look at the material properties o soil/rock. More specically, this
technique is ultimately useul to image the lateral/vertical changes in
material properties or a more complete site characterization. This
method uses compressional or shear wave arrival time data collected at
dierent source-receiver height osets to generate a 2-D image slice
between boreholes. When more than two boreholes are available, then
the testing can be conducted such that a 3-D image model o the material
between multiple test tube pairs can be generated.

7/27/2019 Catalogo Olson Instruments
http://slidepdf.com/reader/full/catalogo-olson-instruments 16/44
Foundation depth & integrity SyStemS
NDE 360™ » One Platform - Multiple NDE Tests
di-16
Tomographic Imaging Software for CSL, UPV, and CS/DS »
TOMOGRAPHIC IMAGING SOFTWAREAs seen in the above gure, the anomaly (repre-sented by the cooler colors) is primarily containedbetween the depths of 2.5 ft and 4 ft in theproximity of Tube 1, assuming that Tube 1 was thesource tube.
CT TOMOGRAM - Drilled Shaft
Thin-Arch Concrete Dam
Tomography 2-D Test Results
TomogramVelocityScaleinkfps(thousandsofft/sec)
As seen in the gure at right, low
velocity zones at downstream face
(left side) correspond to degraded
concrete from freeze-thaw cracking
damage on downstream face.
P e r i m e t e r T o m o g r a m s
Drilled Shaft DefectsDistance between tubes (ft)
D i s t a n c e b e l o w t
o p o f s h a
f t ( f t )
Vertical Tomograms from Crosshole Tomography (CT) Data

7/27/2019 Catalogo Olson Instruments
http://slidepdf.com/reader/full/catalogo-olson-instruments 17/44
Foundation depth & integrity SyStemS
Tomographic Imaging Software for CSL, UPV, and CS/DS »
Available Imaging Software
The Tomographic Imaging Sotware is an add-on option
to either o the Olson Instruments, Inc. CSL systems,the UPV system, and/or the CS/DS system. In the
instance that this add-on is purchased or either o the
CSL systems, the CSL sotware package includes the
Tomo option. The CSL sotware has a tomography data
collection and export unction that provides automated
user prompting or test execution as well as direct
output to the GEOTOM® inversion program.
In the instance that this add-on is purchased or
either the UPV or CS/DS systems, which includes the
GEOTOM® inversion program, the GEOTOM® sotware
can perorm either rst arrival time tomography or
attenuation tomography, use both straight and bending
rays, and allows or the specication o anisotropy atany dened grid point. The Slicer Dicer® visualization
package allows the user to create both 2-D and
3-D images as well as animations rom the output
generated through the GEOTOM® inversion.
Method
The tomographic imaging sotware is used in conjunction
with the CSL, UPV/SPV, and CS/DS methods/systems. Please
reer to the method sections or these systems in this catalog.
Data Collection
The user-riendly CSL sotware, used or CT testing, is written
and tested at Olson Instruments’ corporate oce in Colorado.
Olson Instruments has extensive experience with tomography
data analysis sotware. We do not outsource any tech support
questions and, should you require sotware support, we
welcome your questions and comments.
Data Example » 1
SlicerDicer®3-Dvisualizationofdefectinadrilledshaft
Image above displays several 2-D horizontal slice
of data. Note that red colors indicate areas of low
velocity and therefore low strength.
Sample2:GeoTomCG®2-DSlice
Image at left shows a 3-D visualization where
the higher velocity sections of a drilled shaft
have been removed leaving only the lower
velocity areas for easy viewing of defects.
Crosshole Seismic/Downhole Seismic Testing
Data Example » 2
SlicerDicer®3-Dvisualizationdataresultsfromcolumnshown
These images were created
using Ultrasonic Pulse Veloci
(UPV) data taken on a colum
that had visible exterior
damage after the forms wereremoved. The tomographic
images were generated to
determine the extent (e.g.
depth) of the spalling seen a
the surface. The three image
are cross-sectional slices to
show the interior conditions
of the damaged corner. As
can be seen, the defect was
primarily confined to the
surface of the volume.
This example illustrates the
primary utility of structural
tomography images when
defects are encountered.
The images allowed for theproblem to be isolated and
locally repaired instead of
the entire concrete member
being removed and replaced,
which would have cost a
considerably larger amount o
time and money.
For more information on the capabilities of CSL ,UPV , and CS/DS systems available to use withTOMO - 1, please refer to the individual sections
in this catalog.

7/27/2019 Catalogo Olson Instruments
http://slidepdf.com/reader/full/catalogo-olson-instruments 18/44
Foundation depth & integrity SyStemS
NDE 360™ » One Platform - Multiple NDE Tests
di-18
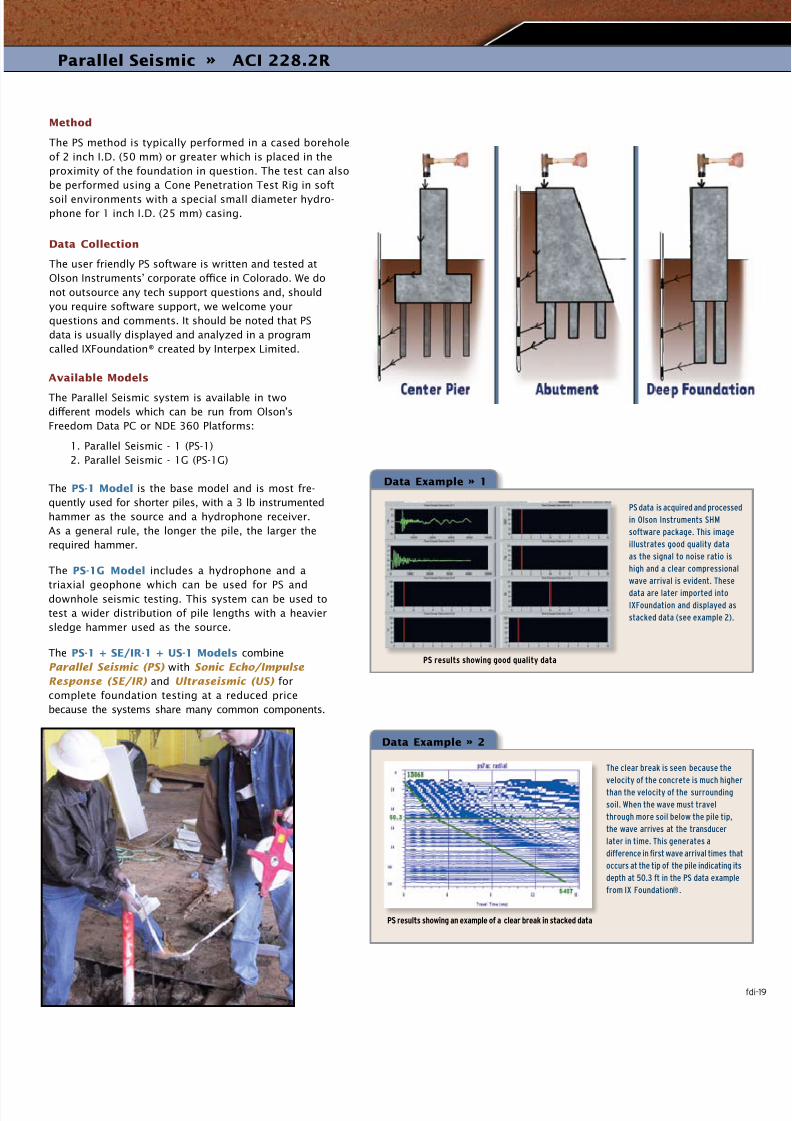
Parallel Seismic » ACI 228.2R
When access to the top of the foundation is limited, the Parallel Seismic test is more accurate and more versatile than
other nondestructive surface techniques for determination of unknown foundation depths.
Parallel Seismic (PS) systems are designed to determine
the length and integrity o oundations when the top is not
accessible or when the pile is too long and slender to test with
echo techniques, or below a buried pile cap. Ultimately, Parallel
Seismic testing provides inormation concerning the length
and compressional velocity o oundations and can be used on
concrete, wood, masonry, and steel oundations. This method
also provides inormation about the soil below the oundation
bottom. It should be noted that this test method requires the
installation o a water-lled or grouted cased borehole.
Freedom Data PC or NDE 360 Required,Sold Separately
Features
System design allows or ast and accurate ield measurements■
- depth accuracy can be determined within 5% or better
More economic and versatile than other equipment/techniques■
used or determination o unknown oundation depths
Method and system allows or testing o piles without excavation■
System is compact, durable, and easily transported,■
allowing or multiple tests per day
IX Foundation, a seismic analysis and display program■
allows the ull range o data to be viewed at one time,
improving the ability to identiy the oundation bottom
Test piles that are partially/totally submerged■
Determine the tip depths o oundations with complex■
geometries such as piles under pile caps
ml avs
PS-1 Model Hydrophone in water-lled, ungrouted cased borehole
PS-1G Model Hydrophone and triaxial geophone for grouted, cased borings
and downhole seismic velocity measurements of soil and rock
7/27/2019 Catalogo Olson Instruments
http://slidepdf.com/reader/full/catalogo-olson-instruments 19/44
Foundation depth & integrity SyStemS
Parallel Seismic » ACI 228.2R
Data Example » 2
PSresultsshowinganexampleofaclearbreakinstackeddata
The clear break is seen because the
velocity of the concrete is much highe
than the velocity of the surrounding
soil. When the wave must travel
through more soil below the pile tip,
the wave arrives at the transducer
later in time. This generates a
difference in rst wave arrival times tha
occurs at the tip of the pile indicating it
depth at 50.3 ft in the PS data example
from IX Foundation®.
Method
The PS method is typically perormed in a cased borehole
o 2 inch I.D. (50 mm) or greater which is placed in the
proximity o the oundation in question. The test can also
be perormed using a Cone Penetration Test Rig in sot
soil environments with a special small diameter hydro-phone or 1 inch I.D. (25 mm) casing.
Data Collection
The user riendly PS sotware is written and tested at
Olson Instruments’ corporate oce in Colorado. We do
not outsource any tech support questions and, should
you require sotware support, we welcome your
questions and comments. It should be noted that PS
data is usually displayed and analyzed in a program
called IXFoundation® created by Interpex Limited.
Available Models
The Parallel Seismic system is available in two
dierent models which can be run rom Olson’s
Freedom Data PC or NDE 360 Platorms:
1. Parallel Seismic - 1 (PS-1)
2. Parallel Seismic - 1G (PS-1G)
The PS-1 Model is the base model and is most re-
quently used or shorter piles, with a 3 lb instrumented
hammer as the source and a hydrophone receiver.
As a general rule, the longer the pile, the larger the
required hammer.
The PS-1G Model includes a hydrophone and a
triaxial geophone which can be used or PS anddownhole seismic testing. This system can be used to
test a wider distribution o pile lengths with a heavier
sledge hammer used as the source.
The PS-1 + SE/IR-1 + US-1 Models combine
Parallel Seismic (PS) with Sonic Echo/Impulse
Response (SE/IR) and Ultraseismic (US) or
complete oundation testing at a reduced price
because the systems share many common components.
Data Example » 1
PSresultsshowinggoodqualitydata
PS data is acquired and processed
in Olson Instruments SHM
software package. This image
illustrates good quality data
as the signal to noise ratio is
high and a clear compressional
wave arrival is evident. These
data are later imported into
IXFoundation and displayed as
stacked data (see example 2).

7/27/2019 Catalogo Olson Instruments
http://slidepdf.com/reader/full/catalogo-olson-instruments 20/44
Foundation depth & integrity SyStemS
NDE 360™ » One Platform - Multiple NDE Tests
di-20
Sonic Echo/Impulse Response is used for low strain integrity testing of piles and determination of deep foundation length
Sonic Echo/Impulse Response » ASTM D5882-07 | ACI 228.2R
Features:
System design allows or ast and accurate ield measurements■
Real-time waveorm display while testing■
System is compact, durable, and easily transported allowing■
or multiple tests per day
Accurate within 5% in determining oundation depth■
Automatic/manual selection o echo events in SE/IR records■
with WinSE/IR sotware and echo depth prediction based on
user input velocity (English or Metric units)
Ability to perorm tests with both accelerometer and■
geophone transducers simultaneously in SE or IR tests or
better data quality than i used individually
Integrate and average acceleration and velocity response data■
to velocity in SE tests or enhanced identiication o echoes
Exponentially ampliy SE data with time to enhance■
weak echoes with 16 bit A/D sampling
Digital iltering o SE data with lowpass, highpass and■
bandpass options to enhance identiication o echo events
and minimize background noise
IR mobility transer unction display (velocity/orce versus■
requency) o IR results to identiy resonant peaks indicative
o echo depths and average mobility
IR lexibility transer unction display (displacement/orce■
versus requency) o IR results to identiy pile head stinessat low requencies and indicate deects
The Sonic Echo/Impulse Response (SE/IR) system is
designed to determine the length and integrity o oundations
when the top or part o the upper side o the oundation is
accessible. This system and its associated methodology can be
used on both new and existing oundations and is perormedby impacting the oundation and recording echoes rom a
deect or the oundation bottom with a nearby receiver(s). It
should be noted that this method works best or columnar
type oundations such as piles and drilled shats, but has also
been used successully on mat oundations, abutment walls,
and similar structures. This technique is applicable on concrete,
wood, and round steel pipe oundations.
The Sonic Echo (SE) method is
normally conducted in conjunction
with the Impulse Response (IR)
method together as the SE/IR
method. Olson does, however,
provide a system that exclusivelyuses the SE methodology without
the IR analyses. This system,
along with its associated sotware,
uses only the time domain
inormation in the data or the
interpretation o refections. The IR option provides the user with
the ability to transorm the data rom the time domain into the
requency domain. The sotware then automatically calculates the
transer and coherence unctions, which may be useul or data
quality analyses as well as providing urther inormation about
refections within the structure.
Freedom Data PC or NDE 360 Required,Sold Separately
ml avs
SE-1 Model Process data in time domain
SE/IR-1 Model Process data in both time domain and frequency domain

7/27/2019 Catalogo Olson Instruments
http://slidepdf.com/reader/full/catalogo-olson-instruments 21/44
Foundation depth & integrity SyStemS
Sonic Echo/Impulse Response » ASTM D5882-07 | ACI 228.2R
Data Example » 1
This is an example of good
quality accelerometer data
(SE) as evidenced by multiple
reflections. The multiple echoes
are apparent in the bottom plot
from a defect. The first of the
multiple echoes is marked by a
vertical cursor that corresponds
to the depth of a severe necking
defect at ~ 12 ft (3.6 m) below
the shaft top.
Resultsshowinggoodqualityaccelerometer(SE)data
Data Example » 2
ResultsshowinggoodqualityImpulseResponse(IR)dataprocessedfromtheaboveSEdata,Example#1
This is an example of good qualityimpulse response (IR) data as
evidenced by high coherence
(middle plot) over the peaks seen
in the lower plot. These peaks are
displayed in the frequency domain
rather than the time domain as in
SE data. Multiple peaks are clear
and easy to identify, allowing for
more accurate shaft length or
the ~ 12 ft (3.6 m) defect depth
calculations in this case.
Method
The SE/IR method is typically perormed by mounting a
receiver on the top o the oundation and then striking the
top with a hammer. I the top o the oundation is not
accessible, then the receiver and the strike are located as
close to the top as possible. A similar setup is also usedwhen the structure in question is a wall.
Data Collection
The user-riendly SE/IR sotware is written and tested at Olson
Instruments’ corporate oce in Colorado. We do not outsource
any tech support questions and, should you require sotware
support, we welcome your questions and comments.
Available Models
The Sonic Echo/Impulse Response system is available
in two dierent models which can be run rom Olson’s
Freedom Data PC or NDE 360 Platorms:
1. Sonic Echo - 1 (SE-1)
2. Sonic Echo/Impulse Response - 1 (SE/IR-1)
The SE-1 Model is the base model. This system
includes an accelerometer and a hammer with inter-
changeable plastic to rubber tips or one channel o
data acquisition and processing in time domain only.
The SE/IR-1 Model includes a geophone, an
accelerometer, and an instrumented impulse hammer
or three channels o data acquisition and processing
in both the time domain and the requency domain.
The SE/IR-1 + PS-1 + US-1 Model combines Sonic
Echo/Impulse Response (SE/IR) with Parallel
Seismic (PS) and Ultraseismic (US) or complete
oundation testing at a reduced price because the
systems share many common components.
7/27/2019 Catalogo Olson Instruments
http://slidepdf.com/reader/full/catalogo-olson-instruments 22/44
Foundation depth & integrity SyStemS
NDE 360™ » One Platform - Multiple NDE Tests
di-22
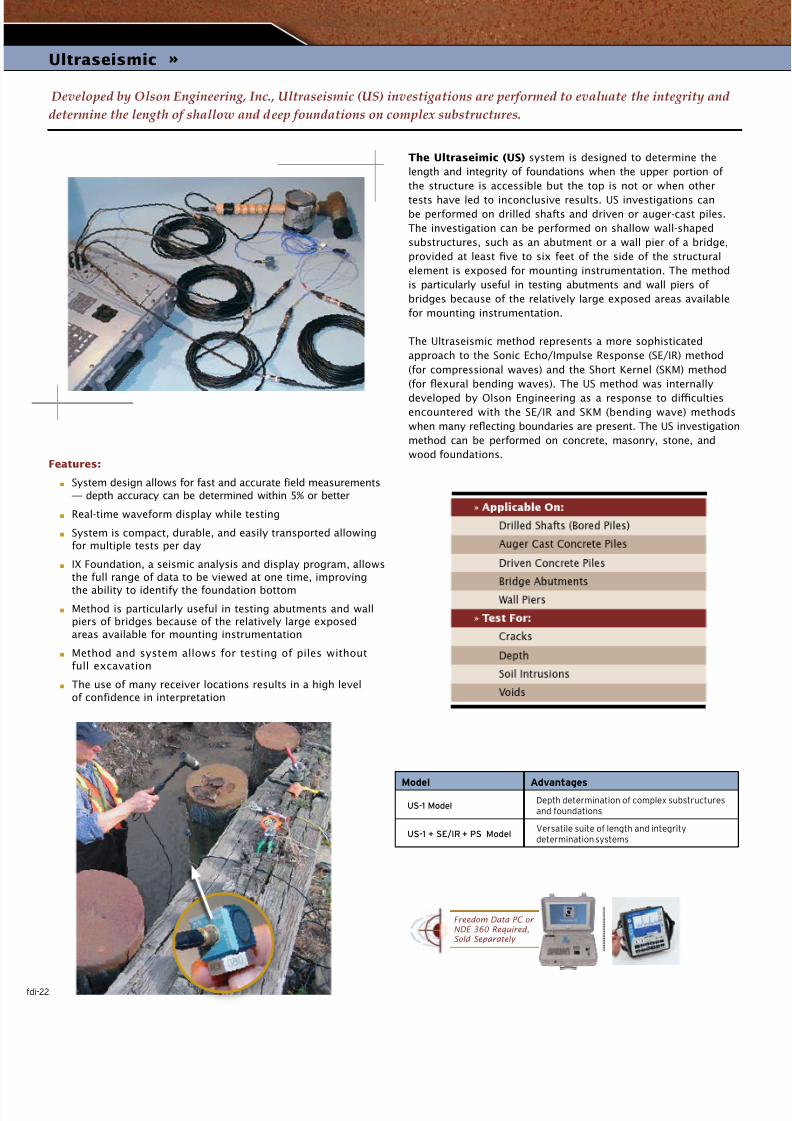
Developed by Olson Engineering, Inc., Ultraseismic (US) investigations are performed to evaluate the integrity and
determine the length of shallow and deep foundations on complex substructures.
Ultraseismic »
The Ultraseimic (US) system is designed to determine the
length and integrity o oundations when the upper portion o
the structure is accessible but the top is not or when other
tests have led to inconclusive results. US investigations can
be perormed on drilled shats and driven or auger-cast piles.
The investigation can be perormed on shallow wall-shaped
substructures, such as an abutment or a wall pier o a bridge,
provided at least ve to six eet o the side o the structural
element is exposed or mounting instrumentation. The method
is particularly useul in testing abutments and wall piers o
bridges because o the relatively large exposed areas available
or mounting instrumentation.
The Ultraseismic method represents a more sophisticated
approach to the Sonic Echo/Impulse Response (SE/IR) method
(or compressional waves) and the Short Kernel (SKM) method
(or fexural bending waves). The US method was internally
developed by Olson Engineering as a response to diculties
encountered with the SE/IR and SKM (bending wave) methods
when many refecting boundaries are present. The US investigation
method can be perormed on concrete, masonry, stone, and
wood oundations.Features:
System design allows or ast and accurate ield measurements■
— depth accuracy can be determined within 5% or better
Real-time waveorm display while testing■
System is compact, durable, and easily transported allowing■
or multiple tests per day
IX Foundation, a seismic analysis and display program, allows■
the ull range o data to be viewed at one time, improving
the ability to identiy the oundation bottom
Method is particularly useul in testing abutments and wall■
piers o bridges because o the relatively large exposed
areas available or mounting instrumentation
Method and system allows or testing o piles without■
ull excavation
The use o many receiver locations results in a high level■
o conidence in interpretation
ml avs
US-1 ModelDepth determination of complex substructures
and foundations
US-1 + SE/IR + PS ModelVersatile suite of length and integrity
determination systems
Freedom Data PC or NDE 360 Required,Sold Separately

7/27/2019 Catalogo Olson Instruments
http://slidepdf.com/reader/full/catalogo-olson-instruments 23/44
Foundation depth & integrity SyStemS
Ultraseismic »
Data Example » 1
To illustrate the concept of the
Ultraseismic investigation, an
example from a Ultraseismic
investigation on a concrete bri
column and footing foundation
is shown. Using IX Foundation®
all the data from the multipl
receiver positions can be
presented in one plot.
Vertical hits on the beam
generate flexural waves
traveling down and up the
column/footing substructure
the accelerometers used in
Ultraseismic test.
Note:
Flexural Wave Velocity = 5,800
Plotshowingseveralclearbreaks,asdepictedbythesolidblacklines.
Available Models
The Ultraseismic systems can be run rom Olson’sFreedom Data PC or NDE 360 Platorms:
1. Ultraseismic - 1 (US-1)
2. Ultraseismic + Sonic Echo/Impulse Response
+ Parallel Seismic System (US-1 + SE/IR-1 + PS-1)
The US-1 Model is the base model. This system
includes an accelerometer and an instrumented
hammer or 2 channels o data acquisition.
The US-1 + SE/IR-1 + PS-1 Model combines
Ultraseismic (US) with Sonic Echo/Impulse
Response (SE/IR) and Parallel Seismic (PS)
or complete oundation testing at a reduced
price because the systems share many common
components.
For more information on the individual capabilities of each method and system included in theUS + SE/IR + PS system, please refer to the
individual sections in this catalog.
Method
The US method is typically perormed by mounting a
receiver on the upper portion o a oundation or wall and
then striking the substructure with an instrumented hammer.
The US method requires at least 3 to 6 t (1 to 1.8 m) o the
oundation be exposed or receiver attachments. The general
rule is that the larger the exposed area, the better the deni-
tion o the refected events.
Data Collection
The user riendly US sotware is written and tested at
Olson Instruments’ corporate oce in Colorado. We do
not outsource any tech support questions and, should
you require sotware support, we welcome your
questions and comments. It should be noted that US
data is usually displayed and analyzed in a program
called IXFoundation® created by Interpex Limited.
Triaxial Accelerometer
14 ft
6.5 ft Footing Top
Footing Bottom

7/27/2019 Catalogo Olson Instruments
http://slidepdf.com/reader/full/catalogo-olson-instruments 24/44
structura l | PaVEMENt | tuNNEl systEMs
NDE 360™ » One Platform - Multiple NDE Tests
pt-24pt-24
Features:
Economic solution or users who already own either a■
Freedom Data PC or NDE 360
Thickness accuracy ± 2% at high resolution when calibrated■
on a known thickness
Save selected test time/date and spectral thickness results■
or later review
English or Metric units can be used■
No coupling agents required or use o test head on concrete■
Easy velocity calibration at known thickness location■
Works on cured, hardened concrete in air or on grade■
Works through paint and most types o bonded tile—■
checks tile bonding too
System is compact, durable, and easily transported allowing■
or multiple tests per day
Real-time waveorm display while testing■
Sotware allows or more sophisticated processing■
Store more data with these systems than with CTG models■
Can be expanded to use Impact Echo Scanning technology■
Impact Echo (IE) systems are designed to determine the
condition and thickness o concrete, wood, stone, and masonry
structural members when voids, honeycomb, and/or cracks aresuspected. IE investigations can also be perormed to predict the
strength o early age concrete i the member thickness is known.
Lastly, the IE method will provide inormation on the depth o
a aw or deect, in addition to mapping its lateral location and
extent. An advantage o the IE method over the Ultrasonic Pulse
Velocity (UPV) method is that only one side o the structure needs
to be accessible or testing.
Other systems based on the Impact Echo principle include Olson
Instruments’ handheld Concrete Thickness Gauge (CTG) ,
see page 6 and the Impact Echo Scanner (IES) , page 26.
Impact Echo (IE) investigations are performed to assess the condition or thickness of slabs, beams, columns, walls,
pavements, runways, tunnels, and dams.
Impact Echo » ASTM C1383-04
Corroded wire strandslocated with Impact Echo
Confirmed defect using Impact Echofrom inside of concrete pipe
Delaminations due to:
Freedom Data PC or NDE 360 Required,Sold Separately

7/27/2019 Catalogo Olson Instruments
http://slidepdf.com/reader/full/catalogo-olson-instruments 25/44
structura l | PaVEMENt | tuNNEl systEMs
Method
In conventional IE investigations, the hammer or
impactor is used to generate compressional waves that
reect back rom the bottom o the tested member or
rom a discontinuity. The response o the system is then
measured by the receiver placed next to the impact
point. Only one relatively smooth and clean surace
needs to be accessible or receiver placement and
hammer or solenoid impact.
Data Collection
The user riendly IE sotware is written and tested at
Olson Instruments’ corporate oce in Colorado. We do
not outsource any tech support questions and, should
you require sotware support, we welcome your
questions and comments.
Available Models
The Impact Echo system is available in eight dierent
models which can be run rom Olson’s Freedom Data PC
or NDE 360 Platorms:
1. Impact Echo-1 (IE-1)
2. Impact Echo-1 + Super Thin (IE-1-ST)
3. Impact Echo-1 + Surace Wave (IE-1-SW)
4. Impact Echo-1 + Super Thin + Surace Wave
(IE-1-ST-SW)
5. Impact Echo-2 (IE-2)
6. Impact Echo-2 + Super Thin (IE-2-ST)
7. Impact Echo-2 + Surace Wave (IE-2-SW)
8. Impact Echo-2 + Super Thin + Surace Wave
(IE-2-ST-SW)
Impact Echo » ASTM C1383-04
Mode advnge
IE-1 Model Will store more data than CTG systems. Tests concrete between3.2" to 6 ft (81 mm to 1.8 m). Includes impactor solenoid anddisplacement transducer
IE-1-ST Model Allows user to test concrete down to 1.5" (38 mm)
IE-1-SW Model Allows user to perform Surface Wave (SW) tests with 8" arm (203 mm)(see CTG-SW section, page 7 for more details)
IE-1-ST-SW Model Allows user to test concrete down to 1.5" (38 mm) and performSurface Wave (SW) tests
IE-2 Model In addition to impactor solenoid and displacement transducer,includes accelerometer and small impulse hammer
IE-2-ST Model Allows user to test concrete down to 1.5" (38 mm)
IE-2-SW Model Allows user to perform Surface Wave (SW) tests
IE-2-ST-SW Model Allows user to test concrete down to 1.5" (38 mm) and performSurface Wave (SW) tests
Data Example » 1
IE - Concrete Location
Performing the IE
method at a sound
concrete location gives
results similar to the
figure shown. A single,
sharp, clear peak
representing a knownthickness is indicative
of sound concrete. The
slab investigated was
10 inches thick and the
bottom echo results in
a peak at 10 inches.
Impact Echo
Test Head
SourceReceiver
Void
Reflection from slab/void interface

7/27/2019 Catalogo Olson Instruments
http://slidepdf.com/reader/full/catalogo-olson-instruments 26/44
structura l | PaVEMENt | tuNNEl systEMs
NDE 360™ » One Platform - Multiple NDE TestsImpact Echo Scanner » ASTM C1383-04 (Patented Technology by Olson)
pt-26
Mode advnge
IES Model Allows for rapid Impact Echo testing of large areas
IES-M Model Add a built-in microphone to collect acousticinformation for shallow delamination detection,while collecting IES data
The Impact Echo Scanning (IES) system is designed or large
area investigations o shallow voids, debonding/delamination,
cracking or honeycomb oten ound between an overlay on abridge deck or surrounding dense rebar mats. IES is commonly
used in locating post-tensioning (PT) cables used in reinorcing
various structures and determining duct grout condition. The
scanning technology allows tracing o the PT cables through
slabs and beams. An advantage o the IES method is that only
one side o the structure needs to be accessible or testing.
The IES Method is based on the Olson Engineering patented
technology o a rolling transducer and automated impactor or
near-continuous Impact Echo based thickness and aw scanning
o structural concrete and pavements. Perormed at slow walking
speeds, test results are obtained every inch (25 mm) in a line
and multiple lines can be combined or 2-D to 3-D displays o
concrete thickness and locations o internal void, honeycomb,cracking, delamination, etc. The scanning method is capable o
determining bottom echo thicknesses up to ~ 40 inches (1 m).
Features:
Thickness accuracy ± 2% at high resolution when■
calibrated on a known thickness
Thousands o tests can be perormed per hour when■
“imaging” o internal concrete conditions is required
System is compact, durable, and easily transported■
allowing or multiple tests per day
Real-time waveorm display while testing■
Sotware allows or more sophisticated processing■
English or Metric units can be used■
No coupling agents required or use o test head on concrete■
Works on cured, hardened concrete in air or on grade■
Works through paint and most types o bonded tile—■
checks tile bonding too
Easy velocity calibration at known thickness■
Thickness maps are easily constructed rom data■
Impact Echo Scanner (IES) investigations are performed on large structural members with smooth concrete such
as slabs, walls, bridge decks, beams, pipes, etc. where shallow voids, honeycomb, cracking or delaminations are of
primary concern.

7/27/2019 Catalogo Olson Instruments
http://slidepdf.com/reader/full/catalogo-olson-instruments 27/44
structura l | PaVEMENt | tuNNEl systEMs
Impact Echo Scanner » ASTM C1383-04 (Patented Technology by Olson)
Data Example » 1
Available Models
The Impact Echo Scanning system is available in two
dierent models which can be run rom Olson’s
Freedom Data PC or NDE 360 Platorms:
1. Impact Echo Scanner (IES)
2. Impact Echo Scanner with Microphone (IES-M)
The IES Model is the base model and can be
operated rom either the Freedom Data PC or the NDE
360. There are minor dierences between operating
this system with the Freedom Data PC vs. the NDE
360. The Freedom Data PC provides aster and more
extensive processing capability and additional data
storage space. The feld-riendly NDE 360 is compact
and lightweight. The IES data can be downloaded
rom the NDE 360 to a PC, allowing or the same
post processing available with the Freedom Data PC.
The IES-M Model includes a built-in microphone or
situations where the user wishes to collect acoustic
data simultaneously with IES data to detect deck
delaminations. This system is an add-on test
method or the Freedom Data PC platorm only,
purchased separately.
Sold only to US Government Agencies and Universities,as well as approved International sales. For consultingservices, call 303.423.1212 for details.
Method
In IES investigations, an impactor is used to generate
compressional waves that reect back rom the bottom o
the tested member or rom a discontinuity as sensed by a
rolling displacement transducer. The response o the
system is then measured by the receiver placed next to
the impact point. Only one relatively smooth and clean
surace needs to be accessible or rolling receiver coupling
and solenoid impacting. Water can be applied to the
surace to improve coupling o the receiver.
Data Collection
The user-riendly IES sotware is written and tested at
Olson Instruments’ corporate oce in Colorado. We do
not outsource any tech support questions and, should you
require sotware support, we welcome your questions
and comments.
The results from IES tests using the portable rolling IE Scanner system are imaged in the above
Tomogram. In the IES testing, the clearest indication of the presence of grouting defects is the
apparent increase in the thickness due to a reduction in the IES resonant frequency as a result of
the decrease in stiffness associated with a defect.
Freedom Data PC or NDE 360 Required,Sold Separately
IEs-M Mode:
Freedom Data PCPlatform Only
Data Example » 2
3-D IE Scan Display showing thickened end and possible thicker voided duct areas for 2 m tall wall
over 62 m length with vertical thickness scale of 100 cm (1 m).
7/27/2019 Catalogo Olson Instruments
http://slidepdf.com/reader/full/catalogo-olson-instruments 28/44
NDE 360™ » One Platform - Multiple NDE Tests
pt-28pt-28
structura l | PaVEMENt | tuNNEl systEMs
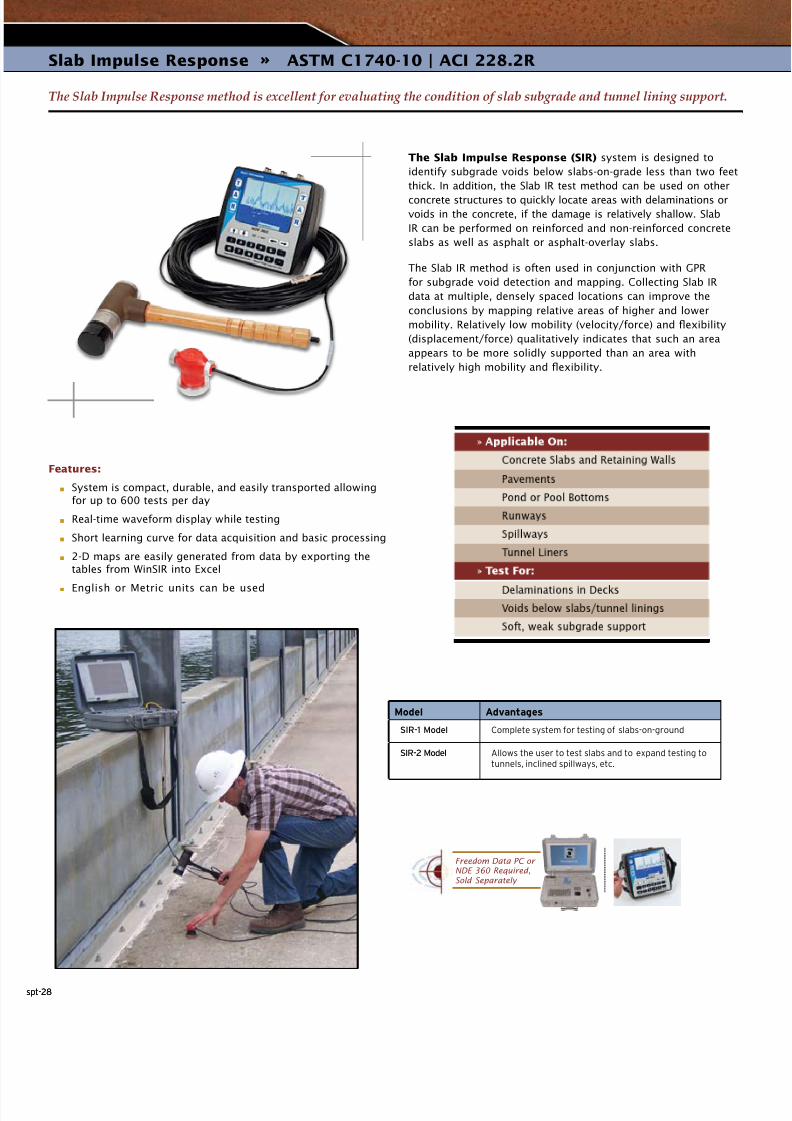
Features:
System is compact, durable, and easily transported allowing■
or up to 600 tests per day
Real-time waveorm display while testing■
Short learning curve or data acquisition and basic processing■
2-D maps are easily generated rom data by exporting the■
tables rom WinSIR into Excel
English or Metric units can be used■
Freedom Data PC or NDE 360 Required,Sold Separately
Mode advnge
SIR-1 Model Complete system for testing of slabs-on-ground
SIR-2 Model Allows the user to test slabs and to expand testing totunnels, inclined spillways, etc.
The Slab Impulse Response (SIR) system is designed to
identiy subgrade voids below slabs-on-grade less than two eet
thick. In addition, the Slab IR test method can be used on other
concrete structures to quickly locate areas with delaminations or
voids in the concrete, i the damage is relatively shallow. Slab
IR can be perormed on reinorced and non-reinorced concrete
slabs as well as asphalt or asphalt-overlay slabs.
The Slab IR method is oten used in conjunction with GPR
or subgrade void detection and mapping. Collecting Slab IR
data at multiple, densely spaced locations can improve the
conclusions by mapping relative areas o higher and lower
mobility. Relatively low mobility (velocity/orce) and exibility
(displacement/orce) qualitatively indicates that such an area
appears to be more solidly supported than an area with
relatively high mobility and exibility.
The Slab Impulse Response method is excellent for evaluating the condition of slab subgrade and tunnel lining support.
Slab Impulse Response » ASTM C1740-10 | ACI 228.2R

7/27/2019 Catalogo Olson Instruments
http://slidepdf.com/reader/full/catalogo-olson-instruments 29/44
structura l | PaVEMENt | tuNNEl systEMs
Slab Impulse Response » ACI 228.2R
Method
Conventional SIR testing requires access to the top o the
slab. The vertical geophone receiver is mounted to the
surace o the slab adjacent to the impact location andgenerally 3-4 inches away. Once the slab top is impacted
with an impulse hammer, the response o the slab is
monitored by the geophone. The hammer input and the
receiver output are recorded by an Olson Instruments
Freedom Data PC or NDE 360 equipped with the Slab
Impulse Response System (SIR-1). In easy access areas,
400-600 Slab IR tests can be perormed in an 8 hour
workday. Once all o the data is collected, it can be
processed with the WinSIR sotware provided, imported into
a spreadsheet program, and then contour mapped.
Data Collection
The user-riendly SIR sotware is written and tested at Olson
Instruments’ corporate oce in Colorado. We do not outsource
any tech support questions and, should you require sotware
support, we welcome your questions and comments.
Available Models
The Slab Impulse Response system is available in two
dierent models which can be run rom Olson’s
Freedom Data PC or NDE 360 Platorms:
1. Slab Impulse Response - 1 (SIR-1)
2. Slab Impulse Response - 2 (SIR-2)
The SIR-1 Model includes a vertical geophone transducer
or at slabs, an instrumented hammer, cables, and theacquisition/processing sotware. This system can be easily
used to test slabs-on-grade and then create 2-D contour maps
by importing the results table into programs like Excel. These
renderings are oten a valuable resource or isolating and
repairing voids below slabs-on-grade.
The SIR-2 Model includes the addition o an omni-
directional velocity transducer to perorm tests on walls
and ceilings o concrete beams and tunnels.
Data Example » 1
Deemine e of void/poo bgde ppo nd wedonee ondiion wih sb Impe repone
Data Example » 2
Subgrade support condition evaluation
parameters:
Mean mobility (in/sec/lbf)■
Shape of the mobility plot at frequencies abov■
the initial straight-line portion of the curve
(between 100 to 800 Hz in this investigation
Initial slope of the mobility plot gives■
the low-strain flexibility (in/lbf) of the
spillway-subgrade system
Interpretation Pitfalls
Slab thickness■
Local reinforcement■
Local joints/seams■
Good subgrade support –
low, smooth mobility.
Poor subgrade support –
high, irregular mobility

7/27/2019 Catalogo Olson Instruments
http://slidepdf.com/reader/full/catalogo-olson-instruments 30/44
structura l | PaVEMENt | tuNNEl systEMs
pt-30
Freedom Data PC or NDE 360 Required,Sold Separately
Features:
Receivers mounted on the SASW-S bar allow or ast and■
accurate ield measurements
Real-time waveorm display while testing■
System is compact, durable, and easily transported allowing■
or multiple tests per day
Measurements accurate to within 5% or the determination o ■
the thickness and stiness o the top layer in a pavement
system or o the concrete liner o a tunnelAcquisition and analysis sotware are compatible and easy to■
use yielding ast and accurate results
Mode advnge
SASW-S Model Rapidly performs SASW tests with receiver spacingsbetween 2.4" and 31.5" (6 and 80 cm). Includes SASW Bar.
SASW-A Model Performs testing with accelerometer receiver spacings up to12 ft (3.6 m). Does not include SASW Bar.
SASW-SA Model Most complete SASW system. Includes SASW Bar and twoaccelerometers for testing with receiver spacings up to12 ft (3.6 m).
Opion advnge
WINSASW Software Allows determination of pavement system proles
The Spectral Analysis of Surface Waves (SASW-S) system is
designed or the ollowing applications:
1. Condition assessment o concrete, including liners in tunnels,
slabs, and other structural concrete members.2. Evaluation o alkali-silica, fre, reeze-thaw and other cracking
damage.
3. Surace-opening crack depth measurement.
4. Determination o abutment depths o bridges.
5. Determination o pavement system profles including thesurace layer, base and subgrade materials with optionalWINSASW sotware.
The SASW method uses the dispersive characteristics o surace
(Rayleigh) waves to determine the variation o the shear wave
velocity (stiness) o layered systems with depth. The SASW
testing is applied rom the surace making it both nondestructive
and non-intrusive. Once the shear wave velocity profles are
determined, shear and Young’s moduli o the materials can be
calculated through the use o simple mathematical equations.
I optional WINSASW sotware is purchased, shear wave velocity
profles can be determined rom experimental dispersion curves
(surace wave velocity versus wavelength) and compared to actual
SASW measurements through a process called orward modeling
or through an inversion process. This allows the user to fnd
the best thickness and stiness model or the layered system o
interest. The SASW method can be perormed on any material
provided there is an accessible surace or receiver attachments.
SASW is also used or geophysical purposes in estimating shear
wave velocity o soils and rock (see the SASW Section in the
Geophysical Engineering Section, page 38) .
Spectral Analysis of Surface Waves (SASW) investigations are typically applied to assess material stiffness and
condition, and layer thickness.
Spectral Analysis of Surface Waves-S » ACI 228.2R

7/27/2019 Catalogo Olson Instruments
http://slidepdf.com/reader/full/catalogo-olson-instruments 31/44
structura l | PaVEMENt | tuNN El systEM
Available Models
The Spectral Analysis o Surace Waves system is
available in three dierent models which can be run
rom Olson’s Freedom Data PC or NDE 360 Platorms:
1. Spectral Analysis o Surace Waves - S (SASW-S)
2. Spectral Analysis o Surace Waves - A (SASW-A)
3. Spectral Analysis o Surace Waves - SA (SASW-SA)
The SASW-S Model is the base model and includes
the SASW receivers mounted to the SASW bar, the
SASW cable, and ball-peen hammers or impacting
the surace. This system is used or testing with receiver
spacings between 2.4" and 31.5" (61 mm and .8 m).
These spacings are appropriate or depth investiga-
tions down to approximately 2.6 t (0.8 m).
The SASW-A Model is comprised o two accelerometers.
This system is appropriate or testing with receiver
spacings up to 12 t (3.6 m).
The SASW-SA Model is the most complete SASW
system as it includes both the SASW bar and a two
accelerometers, which will allow or investigations up
to approximately 12 t (3.6 m).
Method
The SASW method requires an accessible surace or receiver
attachments. The extent o the accessible surace limits the
investigation depth. As a rule o thumb, in order to investi-
gate material properties to a depth D, the line o receivers
on the surace must extend to at least a distance equal to
1.5D, preerably 2D. Once the receivers are mounted to the
surace, acoustic energy is generated by an impactor and
measured on the receivers.
Data Collection
The user-riendly SASW sotware is written and tested at Olson
Instruments’ corporate oce in Colorado. We do not outsource
any tech support questions and, should you require sotware
support, we welcome your questions and comments. It should
be noted the SASW-S data is usually displayed and analyzed
with our WinSW sotware. Additionally, more detailed analysis
and modeling is possible with a program called WINSASW,
available rom the University o Austin Texas.
Spectral Analysis of Surface Waves-S » ACI 228.2R
Data Example » 1
SASW results showing good quality data taken
on good quality concrete
It’s important in the field to lim
the accepted data to those wav
forms that originate at zero vol
with good repeatability. Once th
data is accepted, it is important t
check the coherence and the phas
analysis of the data, which appea
in the lower two plots. Good quali
data on good quality concrete
consists of high coherence and
multiple saw-tooth phase cycles.

7/27/2019 Catalogo Olson Instruments
http://slidepdf.com/reader/full/catalogo-olson-instruments 32/44pt-32
Mode advnge
UPV-1 Model Complete system for testing compression wave velocity and aw detection
SPV-1 Model Test mass concrete up to 20 ft (6 m) in thickness
SPV-2 Model Allows for larger impacts of mass concrete over 20 ft (6 m) in thickness
Opion advnge
Tomo-1 Software Allows the user to perform and display tomographic inversions of UPV/SPVdata which provides 2-D or 3-D velocity images of the tested materials
The Ultrasonic Pulse Velocity (UPV) systems are designed to
identiy and map voids, honeycomb, cracks, delaminations, and
other damage in concrete, wood, masonry, stone, ceramics, andmetal materials. UPV tests are also perormed to predict strength
o early age concrete. The UPV methodology relies on direct
arrival o compressional waves, which are generated by sources
with resonant requencies ranging rom 50 to 150 kHz. The
highest resonant requency sources/receivers are typically used
with thinner structural members or higher resolution and smaller
anomaly identifcation.
The test is perormed by positioning the source and receiver
on either side o the area in question, then the source sends a
compressional wave through the region, and the receiver records
the ull waveorm on the other side. The position o the two
transducers can be varied such that direct, semi-direct, and indirect
tests can be perormed, which aids in mapping out the volume o the deect. Further tests can be perormed i the user wishes to
generate a 3-D rendering o the volume in question. This is done
by testing many dierent “paths” through the medium and then
using a tomographic inversion program to generate a model. For
more inormation about the tomographic inversion sotware, see
the Tomographic Imaging Section , page 14.
Ultrasonic Pulse Velocity (UPV) investigations are performed to assess the condition of structural members such as
elevated slabs, beams, and columns when access to both sides is available. Sonic Pulse Velocity (SPV) is performed
on mass concrete over 10 ft (3 m) in thickness.
structura l | PaVEMENt | tuNNEl systEMs
Features:
~ 50 kHz UPV transducers standard■
Short learning curve or data acquisition and basic processing■
Real-time waveorm display while testing■
System is compact, durable, and easily transported allowing■
or multiple tests per day
2-D maps are easily generated rom data by exporting the■
tables rom WinUPV into Excel
Tomographic velocity images can be generated rom this data■
giving the user a 2-D or 3-D visual tool o the region in question
English or Metric units can be used■
System includes a calibration bar as per ASTM and other standards■
Ultrasonic Pulse Velocity/Sonic Pulse Velocity » ASTM C597-02, E494-95 | BSI 98/105795 | ACI 22
Direct Transmission Semi-Direct Transmission Indirect Transmission
Ultrasonic Pulse Velocity Assess the condition of stru ctura l members wit h 2 s ided access
Freedom Data PC or NDE 360 Required,Sold Separately

7/27/2019 Catalogo Olson Instruments
http://slidepdf.com/reader/full/catalogo-olson-instruments 33/44
structura l | PaVEMENt | tuNN El systEM
Available Models
The Ultrasonic Pulse Velocity/Sonic Pulse Velocity systems
are available in three dierent models which can be run
rom the Freedom Data PC or NDE 360 Platorms:
1. Ultrasonic Pulse Velocity - 1 (UPV-1)2. Sonic Pulse Velocity - 1 (SPV-1)
3. Sonic Pulse Velocity - 2 (SPV-2)
The UPV-1 Model includes a pair o waterproo 50 kHz
transducers, the necessary cables and modules or running
this system, and the acquisition/processing sotware. This
system can be easily used to test a variety o “paths”
through a medium and then create 2-D contour maps by
importing the results table into a spreadsheet program.
The SPV-1 Model includes a 0.2 lb (0.1 Kg) impulse
hammer and accelerometer receiver to test mass concrete
up to 20 t (6 m) in thickness. The SPV data can also be
input into TOMO-1 to provide velocity tomograms.
The SPV-2 Model includes a pair o accelerometer receivers
or larger impacts o mass concrete over 20 t (6 m) in
thickness. The SPV data can also be input into TOMO-1
to provide velocity tomograms.
Purchase the Tomo-1 Option, (tomographic imaging/
visualization sotware) and your data can be inverted,
and 2-D or 3-D models can be created o the volume in
question. These renderings are oten a valuable resource
or isolating and repairing deects.
Method
Conventional UPV testing requires access to two suraces,
preerably two parallel suraces such as the top and bottom
suraces o a slab or the inside and outside suraces o a wall.This test can be perormed, however, using the indirect
method (fgure on previous page) which does not require
access to two suraces. In deect areas, the compressional
wave velocity is slower than in sound areas and signal
amplitude is oten lower. For structural members containing
large, severe voids, signal transmission may be completely
lost. In some deect areas, such as honeycombs, the
compressional wave velocity may be almost the same as in
sound areas, but distortion o the signal (fltering o high
requencies) may be used as an indication o a honeycomb deect.
Data Collection
The user-riendly UPV sotware is written and tested at OlsonInstruments’ corporate oce in Colorado. We do not outsource
any tech support questions and, should you require sotware
support, we welcome your questions and comments. For more
inormation about the inversion program, GEOTOM®, and the
visualization program, Slicer Dicer®, please eel ree to contact
our corporate oce.
Data Example » 1
3 Requirements for Good Quality UPV Signals
A signal generated from the UPV
test method can be considered a
good signal if it meets all three
of the following requirements as
shown:
1) The signal should begin ororiginate at the origin, zeropoint, of the graph.
2) The arrival time of the wave
should be very clear andapparent, regardless if itbreaks up or down.
3) The signal should not be clipped.
ULTRASONIC PULSE VELOCITY AND TOMOGRAPHY IMAGING OF INTERNAL
HONEYCOMB/VOID IN
CONCRETE H IGHWAY
S IGN COLUMN
2-D VELOCITY TOMOGRAMOF COLUMN identifies slowvelocity zones indicative of internal poor quality concretedue to poor consolidation ina horizontal slice and goodconcrete
UPV DATA from 5 N-S and 5 E-Wtests on a 1 ft grid was used on
the tomogram shown. Angledrays and more tests producemore accurate images
Ultrasonic Pulse Velocity/Sonic Pulse Velocity » ASTM C597-02, E494-95 | BSI 98/105795 | ACI 228

7/27/2019 Catalogo Olson Instruments
http://slidepdf.com/reader/full/catalogo-olson-instruments 34/44
structura l | PaVEMENt | tuNNEl systEMs
NDE 360™ » One Platform - Multiple NDE Tests
pt-34pt-34
Multiple Impact Surface Waves »
Features:
Surace pavement layer thickness can typically be determined■
to ~ 0.2 to 0.4 inches (~ 5 to 10 mm) along with Young’smoduli (asphalt moduli is temperature corrected)
Real-time waveorm display and surace layer data processing■
while testing
NDE 360 MISW systems are compact, durable, and easily■
transported allowing or multiple tests per day and ieldanalysis o top layer results
Freedom Data PC MISW system allows or ield analysis o ■
top layer results and more detailed ield processing o data
MISW oers improved accuracy vs. other surace wave■
methods or thickness/Young’s Moduli proiles
SeisNDT-SL Single Layer sotware (by Dr. Nils Ryden) or QA■
o thickness/moduli o pavement (asphalt/concrete), base
(gravel, cement, or lime-treated roadbase materials), andsubgrade layers during new construction
SeisNDT-ML Multiple Layer sotware or orensic thickness/■
moduli determination o pavements and other layered
systems (includes SeisNDT-SL or Single Layer Systems)
Multiple Impact Surface Waves (MISW) systems are designed
to measure asphalt and concrete pavement surace layer (Single
Layer sotware) thicknesses to within ~ 0.2 to 0.4 inches (~ 5
to 10 mm) when calibrated with limited cores. In addition, the
MISW system can be used to measure surace wave velocity
profles vs. depth rom which Young’s (elastic) moduli and
layer thicknesses are determined (Single Layer and Multiple
Layer sotware options). The pavement layer thickness/
moduli profle is used or mechanistic-empirical pavement
design and rehabilitation studies. The MISW system can be
used or Quality Assurance/Quality Control (QA/QC) purposes
or each layer o a pavement system during construction to
provide pavement system layer thickness, typically the surace
pavement layer, and moduli data or pavement, base, and
subgrade layers. In pavement rehabilitation projects, MISW can
be used to measure asphalt/concrete thickness/moduli as well
as the thickness/moduli o the underlying base, and subgradelayers o pavement systems.
The MISW test method utilizes many o the same principles,
equations, and data collection procedures as the SASW method
(see SASW-S section). The dierences between the two methods
are predominantly in the data collection and processing where
the MISW method is based on multichannel data processing
techniques, developed or the Multichannel Analysis o Surace
Waves (MASW) method. All o the data taken during MISW
testing is analyzed together to create a dispersion image or
phase velocity spectrum.
Multiple Impact Surface Wave (MISW) investigations are used in QA or forensic investigation of subgrade, base and
top asphalt /concrete pavement layers as well as for structures and tunnels.
Mode advnge
MISW-SL For thickness/moduli of surface pavement layer (asphalt/concrete)& moduli of base and subgrade materials as they are placed.
Opion advnge
MISW-ML Includes the theoretical modeling package for determination ofthickness/moduli proles of multiple and single layer systems.

7/27/2019 Catalogo Olson Instruments
http://slidepdf.com/reader/full/catalogo-olson-instruments 35/44
structura l | PaVEMENt | tuNNEl systEMs
Multiple Impact Surface Waves »
Method
In typical MISW tests, the generated surace waves are
measured with an accelerometer fxed at zero oset. Thetesting proceeds by generating triggered hammer impacts
out to a predetermined distance at fxed intervals o 2 to 8
inches (50 to 200 mm) and measuring the associated
surace wave responses at the accelerometer. All recorded
signals are then compiled to make an equivalent multi-
channel record that can be transormed to a phase velocity
spectrum similar to the Multichannel Analysis o Surace
Waves (MASW) technique.
Data Collection
The user-riendly MISW SeisNDT sotware was written by
Dr. Nils Ryden. This sotware has been extensively tested
at Olson Instruments’ corporate oce in Colorado and usedor various projects. We do not outsource any tech support
questions and, should you require sotware support, we
welcome your questions and comments.
Available Models
The Multiple Impact Surace Wave system is available in
two dierent models which can be run rom the Freedom
Data PC or NDE 360 Platorms:
1. Multiple Impact Surace Waves – SL-1 (MISW-SL-1)
2. Multiple Impact Surace Waves – ML-1 (MISW-ML-1)
The MISW-SL Model is the base model. This system
includes the equipment and basic sotware required orperorming MISW testing o single (top) layers, but does
not include the modeling sotware or multiple layer systems.
The MISW-ML Model includes the theoretical modeling
sotware or multiple layer investigations o pavements
(inversion), structures and tunnels making it the most
complete MISW system available as it can also be used on
single layer systems or QA o new pavement systems.
The MISW systems share many common attributes with
the Spectral Analysis of Surface Waves-S (SASW-S) ,
system. For more inormation on the above mentioned test
method, please reer to the individual section in this catalog.
Freedom Data PC or NDE 360 Required,Sold Separately
Data Example » 1
Multiple Impact Surface Waves (MISW) approach to Seismic Pavement Testin
The MISW method is shown on the top lef t above with the resulting multiple impact surface wave
data record in the top right. The time domain data is transformed to the frequency phase veloci
domain as shown in the bottom center. At higher frequencies (+12,000 Hz in the bottom center
figure) and shorter wavelengths the symmetric (compressional – S0 is the fundamental mode) an
anti-symmetric (flexural – A0 is the fundamental mode) wave propagation modes combine as the
surface wave velocity in the top layer of a pavement system. At lower frequencies (< 2000 Hz in
the bottom center figure) the multiple wave propagation modes are analyzed together to deter-
mine the thickness/shear wave velocity/Young’s moduli profiles of pavement, base and subgrade
layers with the multiple layer theoretical modeling software to match the experimental frequenc
phase velocity domain data that is shown.
Resulting Multiple Impact Record
Data Acquisition using (1) source and (1) receiver
Data Example » 2
Multiple Impact Surface Waves (MISW) — Asphalt Results
This data (left side of plot) is typical for testing of the surface pavement layer, in this case aspha
By assuming a free plate for the top asphalt (or concrete) pavement layer, one can simply match
S0 and A0 modes (see top right plot) and determine the S1 mode (impact echo thickness resonan
frequency – see blue vertical cursor line in bottom right plot) to get the thickness (h), shear wav
velocity (Vs) and Poisson’s ratio properties for the surface pavement layer (shown in the top right plot

7/27/2019 Catalogo Olson Instruments
http://slidepdf.com/reader/full/catalogo-olson-instruments 36/44
Geophysical systems
NDE 360™ » One Platorm - Multiple NDE Tests
eo-36
Crosshole/Downhole Seismic » ASTM D4428/D4428M-07/D7400-08(DS)
Features:
Real-time waveorm display while testing■
Thin layers, which are oten invisible to surace methods,■
can be detected with CS/DS investigations
Acquisition and processing sotware are easy to use,■
yielding ast and accurate results
CS method is the most accurate method or determining■
material properties o rock and soil sites
Accuracy and resolution or the CS test method are constant■
or all test depths, whereas the accuracy and resolution orthe DS surace method decreases with depth
Sources and receivers can be oriented with inclinometer■
casing dummy probes
P-SV source used in CS tests can impact in the vertical,■
transverse, and radial directions
Correlation between CS and Spectral Analysis o Surace■
Waves (SASW) tests on soil sites showed that the values
rom both tests typically compare within a 10-15% dierence
The Crosshole Seismic (CS) system and method determine shear
and compressional wave velocity versus depth proles. From these
measurements, parameters, such as Poisson’s ratios and moduli,
can be easily determined. In addition, the material damping can be
determined rom CS tests. These dynamic soil and rock propertiesare oten utilized or earthquake design analyses necessary or
certain structures, liqueaction potential studies, site development,
and dynamic machine oundation design. The most complete version
o this downhole system, as manuactured by Olson Instruments,
includes a borehole source capable o generating shear and
compressional waves and a pair o matching three component
triaxial geophone receivers. These instruments are lowered to the
same depth in boreholes set at ~ 10 t (3 m) apart in a line.
The instruments are coupled to the side o the grouted borehole
inclinometer casing, allowing or the detection o shear and
compressional waves as they pass between the receivers.
The Downhole Seismic (DS) investigations are similar to CS
investigations, but require only one borehole to provide shear andcompressional velocity wave proles. The DS method uses a hammer
source at the surace to impact a wood plank and generate shear
and compressional waves. This is typically accomplished by coupling
a plank to the ground near the borehole and then impacting the
plank in the vertical and horizontal directions. The energy rom these
impacts is then received by a single or pair (preerred) o matching
three component geophone receivers, which have been lowered
downhole and are spaced 5 to 10 t (1.5 to 3 m) apart.
Crosshole/Downhole Seismic (CS/DS) investigations provide information on dynamic soil and rock properties.
md advng
CS/DS-1 Model This system includes one triaxial geophone and an accel-
erometer, used for triggering purposes. It allows for directpath measurements associated with each set of impacts.Most cost effective system for testing.
CS/DS-2 Model(shown in photo at left)
This system includes two triaxial geophones and anaccelerometer allowing for dual path measurementsassociated with each set of impacts. Most time effectivesystem for testing.
on advng
P-SV Source This component allows for accurate and rapid triggeringin CS testing by directly impacting the borehole casing.The source is congured for use with the above mentionedsystems.
Tomo-1 Software Allows the user to perform and display tomographicinversions of CS/DS seismic velocity data which provides2-D or 3-D shear or compressional wave velocity images of
soil and rock
CS/DS -2 System
Optional P-SV Source
CS/DS -1 System

7/27/2019 Catalogo Olson Instruments
http://slidepdf.com/reader/full/catalogo-olson-instruments 37/44
Geophysical systems
SV
P
Tria
Geo
Rec
Optional
P-SV Source Receiver 1
Optional
Receiver 2
Dummy
Probes
Dummy
Probe
Triple Port
Manifold
SV
P
All of the CS/DS Models
are compatible with Olson
Instrument’s p-sV sur.
This component provides
the user with the most
accurate and rapid methodof generating impacts.
Crosshole/Downhole Seismic » ASTM D4428/D4428M-07/D7400-08(DS)
Method
The CS investigation requires drilling o two or more (ideally
three) boreholes cased with PVC or slope inclinometer casing
or deeper borings up to 328 t (100 m), and grouted in
accordance with ASTM standards to ensure good
transmission o wave energy. The boreholes are typically 4-6
inches in diameter cased with 2.32 to 3 inch (59 to 76 mm)
I.D. casing, not to exceed 4 inches (102 mm) I.D. The testing
is simplied i inclinometer casing is used rather than normal
PVC pipe. Typical distances between adjacent in-line
boreholes are on the order o 10 t (3 m). The testing is
perormed by lowering both the source and receiver(s) to an
investigation depth, iring the source, and recording the
energy with the receivers.
The DS investigation requires drilling a single borehole
with similar specications as listed above, except that only
a single grouted 2 inch (50 mm) to 3 inch (76 mm) I.D. PVC
casing is needed, not to exceed 4 inches (102 mmm) I.D.The testing is perormed by lowering the receiver(s) to an
investigation depth, impacting the coupled surace plank,
and recording the energy with the receivers.
Data Collection
The user riendly CS/DS sotware is written and tested at Olson
Instruments’ corporate oce in Colorado. We do not outsource
any tech support questions and, should you require sotware
support, we welcome your questions and comments.
Available Models
The Crosshole/Downhole Seismic system is available in
two dierent models with an optional P-SV Source. All
systems require the Olson Instruments Freedom Data PC
platorm or testing:
1. Crosshole/Downhole Seismic - 1 (CS/DS-1)
2. Crosshole/Downhole Seismic - 2 (CS/DS-2)
The CS/DS-1 Model is the base model or Crosshole
or Downhole Seismic testing. This system includes one
triaxial geophone and one accelerometer allowing or
direct path measurements associated with each set o
impacts, either in the borehole i a downhole source is
used (CS) or on the surace i a downhole source is not
used (DS). Specically, this system can be used to test the
material between the impact and the receiver’s location inthe borehole.
The CS/DS-2 Model includes two geophones and an
accelerometer allowing or dual path measurements
associated with each set o impacts, either in the borehole
or on the surace. Specically, this system can be used to
test the material between the impact and the receivers’
location in the borehole(s). This DS-2 system perorms the
Data Example » 1
Screen shot from an Olson Instruments Freedom Data PC showing awaveform recorded during a Crosshole Seismic test.
Freedom Data PC Required,Sold Separately

7/27/2019 Catalogo Olson Instruments
http://slidepdf.com/reader/full/catalogo-olson-instruments 38/44
Geophysical systems
NDE 360™ » One Platorm - Multiple NDE Tests
eo-38
Optional SASW-S Bar and
Extension Arm or:
SASW-S+ G4 or G8 Models
Spectral Analysis o Surace Waves - G » ACI 228.2R
Features:
System design allows or ast and accurate ield measurements■
System is compact, durable, and easily transported, allowing■
or multiple tests per day
Real-time waveorm display while testing■
SASW measurements are accurate to within 5% or the■
determination o the thickness and stiness o the toplayer in a pavement system
Correlation between SASW and Crosshole Seismic (CS) tests■
on soil sites showed that the values rom both tests typically
compare within a 10% dierence
Acquisition and modeling sotware are compatible and easy■
to use, yielding ast and accurate results
The Spectral Analysis o Surace Waves (SASW-G) system is
designed to measure the in-place shear wave velocity prole
o soil and rock without requiring a borehole. In general, the
method uses the dispersive characteristics o surace waves to
determine the variation o the shear wave velocity (stiness)
o layered systems with depth. Once the shear wave velocity
proles are determined, shear and Young’s moduli o the
materials can be estimated through the use o elastic wave
theory equations. The shear wave velocity proles (shear wave
velocity versus depth) are determined rom the experimental
dispersion curves (surace wave velocity versus wavelength)
obtained rom SASW-G measurements through a process called
orward modeling or through an inversion process. The SASW-G
method has been applied to soil sites with measurement depths
exceeding 150 eet. It should be noted that the method requires
an accessible area on the surace with a length equal to or
greater than the measurement depth required. The method can
applied on both bare ground as well as paved suraces. Add the
SASW-S bar or structural and pavement applications.
Spectral Analysis of Surface Waves Geophysical (SASW-G) investigations are typically applied to assess material
properties of soil and rock.
md advng
SASW-G4 Model Four channel SASW-G system with a pair of 1 Hzgeophones and a pair of 4.5 Hz geophones. Mostcost effective system.
SASW-G8 Model Eight channel SASW-G system with four 1 Hz geophones
and four 4.5 Hz geophones. Allows for more rapid testingthan the SASW-G4 Base Model.
SASW-S+G8 Model Most complete SASW system which includes structuraland geophysical options.
Freedom Data PC or NDE 360 Required,Sold Separately
sasW-G8 md:
Freedom Data PC
Platform Only

7/27/2019 Catalogo Olson Instruments
http://slidepdf.com/reader/full/catalogo-olson-instruments 39/44
Geophysical systems
g
Spectral Analysis o Surace Waves - G » ACI 228.2R
Method
The SASW-G method requires an accessible surace or receiver
attachments. The extent o the accessible surace limits the
investigation depth. As a rule o thumb, in order to investigate
material properties to a depth D, the line o receivers on the
surace must extend to a distance equal to 1.5D, preerably 2D.
Once the receivers are mounted to the surace, acoustic energy
is generated by an impactor and measured on the receivers.
Data Collection
The user-riendly SASW sotware is written and tested at Olson
Instruments’ corporate oce in Colorado. We do not outsource
any tech support questions and, should you require sotware
support, we welcome your questions and comments. It should
be noted SASW-G data is usually displayed and analyzed in a
program called WINSASW, available rom the University o
Texas at Austin.
Available Models
The Spectral Analysis o Surace Waves – Geophysical system
(SASW-G) is available in three dierent models:
1. Spectral Analysis o Surace Waves – G4 (SASW-G4)
2. Spectral Analysis o Surace Waves – G8 (SASW-G8)
3. Spectral Analysis o Surace Waves – S+G8 (SASW-S+G8)
The SASW-G4 Model is the base model or Spectral Analysis
o Surace Wave testing, and can be run rom the Freedom
Data PC or NDE 360 platorms. This system includes a pair o
1 Hz geophones, a pair o 4.5 Hz geophones, a our channel
module, and associated connection cables.
The SASW-G8 Model can be run rom the Freedom Data PC
only. The system includes our 1 Hz geophones, our 4.5 Hzgeophones, an eight channel module, and associated connection
cables. This system allows or aster testing than the SASW-G4
model.
The SASW-S + G4/G8 Models can be run rom the
Freedom Data PC only. The system includes all parts listed
or the SASW-G8 system and SASW-S system (see the SASW-S
Section, page 30) . This is the most complete SASW system
available.
Ground Level
source
Freedom DATA
d1 = 2’‘ to 300’
receivers
Subsurface
SASW - Spectral Analysis of Surface WavesDetermination of Pavement and Soil Velocity Profiles
d1d1
d1/2
u p
t o
3 0 0 ’
R1 R2
Data Example » 1
Example SASW-S shear wave velocity profile data for seismic building design

7/27/2019 Catalogo Olson Instruments
http://slidepdf.com/reader/full/catalogo-olson-instruments 40/44
Geophysical systems
NDE 360™ » One Platorm - Multiple NDE Tests
eo-40
Seismic Reraction/Seismic Refection » ASTM D5777-00 /ASTM D7128-05
Features:
System design allows or ast and accurate ield measurements■
System is compact, durable, and easily transported allowing■
or multiple tests per day
System includes a 12-channel geophone (4.5 Hz) string■
with ~ 10 t (~ 3 m) spacings and a 100 t (~ 30 m)
extension cable or lexible testing setups
The National Instruments 16 bit A/D data acquisition card■
with a maximum sampling rate o 64,000 samples/secondor 13 channels allows or user programmable gain rom x1
to x10,000 on the channels which makes the sensitivity
equivalent to a 24 bit seismic system
Data is acquired by triggering o o a single 4.5 Hz trigger■
geophone spiked in the ground by the impact point to record
the source impact (sledgehammer, shotgun or other impact
source not included)
Real-time waveorm display while testing■
Data is exported in SEG2 ormat which allows or analysis■
with both IXRerax® and Relexw® optional sotware
packages, as well 3rd party seismic data analysis programs
The Seismic Reraction & Refection (SRR) system is designed
to allow or either seismic reraction or seismic refection data
acquisition. The SRR system, which is designed or shallow
surveys, can also be used or detecting voids in large civil
structures such as dams (seismic refection).
Seismic Reraction surveys are used or excavation purposes
to map the bedrock depth and evaluate rock rippability. Seismic
reraction measurements are applicable in mapping subsurace
conditions or various uses including geologic, geotechnical,
hydrologic, environmental, mineral exploration, petroleum ex-
ploration, and archaeological investigations. Seismic Reraction
investigations are commonly used to determine layer thick-
ness and/or the subsurace compressional wave velocity o the
overburden and underlying bedrock or to water table, stratigra-
phy, lithology, structure, and ractures. This inherently shallow
technique requires that compressional seismic wave velocities
increase with depth so wave reraction occurs.
Seismic Refection surveys are used to map, detect, and
delineate geologic conditions including the bedrock surace,
conning layers (aquitards), aults, lithologic stratigraphy,
voids, water table, racture systems, and layer geometry (olds).
This methodology requires that the target be suciently deep, so
that the incoming refected wave arrives ater the surace wave
generated rom the impact. Near-surace seismic-refection data
are generally high-resolution (dominant requency above 80 Hz)
and image depths rom around 20 t (6 m) to as much as several
hundred eet (100+ meters).
Seismic Refraction investigations are commonly used to determine bedrock depth & rippability. Seismic Reection
surveys are used to map, detect, & delineate geologic conditions including the bedrock surface, voids, water table
and layer geometry (folds).
md advng
SRR-1 Model Complete system for acquiring both seismic reection andrefraction data
on advng
IXRefrax® Refraction Software
Allows the user to account for topography, perform necessainversions, and create 2-D forward models for refraction suin a quick and easy fashion with state-of-the-art analysis
Reexw® Reection/Refraction Software
Allows the user to create module type processing for 2-Ddata analysis and 3-D interpretation. More complex and
comprehensive processing software.

7/27/2019 Catalogo Olson Instruments
http://slidepdf.com/reader/full/catalogo-olson-instruments 41/44
Geophysical systems
Seismic Reraction/Seismic Refection » ASTM D5777-00 /ASTM D7128-05
Method
In typical Seismic Reraction and Refection tests, the
geophone string is secured to the ground surace along
a survey line using the spikes attached to each individual
geophone and the roaming geophone is placed near
the impact point(s). The testing proceeds by generating
hammer impacts at various locations along and near the
geophone string. All recorded signals are then compiled
and analyzed. The acquisition procedures and processing
techniques are dependent on the type o survey being
conducted and the target o the investigation. Seismic
reraction requires that the seismic velocity increase
with increasing depth (otherwise SASW should be used).
This allows or analysis o the wave reracted along the
boundary o the overburden and underlying bedrock.
Seismic refection surveys require that the target is
suciently deep so that the surace wave rom the impact
does not interere with the refected wave.
Data Collection
The user-riendly SHM acquisition sotware is written and
tested at Olson Instruments’ corporate oce in Colorado. The
two available processing packages, IXRerax® and Refexw®,
were created by ©Interpex and ©Sandmeier Scientic Sotware
respectively. We do not outsource any tech support questions
and, should you require sotware support, we welcome your
questions and comments.
Available Models
The Seismic Reraction/Refection system is available in a
single model, which can be run rom the Freedom Data PC:
1. Seismic Reraction/Refection – 1 (SRR-1)
The SRR-1 Model is the base model or acquiring both
seismic refection and reraction data with a 12 channel
geophone string (4.5 Hz geophones spaced at 10 t or 3m
with 100 t or 30 m extension cable) plus an impact trigger
geophone. Export raw data to SEG-2 les or analysis with
3rd party seismic reraction and/or refection geophysical
sotware.
I the user wishes to utilize either o the compatible process-ing sotware packages mentioned on the previous page in the
bottom right table, they can be incorporated into the SRR-1
model above.
Data Example » 1
Seismic Refraction bedrock profile on highway hillside. Elevation andtopography features are accounted for in the bedrock profile display
Freedom Data PC Required,Sold Separately
Data Example » 2
Seismic Reflection survey results from top of concrete dam spillway overcyclopean masonry/rubble fill. Note the depth to the bottom of the top slab andreflections from apparent deeper voids

7/27/2019 Catalogo Olson Instruments
http://slidepdf.com/reader/full/catalogo-olson-instruments 42/44
Olson Instruments Platforms
❏ Freedom Data PC
❏ Freedom DAS PC
❏ NDE 360
❏ Concrete Thickness Gauges
❏ Resonance Tester (for Lab Use Only)
Available System Add-Ons for Freedom Data PC/NDE 360
❏ *Crosshole/Downhole Seismic [CS/DS]
❏ *Crosshole Sonic Logging [CSL]
❏ Impact Echo [IE]
❏ Impact Echo Scanning [IES]
❏ Multiple Impact Surface Waves [MISW]
❏ Parallel Seismic [PS]
❏ Resonance Testing
❏ *Seismic Refraction/Reection [SRR]
❏ Slab Impulse Response [SIR]
❏ Sonic Echo/Impulse Response [SE/IR]
❏ Spectral Analysis of Surface Waves-G [SASW-G]
❏ Spectral Analysis of Surface Waves-S [SASW-S]
❏ Tomographic Imaging Software [for CSL, UPV and CS/DS]
❏ Ultraseismic [US]
❏ Ultrasonic Pulse Velocity [UPV]
* Not available on the NDE 360 Platform
Questions for Olson:
Notes:
Select Your Equipment Interest(s):
Purchase Worksheet
Contact Olson:
12401 W. 49th Avenue
Wheat Ridge, CO USA 80033-1927
Toll Free: 1.888.423.1214
Ph: 303.423.1212
Fax: 303.423.6071
email: [email protected]
www.OlsonInstruments.com
www.OlsonEngineering.com
Olson Instruments, Inc.

7/27/2019 Catalogo Olson Instruments
http://slidepdf.com/reader/full/catalogo-olson-instruments 43/44
Equipment in use at
various job sites.

7/27/2019 Catalogo Olson Instruments
http://slidepdf.com/reader/full/catalogo-olson-instruments 44/44
12401 W. 49th Avenue
Wheat Ridge, CO USA 80033-1927
Toll Free: 1.888.423.1214
Ph: 303 423 1212
Olson Instruments, Inc .